National Truck Plan: Modernising the Australian Truck Fleet Fremantle, 13 June 2014 1.

III-1
CHAPTER 3
TRUCK FLEET AND OPERATIONS
INTRODUCTION
The Nation's truck fleet characteristics and operations are highly varied as trucking evolves within adynamic environment that includes multi jurisdictional TS&W regulations, safety regulations, freightcharacteristics, shipper and customer needs, economic forces, international trade, and truck and trailermanufacturer innovation. The truck fleet and use are described in the following sections: (1) truckingindustry structure, (2) equipment characteristics, (3) relationship between TS&W policy and truckcharacteristics, and (4) trucking operations (truck flows, commodity case studies, cross-bordertrucking, and container use).
TRUCKING INDUSTRY STRUCTURE
As trucking serves many different markets, it has become highly segmented in order torespond efficiently to these markets. Broadly, the industry may be divided into either private or for-hirecarriers. In the for-hire sector, two types of services are provided: truckload (TL) andless-than-truckload (LTL). Additionally, TL and LTL services can be segmented into either short haulor long haul.
PRIVATE VERSUS FOR-HIRE CARRIERS
Many private businesses have internalized all aspects of their logistics including owning and operatingtheir own truck fleet. Common examples of private carriers include grocery stores, retail chains, andfood processing companies. Information on the operations of private carriers is limited, partiallybecause these carriers traditionally have been less subject to government reporting requirements. TableIII-1 indicates that private carrier operations constitute a large share of trucking in the Nation.

III-2
Table III-1Private Carrier Profile - 1993
TONNAGE AND VALUE OF SHIPMENTS
• Private carriers handled approximately 3.56 billion tons of the total 6.5 billion tons (55 percent) handled by the trucking industry.• The average length of haul for private carriers is 51 miles, resulting in 240 billion ton-miles handled.• The value of freight handled by private carriers was $1.8 trillion, $1.0 trillion lower than the for-hire carriers.
REVENUE
• Private carriers captured approximately 54 percent ($178 billion) of total truck revenue in the Nation.• The $178 billion in revenue was split between intercity and local freight movements, approximately $90/$88 billion, respectively.• Overall, private carriers captured 70 percent of local revenues.
Source: 1993 CFS Database
For-hire carriers transport goods for others as their primary business. This segment of the truckingindustry includes a large and growing number of single vehicle owner-operators. Information on shareof freight handled by the for-hire segment in 1993 is provided in Table III-2.
Table III-2For Hire Carrier Profile - 1993
TONNAGE AND VALUE OF SHIPMENTS
• The for-hire carriers' share of total truck freight movements (6.5 billion tons) was 2.9 billion tons (45 percent).• The average length of haul of for-hire carriers is 470 miles.• The value of shipments for for-hire carriers equaled $2.8 trillion.
REVENUE
• For-hire carriers captured approximately 56 percent of total intercity market revenues.
TL VERSUS LTL OPERATIONS
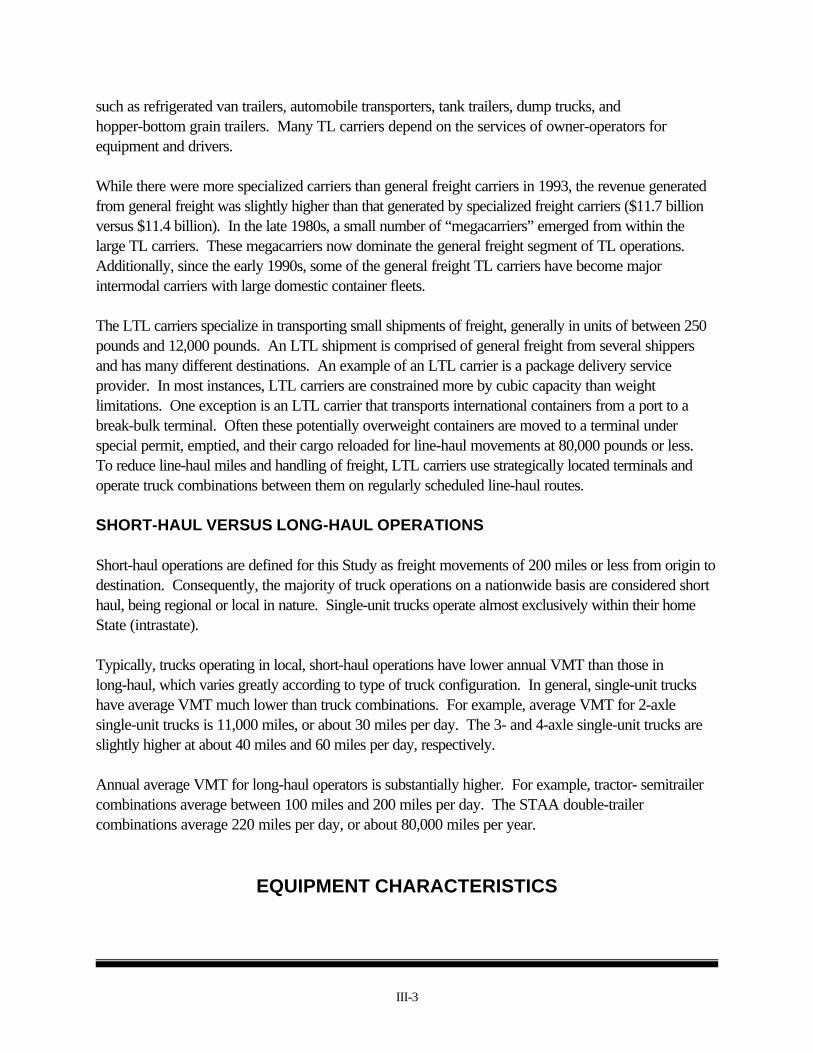
The TL carriers generally pick up a load in a truck or truck combination at the shipper's dockand transport it directly to the consignee in the same vehicle. The TL operations are categorizedaccording to the type of freight handled, either general or specialized. General freight is transported inenclosed van trailers; specialized freight is transported by specialized equipment,
III-3
such as refrigerated van trailers, automobile transporters, tank trailers, dump trucks, andhopper-bottom grain trailers. Many TL carriers depend on the services of owner-operators forequipment and drivers.
While there were more specialized carriers than general freight carriers in 1993, the revenue generatedfrom general freight was slightly higher than that generated by specialized freight carriers ($11.7 billionversus $11.4 billion). In the late 1980s, a small number of “megacarriers” emerged from within thelarge TL carriers. These megacarriers now dominate the general freight segment of TL operations. Additionally, since the early 1990s, some of the general freight TL carriers have become majorintermodal carriers with large domestic container fleets.
The LTL carriers specialize in transporting small shipments of freight, generally in units of between 250pounds and 12,000 pounds. An LTL shipment is comprised of general freight from several shippersand has many different destinations. An example of an LTL carrier is a package delivery serviceprovider. In most instances, LTL carriers are constrained more by cubic capacity than weightlimitations. One exception is an LTL carrier that transports international containers from a port to abreak-bulk terminal. Often these potentially overweight containers are moved to a terminal underspecial permit, emptied, and their cargo reloaded for line-haul movements at 80,000 pounds or less. To reduce line-haul miles and handling of freight, LTL carriers use strategically located terminals andoperate truck combinations between them on regularly scheduled line-haul routes.
SHORT-HAUL VERSUS LONG-HAUL OPERATIONS
Short-haul operations are defined for this Study as freight movements of 200 miles or less from origin todestination. Consequently, the majority of truck operations on a nationwide basis are considered shorthaul, being regional or local in nature. Single-unit trucks operate almost exclusively within their homeState (intrastate).
Typically, trucks operating in local, short-haul operations have lower annual VMT than those inlong-haul, which varies greatly according to type of truck configuration. In general, single-unit truckshave average VMT much lower than truck combinations. For example, average VMT for 2-axlesingle-unit trucks is 11,000 miles, or about 30 miles per day. The 3- and 4-axle single-unit trucks areslightly higher at about 40 miles and 60 miles per day, respectively.
Annual average VMT for long-haul operators is substantially higher. For example, tractor- semitrailercombinations average between 100 miles and 200 miles per day. The STAA double-trailercombinations average 220 miles per day, or about 80,000 miles per year.
EQUIPMENT CHARACTERISTICS

1 1992 TIUS Database.
III-4
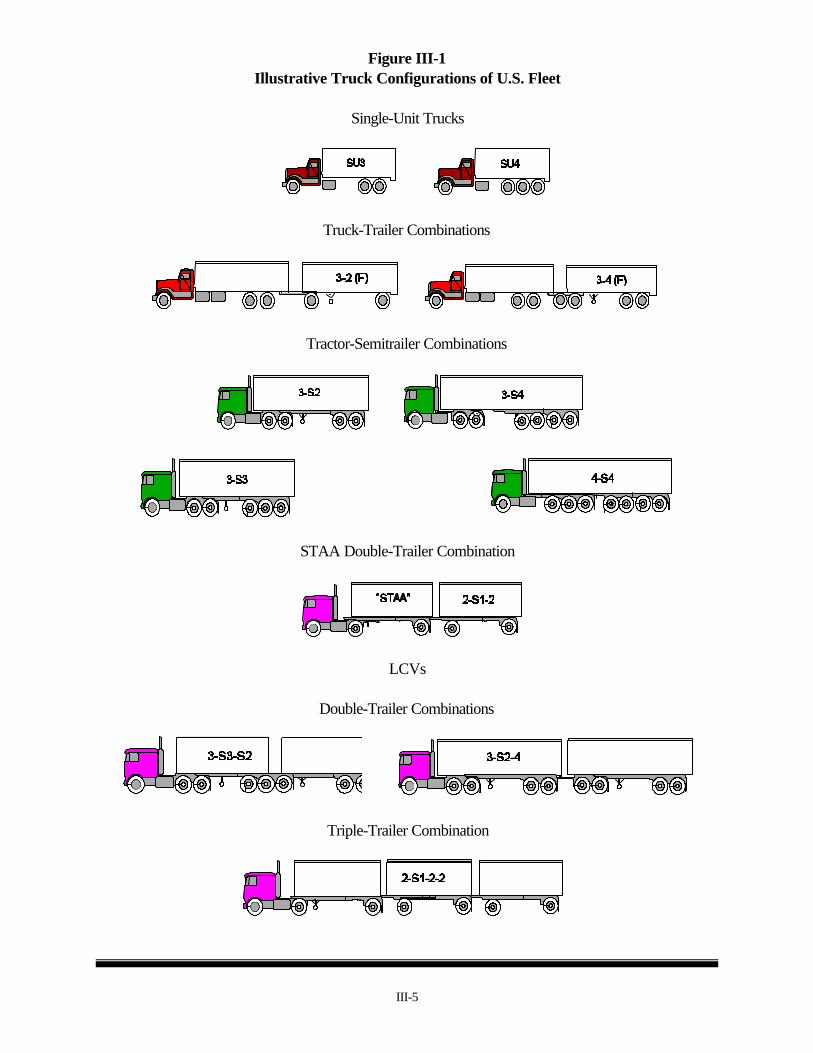
The most general distinction among truck configurations is whether they are single-unit trucks whosecargo-carrying units are mounted on the same chassis as the engine, or whether they are combinationvehicles that have separate cargo-carrying trailers or semitrailers that are pulled by a truck or truck-tractor. Nationally, the distribution of the trucking fleet by configuration is approximately as follows:
Single-unit trucks - 68 percent; Truck-trailer combinations - 4 percent; Tractor-semitrailer combinations (primarily 5-axle combinations) - 26 percent; Double-trailer combinations - 2 percent; and Triple-trailer combinations - less than one-tenth of 1 percent.
The distribution of large truck configurations, combinations with 5 or more axles, varies among Statesand regions. For example, in California 18 percent of the truck fleet are truck-trailer combinations and39 percent are STAA twin-trailer combinations; in Florida, only 2 percent of the truck fleet aretruck-trailer combinations and 1.6 percent are double-trailer combinations.1 Figure III-1 presents thedifferent types of configurations in the national truck fleet.
The U.S. trailer fleet increased significantly following passage of the STAA of 1982. The number oftrucks and truck-tractors increased only marginally (see Figure III-2). In 1994, the total commercialtruck fleet consisted of approximately 1.3 million truck-tractors and 4.1 million trailers, includingsemitrailers. The increase in the number of trailers was commensurate with an increase in the number ofSTAA doubles and LCVs (that is, double- and triple-trailer combinations).
SINGLE-UNIT TRUCKS
The most common single-unit trucks in the commercial fleet with three or more axles are dump trucks,transit mixers, tank trucks, and trash trucks. These vehicles are designed to provide specializedservices and are commonly referred to as specialized hauling vehicles (SHVs). They have from 2- and4-axles. The SHVs represent approximately 46 percent of the single-unit trucks operating in the UnitedStates with 3 or more axles. They are typically used in local and intrastate, short-haul operations. Themost common commodities that they haul are construction materials, gravel, ready-mix cement, grain,milk, petroleum products, and garbage or waste. The total number of commercial single-unit trucks (10,000 pounds or more) remained constant atapproximately 2.75 million between 1982 and 1994. However, the number of 2-axle single-unit trucksdecreased over this period by about 14 percent. During that same period of time, the number of 4-axlesingle-unit trucks more than doubled to approximately 84,000 due to the substitution of 3-axle trash,dump and concrete trucks with 4-axle units.
III-5
Figure III-1Illustrative Truck Configurations of U.S. Fleet
Single-Unit Trucks
Truck-Trailer Combinations
Tractor-Semitrailer Combinations
STAA Double-Trailer Combination
LCVs
Double-Trailer Combinations
Triple-Trailer Combination

III-6
Mill
ions
1982 1994
Figure III-2Fleet Size And Growth: 1982-1994
TRUCK-TRAILER AND TRACTOR-SEMITRAILER COMBINATIONS
Combination vehicles in the national truck fleet consist of a towing unit, either a truck or tractor, andone or more trailers or semitrailers. Truck-trailer combinations account for approximately 14 percentof all combination vehicles.
TRACTOR-SEMITRAILERS
Tractor-semitrailer combinations account for more than 82 percent of all combination trucks on U.S.highways. The number of semitrailer combinations has increased an average of 2.5 percent per yearbetween 1982 and 1994. Increases in long-haul operations following the STAA of 1982, and themarket for sleeper cab tractors, resulted in a shift away from 2-axle tractors, such as the cab-overmodels of the early 1980s, toward longer wheelbase 3- and 4-axle tractors.
MULTITRAILER
The more typical multitrailer combinations operating in the United States are: STAA doubles (twin28-foot trailers), RMDs, turnpike doubles (TPDs), and triples. The LCV are the RMD, TPD, andtriple-trailer combinations. LCVs represent a very small number in relation to the total truckcombination fleet, approximately 20,000 in 1994 or 0.5 percent. Like single-unit trucks and othercombinations, multitrailer combinations are used to haul a variety of commodities, and their trailers arespecialized for the commodities being carried.

III-7
STAA DOUBLES
The STAA of 1982 provided for the unrestricted use of two-trailer combinations (two 28-foot to28.5-foot trailers) on the NN. The NN consists of the Interstate System and routes designated by theFHWA in consultation with the States. Prior to 1982 the operation of double trailers of any length wasprimarily limited to States west of the Mississippi River and turnpikes in a few eastern States.
Since 1982, growth in the use of STAA doubles in relation to the size of the total truck fleet has beenrelatively small nationwide, except for those States in the East where they had been previouslyprohibited. Nationwide, STAA doubles represent approximately 2.5 percent of all truck combinations. Generally, STAA doubles are most important to the LTL industry.
LCVs
Figure III-3 illustrates the common types of LCVs: RMD, TPD, and triples. The RMDs consist of atruck-tractor and one long front trailer, ranging in length from 40 feet to 48 feet, towing a shorter20-foot to 28-foot trailer. The RMD combinations are currently allowed to operate on turnpikes in 6States and on other routes in 17 States. (Some States like Iowa and Missouri limit the access of LCVsto specific terminals within the State).
The TPD combinations consist of a truck-tractor towing two long trailers of equal length, typically two48-foot or 53-foot trailers. The TPD combination is allowed in all but three (Oregon, Washington, andWyoming) of the States in which RMDs are allowed to operate. However, the allowable weights andthe extent of highway networks upon which these vehicles may operate vary among the States.
A triple-trailer combination consists of a tractor and three trailers in tow -- typically three 28-foot to28.5-foot trailers. Triple-trailer combinations are allowed to operate on limited highway networks in 15States under permit with restrictions. Triple-trailer combinations have been operating in Idaho,Nevada, Oregon, and Kansas since the 1960s.
Figure III-3 provides a list of the States where LCVs are allowed to operate, by configuration. Alsoindicated is the first year of operation
RELATIONSHIP BETWEEN SIZE AND WEIGHT POLICY AND TRUCKCHARACTERISTICS
Federal and State TS&W regulations define the weight and dimension envelopes into which loadedtrucks must fit. Other influencing factors are the freight hauled and associated logistical considerations(shipment size, packaging, fragility, temperature control, origin-destination patterns, delivery timerequirements); infrastructure considerations (terminals and route options between origin-destinationpairs); truck economic considerations (replacement cycles, resale

III-8
Figure III-3LCVS
RMD
Turnpike Double
Triple-Trailer
.markets, fuel economy, driver flexibility); truck operating strategies and company structures; specialpermitting policies and practices; regulation enforcement; and intermodal considerations.
Sometimes a truck is operated within only one TS&W regulatory regime; typically however, the regimeis a composite of various limits established by Federal and State regulations. Additionally, for trucksoperating across an international border with Canada or Mexico, Canadian provincial law or Mexicanfederal law applies. A trucker confronted with multiple TS&W regimes must either select a “leastcommon denominator” vehicle and operating strategy, or a strategy that can be modified en route (forexample, removing a trailer, reducing the load, moving an axle or axles).
Interestingly, beginning in the late 1980s an industry trend began to emerge; the mean average loadedweights (tare weights plus payload weights) were decreasing, while the tare weights of trucks increased. Commodities transported, such as electronic equipment and more highly processed goods, arebecoming lighter. Table III-4 provides information on average payload and loaded weights for the fivemajor truck and combination body types operating nationwide in 1994. Note that: (1) on average,none of these combinations uses the maximum weight allowed, and (2) 5-axle tractor-semitrailercombinations with specialized body types (dump, tank, grain) for hauling bulk commodities use about93 percent of the allowed 80,000 pounds GVW.

III-9
Table III-3Permitted LCVs by State and Configuration
StateTriples
Turnpike DoublesRMDs
Alaska Not Permitted 1984 1984
Arizona 1976 1976 1976
Colorado 1983 1983 1983
Idaho 1968 1968 1968
Montana 1987 1972 1968
Nebraska 1984 1984 1984
Nevada 1969 1969 1969
North Dakota 1983 1983 1983
Oklahoma 1987 1986 1986
Oregon 1967 Not Permitted 1982
South Dakota 1988 1984 1981
Utah 1975 1974 1974
Washington Not Permitted Not Permitted 1983
Wyoming Not Permitted Not Permitted 1983
State Turnpike Authority Triples
Turnpike DoublesRMDs
Florida Not Permitted 1968 1968
Indiana 1986 1956 1956
Kansas 1960 1960 1960
Massachusetts Not Permitted 1959 1959
New York Not Permitted 1959 1959
Ohio 1990 1960 1960
Source: U.S. GAO, Longer Combination Trucks (Washington, D.C., 1994).
Table III-4Average Payload and Loaded Weight of Common
Truck Types (Pounds)
Body Type
5-Axle Truck-Trailer
Payload Loaded
5-Axle Tractor-Semitrailer
Payload Loaded
STAA Double
Payload Loaded
Platform/flatbed 30,715 56,900 36,780 65,350 45,330 64,470
Van 34,890 60,340 30,555 61,550 33,935 65,100
Grain Body 48,970 63,340 48,030 74,570 56,380 80,140
Dump Truck 34,760 59,460 42,580 72,160 * *
Tank Body 47,980 72,390 46,410 74,490 * *
* Indicates very small sample size.

III-10
GVW LIMITS
Most trucks and combinations operate at or below the GVW limits, as they do not reach theirweight limit because the available space in the truck becomes filled first, that is, it “cubes out.” Tank trucks and trailers operate at average load levels that reach their maximum weight limitand “weigh-out” over 80 percent of the time; this occurs less than 20 percent of the time forenclosed van trailer combinations. Enclosed van trailers, in many instances, are used totransport commodities that have low density.
The 1975 FBF mandate led to a variety of vehicle configurations and characteristics not initiallyenvisioned. These new configurations are typically directed at increasing the potential payload. Examples of such “bridge formula” trucks are: (1) 4-axle tractors with a lift axle; (2) very long“tongues” on truck-trailer and double-trailer combinations (to increase axle spacing, and therefore,allow a higher gross weight limit); and (3) split tandem axles, now a common feature of 5-axletractor-semitrailers carrying heavy commodities.
AXLE WEIGHT LIMITS
One or both of the Federal axle limits (20,000 pounds for a single axle and 34,000 pounds fortandem axles) are surpassed through the exercise of grandfather rights for Interstate highways in 12States, and permit policies in others. Weight limits for other axle groups are determined throughthe application of the FBF or State regulation in some cases.
Current Federal axle weight limits were established to minimize pavement damage and the FBF, aformula specifying a maximum gross weight given a vehicles wheelbase and the number of axles ithas. The Federal provision also has a maximum GVW of 80,000 pounds. Consequently, variousinnovative arrangements of axles and tires have evolved to increase load capacity within the GVWlimit and not exceed axle limits. Three of these innovative arrangements are super single tires,split tandem axles, and lift axles (within 3- and 4-axle groups -- tridems and quadrems).
The increasing use of wide-base super single tires instead of dual tires in the United States is aninnovation that originated in Europe. Federal law and most State laws do not prohibit the use ofwide-base single tires. Benefits to industry include reduced energy use, tare weights, and truckoperating costs. As with tire pressure and tire loads, there are conflicting views concerning thepublic benefits and costs and whether the use of wide-base tires should be regulated.
AXLE CONFIGURATIONS
Axle configurations frequently observed on single-unit trucks, especially SHVs, include tridemaxles, lift axles, split tandem axles, and quadrem axles. Use of these configurations has evolvedover the last two decades as industry adapted to Federal and State weight policies.

III-11
TRIDEM AXLES
Semitrailer combinations with a tridem axle on the semitrailer are operating in all States, as are single-unit trucks with tridem axles. Tridem-axle semitrailers are used in about 5 percent of the truckcombinations operating nationwide and are most common in the Northeast region. Ontractor-semitrailers, tridem axles offer the advantage of higher gross loads (especially in those Statesnot limited by the 80,000-pound Federal weight limit). This is particularly important for movement ofcommodities such as building materials and heavy machinery on tractor-semitrailer combinations.
LIFT AXLES
Throughout the country, lift axles are routinely used on single-unit trucks, such as dump trucks andcement mixers, as well as on semitrailers operating where GVWs over 80,000 pounds are permitted. Lift axles are used on over 70 percent of all 4-axle, single-unit trucks. In several States, 5-, 6-, and7-axle single-unit trucks with two to four lift axles are used. Federal TS&W laws, as well as mostState laws, do not address the use of lift axles.
Generally, a truck operates with the lift axle down when loaded to increase its weight limit, and up whenempty to improve vehicle maneuverability and handling. On the other hand, lift axles allow the driver toraise the axle of a loaded truck during operation on the highway, which redistributes the loaded weightover fewer axles.
SPLIT TANDEM AXLES
A split tandem axle is created by increasing the spacing between the 2-axles in a tandem axle groupfrom a typical standard of approximately 4 feet to 8 feet, 9 feet, or 10 feet. Split tandem axles are anincreasingly common feature of trucking throughout the United States. Their operational advantagesare: (1) they increase GVW within the allowable limit, and (2) they provide increased flexibility in loaddistribution. By increasing the spacing, the split tandem, rather than being considered a tandem axlewith an axle weight limit of 34,000 pounds, is considered as two single axles with a total allowableweight governed by the FBF. The combined weights allowed on a split tandem axle are 38,000pounds for a spread of more than 8 feet, 39,000 pounds for 9 feet, and 40,000 pounds for 10 feet ormore.
DIMENSIONAL LIMITS
SEMITRAILER LENGTH
Federal law concerning semitrailer length (48 feet) and trailer length for standard STAA doubles (28feet) is a facilitating law, specifying the minimum lengths that States must allow on the NN for largetrucks. As a result, semitrailer lengths throughout the country are largely controlled by State lawsspecifying maximum semitrailer lengths and, sometimes, tractor- semitrailer combination lengths.
III-12
Van trailers are designed to maximize payload within the length limits of the States in which the vehiclewill be operating. For example, van trailers for hauling grain are often designed with drop-bottoms toincrease cubic capacity without exceeding State height limits. On the other hand, flatbed trailers oftendo not need the available length or width. In certain States semitrailer lengths and operating propertiesare also influenced by kingpin requirements. Such laws set a specified distance from the trailer kingpinconnection to a specified axle or the center of the semitrailer axle group.
Semitrailers have undergone major changes in the last 30 years in response to changes in Federal andState regulations, such as the shift from the industry standard 45-foot semitrailers to current use of53-foot semitrailers. The historic trend has been incremental growth in the length of semitrailers, witheach new length taking about 10 years to 12 years to become the new standard. For example, the45-foot semitrailers introduced in 1970 were the industry standard for van trailers until the 1980s, whenthe 48-foot semitrailer became the standard. The new market share for the 53-foot semitrailer in 1994was 30 percent; This semitrailer offers an 18 percent increase in cubic capacity over the 45-footsemitrailer.
The distribution of 53-foot semitrailers by trailer body type is: (1) 30 percent to 40 percent of all typesof van trailers; (2) 15 percent to 20 percent of the flatbed fleet; and (3) less than 10 percent ofspecialized truck body types. Currently, semitrailers longer than 53 feet are permitted to operate in 10States (on most State NN facilities) -- Alabama, Arkansas, Arizona (Interstate only), Colorado,Kansas, Louisiana, New Mexico, Oklahoma, Texas, and Wyoming. The extent of their use isunknown, although it is believed to be relatively small at the present time.
WIDTH
The STAA of 1982 provided for the free movement of 102-inch wide equipment on the NN. Althoughthe law provided for uniformity on Interstate and NN highways, several States have a 96-inch-widthlimit for commercial vehicles on non-NN routes. As a consequence, 96-inch wide equipment remainscommonplace, especially for trucks that meet the maximum weight limits before using the allowed cubicspace.
HEIGHT
Height limits have been established over the years to ensure clearance of vehicles under rail or highwayoverpasses. The clearance standard for bridges constructed over the Interstate System is a minimum of14 feet in urban areas, where space is limited, and 16 feet in rural areas. Some State constructedturnpikes built prior to 1956 do not meet the Federal standard, and the clearances must be posted. Most Western States limit vehicle and load heights to 14 feet; while the Eastern States, except Maine,limit vehicle and load heights to 13.5 feet.

III-13
TRUCKING OPERATIONS
The relative intensity of truck traffic throughout the Nation can be measured by the volume of truckflows on major highways and truck VMT in each State.
TRUCK FLOWS
Truck flows on the NHS are illustrated in Figure III-4. These flows range from fewer than 100 trucksper day on rural corridor highways to over 25,000 trucks per day on Interstate
highways in and around major urban centers. General observations regarding these flows are:
C Truck traffic on the NHS varies widely throughout the country, ranging from an annual average ofone or two trucks per hour in each direction to more than 500 trucks per hour.
C Truck volume on most of the NHS in the Western Region is relatively low. Exceptions includemajor North-South routes in the Interstate Route 5 Coastal Corridor, and major East-Westcorridors associated with Interstate Route 80, Route 40, Route 10, and Route 20.
C Truck volumes east of the Mississippi on much of the NHS range from modest in the New EnglandStates to very high in the mid-Atlantic region.
C Many of the highways in the North-South, mid-continent I-35 Corridor have low to modest truckvolumes. The lowest truck volumes in this corridor are at the northern and southern ends, and inthe middle of the corridor through Kansas. Dominant trucking activity in the corridor includesEast-West trips and travel between most corridor States and the North-Central region of theUnited States.
TRUCK VMT
Total truck VMT in 1994 was approximately 168 billion, which is distributed among the States asshown in Table III-5. California had the highest truck VMT (16.8 billion), equal to 10 percent of the national truck VMT. Regional distribution of total truck VMT isapproximately 25 percent in the North-Central region; 20 percent in each of the South Atlantic, SouthGulf, and Western regions; and 15 percent in the Northeast region.
SINGLE-UNIT TRUCKS
Single-unit trucks account for approximately 42 percent of total truck VMT. The 2- and 3-axle trucksaccount for the majority of the single-unit truck VMT, approximately 85 percent and 12 percent,

III-14
respectively. Although the number of 4 or more axle single-unit trucks has more than doubled since1982, their share of the annual VMT, 3 percent, is an indication that their use is primarily short haul.
SINGLE-TRAILER COMBINATIONS
Tractor-semitrailer combinations are the most common combination operating in the country,accounting for over 25 percent of all registered trucks and 82 percent of all truck combinations. Theyinclude combinations of a 2-, 3-, or 4-axle tractor with a semitrailer having 1 or more axles (up to 8 inMichigan). In 1994, tractor-semitrailers accounted for approximately 53 percent of total truck VMT,or 89.6 billion VMT.
Truck-trailer combinations are the second most common combination in the country, accounting forapproximately 14 percent of the truck combination fleet. Their use increased significantly since 1982,primarily in the North Central region. With 3.1 billion VMT, however, truck-trailer combinationsaccount for less than 2 percent of total truck VMT. Over 50 percent of this VMT is attributed to the5-axle combination.
MULTITRAILER COMBINATIONS
STAA Doubles
The VMT for the STAA double (twin 28-foot) in 1994 was approximately 4.5 billion miles per year, or2.6 percent of all truck VMT. It accounted for 4.5 percent of all truck combinations VMT, and 71percent of all VMT by double-trailers.
LCVs
The LCVs are permitted in 21 States and include RMD, TPD, and triple-trailer combinations (seeTable III-3 for a listing of where these vehicles are permitted to operate). Total VMT for the longerdouble-trailer combinations was 1.8 billion VMT in 1994, or approximately 1 percent of all truck VMTand less than 2 percent of all combination VMT.
The number of triple-trailer combinations is relatively small compared to the total truck combinationfleet. In 1994, total VMT for triple-trailer combinations was 108 million distributed among the 14States in which they operate. On average each triple combination travels approximately 90,000 milesper year. Total triple-trailer VMT was approximately 0.1 percent of the total VMT for allcombinations, with approximately half of the VMT occurring in Oregon and Utah.

III-15
Figure III-4Truck Flows on the NHS

III-16
Table III-5Truck VMT by State: 1994
(Thousands)
State Total VMT Total Truck VMT State Total VMT Total Truck VMT
Alabama 48,955,998 3,618,154 Montana 9,116,001 764,175
Alaska 4,149,989 195,239 Nebraska 15,465,999 1,572,777
Arizona 38,773,999 3,932,615 Nevada 13,019,000 1,224,392
Arkansas 24,947,997 3,015,746 New Hampshire 10,501,000 598,353
California 271,942,998 16,769,280 New Jersey 60,465,998 3,584,790
Colorado 33,704,999 2,484,491 New Mexico 20,479,999 1,758,453
Connecticut 27,138,000 1,195,570 New York 112,970,002 5,235,286
Delaware 7,025,000 396,163 North Carolina 71,928,001 8,874,775
Dist of Col 3,448,000 114,106 North Dakota 6,337,999 583,377
Florida 121,989,000 6,282,027 Ohio 98,199,997 7,208,332
Georgia 82,821,999 5,490,345 Oklahoma 36,979,997 3,151,269
Hawaii 7,934,999 279,371 Oregon 29,453,000 2,116,079
Idaho 11,652,000 907,409 Pennsylvania 92,347,001 8,104,688
Illinois 92,316,001 6,200,093 Rhode Island 7,095,000 326,770
Indiana 62,108,001 5,740,501 South Carolina 37,245,001 2,033,429
Iowa 25,736,997 3,004,366 South Dakota 7,630,998 551,802
Kansas 24,678,000 1,714,820 Tennessee 54,524,001 3,699,589
Kentucky 39,822,001 2,894,242 Texas 178,347,999 14,471,141
Louisiana 37,430,000 4,875,763 Utah 18,078,002 1,376,369
Maine 12,469,001 779,987 Vermont 6,152,000 405,991
Maryland 44,164,999 3,291,562 Virginia 67,608,999 4,988,220
Massachusetts 46,989,999 1,723,840 Washington 47,428,000 3,444,500
Michigan 85,182,998 4,551,583 West Virginia 17,112,001 1,569,653
Minnesota 43,317,002 2,444,670 Wisconsin 50,273,000 3,175,214
Mississippi 28,548,000 2,313,672 Wyoming 6,688,998 827,671
Missouri 57,288,000 4,534,102 TOTAL 23,599,983,970 170,396,812
Source: 1997 U.S. DOT, HCA Study (Washington, D.C., 1997)

III-17
HIGHWAY NETWORKS FOR MULTITRAILER COMBINATIONS
The highway network for operation of STAA doubles and LCVs is limited when taken as apercentage of the total public road mileage in each State. This is in contrast to total public roadmileage of 3,906,544. While STAA doubles are allowed in all States, doubles combinationslonger than 28.5 feet are only allowed in 21 States. Indeed, the ISTEA enforced a freeze limitingthe use of the longer, heavier double- and triple-trailer combinations to those States in whichthey were already operating in 1991. The TS&W limits that included in the 1991 grandfatherprovision are summarized in Table III-6. Of the 21 States allowing longer combination doubles,all but five are west of the Mississippi River. Figures III-5 and III-6 provide maps of the RMDand TPD highway networks.
Table III-6Operation of Vehicles Subject to the ISTEA Freeze
Maximum Size and Weight Limits
State Truck Tractor and Truck Tractor and Other Two Trailing Units Three Trailing Units Length in Feet (‘)/Weight in 1,000 Pounds (K) Alaska . . . . . . . 95' . . . . . . 110' . . . . . . . 83'Arizona . . . . . . . 95' 129K . . . . . 95' 129K . . . . . . 69' - 98'Colorado . . . . . . . 111' 110K . . . . . 115.5' 110K . . . . . . 78'Florida . . . . . . . 106' (1) . . . . . . No . . . . . . . NoIdaho . . . . . . . . 95' 105.5K . . . . . 95' 105.5K . . . . . . 78' - 98'Indiana . . . . . . . 106' 127.4K . . . . . 104.5' 127.4K . . . . . . 58'Iowa . . . . . . . . 100' 129K . . . . . . 100' 129K . . . . . . . 78'Kansas . . . . . . . 109' 120K . . . . . 109' 120K . . . . . . NoMassachusetts . . . . . 104' 127.4K . . . . . No . . . . . . . NoMichigan . . . . . . . 58' 164K . . . . . . No . . . . . . . NoMissouri . . . . . . . 110' 120K . . . . . 109' 120K . . . . . . NoMontana . . . . . . . 93' 137.8K . . . . . 100' 131.06K . . . . . . 88' - 103'Nebraska . . . . . . 95' 95K . . . . . . 95' (1) . . . . . . . 68'Nevada . . . . . . . 95' 129K . . . . . . 95' 129K . . . . . . 98'New Mexico . . . . . 86.4K (2) . . . . . No . . . . . . . NoNew York . . . . . . 102' 143K . . . . . No . . . . . . . NoNorth Dakota . . . . . 103' 105.5K . . . . . 100' 105.5K . . . . . . 103'Ohio . . . . . . . . 102' 127.4K . . . . . 95' 115K . . . . . . NoOklahoma . . . . . . 110' 90K . . . . . . 95' 90K . . . . . . . NoOregon . . . . . . . 68' 105.5K . . . . . 96' 105.5K . . . . . . 70'5"South Dakota . . . . . 100' 129K . . . . . 100' 129K . . . . . . 73' - 78'Utah . . . . . . . . 95' 129K . . . . . . 95' 129K . . . . . . 88' - 105'Washington . . . . . . 68' 105.5K . . . . . No . . . . . . . 68'Wyoming . . . . . . . 81' 117K . . . . . . No . . . . . . . 78' - 85'
(1) No maximum weight is established as this vehicle combination is not considered an “LCV” per the ISTEA definition. Florida’s combinations not allowed to operate on the Interstate System..(2) No maximum cargo-carrying length is established for this combination. Because State law limits each trailing unit to not more than 28.5 feet in length, this combination is allowed to operate on all NN routes under the authority of the STAA of 1982, regardless of actual cargo-carrying length. The maximum weight listed is New Mexico’s maximum allowable gross weight on the Interstate System under the grandfather authority of 23 U.S.C. 127.
Source: FHWA Publication Number FHWA-MC-96-03

III-18
Figure III-5
Highways Available for Turnpike Doubles
Figure III-6 HighwaysAvailablefor RMDS

III-19
A triple-trailer combination consists of a tractor and typically three 28- to 28.5-foot trailers. Triple-trailer combinations are permitted to operate in 13 States under restrictive circumstances and onlimited networks. Figure III-7 provides a map of the highways available for triple-trailer combinations.
Figure III-7Highway Network Available for Triple-Trailers
COMMODITY CASE STUDIES
The use of trucking in the production and distribution of the four commodities: coal (in Kentucky),forest products (in the Northwest), farm products (in the upper-Midwest), and automobiles is discussedin this section.
COAL
Kentucky is a major producer of coal with more than three-quarters of its production used by electricutilities. Until the early 1950s, most coal was retrieved from underground coal mines, and rail was theprincipal mode for moving it. Underground mining and railroading complimented each other because

III-20
large quantities of coal were brought to the surface at relatively few locations, thereby, permittingthe development of large loading facilities and concentrated rail lines.
Strip mining increased in the 1960s with increasing coal prices. Because this type of mining leadsto the production of relatively small quantities of coal in many locations, usually at some distancefrom a rail line, it encouraged the use of trucks to haul coal, and the trucks used have increased insize and weight over the years.
Through the 1960s, 2- and 3-axle dump trucks were the standard means of haul. Some operatorsadded lift axles to facilitate handling larger payloads. Because of the relatively low density ofcoal compared to stone and dirt normally handled in the dump trucks, coal truckers added sideboards of as much as 2 feet in height to their dump boxes to permit handling larger payloads. Thispractice raised the center of mass of loads, leading to increasing problems with vehicle stability. Longer and heavier straight frame trucks continued to dominate the coal haul until into the late1970s. By this time, to help accommodate the heavy loads being handled, many operators wereinflating their tires to pressures as high as 150 to 200 psi -- as much as double the inflationpressures of many trucking operations, and a harmful practice for pavements.
Five-axle tractor-semitrailers were introduced in the late 1970s. This equipment generallyused 20-foot boxes with 12- to 16-inch side boards. By the late 1980s, these units were beingreplaced with 6-axle tractor-semitrailers using a tridem axle semitrailer with 28-foot boxes. These longer trailers allow the loads to be placed over a longer distance with a lower centerof gravity and enhanced stability. Air-lift axles started to be used in the tridem groups, first on thelead axle in the group, and most recently on both the lead and rear axle in the tridem. Tridem-axlesemitrailer units are allowed to operate at GVWs up to 120,000 pounds on selected highwaysdesignated as the "Extended Weight System (EWS)."
Surveys at coal sites throughout Kentucky in 1988 and 1992 demonstrate that: (1) tractor-semitrailers dominate coal haul in the State; (2) 5-axle tractor-semitrailers are being replacedby 6-axle units; (3) the use of both 3- and 4-axle straight trucks is declining. Coal haulers haveindicated that their vehicles have to be replaced about every 7 years. In 1992-1993, Kentuckyissued EWS decals for 3,471 units.
FOREST PRODUCTS
The high concentration of natural forest production in the Pacific Northwest has generated an arrayof forest product industries involved in the harvesting, manufacturing and distribution of woodproducts. The harvested timber is used for: lumber, plywood, poles, shingles, paper, and raw logsfor export. Lumber and plywood production dominate.
The growth and success of these industries has been promoted by an efficient transportationnetwork comprised of truck, rail, and barge transport. However, trucks are the prime mode usedfor transporting timber from the harvest area, due to their flexibility and reliability in accessingremote forest areas. Typical maximum haul lengths are about 100 miles.
Sawmill products, mostly in the form of lumber, from the Pacific Northwest are distributedto all regions of the United States and exported abroad. However, the primary destinations(one-half to two-thirds) for sawmill products in Washington, Idaho and Oregon are in the West. About one-third of Montana products are shipped to the Midwest and another roughly one-third

III-21
to western markets. Ten to 15 percent of Washington/Oregon production is exported, while only asmall proportion of Montana/Idaho production is exported.
There is substantial modal competition for the movement of sawmill products (mostly lumber). Trucking dominates in Washington and Oregon, accounting for nearly 60 percent of sawmillproduct moves. On average, rail handles about one-third of the product in these two States,and water handles about 10 percent. Water movements are typically export-bound. For Idaho, railand truck share equally in the handling of sawmill products. For Montana, rail handles 60 percentand trucks handle 40 percent.
There is also substantial modal competition for moving of plywood. Plywood from the westernregion (west of the Cascade mountains) is handled equally by truck and rail. About two-thirds ofplywood originating in the inland region (principally Eastern Washington and Oregon, NorthernIdaho, and Western Montana) is handled by rail. Less than 1 percent of the plywood is moved bywater, reflecting the small percentage of plywood that is exported.
Log production for export is concentrated in Washington at 73 log export sites and Oregon at 13 sites. Practically all movement of logs destined for export is by truck to either an ocean portfor ship loading, or to the Snake or Columbia Rivers for barge transport to ocean ports. Generally,logs for export from Eastern Washington move down river, whereas the majority of log exportmovements originating west of the Cascades are done by truck.
Markets and movements of sawmill products in the Pacific Northwest involve eithercomparatively short hauls dominated by truck, or comparatively long hauls dominated by rail. Only about 10 to 20 percent of the movements operate over distances which could be considered competitive between truck and rail.
FARM PRODUCTS
Before the 1980s, the Midwest agricultural economy was primarily based on production of rawagricultural goods with some food processing. Transportation needs centered on the efficientmovement of raw agricultural products. Except for short moves from farms to railheads, grain wasprimarily moved by rail to processing facilities across the country and to barge facilitiesfor export. Meat was primarily moved by truck as either live animals to slaughter facilities orhanging carcasses to retailers throughout the country.
In the last 20 years, changes in farm production, transportation, and other technologies havecombined to alter the Midwest agricultural economy from primarily a raw agricultural goodseconomy to include a large processed grain and meat sector. Production of farm productshas increased as farms have become more efficient. At the same time the agricultural andfood industries have diversified; instead of shipping farm products from the Midwest forprocessing, today more of the processing is done in the region close to the source of raw materials. Examples of value-added products that have emerged as a mainstay of the Midwest agriculturaleconomy are: ethanol, cooking oils from both corn and soybeans, animal feeds, cereals, and cornsweeteners, and processed meat products. This has resulted in transportation

III-22
requirements shifting from the movement of raw farm products out of the region to the movement offarm products locally and the movement of processed food and grain milling products to regionalmarkets or to more distant domestic and international markets.
There is a high level of integration of the agribusiness economies of the States in the Midwest. Much of the associated traffic moves within and among the Midwestern States. State boundariesare rather transparent to the agribusinesses. Recent surveys show that 70 percent of Iowa'sagribusiness truck traffic is involved in movements within Iowa and between it and neighboringStates.
Grain
The transportation of raw and bulk grain products is dominated by the need for efficient movementof large amounts of dense corn and soybean products. These movements are primarily served byrail. However, with grain processing moving closer to the location of raw production, some of thelocalized transportation needs of raw grain products are handled by trucks. These truckmovements primarily involve short hauls of grain from farms to railheads, and the trucking of drybulk products such as flour and sugar to food processors not served by rail.
The transportation of processed grain products is served primarily by truck. High-cube, lowweight products like cereals do not require the large quantity, high-weight service capabilityprovided by rail. In addition, these products are most often destined for retailers not easily servedby rail. Other processed grain products such as baked goods have a relatively short shelf-life and may be somewhat fragile, thus requiring the quick, high-level service providedby truck to maintain product quality.
Widespread acceptance of 53-foot long, 102-inch wide semitrailers has allowed shippers of lowdensity boxed breakfast cereal to increase their transportation efficiency (a 25 percent payloadadvantage over the 45-foot, 96-inch semitrailers of the early 1980s). This has encouraged cerealproducers to locate their manufacturing facilities in smaller Midwestern communities close to rawmaterial sources. For example, General Mills, Quaker Oats, Cargill Inc., and Archer DanielsMidland all have major grain milling facilities located in the Cedar Rapids, Iowa area.
The development of sealed pneumatic trailers has provided for greater efficiency in thetransportation of bulk flour and sugar used in other value-added products such as baked goods, andbulk feed ingredients such as soybean meal and corn gluten. The aluminum construction of thesetrailers allows for more cargo capacity due to reduced tare weight of the trailer. These trailershave provided two types of efficiencies: (1) a reduction in manufacturing and manpowerrequirements for the packaging of the commodity because the product is shipped in bulk rather thanbag, and (2) an increase in payload capacity through elimination of packaging materials and the useof lighter materials. Through a combination of lighter materials and using an extended-bridgemounting of rear tandem axles to lengthen the interior bridge dimension, pneumatic trailers carrypayloads of 52,000 pounds (a 13 percent payload advantage over van trailers

III-23
handling packaged goods). Bagged shipments of these processed grain products are generallylimited to 46,000-pound payloads.
Refrigerated trailers have experienced increases in productivity as a result of decreased tareweights. Because of the increased use of aluminum and composite components in trailer bodyconstruction and light, more fuel efficient refrigeration units that utilize smaller fuel tanks, today's48-foot refrigerated trailers commonly have tare weight of 15,000 pounds or less (including therefrigeration unit) versus approximately 17,000 pounds for older trailers. Using these light trailersand properly specified tractors, carriers can routinely handle 46,000-pound payloads (a 2,000-pound increase over the common payloads available in the early 1980s). Fifty-three-foot trailersare not used because the cargo capacity of the vehicle is limited by maximum gross weightrequirements rather than by a lack of volumetric capacity.
Livestock and Processed Meat
The most significant changes in the beef and pork industries over the past two decades are: (1) ashift in pork production from smaller, independent producers to large corporate hog finishingfacilities and contracted hog finishing for meat packers; (2) relocation of meat processing facilitiesto the Midwest to be nearer beef and pork supplies; (3) large increases in meat exports to easternmarkets due to improvements in refrigeration and transportation. These shifts have impacted thegrain market in the Midwest with areas near large hog finishing facilities in the heart of high cornproduction territory actually importing corn to meet the demand for feed. Improvements insanitation, meat processing, and packaging have changed the product being shipped longerdistances from hanging carcasses to meat packaged for retail.
The transportation of livestock and processed meat products is served almost exclusively bytrucks. Transport of livestock cannot be accommodated by the longer service intervals andunsupervised (no driver) nature of rail and intermodal container transportation. Market demandsfor high-quality meats require the fast, high-service available through truck transportation to ensurelivestock arrives for processing in the best condition possible. Similarly, processed meats requirehigh-level service (short delivery intervals and monitoring of refrigerated temperatures) that is notreadily available through rail car service. A very small portion of processed meat freight istransported via intermodal container.
AUTOMOBILE INDUSTRY
Much of the in-bound transportation of auto parts and materials to assembly plants has beenout-sourced to for-hire carriers. Also, there is a growing dependence on third party logisticsproviders, just-in-time delivery systems, and information technology. Other factors includecontainerization, intermodal moves, and international sources. Intermodal is a small but growingindustry-wide trend that may be more pronounced in the auto parts sector of the trucking industrydue to the international character of automobile production.
The sector of the trucking industry that moves the finished product from the assembly plants (an$1.8 billion per year business with approximately 13,000 power units and trailers) is significantly

III-24
different from the sector of the trucking industry involved in inbound transport. The number ofoutbound carriers used by each of the Big Three is small compared to the number of inboundcarriers. Information technology is being deployed slowly by the outbound carriers, and theoutbound carriers typically use trailers that have little use outside of auto hauling. Lastly, it iswidely, but incorrectly, assumed that auto transporters cube out. Cars are getting heavier, and as aresult, auto transporters are weighing out more and more.
CROSS-BORDER TRUCKING
Eleven of the 77 highway border crossings between Canada and the United States are Interstatehighways. Four of the 38 highway crossings between Mexico and the U.S. Southwest are Interstatehighways. Nine are on other NHS routes, and 25 are on other highways. The volume of trucktraffic from Canada into the United States is twice as high as truck traffic from Mexico. In 1995,an average of 14,008 trucks entered the United States every day from Canada compared with 7,943trucks per day from Mexico. Between 1991 and 1995, truck traffic from Canada grew by 9 percentper year and traffic from Mexico grew 11 percent per year.
WEIGHT LIMITS
Weight limits governing trucking operations across the two borders are very different. In crossingto Canada, all but 1 crossing for NHS highways have a GVW limit of more than 99,000 pounds; 9of the 11 Interstate crossings have GVW limits of more than 105,000 pounds. In crossing toMexico, all four Interstate crossings are limited to a GVW of 80,000 pounds, and six of nine othercrossings on the NHS have a GVW of 84,000 pounds (with a permit from Texas).
TRUCK CHARACTERISTICS
The majority of trucking across the Canadian border is conducted with 5-axle tractor-semitrailercombinations, although a few single-unit trucks are used. Commonly used tractor-semitrailercombinations in the cross-border operations on the Canadian border include: (1) 7- and 8-axlecombinations moving containers between British Columbia and Washington; (2) 7- and 8-axleA-train and B-train doubles, RMD, and triple-trailer combinations between the Western provincesand Northern Plains States; and (4) various heavy multiaxle combinations operating underMichigan and Ontario bridge formulas.
Differing TS&W limits between Canada and the United States result in unique situations. Forexample, an 8-axle tractor-semitrailer crossing into British Columbia from Washington converts toa 6-axle by lifting axles on the tractor and semitrailer, which is required; a wide variety ofcombinations have as many as 11-axles for operations between Michigan and Ontario.
A large portion of truck traffic between Mexico and the United States is dominated by the 2- and3-axle single-unit truck and tractor-semitrailer combinations limited to 80,000 pounds. Very fewdouble-trailer combinations are used.
III-25
DOMESTIC AND INTERNATIONAL CONTAINER TRANSPORT
Several new types of containers came into usage in the 1980s including refrigerated, ventilated,bulk cargo, intermediate bulk, and other specialized containers. It is anticipated that the searchfor improved productivity through increasing the size and capacity of containers, containerequipment, and container facilities will effect truck movements. Two-thirds of the container loadshandled in 1992 were international. The 1.2 million domestic loads were transported equally inreloaded marine containers and domestic containers.
Very few ports are capable of directly transferring maritime containers to the rail mode, andthe railroads generally do not have direct access to container destinations. Consequently, ascontainerized freight transportation has grown rapidly in recent years, it has resulted in anincreased number of maritime shipping containers traveling on the highways. These containersmay be loaded at weights that cause trucks to exceed Federal, State, or local vehicle weight limits.
The increasing size and capacity of marine containers may add to problems of overweighttransport on U.S. highways. The impact may differ by State. In California most containermovements are less than 50 miles, but on the East Coast most movements are considerably longer. Thus, East Coast movements are more likely to be impacted by non-uniform State TS&Wregulations, while movements in California are not.
Standard dimensions for international marine containers are: lengths of 20 and 40 feet; width of 8 feet; and heights of 8, 9 and 9.5 feet. Container lengths of 24 and 45 feet are rarely used forinternational transport, 24-foot containers are being phased out, and 45-foot containers are usedonly on limited trade routes. Domestic containers can be 102 inches wide, but internationalmarine containers are limited to a width of 96 inches.
The dimensions of standard dry domestic containers in the United States are lengths of 45 feet, 48feet, and 53 feet, width of 8.5 feet; and height of 9.5 feet. The 28-foot container is also common inthe United States. These dimensions have been developed to take full advantage of theopportunities available from vehicle size regulations.

III-26
United States. These dimensions have been developed to take full advantage of the opportunitiesavailable from vehicle size regulations.