
DAFTAR PUSTAKA 1. Stany CM, Vonny NS, Anindita PS. Status ...

Chapter 3 STATUS OF TIGERS IN THE SUNDARBAN BIOSPHERE RESERVE: SESSION 2015-2016
Authors
Debmalya Roy Chowdhury, Sunit Kumar Das and Ratul Saha
Editorial Team
Anindita Bidisha Chatterjee and Ratul Saha
Citation
Roy Chowdhury, D., Das, S.K. and Saha, R. (2018). Status of Tigers
in the Sundarban Biosphere Reserve: Session 2015-2016. World Wide
Fund for Nature─India, New Delhi.
Cover Photo
Shuvarthi Guha
Maps
Abhijit Choudhury
Edition, January, 2018
© WWF-India, 2018
STATUS OF TIGERS IN THE SUNDARBAN BIOSPHERE RESERVE: SESSION 2015-2016

STATUS OF TIGERS IN SUNDARBAN BIOSPHERE RESERVE: SESSION 2015-2016
ii

CONTENTS
TIGER POPULATION DYNAMICS OF SUNDARBAN BIOSPHERE RESERVE – SESSION: 2012-2016 IV
3.1 ACKNOWLEDGEMENTS
3.2 BACKGROUND 01
3.3 RESULTS FROM EARLIER EXERCISES 03
3.4 METHODS 04 3.4.1 Planning: Analysis of tides 04
3.4.2 Reconnaissance survey 04
3.4.3 Field Sampling 04
3.4.4 Data Analysis 05
3.5 RESULTS 07 3.5.1 Age and Sex of Captured Tigers 08
3.5.2 Tiger Population Estimates ( ) 13
3.5.3 Annual Population Turnover Rate 14
3.5.4 Tiger Density Estimates ( ) 15
3.6 DISCUSSION AND WAY FORWARD 18
REFERENCES 20
ANNEXURE 1 22
ANNEXURE 2 44
ACKNOWLEDGEMENTS This exercise is supported by WWF-Sweden.
We are grateful to PCCF and Chief Wildlife Warden, West Bengal; the Sundarban Biosphere Reserve Director, the Field Director; Sundarban Tiger Reserve and Divisional Forest Officer, 24 Parganas (South) Forest Division for their collaboration and logistical support.
We would like to thank all the rage and beat level staff of Sundarban Tiger Reserve and 24 Parganas (South) Forest Division in carrying out the study successfully.
We would also like to thank the boat crew of MB Sundari; Sridam Gayen, Ishwar Chandra Shaw, Amol Mondal and Nikhil Borkondaj for their excellent services and on-board hospitality.
We are grateful to Dr. Pranav Chanchani and Mr. Rishi Kumar Sharma for reviewing the report at very short notice. Their comments have strengthened this report.
Last but not the least, we are grateful to Mr. Ravi Singh, SG & CEO, WWF-India; Dr. Sejal Worah, Programme Director, WWF-India; and Dr. Dipankar Ghose, Director, Species and Landscapes Programme, WWF-India for their inputs.

STATUS OF TIGERS IN SUNDARBAN BIOSPHERE RESERVE: SESSION 2015-2016
TIGER POPULATION DYNAMICS OF SUNDARBAN BIOSPHERE RESERVE SESSION: 2012-2016
24 Parganas (South) Forest Division: A total sampling effort [Ramganga (20 locations
x 30 days), Raidighi (21 locations x 34 days) and Herobhanga (2 locations x 34 days)] in
2012-2013, photo-captured 21 adult tigers. The next survey in 2014-2015 (73 locations x
41 days), carried out in the entire area photo-captured 17 adult tigers and 4 cubs. A total
of 10 individuals were common between these two years and 7 new adult individuals were
identified. A total sampling effort (50 locations x 40 days) in 2015-2016, photo-captured
24 adult tigers, 2 sub adults and one cub. Among these 24 adult tigers, 18 individuals
were common when compared with 2014-2015 and 6 new adult individuals were identified.
A total of 3 tiger individuals found in 2014-2015 were not photo-captured in 2015-2016.
National Park (East) Range: A total sampling effort (56 locations X 49 days) in 2012-
2013 photo-captured 20 adult tigers. The next survey (60 locations x 39 days) that was
carried out during 2013-2014 photo-captured 18 adult tigers. A total of 13 individuals
were common between these two years and 5 new adult individuals were identified. A total
sampling effort (60 locations x 19 days) during 2015-2016 photo-captured 14 adult tigers.
Among these 14 adult tigers, 7 individuals were common with those photo-captured in
2014-2015 and 2 individuals were common when compared with the findings of 2012-2013.
A total of 5 new adult individuals were identified. A total of 11 tiger individuals found in
2014-2015 were not photo-captured in 2015-2016.
National Park (West) Range: A total of 21 adult individuals along with two cubs
were reported by the Forest Department during 2012-2013. The next survey (60 locations x
38 days) carried out during 2015-2016 photo-captured 19 adult tigers and 3 cubs.
Sajnekhali Wildlife Sanctuary: A total sampling effort (56 locations x 46 days) during
2012-2013 photo-captured 14 adult tigers. Out of these 14 adult individuals, one male was
rescued and is now in Jharkhali rescue centre. The next survey (60 locations x 30 days),
carried out during 2015-2016, photo-captured 9 adult tigers and 2 sub adults. Among
these 9 adult tigers, 5 individuals were common with those found in 2014-2015 and 4 new
adult individuals were identified. A total of 8 tiger individuals, which were found in 2012-
2013, were not photo-captured in 2015-2016.
Basirhat Range: A total sampling effort (56 locations X 31 days) during 2012-2013 photo-
captured 13 adult tigers. The next survey (63 locations x 53 days) was carried out during
2014-2015 and photo-captured 14 adult tigers and 3 cubs. Out of these three cubs, two
were found dead just after the exercise. A total of 7 individuals were common between these
two years and 7 new adult individuals were identified. A total sampling effort (44 locations x
40 days) during 2015-2016 photo-captured 11 adult tigers. Among these 11 adult tigers, 7
individuals were common with those found in 2014-2015 and 4 new adult individuals were
identified. A total of 7 tiger individuals, which were found in 2014-2015, were not photo-
captured in 2015-2016.

1
3.1 BACKGROUND
The Sundarbans, one of the richest ecosystems and the largest tract of estuarine
mangrove forests in the world, supports one of the largest population of wild tigers
worldwide (Jhala et al. 2011, Aziz et al., 2013). The Sundarbans ecosystem is subjected
to tidal fluctuations and consequent variable salinity, resulting in this unique com-
munity structure (Aziz et al., 2013, Roy et al., 2016). This ecosystem provides a both
unique and challenging setting for tiger conservation; because the species’ habitat in the
Sundarbans is spread across innumerable mangrove islands, large portions of which are
subject to inundation under sea water with tidal fluctuations. For effective management
and long-term conservation, it is essential to: understand how tigers and their prey are
distributed in this dynamic ecosystem, model their population trends over time and
assess the influence of ecological and anthropogenic factors on demography and habitat
use.
Robust science-based estimates of population parameters are required to periodically
assess population status and make relevant linkages with management. Over the past
two decades, camera-trap sampling combined with Mark-recapture analyses have
increasingly been used to estimate demographic parameters of wild tigers (Karanth,
1995). In addition, studies continued at the same site(s) over multiple years are very
useful for understanding and managing populations of large carnivores. Such multi-
year studies can yield estimates of rates of change in abundance (O’Connell et al., 2011).
As the marked individuals are tracked through time, biologists can investigate the suite
of factors that drive changes in abundance such as rates of survival, recruitment and
dispersal.
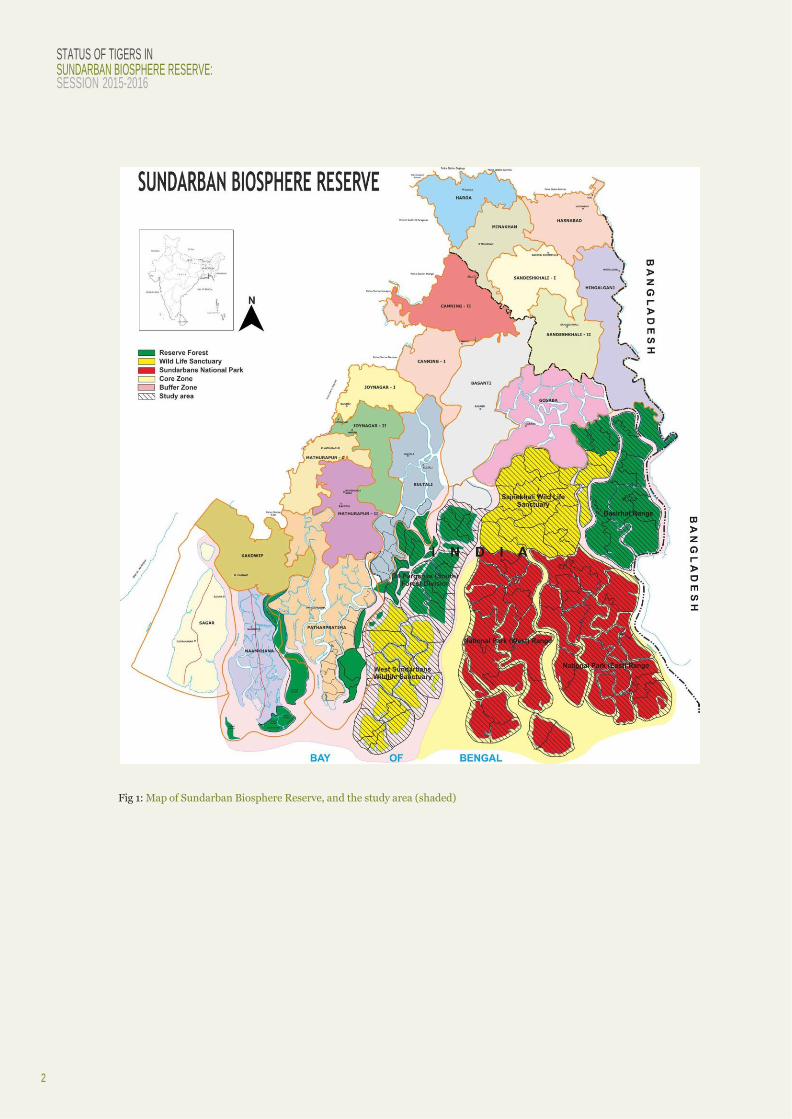
This report uses data collected between 2015 and 2016 to: estimate tiger populations in
the Indian Sundarbans (Fig 1), and describe turnover in the population by comparing
these data with tiger-capture histories from previous years.
2
STATUS OF TIGERS IN SUNDARBAN BIOSPHERE RESERVE: SESSION 2015-2016
Fig 1: Map of Sundarban Biosphere Reserve, and the study area (shaded)
3
3.2 RESULTS FROM EARLIER EXERCISES
During the period January 2012 - April 2013, to estimate tiger numbers, WWF-India
and the Sundarban Biosphere Reserve Directorate collaboratively carried out camera
trapping sampling in the Sundarban Biosphere Reserve to establish a population base-
line for the Sundarbans. In 24 Parganas (South) Forest Division, the exercise was car-
ried out from January 2012 to March 2012. Twenty unique individuals were identified
from this division and range wise density was calculated. Tiger density was estimated
to be 3.8 (±SE1.5)/100 sq. km. and 5.2 (±SE1.7)/100 sq. km. for Raidighi Range. In Na-
tional Park (East) range, the exercise was carried out from November 2012 – January
2013. 21 unique individuals were identified from this range. Tiger density was estimated
to be 3.69(±SE0.82)/100 sq. km. In Sajnekhali Wildlife Sanctuary, the exercise was
carried out from January – March 2013. 13 unique individuals were identified from
this range. Tiger density was estimated to be 2.36 (±SE 0.64)/100 sq. km. In Basirhat
Range, the exercise was carried out from March 2013 to April 2013. Thirteen unique
individuals were identified from this range. Tiger density was estimated to be 2.57 (±SE
0.76)/100 sq. km.
In session 2013-2014, camera traps were installed in Ramganga Range of 24 Parganas
(South) Forest Division and in National Park (East) Range of the Sundarban Tiger
Reserve. The same dataset was used in the All India Tiger Census. Five unique individu-
als were identified from Ramganga Range. The estimated tiger density was 1.57 (±SE
0.74) individuals/100 sq. km for Ramganga Range. Twenty unique individuals were
identified from National Park (East) Range. The estimated tiger density was 3.77 (±SE
1.03) individuals/100 sq. km for National Park (East) Range. Camera traps could only
be deployed in 20 locations in Basirhat Range for a short period of time due to rough
weather conditions. The data from this exercise was not taken into account.
In 2014-2015, camera traps were again placed in Basirhat Range of the Sundarban
Tiger Reserve and in the entire tiger habitat of 24 Parganas (South) Forest Division
comprising three ranges (Ramganga, Raidighi and Herobhanga Range). Seventeen
unique individuals along with four cubs were identified from 24 Parganas (South) For-
est Division. The estimated tiger density was 3.42 (±SE 0.74) individuals/100 sq. km
for 24 Parganas (South) Forest Division. Sixteen unique individuals along with three
cubs were identified from Basirhat Range. The estimated tiger density was 3.33 (±SE
0.09) individuals/100 sq. km for Basirhat Range.
A need was felt among the stakeholders to monitor the tiger population of the entire
tiger habitat in the Indian Sundarbans using camera traps within a season in a single
calendar year. Keeping this in mind, the Sundarban Biosphere Reserve Directorate in
active collaboration with WWF-India decided to monitor the tiger population of the
entire tiger habitat in the Indian Sundarbans using camera traps in a season within a
single calendar year (2015-2016). This endeavour will help to formulate effective tiger
conservation strategies.
4
STATUS OF TIGERS IN SUNDARBAN BIOSPHERE RESERVE: SESSION 2015-2016
3.3 METHODS
The standard method of camera-trap sampling coupled with Capture-Recapture analy-
sis (Karanth et al. 2002, Otis et al. 1978, Pollock et al. 1990) was followed to collect and
analyse data. Methods were customized and standardized for the Sundarban island
system, which is characterized by dense mangrove islands with no trails/roads. The
margins of these islands are also subject to tidal-flooding (Das et al., 2012, Roy et al.,
2016, and Roy Chowdhury et al., 2018).
3.3.1 PLANNING: ANALYSIS OF TIDES
As the Sundarbans ecosystem is subjected to tides twice a day with varying tide levels,
there is a high risk of the camera traps being inundated. The first step was to analyse the
tidal fluctuation from the data available from tide tables (Survey of India, 2016).
A high-resolution image of the study areas was procured and processed for its use in the
reconnaissance survey and thereafter. The study areas were divided into grids of four
sq. km each thus systematically dividing the area. This helped the team plan the recon-
naissance survey better and decide on the sites and minimum distance between camera
trap stations.
3.3.2 RECONNAISSANCE SURVEY
Reconnaissance surveys were carried out in different grids for potential camera trap
locations. Geo-coordinates of the survey and suitable sites were recorded using a
handheld Global Positioning System receiver (Garmin 72 H). These tracks and points
were laid over a gridded high-resolution image in the Geographic Information System
environment using MapInfo 8.5.
Most of the trapping grids were standardized across the years. For the newly sampled
areas and grids with no tiger capture for years, the trapping grids were selected based
on the following criteria: (i) tiger pugmarks, (ii) comparatively high elevation areas un-
likely to get submerged even during high tides, and (iii) exclusion of sample grids with
excessive human disturbance to minimize losses of camera traps and data.
3.3.3 FIELD SAMPLING
Sampling was carried out on 30 occasions (days; from midnight to midnight) commenc-
ing from 4th December, 2015 and ending on 2nd January, 2016 in Sajnekhali Wildlife
Sanctuary; 38 occasions (days) commencing from 8th January, 2016 and ending on
14th February, 2016 in National Park (West) Range; 38 occasions commencing from
19th January, 2016 and ending on 25th February, 2016 in National Park (East) Range;
40 occasions, commencing from 3rd March, 2016 and ending on 11th April, 2016 in
Basirhat Range; and on 40 occasions commencing from 10th March, 2016 and ending
on 18th April, 2016 in 24 Parganas (South) Forest Division. Due to limited resources in
5
terms of camera traps and manpower, the total area was sampled in blocks (ranges).
The analysis was also carried out separately for different ranges, to avoid violating the
assumption of population closure. The different ranges are separated by large river
channels and not frequently crossed by tigers over shorter time spans (Jhala et al., 2011,
Naha et al., 2016).
Cameras with heat-motion sensors were deployed to capture tigers and other fauna.
The distance between adjacent camera trap stations in the grid was ≥1 km. At each sta-
tion, two camera units were deployed between 40 and 50 cm. height from the ground in
such a way that both flanks of the animal were captured. The camera delay was mini-
mised to ensure photo captures of tigresses with cubs in case such an event occurred.
To maximise both tiger captures as well as recaptures, an olfactory lure was applied at
all sites. All the camera trap stations were monitored periodically to check the status of
camera traps, and if required, the height of the camera trap was changed or compara-
tively high elevation sites within the same grid were selected. This was done due to the
presence of a high water mark in the sampling session, which could inundate camera
trap units in the particular site. To ensure recaptures of unique individuals the olfactory
lure was reapplied during periodic checking of camera traps to download data.
Identification of tigers was done visually with the images from camera traps, based on
unique pelage stripe patterns and also with the help of Extract Compare V1.08 software
(Hiby 2009).
3.3.4 DATA ANALYSIS
Data was analysed using closed-population capture-recapture models (Huggins pa-
rameterization). We compared different models to test the effects of behaviour, time,
individual heterogeneity and variation in capture probability owing to lure-application
tiger captures. The lure effect was incorporated while designing the matrix ─ to assess
whether the probability of a tiger being photo-captured diminished as a function of
time, subsequent to lure application. Therefore, the effect of attractants on estimates
of population parameters were also taken into account. (Roy Chowdhury et al., 2018).
Population estimation ( ) was conducted using several parameters and AICc values for
different models were compared (Akaike 1973, Burnham and Anderson 1998). Model
averaging was computed in case of all the blocks as AICc weight for most of the models
lie between 0 and 1. For rare and elusive carnivores, the capture probability seldom
goes beyond 0.3. This estimate, coupled with a longer sampling duration, poses a
problem when coming up with robust estimates of population parameters. Keeping this
in mind, capture probability for every individual at least once (p*) over the sampling
period was calculated from the overall capture probability. p* can be calculated as
p* = 1 – (1-p)n, where p is the overall capture probability and n is the number of sam-
pling occasions (Gerber et al., 2014).
To establish demographically closed population, closure test was performed using the
CloseTest software for each block. The trapping area was calculated based on the inte-
gration region, which is calculated based on a finite space, defined by the placement of
trapping stations and animal movement (Borchers and Efford 2008, Royle and Young
2008).
6
STATUS OF TIGERS IN SUNDARBAN BIOSPHERE RESERVE: SESSION 2015-2016
Density1 estimation for tigers in the study area was performed using minimum bound-
ing polygon, with habitat masking2 by using DENSITY (5.0) and Arc GIS (9.3) software.
Data analysis for each block was carried out using maximum likelihood SECR analysis
using the DENSITY program.
A binomial point process model with a 15-km buffer around the camera trap array were
assumed. Detection models were fitted by maximising the likelihood to estimate the
density and other parameters. Analysis was carried out for different buffer sizes and it
was found that a 15-km buffer for SECR density estimation was likely a large enough
area to capture the movements of tigers whose territories may only partially overlap the
camera trap grids.
To accurately describe the region of integration (state space) over which animal activity
centres are distributed, SECR requires that habitat and non-habitat areas be delineated
using forest boundary GIS files. For these analyses, a habitat mask was created wherein
only forested areas (habitat) were included within the area state space S, while non-
habitat areas, basically the large and wider river channels separating the ranges, were
masked out for this unique landscape. Effective camera trapped areas for each block
was calculated using the same concept. Various alternate parameterizations of detection
parameters (g0 and σ) were included in the model set.
1 To estimate tiger density ( ), we used Spatial Explicit Capture Recapture analyses in a likelihood
framework (ML-SECR), using Density 5.0 (Efford 2004). SECR treats animal home range centres
as being distributed across the study area (defined by a spatial point process). The locations of these
activity centres are unknown, but are estimated by modelling the movement of animals around their
activity centres, assuming that this process can be described as a half-normal detection function
(probability of capture decreases as an animal moves away from the activity centre). The detection
process is described by the parameters g0 and σ, which are estimated (Borchers and Efford 2008).
The spatially-explicit estimates of density ( ) can be interpreted as the intensity of the point process
at each of n potential activity centres which form a grid across habitat areas within the integration
region (trapping grid + buffer area), in which the super population is distributed.
2 As per the radio telemetry data from the Sundarbans (Jhala et al., 2011), tigers rarely cross channels
wider than 1 km in width within a short span of time. Therefore, channels wider than 1 km and forest
fringe villages were masked in a GIS platform and classified as ‘non-habitat’. All mangrove patches
and channels <1km wide were classified as ‘habitat’.
7
3.4 RESULTS
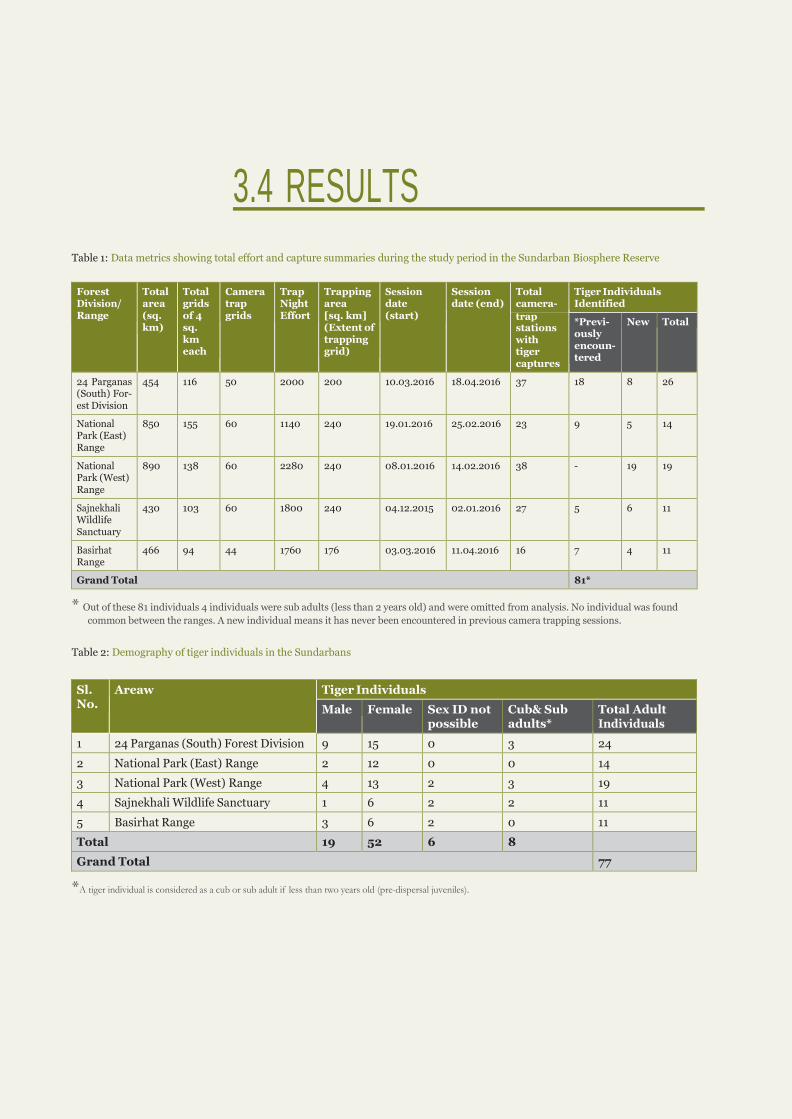
Table 1: Data metrics showing total effort and capture summaries during the study period in the Sundarban Biosphere Reserve
Forest
Division/
Range
Total area
(sq. km)
Total grids
of 4
sq. km
each
Camera
trap
grids
Trap
Night
Effort
Trapping
area [sq. km]
(Extent of
trapping
grid)
Session
date
(start)
Session
date (end) Total camera-
Tiger Individuals Identified
trap stations
with
tiger
captures
*Previ-
ously
encoun-
tered
New Total
24 Parganas
(South) For- est Division
454 116 50 2000 200 10.03.2016 18.04.2016 37 18 8 26
National Park (East)
Range
850 155 60 1140 240 19.01.2016 25.02.2016 23 9 5 14
National Park (West) Range
890 138 60 2280 240 08.01.2016 14.02.2016 38 - 19 19
Sajnekhali Wildlife
Sanctuary
430 103 60 1800 240 04.12.2015 02.01.2016 27 5 6 11
Basirhat Range
466 94 44 1760 176 03.03.2016 11.04.2016 16 7 4 11
Grand Total 81*
* Out of these 81 individuals 4 individuals were sub adults (less than 2 years old) and were omitted from analysis. No individual was found
common between the ranges. A new individual means it has never been encountered in previous camera trapping sessions.
Table 2: Demography of tiger individuals in the Sundarbans
Sl. No.
Areaw Tiger Individuals
Male Female Sex ID not
possible Cub& Sub
adults* Total Adult
Individuals
1 24 Parganas (South) Forest Division 9 15 0 3 24
2 National Park (East) Range 2 12 0 0 14
3 National Park (West) Range 4 13 2 3 19
4 Sajnekhali Wildlife Sanctuary 1 6 2 2 11
5 Basirhat Range 3 6 2 0 11
Total 19 52 6 8
Grand Total 77
*A tiger individual is considered as a cub or sub adult if less than two years old (pre-dispersal juveniles).

8
STATUS OF TIGERS IN SUNDARBAN BIOSPHERE RESERVE: SESSION 2015-2016
Fig 2: Map showing locations (grids) with tiger capture individuals in 24 Parganas (South) Forest Division
3.4.1 AGE AND SEX OF CAPTURED
TIGERS
Most of the sampling blocks (ranges) are
separated by large and wide river channels.
No individual was found common between
the ranges although some crossed from one
range to another over the study period. Cap-
ture of 4 cubs and 4 sub adults (less than two
years old) were not incorporated into density
estimation, following the recommendation
of Karanth and Nichols (2002). Sub adults
and cubs were classified after comparing the
dataset across sessions. Because we did not
have left and right flank pictures for all tigers,
unique individuals were identified using all
available pictures of both flanks and the right
flank, while omitting left flank only pictures.
24 Parganas (South) Forest
Division
A total sampling effort of 2000 trap days
(50 camera trap stations, each operating on
40 occasions) at 24 Parganas (South) For-
est Division yielded 265 photographs (both
flanks combined) of tigers. A total of 37 out
of 50 camera trap stations recorded the
photographs. There were no tiger captures on
22.5% occasions. A total of 27 unique tigers
were identified. Out of these 27 individuals, 3
individuals─ SB110 (Sub Adult Male), SB111
(Sub Adult Male) and SB118 (a cub) were not
used for analysis as all of them were less than
two years old.
The capture history file used for data analysis
had 86 records of tiger captures of 24 tigers.
This included fifteen captures of SB90,
thirteen captures of SB83, seven captures of
SB92, six captures of SB10, four captures of
SB7, SB13, SB18 and SB114, three captures of
SB14, SB91 and SB94, two captures of SB20,
SB93, SB112, SB113, SB115, SB116 and SB117
and single captures of SB3, SB9, SB15, SB96,
SB97 and SB98 (Table 1, Fig 2 and Annexure
1).
9
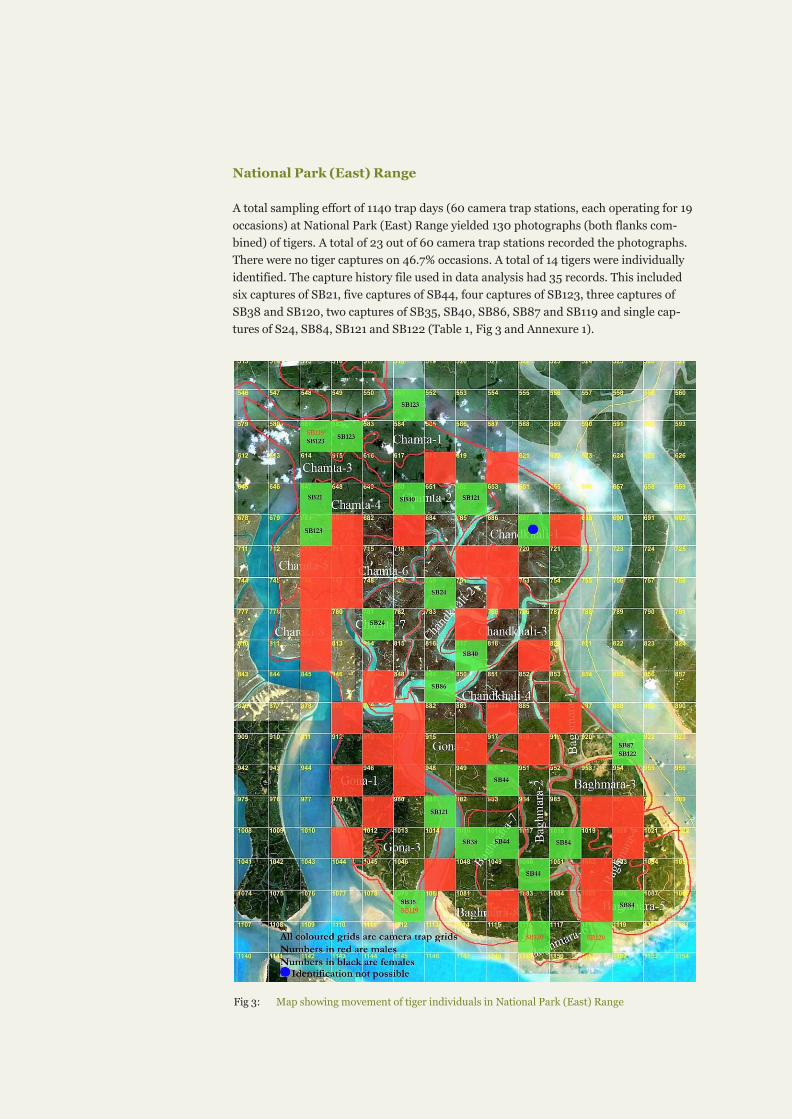
National Park (East) Range
A total sampling effort of 1140 trap days (60 camera trap stations, each operating for 19
occasions) at National Park (East) Range yielded 130 photographs (both flanks com-
bined) of tigers. A total of 23 out of 60 camera trap stations recorded the photographs.
There were no tiger captures on 46.7% occasions. A total of 14 tigers were individually
identified. The capture history file used in data analysis had 35 records. This included
six captures of SB21, five captures of SB44, four captures of SB123, three captures of
SB38 and SB120, two captures of SB35, SB40, SB86, SB87 and SB119 and single cap-
tures of S24, SB84, SB121 and SB122 (Table 1, Fig 3 and Annexure 1).
Fig 3: Map showing movement of tiger individuals in National Park (East) Range

10
STATUS OF TIGERS IN SUNDARBAN BIOSPHERE RESERVE: SESSION 2015-2016
National Park (West) Range
A total sampling effort of 2280 trap days (60 camera trap stations, each operating for
38 occasions) at National Park (West) Range yielded 319 photographs (both flanks)
of tigers. A total of 38 out of 60 camera trap stations recorded the photographs. There
were no tiger captures on 10.5% occasions. A total of 22 tigers were individually identi-
Fig 4: Map showing movement of tiger individuals in National Park (West) Range

11
fied. Out of these 22 individuals, 3 were cubs (SB153, SB154 and SB155) and not used
for analysis as all of them were less than one year old. The capture history file used for
data analysis had 93 captures and recaptures. This included thirteen captures of SB134
and SB140, eleven captures of SB139, eight captures of SB141, seven captures of SB138,
six captures of SB135 and SB142, five captures of SB144 and SB152, four captures of
SB137 and SB 143, three captures of SB 148, two captures of SB 136 and single captures
of SB145, SB146, SB147, SB149, SB 150 and SB151 (Table 1, Fig 4 and Annexure 1).
Sajnekhali Wildlife Sanctuary
A total sampling effort of 1800 trap days (60 camera trap stations, each operating for
30 occasions) at Sajnekhali Wildlife Sanctuary yielded 69 photographs (both flanks)
of tigers. A total of 27 out of 60 camera trap stations recorded the photographs. There
were no tiger captures on 36.7% occasions. A total of 11 tigers were individually identi-
fied. Out of these 11 individuals, 2 individuals ─ SB132 (Sub Adult Female), and SB133
(Sub Adult Female) were not used for analysis as all of them were less than two years
old.
The capture history file used for data analysis had 37 captures and recaptures. This
included ten captures of SB48, seven captures of SB57, six captures of SB124, five
captures of SB64, three captures of SB 129, two captures of SB49 and SB 131, and single
captures of SB50 and SB130 (Table 1, Fig 5 and Annexure 1).
Fig 5: Map showing movement of tiger individuals in Sajnekhali Wildlife Sanctuary

12
STATUS OF TIGERS IN SUNDARBAN BIOSPHERE RESERVE: SESSION 2015-2016
Basirhat Range
A total sampling effort of 1760 trap days (44 traps station for each operation on 40 oc-
casions) at Basirhat Range yielded 75 photographs (both flanks) of tigers. A total of 16
out of 44 camera trap stations recorded the photographs. There were no tiger captures
on 50% occasions. A total of 11 tigers were individually identified. The capture history
file used for data analysis had 31 captures and recaptures. This included six captures of
SB61, four captures of SB124, SB125 and SB126, two captures of SB69, SB72, SB104,
SB105, SB106 and SB 127 and single capture of SB101 (Table 1, Fig 6 and Annexure 1)
Fig 6: Map showing movement of tiger individuals in Basirhat Range

13
3.4.2. TIGER POPULATION ESTIMATES ( )
Because multiple models had comparable support (model weights) we computed
model-averaged estimates of abundance (Burnham and Anderson, 2002). The popula-
tion was estimated to be 25.02 ± 1.22 ( ± SE) individuals (Table 3 and Annexure 1).
The model-averaged estimate for tigers in the National Park (East) Range and National
Park (West) Range were 15.42 ± 1.93 ( ± SE) and 19.26 ± 0.61 ( ± SE) individuals
respectively (Table 3 and Annexure 1). The model-averaged estimate of population size
was 9.15 ± 0.43 ( ± SE) individuals for Sajnekhali Wildlife Sanctuary, and for Basirhat
Range the estimate was 12.09 ± 1.38 ( ± SE) individuals (Table 3 and Annexure 1).
Table of model results and associated AIC scores are reported in Annexure 3.
Table 3: Selected model and tiger population in the study areas.
Note: = Population size; SE= Standard Error; Mt+1= Number of animals captured; LCL= Lower Confidence Limit; UCL= Upper Confidence Limit; p= Capture probability of new individual tiger at each sampling occasion; p*= Capture probability for an individual at least once over the sampling period in the study area.
Model
Mt+1
SE
LCL
UCF p (SE) of
model M o
p*
24 Parganas (South) Forest Division [at 95% Confidence Interval]
Model-averaged
estimates
24
25.03
1.22
22.63
27.42
0.08 (0.01)
0.96
National Park (East) Range [at 95% Confidence Interval]
Model-averaged
estimates
14
15.42
1.93
11.63
19.21
0.1 (0.02)
0.86
National Park (West) Range [at 95% Confidence Interval]
Model-averaged
estimates
19
19.26
0.61
18.06
20.47
0.11 (0.01)
0.99
Sajnekhali Wildlife Sanctuary [at 95% Confidence Interval]
Model-averaged
estimates
9
9.15
0.43
8.30
10
0.13 (0.02)
0.98
Basirhat Range [at 95% Confidence Interval]
Model-averaged
estimates
11
12.09
1.38
9.37
14.8
0.05 (0.01)
0.87

14
STATUS OF TIGERS IN SUNDARBAN BIOSPHERE RESERVE: SESSION 2015-2016
3.4.3. ANNUAL POPULATION TURNOVER RATE
Individual turnover rate of a population is an important indicator of its dynamics over
time. High turnover rate can imply that the population is unstable and local extinc-
tion and colonization might also be in action. Turnover3 is estimated by calculating the
rate of change of individuals in terms of influx (new captures) and outflow (no capture
of previously recorded individuals) with respect to the entire population. Only adult
individuals were considered from the comparable dataset of three years for 24 Parganas
(South) Forest Division and Basirhat Range (Fig. 7a, 7b, and 7c).
Fig 7a: Overall annual turnover rate of tigers over the study period (2013 – 2016)
1.00
0.80
0.60
0.40
0.20
0.00 24 Parganas (South) Forest Division Basirhat Range
Area
Fig 7b: Annual turnover rate of male tigers over the study period (2013 – 2016)
1.00
0.90
0.80
0.70
0.60
0.50
0.40
0.30
0.20
0.10
0.00 24 Parganas (South) Forest Division Basirhat Range
Area
Fig 7c: Annual turnover rate of female tigers over the study period (2013 – 2016)
1.00
0.80
0.60
0.40
0.20
0.00 24 Parganas (South) Forest Division Basirhat Range
Area
3 Turnover rate = (Influx+Outflow)/Total Population (N)
Male Turnover Rate 2014-2015
2015-2016
0.64 0.67 0.60
0.33
Overall Turnover Rate
2014-2015
2015-2016
0.52
0.43 0.39
0.21
Female Turnover Rate
2014-2015
2015-2016
0.67
0.50 0.44
0.21
Tu
rno
ver
Ra
te
Tu
rno
ver
Ra
te
Tu
rno
ver
Ra
te
15
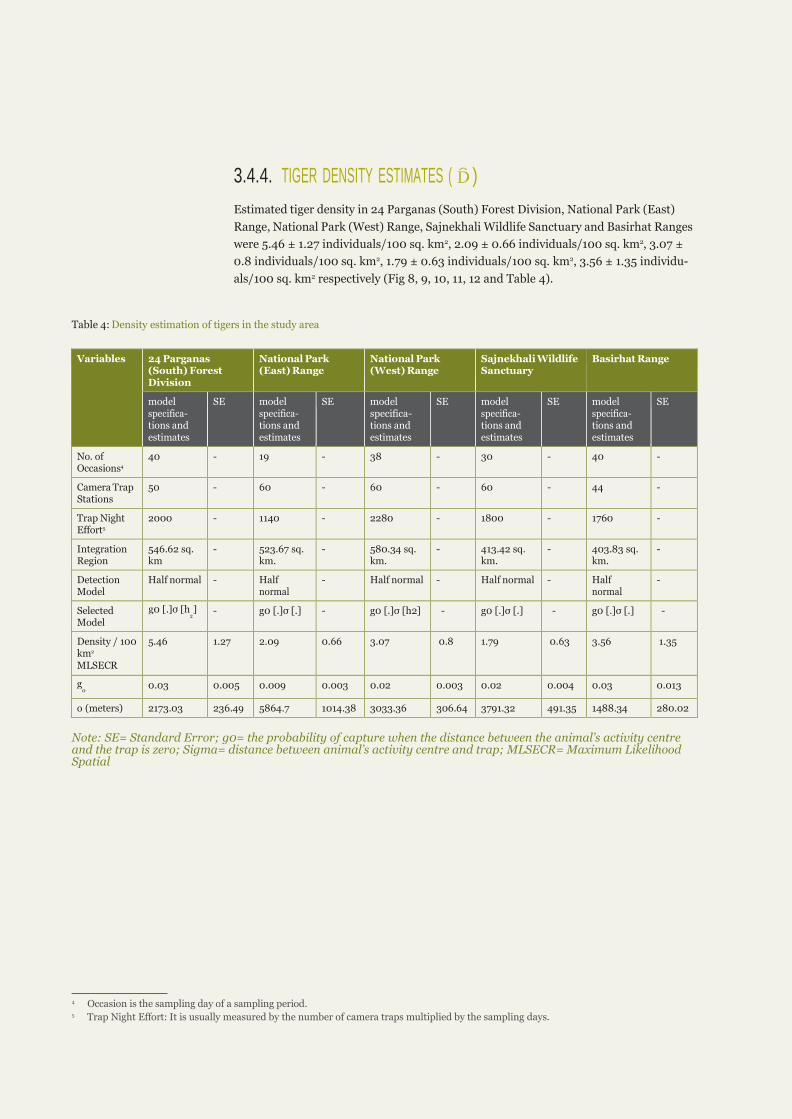
3.4.4. TIGER DENSITY ESTIMATES ( )
Estimated tiger density in 24 Parganas (South) Forest Division, National Park (East)
Range, National Park (West) Range, Sajnekhali Wildlife Sanctuary and Basirhat Ranges
were 5.46 ± 1.27 individuals/100 sq. km2, 2.09 ± 0.66 individuals/100 sq. km2, 3.07 ±
0.8 individuals/100 sq. km2, 1.79 ± 0.63 individuals/100 sq. km2, 3.56 ± 1.35 individu-
als/100 sq. km2 respectively (Fig 8, 9, 10, 11, 12 and Table 4).
Table 4: Density estimation of tigers in the study area
Variables 24 Parganas
(South) Forest
Division
National Park
(East) Range National Park
(West) Range Sajnekhali Wildlife
Sanctuary Basirhat Range
model specifica- tions and
estimates
SE model specifica- tions and
estimates
SE model specifica- tions and
estimates
SE model specifica- tions and
estimates
SE model specifica- tions and
estimates
SE
No. of Occasions4
40 - 19 - 38 - 30 - 40 -
Camera Trap
Stations 50 - 60 - 60 - 60 - 44 -
Trap Night Effort5
2000 - 1140 - 2280 - 1800 - 1760 -
Integration Region
546.62 sq. km
- 523.67 sq. km.
- 580.34 sq. km.
- 413.42 sq. km.
- 403.83 sq. km.
-
Detection
Model Half normal - Half
normal - Half normal - Half normal - Half
normal -
Selected
Model
g0 [.]σ [h ] 2
- g0 [.]σ [.] - g0 [.]σ [h2] - g0 [.]σ [.] - g0 [.]σ [.] -
Density / 100
km2
MLSECR
5.46 1.27 2.09 0.66 3.07 0.8 1.79 0.63 3.56 1.35
g 0
0.03 0.005 0.009 0.003 0.02 0.003 0.02 0.004 0.03 0.013
o (meters) 2173.03 236.49 5864.7 1014.38 3033.36 306.64 3791.32 491.35 1488.34 280.02
Note: SE= Standard Error; g0= the probability of capture when the distance between the animal’s activity centre and the trap is zero; Sigma= distance between animal’s activity centre and trap; MLSECR= Maximum Likelihood Spatial
4 Occasion is the sampling day of a sampling period. 5 Trap Night Effort: It is usually measured by the number of camera traps multiplied by the sampling days.

16
STATUS OF TIGERS IN SUNDARBAN BIOSPHERE RESERVE: SESSION 2015-2016
Fig 8: Map showing camera traps and Minimum
Bounding Polygon at 24 Parganas (South) Forest
Division. Camera trapped area 546.62 sq. km.
Fig 10: Map showing camera traps and Minimum
Bounding Polygon at National Park (West) Range.
Camera trapped area 580.34 sq. km.
Fig 9: Map showing camera traps and Minimum
Bounding Polygon at National Park (East) Range.
Camera trapped area 523.67 sq. km.
Fig 11: Map showing camera traps and Minimum
Bounding Polygon at Sajnekhali Wildlife Sanctuary.
Camera trapped area 413.42 sq. km.

17
Fig 12: Map showing camera traps and Minimum
Bounding Polygon at Basirhat Range. Camera
trapped area 403.83 sq. km.

18
STATUS OF TIGERS IN SUNDARBAN BIOSPHERE RESERVE: SESSION 2015-2016
3.5 DISCUSSION AND WAY FORWARD
Estimation of population size and distribution pattern is an integral component
of monitoring population status, demographic trends and management efficacy.
Systematic monitoring of tiger population in the Indian Sundarbans over a period of
4 years suggests that the population may not be stable as portrayed by the capture
history of individuals. The overall female:male ratio in the study area for the current
study (2.73:1) is strongly female biased, as has been reported in some other areas
(e.g. Chitwan). The capture pattern indicates that spatial overlap is minimal among
the males whereas between females as well as males and females it is comparatively
higher, which is consistent with the territorial behaviour of tigers. Density estimates
have remained relatively stable over the years. It is worth noting that in spite of being
reserve forests (with greater human use), both 24 Parganas (South) Forest Division and
Basirhat Range support a higher density of tigers than the adjacent National Park.
A large section of the 24 Parganas (South) Forest Division (556 sq. km.) has been
declared as the West Sundarbans Wildlife Sanctuary, based on the findings of the
camera trap study conducted in 2012. It also has led to the necessity of evaluating
the current management practices for effective tiger conservation. This is where
Conservation Assured | Tiger Standards (CA|TS) comes in. CA|TS is a set of criteria
which allows tiger sites to check if their management will lead to successful tiger
conservation. CA|TS is organised under seven pillars and 17 elements of critical
management activity. WWF-India facilitated the process of implementing CA|TS which
will strengthen effective tiger conservation in the long run in the area.
Areas like 24 Parganas (South) Forest Division appear to have immense potential to
harbour a healthy tiger population as the area has comparatively higher density of
tigers in spite of being a reserve forest. A wide array of factors is likely to contribute to
this. For example, change in weather, lunar-tidal cycle, coverage of vegetation, plant
type, water availability, human presence and prey-base activity impact the activity
of the tiger in this unique landscape as discussed in previously published literature
(Roy Chowdhury et al., 2018). Dataset from consecutive years shows that a significant
number of new individuals are being added to the population along with no capture
of some previously captured individuals for both 24 Parganas (South) Forest Division
and Basirhat Range. These kinds of observations warrant attention in the present
conservation scenario to identify factors like anthropogenic impacts, dispersal of
individuals and natural deaths.
1. It would be more useful if the all the ranges in the entire SBR are sampled
simultaneously with more sampling effort, by increasing the number of camera
trap locations and days for a robust estimate. The surveys should also be
coordinated to be done simultaneously with the Bangladesh portion of the
Sundarbans to arrive at a robust estimate of the tiger population in the entire
Sundarbans system. The Bangladesh Sundarbans is larger in expanse than the
19
Sundarbans of India, and co-ordinated monitoring will provide important insights
about tiger space use and movement across management and administrative
boundaries.
2. Dynamics of this isolated population needs to be examined by estimating survival
rate, growth rate, and recruitment; using an open population framework6 as the
population exhibits higher turnover rate. This parameter will provide a broad idea
about what might be happening to the population.
3. Density and distribution of large carnivores like tigers are principally governed
by the availability and density of prey species. Prey density, in turn, is influenced
by the vegetation structure and the overall ecosystem health. However, in the
Sundarbans, very few studies have used robust methods to monitor prey base
populations (Roy et al., 2016). A novel initiative by WWF-India which can
withstand scientific scrutiny in the Sundarbans aims to look at the micro faunal
assemblage and to establish a baseline for it. Temporal replicates of vegetation
quantification along with soil and water sampling also needs to be carried out to
properly understand the prey habitat associations, since prey distribution governs
predator distribution extensively. Such intensive studies need to be implemented
which will ultimately provide an insight into the health of the ecosystem and in
turn adopt holistic management strategies.
4. Conflict situations both inside and outside forest areas have changed over the years
and so are the offenders who are adopting new technologies to avoid enforcement.
Due to this, the frontline staff such as rangers, forest guards, and beat guards who
are responsible for the day-to-day conservation and management in the field,
need to be trained and empowered in the latest technologies mainly for areas like
24 Parganas (South) Forest Division. Applications like GPS-based patrolling will
ultimately aid in enhanced and effective protection for wildlife.
5. As discussed in an earlier tiger report (Roy Chowdhury et al., 2018), access
to biological resources plays an important role in supporting the livelihood of
fishermen in the Indian Sundarbans. Forest Offence records show that fishing-
related offences are increasing year by year. If GPS-based applications (like Vessel
Monitoring Surveillance) which track and monitor boats anytime and anywhere
are adopted then it would help the Forest Department in enhanced management.
Without these, wildlife management and conservation will suffer a setback.
6 Open population framework – In contrast to closed population, open population framework
takes into account the immigration and emigration, deaths and recruitment of individuals of a
population. This is ideal to estimate population parameters in case of dataset from multiple seasons.

20
STATUS OF TIGERS IN SUNDARBAN BIOSPHERE RESERVE: SESSION 2015-2016
REFERENCES
Akaike, H., 1973. Information theory and an extension of the maximum likelihood
principle. In 2nd International Symposium on Information Theory (pp. 267-
281). Akademiai Kiado.
Aziz, A., Barlow, A.C., Greenwood, C.C. and Islam, A., 2013. Prioritizing threats to
improve conservation strategy for the tiger Panthera tigris in the Sundarbans
Reserve Forest of Bangladesh. Oryx, 47(4): 510-518.
Borchers, D. L., & Efford, M. G. 2008. Spatially explicit maximum likelihood methods
for capture–recapture studies. Biometrics, 64(2): 377-385.
Burnham, K.P. and Anderson, D. R. 1998. Model selection and inference: a practical
information theoretic approach. Springer, New York.
Burnham, K.P. and Anderson, D.R. 2002. Model Selection and Inference: A Practical
Information-Theoretic Approach. 2nd Edition, Springer-Verlag, New York.
Das, S.K., Sarkar, P.K., Saha, R., Vyas, P., Danda, A.A., and Vattakavan, J. 2012.
Status of Tigers in Sundarban Biosphere Reserve, 24-Parganas (South) Forest
Division, West Bengal, India. World Wide Fund for Nature – India, New Delhi.
Efford, M. 2004. Density estimation in live-trapping studies. Oikos, 106: 598–610.
Gerber, B.D., Ivan, J.S., and Burnham, K.P. 2014. Estimating the abundance of rare and
elusive carnivores from photographic-sampling data when the population size is
very small. Population Ecology, 56:463-470
Hiby, L., Lovell, P., Patil, N., Kumar, N. S., Gopalaswamy, A. M., and Karanth, K. U.
2009. A tiger cannot change its stripes: using a three-dimensional model to
match images of living tigers and tiger skins. Biology Letters, 5(3): 383-386.
Jhala, Y. V., Qureshi, Q., Gopal, R. and Sinha, P. R. (eds.) 2011. Status of the Tigers,
Co-predators, and Prey in India, 2010. National Tiger Conservation Authority,
Govt. of India, New Delhi, and Wildlife Institute of India, Dehradun. TR
2011/003 pp-302.
Karanth, K.U. 1995. Estimating tiger Panthera tigris populations from camera-trap data
using capture-recapture models. Biological conservation, 71(3): 333-338
Karanth, K. U., N. S. Kumar, and J. D. Nichols. 2002. Field surveys: estimating
absolute densities of tigers using capture–recapture sampling. Pages 139–152
in K. U. Karanth and J. D. Nichols, editors. Monitoring tigers and their prey:
a manual for researchers, managers and conservationists in tropical Asia.
Centre for Wildlife Studies, Bangalore, India.
Karanth, K.U. and Nichols, J.D. eds. 2002. Monitoring Tigers and their prey: A
manual for Researchers, Managers and Conservationists in Tropical Asia.
Centre for Wildlife Studies, Bangalore, India.
21
Naha, D., Jhala, Y.V., Qureshi, Q., Roy, M., Sankar. K. and Gopal, R. 2016. Ranging,
Activity and Habitat Use by Tigers in the Mangrove Forests of the Sundarban.
PLoS ONE 11(4): e0152119
O’Connell, A. F., Nichols, J. D., & Karanth, K. U. (eds.). 2011. Camera traps in animal
ecology: methods and analyses. Springer Science & Business Media.
Otis, D. L., Burnham, K. P., White, G. C. & Anderson, D. R. 1978. Statistical inference
from capture data on closed animal populations, Wildlife Monograph, 62: 1-135.
Pollock, K. H., Nichols, J. D., Brownie, C., & Hines, J. E. 1990. Statistical inference for
capture-recapture experiments. Wildlife monographs, 3-97.
Roy, M., Qureshi, Q., Naha, D., Sankar, K., Gopal, R., & Jhala, Y. V. 2016. Demystifying
the Sundarban tiger: novel application of conventional population estimation
methods in a unique ecosystem. Population Ecology, 58(1): 81-89.
Roy Chowdhury, D., Das, S.K., Sarkar, P.K. and Saha, R. 2018. Status of Tigers in
Sundarban Biosphere Reserve (2012-2013): National Park (East), Sajnekhali
Wildlife Sanctuary, Basirhat Range, India. World Wide Fund for Nature-India,
New Delhi.
Royle, J. A., & Young, K. V. 2008. A hierarchical model for spatial capture–recapture
data. Ecology 89: 2281–2289.
Survey of India. 2016. Hugli River Tide Tables for Sagar, Gangra, Haldia, Daimond
Harbour, Mayapur and Garden Reach. Geodetic and Research Branch of
Survey of India, Dehradun. 175 p.

22
STATUS OF TIGERS IN SUNDARBAN BIOSPHERE RESERVE: SESSION 2015-2016
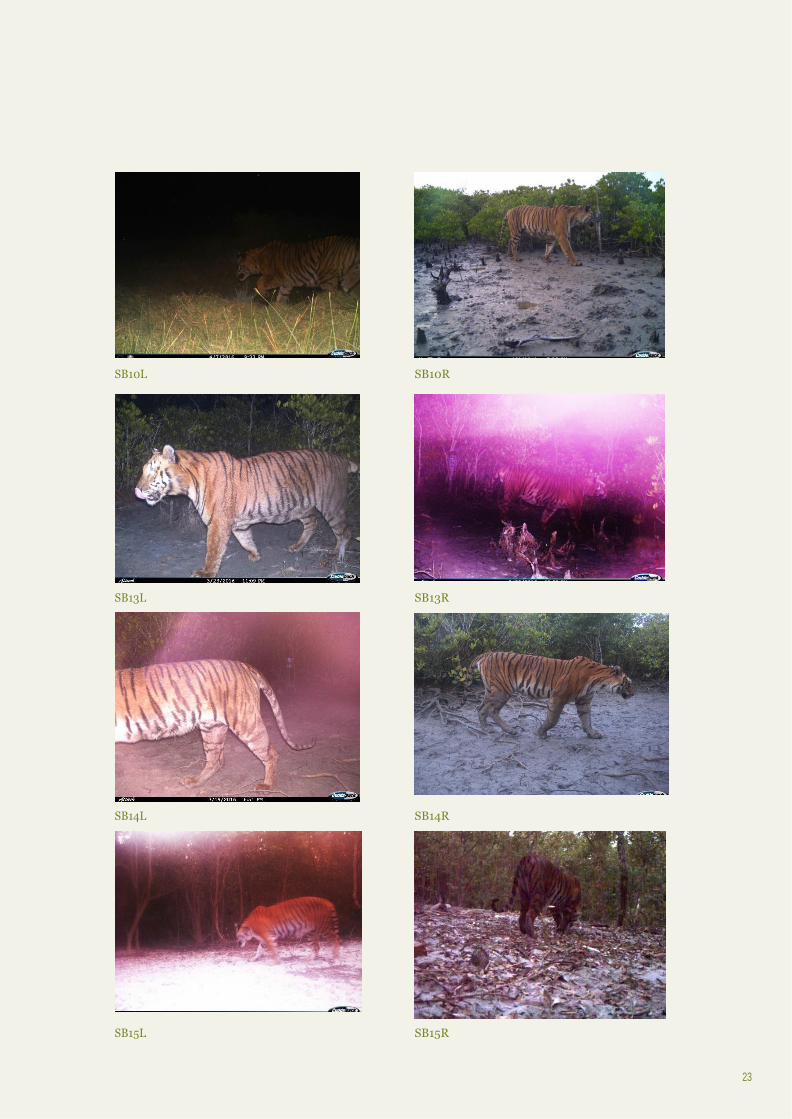
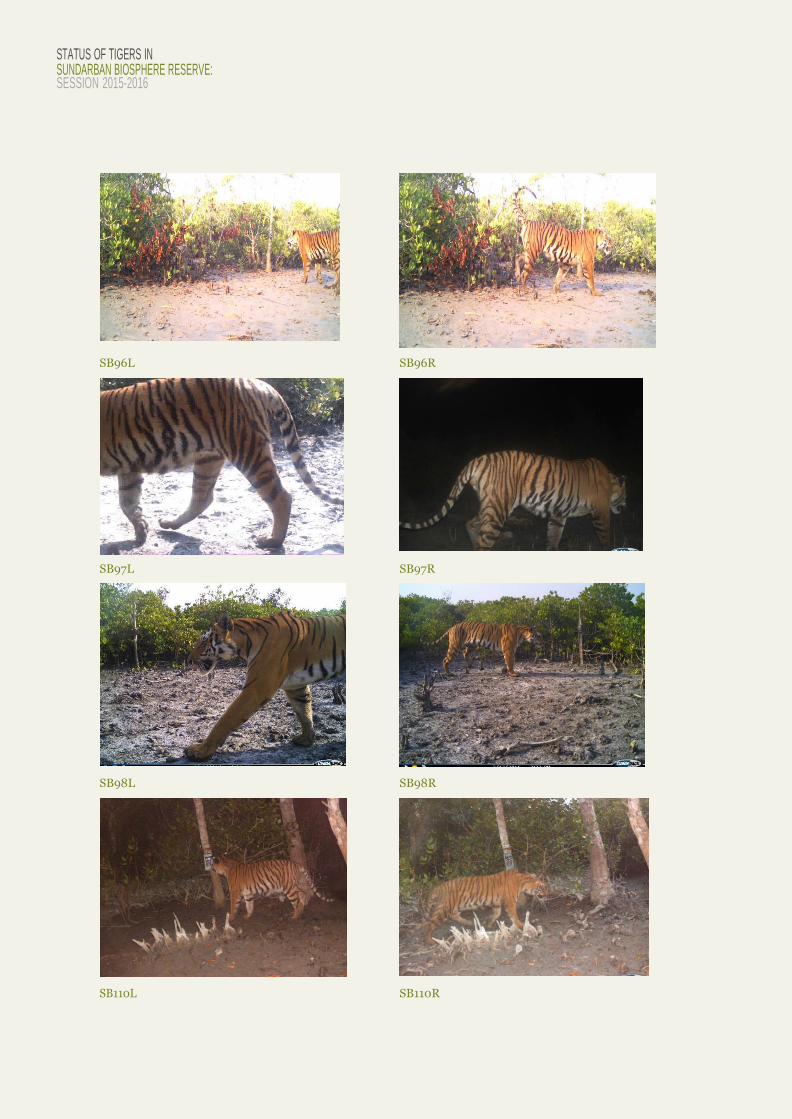
ANNEXURE 1 Tiger Profile in 24 Parganas (South) Forest Division
SB3L SB3R
SB7L SB7R
SB9L SB9R
23
SB10L SB10R
SB13L SB13R
SB14L SB14R
SB15L SB15R
24
STATUS OF TIGERS IN SUNDARBAN BIOSPHERE RESERVE: SESSION 2015-2016
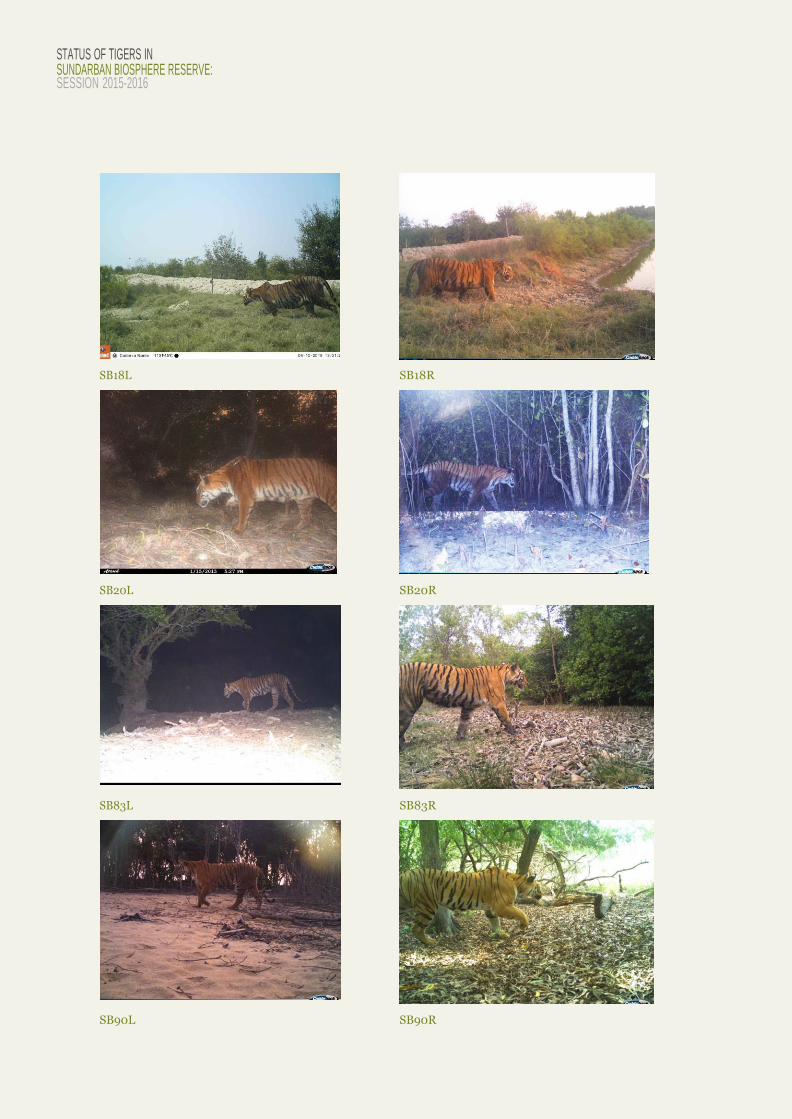
SB18L SB18R
SB20L SB20R
SB83L SB83R
SB90L SB90R

25
SB91L SB91R
SB92L SB92R
SB93L SB93R
SB94L SB94R
26
STATUS OF TIGERS IN SUNDARBAN BIOSPHERE RESERVE: SESSION 2015-2016
SB96L SB96R
SB97L SB97R
SB98L SB98R
SB110L SB110R

27
SB111L SB111R
SB112L SB112R
SB113L SB113R
SB114L SB114R

28
STATUS OF TIGERS IN SUNDARBAN BIOSPHERE RESERVE: SESSION 2015-2016
SB115L SB115R
SB116L SB116R
SB117L SB117R

29
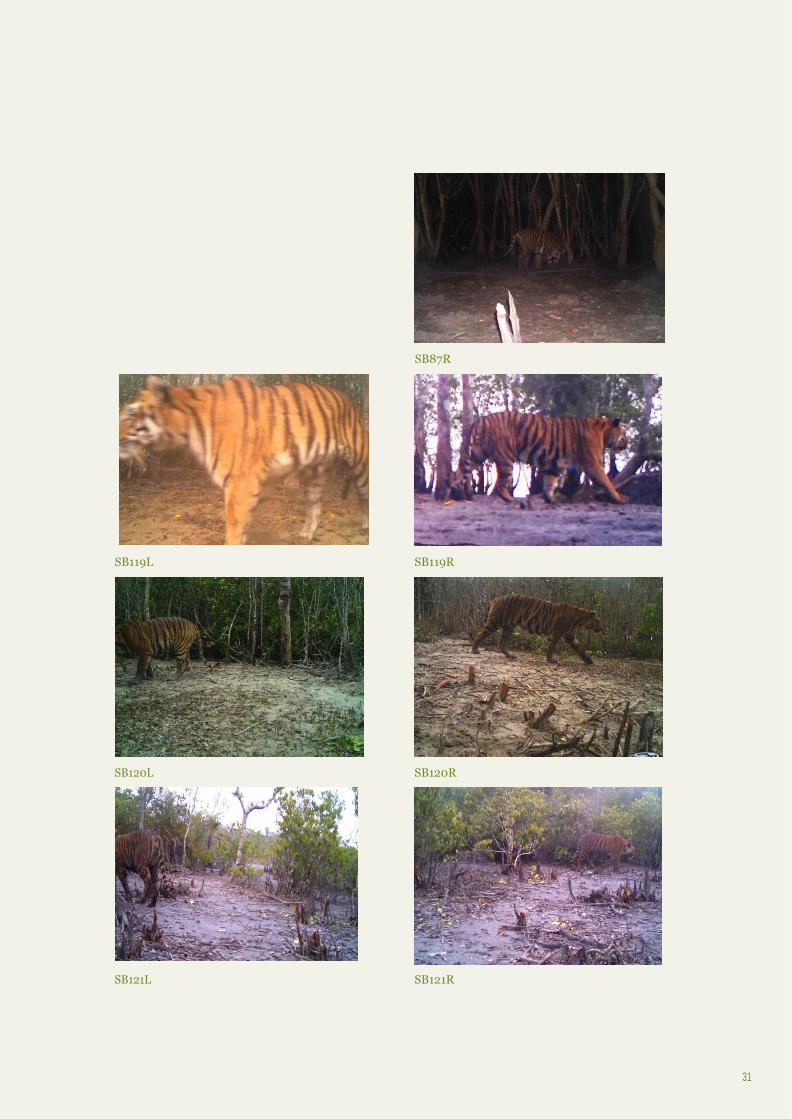
Tiger Profile in National Park (East) Range
SB21L SB21R
SB24L SB24R
SB35L SB35R
SB38L SB38R

30
STATUS OF TIGERS IN SUNDARBAN BIOSPHERE RESERVE: SESSION 2015-2016
SB40L SB40R
SB44L SB44R
SB84L SB84R
SB86L SB86R
31
SB87R
SB119L SB119R
SB120L SB120R
SB121L SB121R

32
STATUS OF TIGERS IN SUNDARBAN BIOSPHERE RESERVE: SESSION 2015-2016
SB122R
SB123L SB123R

33
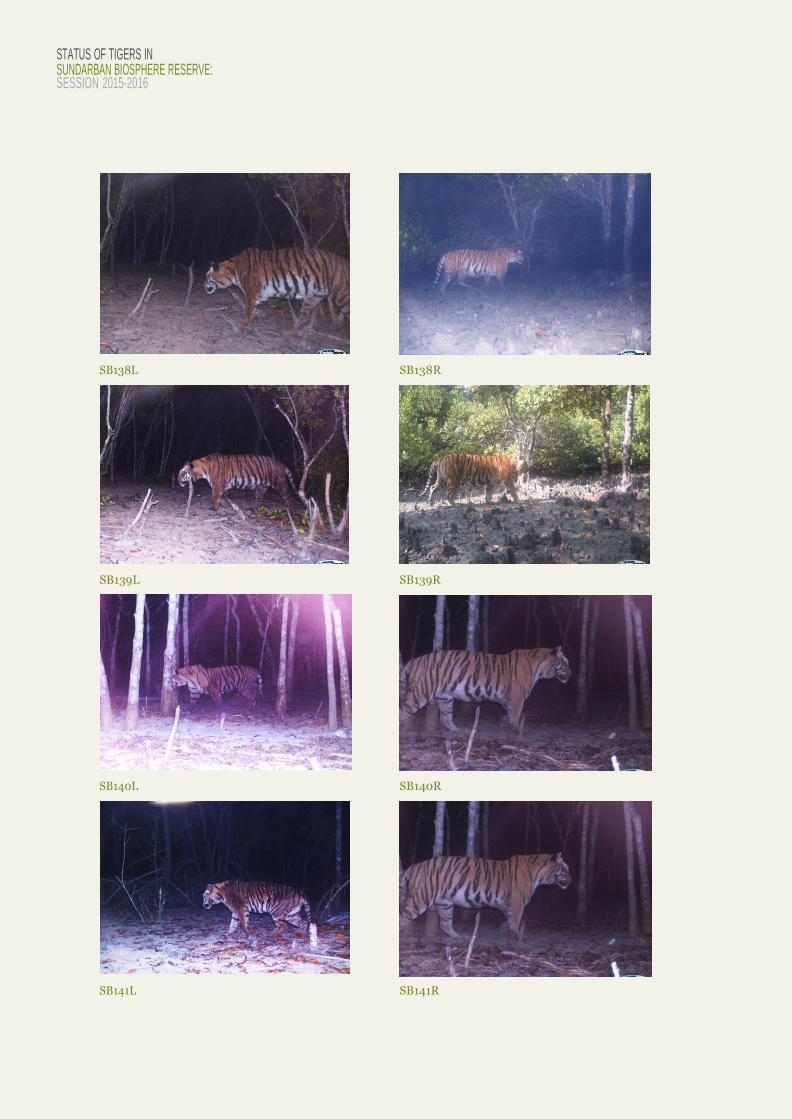
Tiger Profile in National Park (West) Range
SB134L SB134R
SB135L SB135R
SB136L SB136R
SB137L SB137R
34
STATUS OF TIGERS IN SUNDARBAN BIOSPHERE RESERVE: SESSION 2015-2016
SB138L SB138R
SB139L SB139R
SB140L SB140R
SB141L SB141R

35
SB142L SB142R
SB143L SB143R
SB144L SB144R
SB145L SB145R

36
STATUS OF TIGERS IN SUNDARBAN BIOSPHERE RESERVE: SESSION 2015-2016
SB146L SB146R
SB147L SB147R
SB148L SB148R
SB149R

37
SB150R
SB151R
SB152L SB152R

38
STATUS OF TIGERS IN SUNDARBAN BIOSPHERE RESERVE: SESSION 2015-2016
Tiger Profile in Sajnekhali Wildlife Sanctuary
SB48L SB48R
SB49L SB49R
SB50L SB50R

SB130L SB130R
39
SB57L SB57R
SB64L SB64R
SB128L SB128R
SB129L SB129R

40
STATUS OF TIGERS IN SUNDARBAN BIOSPHERE RESERVE: SESSION 2015-2016
SB131L SB131R
SB132L SB132R
SB133L SB133R

SB101L SB101R
41
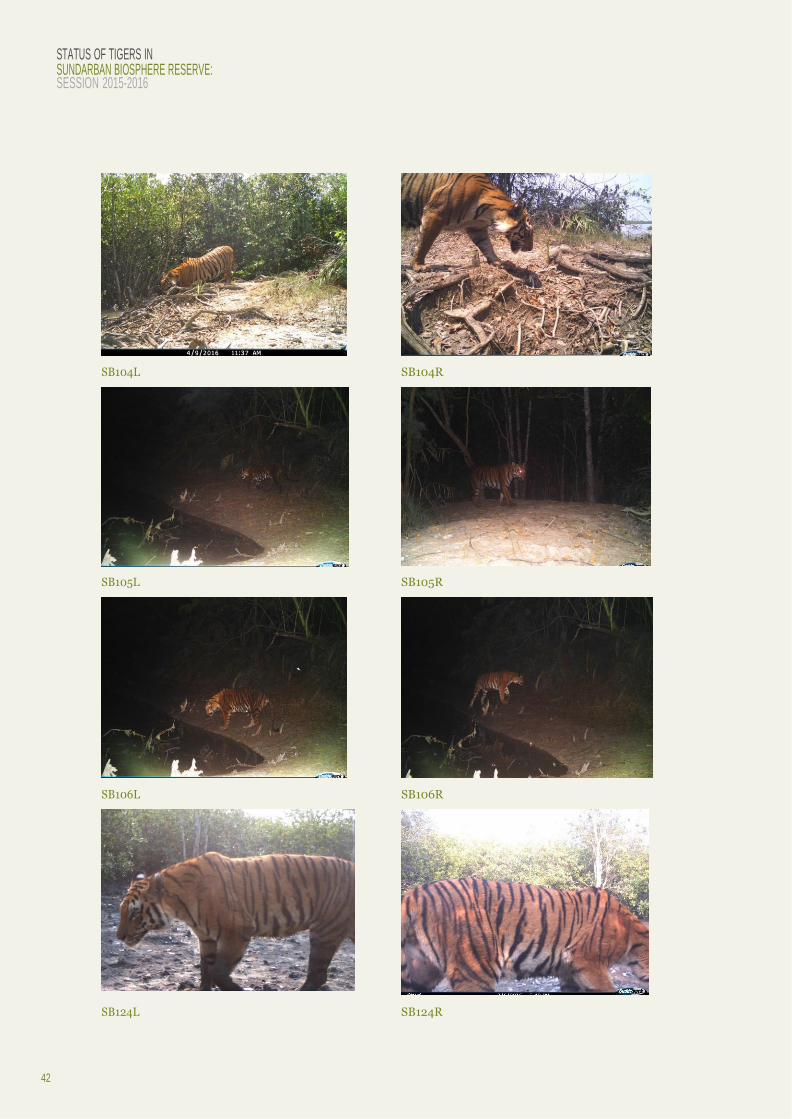
Tiger Profile in Basirhat Range
SB61L SB61R
SB69L SB69R
SB72L SB72R
42
STATUS OF TIGERS IN SUNDARBAN BIOSPHERE RESERVE: SESSION 2015-2016
SB104L SB104R
SB105L SB105R
SB106L SB106R
SB124L SB124R

43
SB125L SB125R
SB126L SB126R
SB127R

44
STATUS OF TIGERS IN SUNDARBAN BIOSPHERE RESERVE: SESSION 2015-2016
ANNEXURE 2
DETAILED TABLE OF MODEL SELECTION IN PROGRAM MARK FOR EACH OF THE BLOCK OR RANGE IS GIVEN BELOW:
24 Parganas (South) Forest Division:
Model AIC C
AIC Weight C
No. of Parameters Deviance
M h
520.9230 0.60522 3 471.9207
M th_lure
522.5002 0.27506 5 469.4602
M bh
524.1751 0.11905 5 471.1351
M o
536.3677 0.00027 1 491.3864
M t_lure
536.3909 0.00026 2 489.4013
M b
538.3523 0.00010 2 491.3626
M tb_lure
540.1185 0.00004 4 489.0995
National Park (East) Range:
Model AIC C
AIC Weight C
No. of Parameters Deviance
M th_lure
182.7222 0.44647 5 148.9803
M b
184.4576 0.18748 2 156.9009
M t_lure
185.0780 0.13748 2 157.5212
M o
185.8058 0.09554 1 160.2795
M tb_lure
187.8527 0.03433 4 156.1882
M h
189.8823 0.01245 3 160.2795
M bh
190.6428 0.00851 5 156.9009
National Park (West) Range:
Model AIC C
AIC Weight C
No. of Parameters Deviance
M h
496.8370 0.82740 3 457.5946
M bh
500.4825 0.13369 5 457.1898
M th_lure
502.9924 0.03811 5 459.6997
M o
512.6670 0.00030 1 477.4526
M tb_lure
513.5117 0.00020 4 472.2470
M b
513.8125 0.00017 2 476.5869
M t_lure
514.3994 0.00013 2 477.1738

45
Sajnekhali Wildlife Sanctuary:
Model AIC C
AIC Weight C
No. of Parameters Deviance
M h
208.5881 0.31435 3 188.5515
M th_lure
208.6958 0.29787 5 184.5222
M o
209.9909 0.15588 1 194.0296
M t_lure
210.3508 0.13021 2 192.3595
M b
212.0174 0.05659 2 194.0261
M tb_lure
213.6713 0.02475 4 191.5740
M bh
214.0627 0.02035 3 194.0261
Basirhat Range:
Model AIC C
AIC Weight C
No. of Parameters Deviance
M o
202.9417 0.47956 1 183.1835
M b
204.7782 0.19145 2 183.0016
M t_lure
204.9591 0.17489 2 183.1826
M tb_lure
206.6950 0.07342 4 180.8540
M h
206.9876 0.06343 3 183.1835
M bh
210.8890 0.00902 5 183.0016
M th_lure
211.0699 0.00824 5 183.1826

© 1986 Panda Symbol WWF-World Wide Fund For Nature (Formerly World Wildlife Fund)
WWF-India Secretariat
172 B, Lodhi Estate
New Delhi- 110003
Tel: +91 11 4150 4815
STATUS OF TIGERS IN THE SUNDARBAN BIOSPHERE RESERVE: SESSION 2015-2016