CHAPTER 3 SECONDARY ECONOMIC ACTIVITY - StatCHAPTER 3 SECONDARY ECONOMIC ACTIVITY 3.1 CONCEPT OF...
9
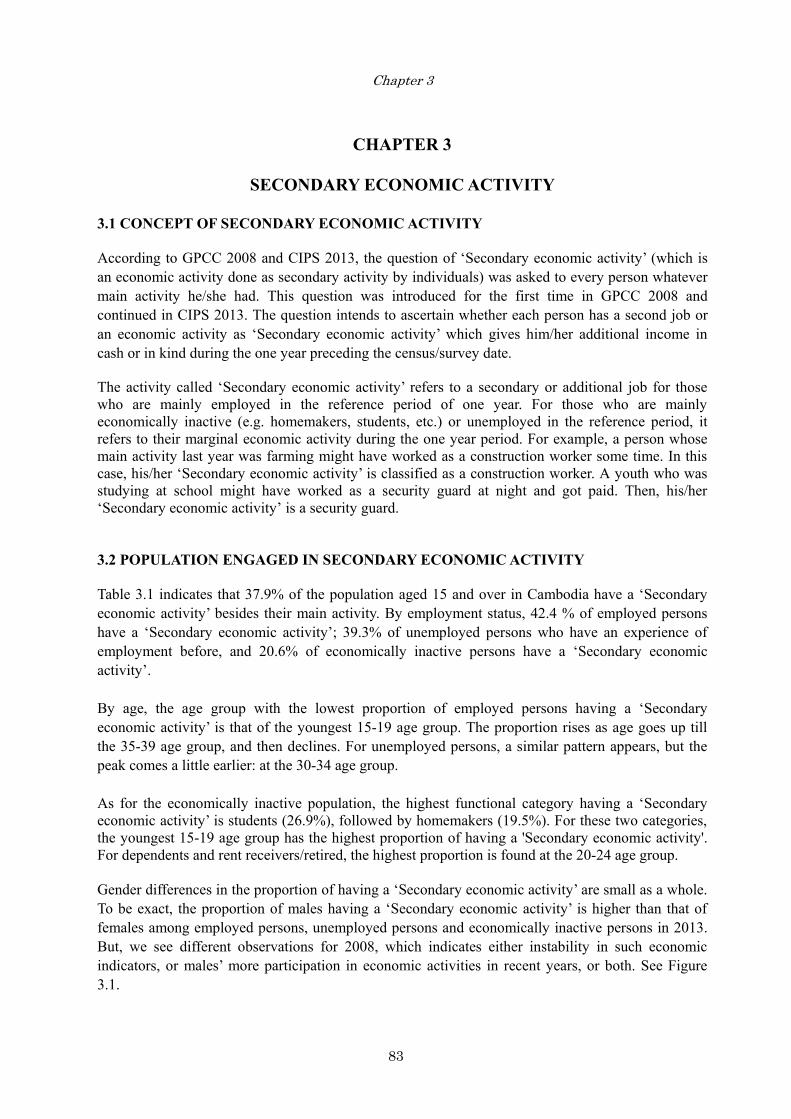
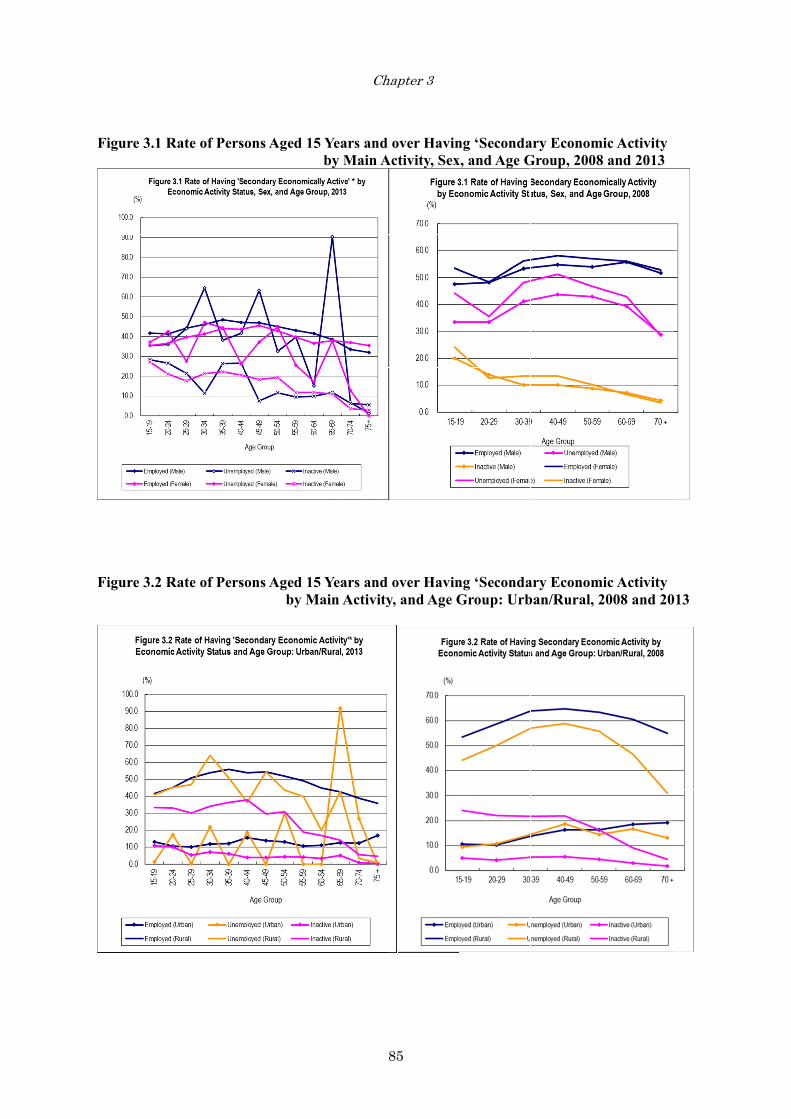
83 Chapter 3 CHAPTER 3 SECONDARY ECONOMIC ACTIVITY 3.1 CONCEPT OF SECONDARY ECONOMIC ACTIVITY According to GPCC 2008 and CIPS 2013, the question of ‘Secondary economic activity’ (which is an economic activity done as secondary activity by individuals) was asked to every person whatever main activity he/she had. This question was introduced for the first time in GPCC 2008 and continued in CIPS 2013. The question intends to ascertain whether each person has a second job or an economic activity as ‘Secondary economic activity’ which gives him/her additional income in cash or in kind during the one year preceding the census/survey date. The activity called ‘Secondary economic activity’ refers to a secondary or additional job for those who are mainly employed in the reference period of one year. For those who are mainly economically inactive (e.g. homemakers, students, etc.) or unemployed in the reference period, it refers to their marginal economic activity during the one year period. For example, a person whose main activity last year was farming might have worked as a construction worker some time. In this case, his/her ‘Secondary economic activity’ is classified as a construction worker. A youth who was studying at school might have worked as a security guard at night and got paid. Then, his/her ‘Secondary economic activity’ is a security guard. 3.2 POPULATION ENGAGED IN SECONDARY ECONOMIC ACTIVITY Table 3.1 indicates that 37.9% of the population aged 15 and over in Cambodia have a ‘Secondary economic activity’ besides their main activity. By employment status, 42.4 % of employed persons have a ‘Secondary economic activity’; 39.3% of unemployed persons who have an experience of employment before, and 20.6% of economically inactive persons have a ‘Secondary economic activity’. By age, the age group with the lowest proportion of employed persons having a ‘Secondary economic activity’ is that of the youngest 15-19 age group. The proportion rises as age goes up till the 35-39 age group, and then declines. For unemployed persons, a similar pattern appears, but the peak comes a little earlier: at the 30-34 age group. As for the economically inactive population, the highest functional category having a ‘Secondary economic activity’ is students (26.9%), followed by homemakers (19.5%). For these two categories, the youngest 15-19 age group has the highest proportion of having a 'Secondary economic activity'. For dependents and rent receivers/retired, the highest proportion is found at the 20-24 age group. Gender differences in the proportion of having a ‘Secondary economic activity’ are small as a whole. To be exact, the proportion of males having a ‘Secondary economic activity’ is higher than that of females among employed persons, unemployed persons and economically inactive persons in 2013. But, we see different observations for 2008, which indicates either instability in such economic indicators, or males’ more participation in economic activities in recent years, or both. See Figure 3.1.
Transcript of CHAPTER 3 SECONDARY ECONOMIC ACTIVITY - StatCHAPTER 3 SECONDARY ECONOMIC ACTIVITY 3.1 CONCEPT OF...
83
Chapter 3
83
CHAPTER 3
SECONDARY ECONOMIC ACTIVITY
3.1 CONCEPT OF SECONDARY ECONOMIC ACTIVITY According to GPCC 2008 and CIPS 2013, the question of ‘Secondary economic activity’ (which is an economic activity done as secondary activity by individuals) was asked to every person whatever main activity he/she had. This question was introduced for the first time in GPCC 2008 and continued in CIPS 2013. The question intends to ascertain whether each person has a second job or an economic activity as ‘Secondary economic activity’ which gives him/her additional income in cash or in kind during the one year preceding the census/survey date. The activity called ‘Secondary economic activity’ refers to a secondary or additional job for those who are mainly employed in the reference period of one year. For those who are mainly economically inactive (e.g. homemakers, students, etc.) or unemployed in the reference period, it refers to their marginal economic activity during the one year period. For example, a person whose main activity last year was farming might have worked as a construction worker some time. In this case, his/her ‘Secondary economic activity’ is classified as a construction worker. A youth who was studying at school might have worked as a security guard at night and got paid. Then, his/her ‘Secondary economic activity’ is a security guard. 3.2 POPULATION ENGAGED IN SECONDARY ECONOMIC ACTIVITY Table 3.1 indicates that 37.9% of the population aged 15 and over in Cambodia have a ‘Secondary economic activity’ besides their main activity. By employment status, 42.4 % of employed persons have a ‘Secondary economic activity’; 39.3% of unemployed persons who have an experience of employment before, and 20.6% of economically inactive persons have a ‘Secondary economic activity’. By age, the age group with the lowest proportion of employed persons having a ‘Secondary economic activity’ is that of the youngest 15-19 age group. The proportion rises as age goes up till the 35-39 age group, and then declines. For unemployed persons, a similar pattern appears, but the peak comes a little earlier: at the 30-34 age group. As for the economically inactive population, the highest functional category having a ‘Secondary economic activity’ is students (26.9%), followed by homemakers (19.5%). For these two categories, the youngest 15-19 age group has the highest proportion of having a 'Secondary economic activity'. For dependents and rent receivers/retired, the highest proportion is found at the 20-24 age group. Gender differences in the proportion of having a ‘Secondary economic activity’ are small as a whole. To be exact, the proportion of males having a ‘Secondary economic activity’ is higher than that of females among employed persons, unemployed persons and economically inactive persons in 2013. But, we see different observations for 2008, which indicates either instability in such economic indicators, or males’ more participation in economic activities in recent years, or both. See Figure 3.1.

84
Chapter 3
84
Table 3.1 Rate of Persons Aged 5 Years and over Having 'Secondary Economic Activity'* by Main Activity, Age Group and Sex, 2013
Main Activity
Age groupTotal** Home Maker Student Dependent
RentReceiver / Retired
Other
Total (Aged 5 +) 31.6 42.3 39.3 14.3 19.5 16.2 5.1 8.3 10.0Total (Aged 15 +) 37.9 42.4 39.3 20.6 19.5 26.9 7.9 8.3 10.1
15-19 32.4 38.4 36.4 27.8 32.4 28.2 15.7 9.7 39.6 20-24 36.0 39.1 40.0 23.9 22.7 24.4 21.6 48.2 52.9 25-29 40.0 42.1 35.9 18.8 19.3 18.7 17.9 17.3 0.0 30-34 42.5 43.8 55.1 20.3 21.1 14.1 21.9 0.0 0.0 35-39 45.0 46.4 41.7 22.5 23.4 18.3 17.0 0.0 0.0 40-44 43.9 45.4 33.4 21.0 22.9 20.2 0.0 21.0 0.0 45-49 44.6 46.3 48.6 17.4 19.4 13.1 6.1 0.0 33.5 50-54 41.8 43.9 39.1 18.7 21.2 0.0 8.9 17.8 0.0 55-59 37.3 41.2 30.9 11.5 13.5 0.0 7.3 9.1 2.7 60-64 32.9 38.9 16.5 11.5 14.6 0.0 6.3 13.3 100.0 65-69 29.6 38.3 51.1 11.2 20.3 11.4 4.9 8.9 16.0 70-74 17.9 35.2 10.6 4.5 4.5 0.0 4.4 5.3 0.0
75 and over 11.7 33.6 0.5 3.8 7.0 0.0 3.0 5.1 0.0Male
Total (Aged 5 +) 33.5 44.3 43.9 14.8 21.8 17.0 5.3 11.9 10.3Total (Aged 15 +) 40.8 44.3 43.5 23.7 21.6 27.9 9.3 11.9 10.4
15-19 33.6 41.7 35.5 28.2 34.4 28.8 16.3 0.0 55.4 20-24 38.3 41.4 36.0 26.5 34.1 26.9 20.3 0.0 0.0 25-29 43.1 44.3 44.0 21.5 27.2 20.9 20.0 0.0 0.0 30-34 45.8 46.1 64.5 11.5 14.2 14.4 6.7 0.0 0.0 35-39 48.3 48.6 38.2 26.4 39.9 0.0 32.5 0.0 0.0 40-44 47.0 47.2 41.8 26.7 39.8 0.0 0.0 93.3 0.0 45-49 46.5 46.9 63.2 7.6 7.9 0.0 9.1 0.0 0.0 50-54 44.5 45.1 32.5 11.7 16.6 0.0 0.0 34.3 0.0 55-59 41.2 43.0 39.8 9.5 5.0 0.0 2.4 18.0 4.6 60-64 38.1 41.6 15.1 9.9 14.3 0.0 0.0 18.9 0.0 65-69 33.8 38.6 90.5 11.8 34.5 0.0 0.0 8.8 51.3 70-74 22.0 33.5 6.7 6.4 7.1 0.0 4.7 9.4 0.0
75 and over 15.5 32.1 1.4 5.5 5.0 0.0 5.4 7.2 0.0Female
Total (Aged 5 +) 29.9 40.4 35.5 13.8 19.2 15.2 5.0 6.2 9.9Total (Aged 15 +) 35.2 40.4 35.9 18.5 19.2 25.6 7.1 6.2 9.9
15-19 31.0 35.4 37.3 27.2 31.8 27.5 15.0 10.0 32.8 20-24 33.7 36.8 42.4 21.2 21.1 20.3 23.1 100.0 80.1 25-29 37.0 39.8 27.6 17.6 18.6 15.2 15.6 17.3 0.0 30-34 39.4 41.4 47.2 21.4 21.3 13.7 32.4 0.0 0.0 35-39 41.9 44.0 44.5 22.2 22.9 30.6 7.6 0.0 0.0 40-44 41.2 43.6 26.1 20.6 22.3 34.9 0.0 2.5 0.0 45-49 42.8 45.7 37.3 18.4 19.8 16.6 3.9 0.0 100.0 50-54 39.6 42.8 44.7 19.4 21.4 0.0 10.8 14.2 0.0 55-59 34.7 39.9 25.7 11.9 14.2 0.0 8.8 1.9 0.0 60-64 29.4 36.6 17.2 11.9 14.7 0.0 8.1 10.2 100.0 65-69 26.6 38.0 37.8 11.1 17.6 11.4 6.6 8.9 0.0 70-74 15.1 37.1 12.7 3.7 3.8 0.0 4.2 2.2 0.0
75 and over 9.2 35.5 0.0 2.9 7.8 0.0 1.9 3.6 0.0
** Excluding 'Unemployed (Employed never before)' persons
EmployedUnemployed(Employedever before)
EconomicallyInactive
* Rate of Having Secondary Economic Activity for a given main activity status and age group, expressed in percentage, is the proportion of the persons havingsecondary economic activity to the total number of persons having the corresponding main activity status and age group.
85
F
F
Figure 3.1 R
Figure 3.2 R
Rate of Pers
Rate of Pers
ons Aged 15
ons Aged 15by M
Ch
5 Years andby Main A
5 Years andMain Activity
hapter 3
85
d over HavinActivity, Sex
d over Haviny, and Age G
ng ‘Secondax, and Age G
ng ‘SecondaGroup: Urb
ary EconomGroup, 2008
ary Economban/Rural, 2
mic Activity8 and 2013
mic Activity 2008 and 20
013
86
Chapter 3
86
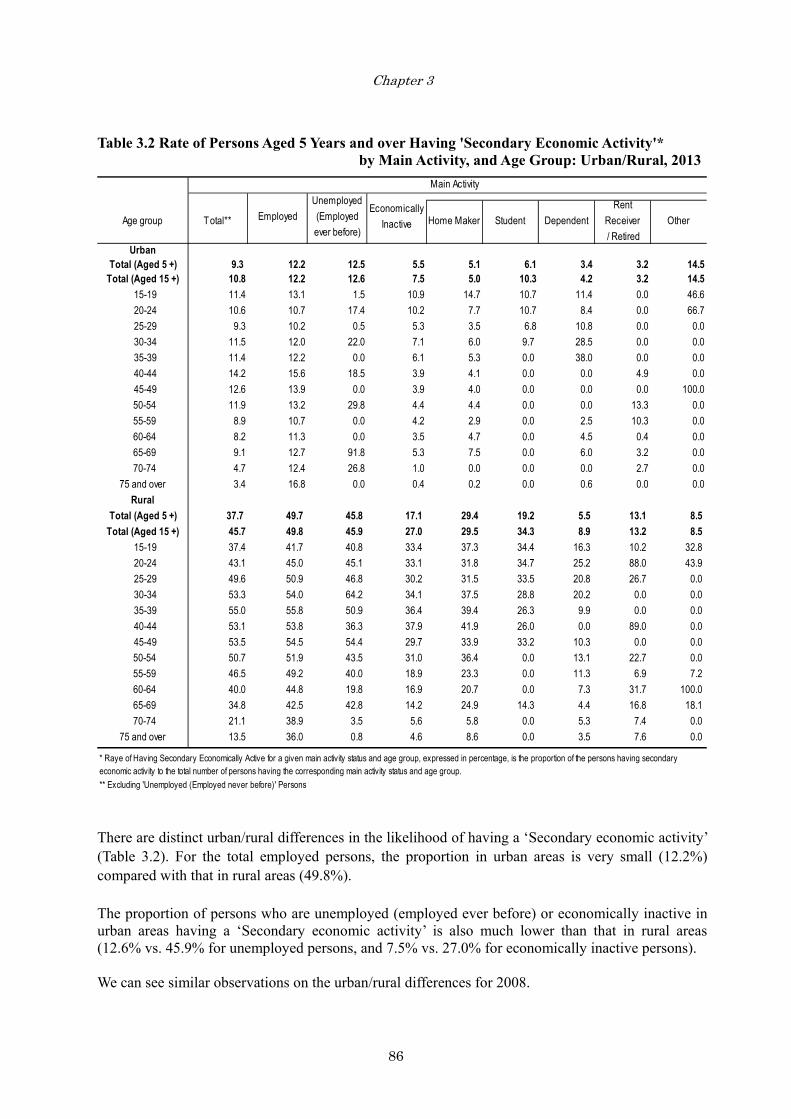
Table 3.2 Rate of Persons Aged 5 Years and over Having 'Secondary Economic Activity'* by Main Activity, and Age Group: Urban/Rural, 2013
There are distinct urban/rural differences in the likelihood of having a ‘Secondary economic activity’ (Table 3.2). For the total employed persons, the proportion in urban areas is very small (12.2%) compared with that in rural areas (49.8%). The proportion of persons who are unemployed (employed ever before) or economically inactive in urban areas having a ‘Secondary economic activity’ is also much lower than that in rural areas (12.6% vs. 45.9% for unemployed persons, and 7.5% vs. 27.0% for economically inactive persons). We can see similar observations on the urban/rural differences for 2008.
Main Activity
Age group Total** Home Maker Student DependentRent
Receiver / Retired
Other
UrbanTotal (Aged 5 +) 9.3 12.2 12.5 5.5 5.1 6.1 3.4 3.2 14.5
Total (Aged 15 +) 10.8 12.2 12.6 7.5 5.0 10.3 4.2 3.2 14.5 15-19 11.4 13.1 1.5 10.9 14.7 10.7 11.4 0.0 46.6 20-24 10.6 10.7 17.4 10.2 7.7 10.7 8.4 0.0 66.7 25-29 9.3 10.2 0.5 5.3 3.5 6.8 10.8 0.0 0.0 30-34 11.5 12.0 22.0 7.1 6.0 9.7 28.5 0.0 0.0 35-39 11.4 12.2 0.0 6.1 5.3 0.0 38.0 0.0 0.0 40-44 14.2 15.6 18.5 3.9 4.1 0.0 0.0 4.9 0.0 45-49 12.6 13.9 0.0 3.9 4.0 0.0 0.0 0.0 100.0 50-54 11.9 13.2 29.8 4.4 4.4 0.0 0.0 13.3 0.0 55-59 8.9 10.7 0.0 4.2 2.9 0.0 2.5 10.3 0.0 60-64 8.2 11.3 0.0 3.5 4.7 0.0 4.5 0.4 0.0 65-69 9.1 12.7 91.8 5.3 7.5 0.0 6.0 3.2 0.0 70-74 4.7 12.4 26.8 1.0 0.0 0.0 0.0 2.7 0.0
75 and over 3.4 16.8 0.0 0.4 0.2 0.0 0.6 0.0 0.0Rural
Total (Aged 5 +) 37.7 49.7 45.8 17.1 29.4 19.2 5.5 13.1 8.5Total (Aged 15 +) 45.7 49.8 45.9 27.0 29.5 34.3 8.9 13.2 8.5
15-19 37.4 41.7 40.8 33.4 37.3 34.4 16.3 10.2 32.8 20-24 43.1 45.0 45.1 33.1 31.8 34.7 25.2 88.0 43.9 25-29 49.6 50.9 46.8 30.2 31.5 33.5 20.8 26.7 0.0 30-34 53.3 54.0 64.2 34.1 37.5 28.8 20.2 0.0 0.0 35-39 55.0 55.8 50.9 36.4 39.4 26.3 9.9 0.0 0.0 40-44 53.1 53.8 36.3 37.9 41.9 26.0 0.0 89.0 0.0 45-49 53.5 54.5 54.4 29.7 33.9 33.2 10.3 0.0 0.0 50-54 50.7 51.9 43.5 31.0 36.4 0.0 13.1 22.7 0.0 55-59 46.5 49.2 40.0 18.9 23.3 0.0 11.3 6.9 7.2 60-64 40.0 44.8 19.8 16.9 20.7 0.0 7.3 31.7 100.0 65-69 34.8 42.5 42.8 14.2 24.9 14.3 4.4 16.8 18.1 70-74 21.1 38.9 3.5 5.6 5.8 0.0 5.3 7.4 0.0
75 and over 13.5 36.0 0.8 4.6 8.6 0.0 3.5 7.6 0.0
** Excluding 'Unemployed (Employed never before)' Persons
EmployedUnemployed(Employedever before)
EconomicallyInactive
* Raye of Having Secondary Economically Active for a given main activity status and age group, expressed in percentage, is the proportion of the persons having secondaryeconomic activity to the total number of persons having the corresponding main activity status and age group.

87
Chapter 3
87
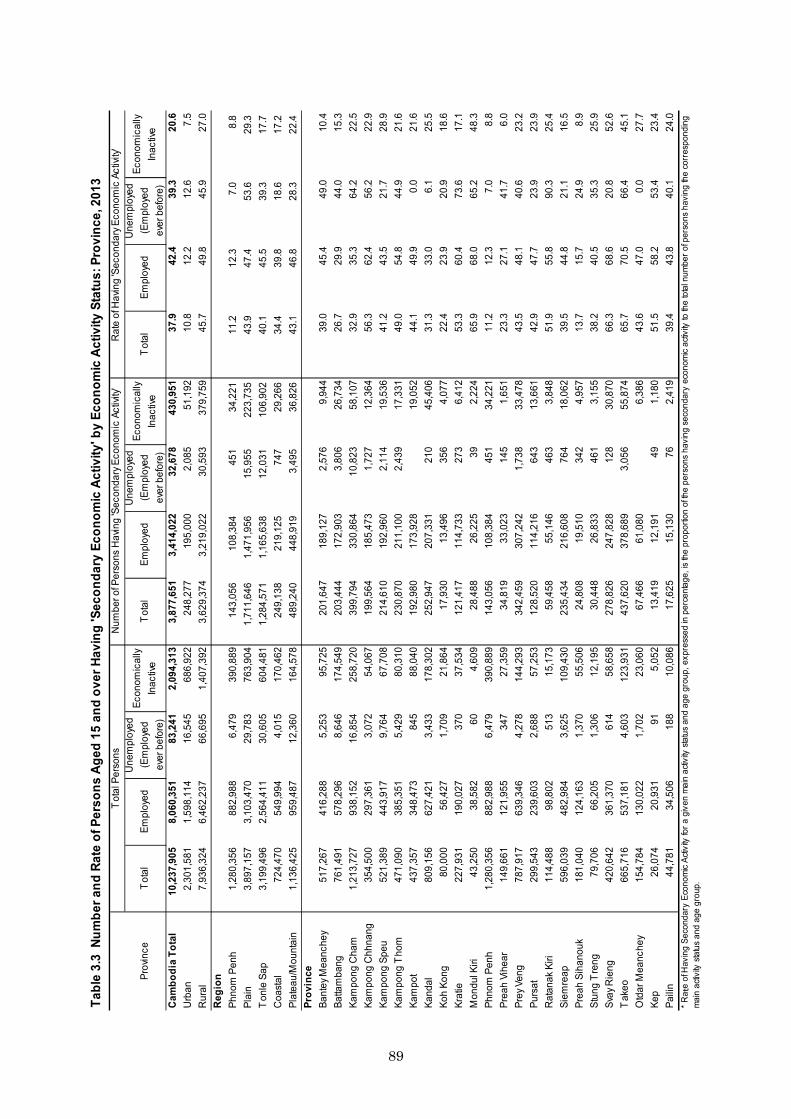
Table 3.3 shows differences among regions and provinces. As for regional differences, the proportion of persons aged 15 and over having a ‘Secondary economic activity’ in Phnom Penh (11.2%) is by far lower than those in other regions, in which it ranges from 34.4% (Tonle Sap) to 43.9% (Other Plains). Compared with 2008 figures, Phnom Penh gained 5.8 points from 5.4%, while other regions lost from a 45.4% – 51.6% range. As for provincial differences, the proportion of persons who have a ‘Secondary economic activity’ is the lowest for Phnom Penh (11.2%), followed by Preah Sihanouk (13.7%), Koh Kong (22.4%) and Preah Vihear (23.3%). In 2008, Pailin, Preah Sihanouk and Koh Kong were the 2nd, 3rd and 4th lowest. The highest proportion is recorded by Svay Rieng (66.3%), followed by Mondul Kiri (65.9%), and Takeo (65.7%). Svay Rieng was also the highest in 2008, but we cannot see much consistency with 2008 figures or rankings with respect to this proportion. More than 40 % of the employed population have a ‘Secondary economic activity’ in 17 provinces, and more than 40% of the unemployed population do so in 13 provinces in 2013. As to the economically inactive population, more than 20% of the population have a ‘Secondary economic activity’ in 16 provinces.
Kratie
Pursat
Mondul Kiri
Koh Kong
Preah Vihear Stung Treng
Siem Reap
Battambang
Ratanak Kiri
Kampong Thom
Kampot
Takeo
Kampong Cham
Kandal
Prey VengKampong Speu
Otdar Meanchey
Banteay Meanchey
Pailin
Kampong Chhnang
Svay RiengPreah Sihanouk
Phnom Penh
Kep0 50 10025 km
Map 6. Persons Aged 15 and over with 'Secondary Economic Activity' per 100 Population: Province, 2013
Persons Aged 15 and over with 'Secondary Economic Activity' per 100 Populationof Cambodia:37.4Persons Aged 15 and over with 'Secondary Economic Activity' per 100 Populationby Province:Min: 10.9 (Phnom Penh) Max: 66.2 (Svay Rieng)Mean: 41.0
Thailand
Laos
Vietnam
Persons aged 15 and over with'Secondary Economic Activity'per 100 population by province
Lower than 20.0
20.0 - 34.9
35.0 - 49.9
50.0 - 64.9
65.0 or higher
Water
Provincial boundary
LegendNational boundary

88
Chapter 3
88
Kratie
Pursat
Mondul Kiri
Koh Kong
Preah Vihear Stung Treng
Siem Reap
Battambang
Ratanak Kiri
Kampong Thom
Kampot
Takeo
Kampong Cham
Kandal
Prey VengKampong Speu
Otdar Meanchey
Banteay Meanchey
Pailin
Kampong Chhnang
Svay RiengPreah Sihanouk
Phnom Penh
Kep0 50 10025 km
Map 7. Employed Persons Aged 15 and over with 'Secondary Economic Activity' per 100 Employed Population: Province, 2013
Employed Persons Aged 15 and over with 'Secondary Economic Activity' per 100 Employed Population of Cambodia:42.4Employed Persons Aged 15 and over with 'Secondary Economic Activity' per 100 Employed Population by Province:Min: 12.3 (Phnom Penh) Max: 70.5 (Takeo)Mean: 45.2
Thailand
Laos
Vietnam
Employed persons aged 15 and over with 'Secondary Economic Activity' per 100 employed population by province
Lower than 20.0
20.0 - 34.9
35.0 - 49.9
50.0 - 64.9
65.0 or higher
Water
Provincial boundary
LegendNational boundary
Kratie
Pursat
Mondul Kiri
Koh Kong
Preah Vihear Stung Treng
Siem Reap
Battambang
Ratanak Kiri
Kampong Thom
Kampot
Takeo
Kampong Cham
Kandal
Prey VengKampong Speu
Otdar Meanchey
Banteay Meanchey
Pailin
Kampong Chhnang
Svay RiengPreah Sihanouk
Phnom Penh
Kep0 50 10025 km
Map 8. Economically Inactive Persons Aged 15 and over with 'Secondary EconomicActivity' per 100 Economically Inactive Population: Province, 2013
Economically Inactive Persons Aged 15 and over with 'Secondary Economic Activity'per 100 Economically Inactive Population of Cambodia:20.6Economically Inactive Persons Aged 15 and over with 'Secondary Economic Activity' per 100 Economically Inactive Population by Province:Min: 6.0 (Preah Vihear) Max: 52.6 (Svay Rieng)Mean: 23.5
Thailand
Laos
Vietnam
Economically inactive persons aged 15 and over with 'Secondary Economic Activity' per 100 economically inactive population by province
Lower than 10.0
10.0 - 19.9
20.0 - 29.9
30.0 - 39.9
40.0 or higher
Water
Provincial boundary
LegendNational boundary
89
Tabl
e 3.
3 N
umbe
r and
Rat
e of
Per
sons
Age
d 15
and
ove
r Hav
ing
'Sec
onda
ry E
cono
mic
Act
ivity
' by
Econ
omic
Act
ivity
Sta
tus:
Pro
vinc
e, 2
013
Prov
ince
Tota
lEm
ploy
edUn
empl
oyed
(Em
ploy
edev
er b
efor
e)
Econ
omic
ally
Inac
tive
Tota
lEm
ploy
edUn
empl
oyed
(Em
ploy
edev
er b
efor
e)
Econ
omic
ally
Inac
tive
Tot
alEm
ploy
edUn
empl
oyed
(Em
ploy
edev
er b
efor
e)
Econ
omic
ally
Inac
tive
Cam
bodi
a To
tal
10,2
37,9
058,
060,
351
83,2
412,
094,
313
3,87
7,65
13,
414,
022
32,6
7843
0,95
137
.942
.439
.320
.6Ur
ban
2,30
1,58
11,
598,
114
16,5
4568
6,92
224
8,27
719
5,00
02,
085
51,1
9210
.812
.212
.67.
5Ru
ral
7,93
6,32
46,
462,
237
66,6
951,
407,
392
3,62
9,37
43,
219,
022
30,5
9337
9,75
945
.749
.845
.927
.0Re
gion
Phno
m P
enh
1,28
0,35
688
2,98
86,
479
390,
889
143,
056
10
8,38
4
451
34
,221
11.2
12.3
7.0
8.8
Plai
n3,
897,
157
3,10
3,47
029
,783
763,
904
1,71
1,64
6
1,
471,
956
15,9
55
22
3,73
5
43.9
47.4
53.6
29.3
Ton
le S
ap3,
199,
496
2,56
4,41
130
,605
604,
481
1,28
4,57
1
1,
165,
638
12,0
31
10
6,90
2
40.1
45.5
39.3
17.7
Coas
tal
724,
470
549,
994
4,01
517
0,46
224
9,13
8
219,
125
74
7
29,2
66
34
.439
.818
.617
.2Pl
atea
u/M
ount
ain
1,13
6,42
595
9,48
712
,360
164,
578
489,
240
44
8,91
9
3,49
5
36
,826
43.1
46.8
28.3
22.4
Prov
ince
Bant
ey M
eanc
hey
517,
267
416,
288
5,25
395
,725
201,
647
189,
127
2,57
69,
944
39.0
45.4
49.0
10.4
Batta
mba
ng76
1,49
157
8,29
68,
646
174,
549
203,
444
172,
903
3,80
626
,734
26.7
29.9
44.0
15.3
Kam
pong
Cha
m1,
213,
727
938,
152
16,8
5425
8,72
039
9,79
433
0,86
410
,823
58,1
0732
.935
.364
.222
.5Ka
mpo
ng C
hhna
ng35
4,50
029
7,36
13,
072
54,0
6719
9,56
418
5,47
31,
727
12,3
6456
.362
.456
.222
.9Ka
mpo
ng S
peu
521,
389
443,
917
9,76
467
,708
214,
610
192,
960
2,11
419
,536
41.2
43.5
21.7
28.9
Kam
pong
Tho
m47
1,09
038
5,35
15,
429
80,3
1023
0,87
021
1,10
02,
439
17,3
3149
.054
.844
.921
.6Ka
mpo
t43
7,35
734
8,47
384
588
,040
192,
980
173,
928
19,0
5244
.149
.90.
021
.6Ka
ndal
809,
156
627,
421
3,43
317
8,30
225
2,94
720
7,33
121
045
,406
31.3
33.0
6.1
25.5
Koh
Kong
80,0
0056
,427
1,70
921
,864
17,9
3013
,496
356
4,07
722
.423
.920
.918
.6Kr
atie
227,
931
190,
027
370
37,5
3412
1,41
711
4,73
327
36,
412
53.3
60.4
73.6
17.1
Mon
dul K
iri43
,250
38,5
8260
4,60
928
,488
26,2
2539
2,22
465
.968
.065
.248
.3Ph
nom
Pen
h1,
280,
356
882,
988
6,47
939
0,88
914
3,05
610
8,38
445
134
,221
11.2
12.3
7.0
8.8
Prea
h Vi
hear
149,
661
121,
955
347
27,3
5934
,819
33,0
2314
51,
651
23.3
27.1
41.7
6.0
Prey
Ven
g78
7,91
763
9,34
64,
278
144,
293
342,
459
307,
242
1,73
833
,478
43.5
48.1
40.6
23.2
Purs
at29
9,54
323
9,60
32,
688
57,2
5312
8,52
011
4,21
664
313
,661
42.9
47.7
23.9
23.9
Rata
nak K
iri11
4,48
898
,802
513
15,1
7359
,458
55,1
4646
33,
848
51.9
55.8
90.3
25.4
Siem
reap
596,
039
482,
984
3,62
510
9,43
023
5,43
421
6,60
876
418
,062
39.5
44.8
21.1
16.5
Prea
h Si
hano
uk18
1,04
012
4,16
31,
370
55,5
0624
,808
19,5
1034
24,
957
13.7
15.7
24.9
8.9
Stun
g Tr
eng
79,7
0666
,205
1,30
612
,195
30,4
4826
,833
461
3,15
538
.240
.535
.325
.9Sv
ay R
ieng
420,
642
361,
370
614
58,6
5827
8,82
624
7,82
812
830
,870
66.3
68.6
20.8
52.6
Tak
eo66
5,71
653
7,18
14,
603
123,
931
437,
620
378,
689
3,05
655
,874
65.7
70.5
66.4
45.1
Otd
ar M
eanc
hey
154,
784
130,
022
1,70
223
,060
67,4
6661
,080
6,38
643
.647
.00.
027
.7Ke
p26
,074
20,9
3191
5,05
213
,419
12,1
9149
1,18
051
.558
.253
.423
.4Pa
ilin44
,781
34,5
0618
810
,086
17,6
2515
,130
762,
419
39.4
43.8
40.1
24.0
Tot
al P
erso
nsNu
mbe
r of P
erso
ns H
avin
g 'S
econ
dary
Econ
omic
Act
ivity'
Rate
of H
avin
g 'S
econ
dary
Econ
omic
Act
ivity'
* Ra t
e of
Hav
ing
Seco
ndar
y Ec
onom
ic Ac
tivity
for a
giv
en m
ain
activ
ity s
tatu
s an
d ag
e gr
oup,
exp
ress
ed in
per
cent
age,
is th
e pr
opor
tion
of th
e pe
rson
s ha
ving
sec
onda
ry e
cono
mic
activ
ity to
the
tota
l num
ber o
f per
sons
hav
ing
the
corr
espo
ndin
gm
ain
activ
ity s
tatu
s an
d ag
e gr
oup.
90
Chapter 3
90
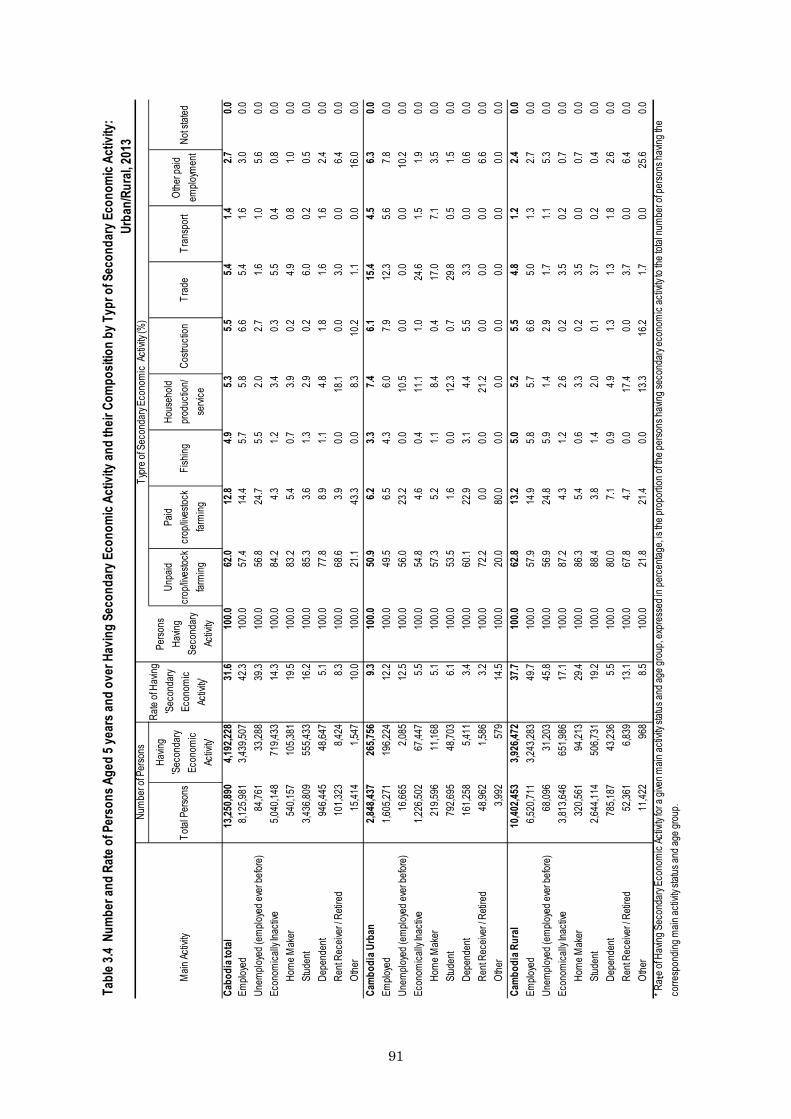
3.3 SECONDARY ACTIVITY AND MAIN ACTIVITY When a person was identified as a person having a ‘Secondary economic activity’, the type of his/her activity was ascertained, and then he/she was classified into 10 categories. In Table 3.4, those 10 categories are further lumped into 8 categories, where, ‘Unpaid crop/livestock farming’ consists of ‘Unpaid crop farming’ and ‘Unpaid livestock farming’, and ‘Paid crop/livestock farming’ consists of ‘Paid crop farming’ and ‘Paid livestock farming’ of the original categories. Table 3.4 shows the distribution of the population aged 5 years and over by main activity and by Secondary economic activity for urban/rural areas. Here, 42.3% of the employed population in Cambodia (aged 5 years and over) has a ‘Secondary economic activity’ in addition to their main activity. For them, the most favored secondary activity is ‘Unpaid crop/livestock farming’ (57.4%). In other words, about 60% of employed persons in Cambodia help family agricultural work with no payment. The proportion of the employed persons doing ‘Paid crop/livestock farming’ as a ‘Secondary economic activity’ is 14.4%. Compared with 2008 situations, the proportion for ‘Unpaid crop/livestock farming’ decreased from 80.4%, while that for ‘Paid crop/livestock farming’ increased from 6.6%. The proportion of unemployed persons having a ‘Secondary economic activity’ is 39.3%, slightly lower than that of employed persons, and that of economically inactive persons is 14.3%, very low compared with those of economically active persons. It is notable that unemployed persons tend to work more as paid farming than employed persons when they engage in secondary economic activities, and that economically inactive persons do not seem interested in paid farming. On the one hand, there is a distinct urban/rural difference in the likelihood of having a 'Secondary economic activity'. Rural persons aged 5 years and over are much more likely to have a secondary economic activity than the urban counterparts (37.7% vs. 9.3%). On the other hand, the pattern of distribution of persons by secondary economic activity is not very different between urban and rural areas: ‘Unpaid crop/livestock farming’ is by far the biggest, followed by ‘Paid crop/livestock farming’ and so on, although 'Unpaid crop/livestock farming' occupies a little less in urban areas than in rural areas (50.9% vs. 62.8%, respectively). The proportions for categories of ‘Second economic activity’ other than unpaid and paid crop/livestock farming are not very different from each other. A notable case would be ‘Trade’, whose proportion for urban areas is considerably high with 15.4%. This fact is also observed for 2008 (10.0%). Generally speaking, the relationship between main activity and secondary economic activity is stable between GPCC 2008 and CIPS 2013.
91
91
Tabl
e 3.4
Num
ber a
nd R
ate o
f Per
sons
Age
d 5 y
ears
and
over
Hav
ing
Seco
ndar
y Eco
nom
ic Ac
tivity
and
their
Com
posit
ion
by T
ypr o
f Sec
onda
ry E
cono
mic
Activ
ity:
Urb
an/R
ural,
2013
Typr
e of S
econ
dary
Econ
omic
Activ
ity (%
)
Main
Activ
ityTo
tal P
erso
ns
Havin
g'Se
cond
ary
Econ
omic
Activ
ity'
Perso
nsHa
ving
Seco
ndar
yAc
tivity
Unpa
idcr
op/liv
estoc
kfar
ming
Paid
crop
/lives
tock
farm
ingFi
shing
Hous
ehold
prod
uctio
n/se
rvice
Costr
uctio
nTr
ade
Tran
spor
tOt
her p
aidem
ploym
ent
Not s
tated
Cabo
dia t
otal
13,25
0,890
4,192
,228
31.6
100.0
62.0
12.8
4.95.3
5.55.4
1.42.7
0.0Em
ploye
d8,1
25,98
13,4
39,50
742
.310
0.057
.414
.45.7
5.86.6
5.41.6
3.00.0
Unem
ploye
d (em
ploye
d eve
r befo
re)
84,76
133
,288
39.3
100.0
56.8
24.7
5.52.0
2.71.6
1.05.6
0.0Ec
onom
ically
Inac
tive
5,040
,148
719,4
3314
.310
0.084
.24.3
1.23.4
0.35.5
0.40.8
0.0Ho
me M
aker
540,1
5710
5,381
19.5
100.0
83.2
5.40.7
3.90.2
4.90.8
1.00.0
Stud
ent
3,436
,809
555,4
3316
.210
0.085
.33.6
1.32.9
0.26.0
0.20.5
0.0De
pend
ent
946,4
4548
,647
5.110
0.077
.88.9
1.14.8
1.81.6
1.62.4
0.0
Rent
Rece
iver /
Retire
d 10
1,323
8,424
8.310
0.068
.63.9
0.018
.10.0
3.00.0
6.40.0
Othe
r15
,414
1,547
10.0
100.0
21.1
43.3
0.08.3
10.2
1.10.0
16.0
0.0Ca
mbo
dia U
rban
2,848
,437
265,7
569.3
100.0
50.9
6.23.3
7.46.1
15.4
4.56.3
0.0Em
ploye
d1,6
05,27
119
6,224
12.2
100.0
49.5
6.54.3
6.07.9
12.3
5.67.8
0.0Un
emplo
yed (
emplo
yed e
ver b
efore
)16
,665
2,085
12.5
100.0
56.0
23.2
0.010
.50.0
0.00.0
10.2
0.0Ec
onom
ically
Inac
tive
1,226
,502
67,44
75.5
100.0
54.8
4.60.4
11.1
1.024
.61.5
1.90.0
Hom
e Mak
er21
9,596
11,16
85.1
100.0
57.3
5.21.1
8.40.4
17.0
7.13.5
0.0St
uden
t79
2,695
48,70
36.1
100.0
53.5
1.60.0
12.3
0.729
.80.5
1.50.0
Depe
nden
t16
1,258
5,411
3.410
0.060
.122
.93.1
4.45.5
3.30.0
0.60.0
Re
nt Re
ceive
r / Re
tired
48,96
21,5
863.2
100.0
72.2
0.00.0
21.2
0.00.0
0.06.6
0.0Ot
her
3,992
579
14.5
100.0
20.0
80.0
0.00.0
0.00.0
0.00.0
0.0Ca
mbo
dia R
ural
10,40
2,453
3,926
,472
37.7
100.0
62.8
13.2
5.05.2
5.54.8
1.22.4
0.0Em
ploye
d6,5
20,71
13,2
43,28
349
.710
0.057
.914
.95.8
5.76.6
5.01.3
2.70.0
Unem
ploye
d (em
ploye
d eve
r befo
re)
68,09
631
,203
45.8
100.0
56.9
24.8
5.91.4
2.91.7
1.15.3
0.0Ec
onom
ically
Inac
tive
3,813
,646
651,9
8617
.110
0.087
.24.3
1.22.6
0.23.5
0.20.7
0.0Ho
me M
aker
320,5
6194
,213
29.4
100.0
86.3
5.40.6
3.30.2
3.50.0
0.70.0
Stud
ent
2,644
,114
506,7
3119
.210
0.088
.43.8
1.42.0
0.13.7
0.20.4
0.0De
pend
ent
785,1
8743
,236
5.510
0.080
.07.1
0.94.9
1.31.3
1.82.6
0.0
Rent
Rece
iver /
Retire
d 52
,361
6,839
13.1
100.0
67.8
4.70.0
17.4
0.03.7
0.06.4
0.0Ot
her
11,42
296
88.5
100.0
21.8
21.4
0.013
.316
.21.7
0.025
.60.0
Rate
of Ha
ving
'Seco
ndar
yEc
onom
icAc
tivity
'
Num
ber o
f Per
sons
* Ra t
e of H
aving
Sec
onda
ry Ec
onom
ic Ac
tivity
for a
give
n main
activ
ity st
atus a
nd ag
e gro
up, e
xpre
ssed
in pe
rcen
tage,
is the
prop
ortio
n of th
e per
sons
havin
g sec
onda
ry ec
onom
ic ac
tivity
to th
e tota
l num
ber o
f per
sons
havin
g the
corre
spon
ding m
ain ac
tivity
statu
s and
age g
roup
.