CHAPTER 3 PARTIAL MOLAL VOLUME, PARTIAL MOLAL...
51
48 CHAPTER 3 PARTIAL MOLAL VOLUME, PARTIAL MOLAL COMPRESSIBILITY AND VISCOSITY B-COEFFICIENT OF FOUR HOMOLOGOUS Į-AMINO ACIDS IN AQUEOUS SODIUM FLUORIDE SOLUTIONS AT DIFFERENT TEMPERATURES 3.1 INTRODUCTION Proteins are the most vital of all the biological molecules evolved for a variety of specific purposes. To be functional and active, a very specific three dimensional structure is required. An array of vital forces, i.e., hydrophobic interactions, hydrogen bonding, ionic interactions, van der Waals interactions constitute the main forces responsible for the specific structure and conformation of proteins. Some covalent forces like disulphide linkage also contribute in maintaining the structure of protein (Privalov 1979). Hydration of proteins plays a significant role in the stability, dynamic, structural characteristics and fundamental activities of biopolymers. Proteins are complex molecules and their behaviour in solutions is governed by number of specific interactions. To reduce the degree of complexity in the study of these interactions, the study of the interactions in systems containing smaller bio-molecules, such as amino acids and peptides are preferred by many authors (Riyazuddeen and Bansal 2006, Yan et al 1998).
Transcript of CHAPTER 3 PARTIAL MOLAL VOLUME, PARTIAL MOLAL...

48
CHAPTER 3
PARTIAL MOLAL VOLUME, PARTIAL MOLAL
COMPRESSIBILITY AND VISCOSITY B-COEFFICIENT
OF FOUR HOMOLOGOUS -AMINO ACIDS IN AQUEOUS
SODIUM FLUORIDE SOLUTIONS AT DIFFERENT
TEMPERATURES
3.1 INTRODUCTION
Proteins are the most vital of all the biological molecules evolved
for a variety of specific purposes. To be functional and active, a very specific
three dimensional structure is required. An array of vital forces, i.e.,
hydrophobic interactions, hydrogen bonding, ionic interactions, van der
Waals interactions constitute the main forces responsible for the specific
structure and conformation of proteins. Some covalent forces like disulphide
linkage also contribute in maintaining the structure of protein (Privalov 1979).
Hydration of proteins plays a significant role in the stability, dynamic,
structural characteristics and fundamental activities of biopolymers. Proteins
are complex molecules and their behaviour in solutions is governed by
number of specific interactions. To reduce the degree of complexity in the
study of these interactions, the study of the interactions in systems containing
smaller bio-molecules, such as amino acids and peptides are preferred by
many authors (Riyazuddeen and Bansal 2006, Yan et al 1998).

49
The zwitterionic nature of amino acids has an important bearing on
biological functions in the physiological media such as blood, membranes,
cellular fluids etc., where water happens to be important (Zubay 1996). The
properties of proteins such as their structure, solubility, denaturation, activity
of enzymes, etc. are greatly influenced by electrolytes (Von Hippel and
Schleich 1969 a,b, Jencks 1969, Makhatadze and Privalov 1992, Robinson
and Jencks 1965). The apparent and partial molal volumes of electrolyte
solutions have proven to be a very useful tool in elucidating the structural
interactions occurring in solutions (Millero 1971). The partial molal volumes,
which are the first derivative of Gibbs energy with respect to pressure, are
also used to calculate the effect of pressure on ionic equlibria for processes of
engineering and oceanographic importance (Millero 1971). Since amino acids
are zwitterions in aqueous solutions, their hydrations and interactions with
proteins have resemblance with those of electrolytes (Zhao 2006, Millero et al
1978). The compressibility property, which is the second derivative of the
Gibbs energy, also is a sensitive indicator of molecular interactions,
particularly in cases where partial molal volume data fail to provide an
unequivocal interpretation of the interactions (Iqbal and Verrall 1989).
Viscosity has also been proven to be a sensitive and accurate probe for
solution studies (Wang et al 2000).
Study of interactions of some amino acids with KCl/KNO3 at
T= (298.15 to 323.15) K and that of L-alanine with potassium di-hydrogen
citrate and tri-potassium citrate at T = (283.15 to 308.15) K have been
reported by Riyazuddeen and Altamash (2010), Sadeghi and Goodarizi (2008)
respectively. Wang et al (1999) have reported the partial molar volumes of
some -amino acids in aqueous sodium acetate solutions at 308.15K.
Apparent molar volumes and viscosity B-coefficients of caffeine in aqueous
thorium nitrate solutions at T = (298.15, 308.15, and 318.15) K are

50
determined by Sinha et al (2010). The viscosity B-coefficients of some amino
acids have been investigated in aqueous potassium thiocyanate (Wadi and
Goyal 1992), sodium butyrate (Yan et al 2001) and ammonium chloride
(Natarajan et al 1990) solutions. Effect of temperature on volumetric and
viscometric properties of some amino acids in aqueous metformine
hydrochloride (Rajagopal and Jayabalakrishnan 2010c) and salbutamol
sulphate (Rajagopal and Jayabalakrishnan 2009) have also been reported.
The effectiveness of fluoride as anion in stabilising proteins is
greater than chloride, bromide and iodide. Similarly, sodium cation is having
the order of stabilising proteins as Na+ > Li
+ > Ca
2+ > Mg
2+ (Wiggins 1997).
Sodium fluoride is colourless crystalline salt used in the treatment of tooth
decay (Bourne 1986). Literature survey shows that the influence of sodium
fluoride on the volumetric properties of glycylglycine alone has been reported
by Lin et al (2006). In this chapter the data on density, ultrasonic speed and
viscosity of some amino acids (glycine, L-alanine, L-valine and L-leucine) in
aqueous sodium fluoride at T= (303.15, 308.15, 313.15 and 318.15) K are
reported.
Apparent molal volumes (V ), partial molal volumes (V0), Hepler
coefficient (2V
0/ T
2), transfer volumes ( V
0) and hydration number (nH)
are evaluated using density data. Apparent molal compressibility (K ), partial
molal compressibility (K0), transfer compressibility ( K
0) and hydration
number (nH) have been calculated using ultrasonic speed data. Viscosity
B-coefficients of Jones-Dole equation, transfer B-coefficient ( B), variation
of B with temperature (dB/dT), free energy of activation per mole of solvent
µ10*
) and solute ( µ20*
) are estimated from viscosity data. Pair and triplet
interaction coefficients have also been calculated from transfer parameters.
The linear correlation of V0, V
0, K
0, K
0, and B for the homologous

51
series of amino acids have been used to calculate the contribution of charged
end groups (NH3+, COO
-), methylene group (CH2) and other alkyl chain of the
amino acids.
3.2 EXPERIMENTAL
The densities ( ) of the solutions of sodium fluoride are measured
using a single stem pycnometer. The ultrasonic speed (u) are determined
using a multifrequency ultrasonic interferometer (M-84, Mittal make, India)
at a frequency of 2 MHz. Viscosity ( ) are measured by means of a suspended
level Ubbelohde viscometer. Densities, ultrasonic speeds and viscosities are
measured at temperatures T = (303.15, 308.15, 313.15 and 318.15) K as
discussed in detail in Chapter 2.
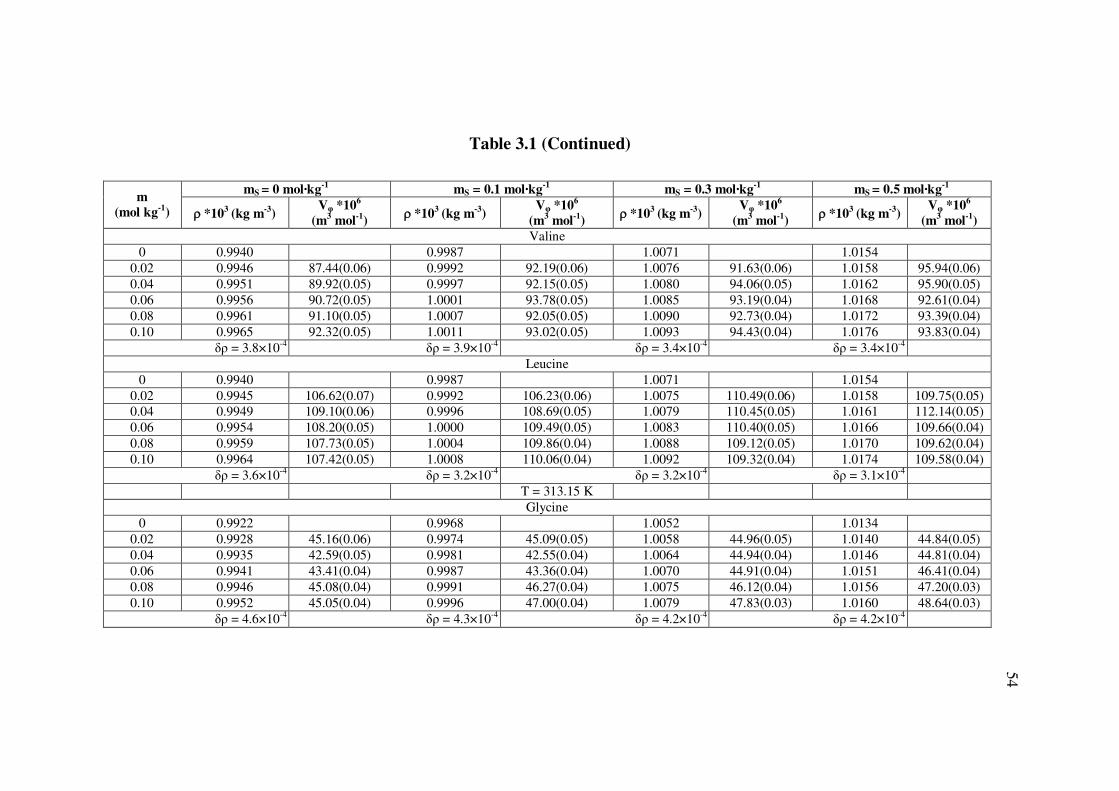
3.3 RESULTS
The experimental densities of the homologous – amino acids in
aqueous sodium fluoride solutions at temperatures T = (303.15, 308.15,
313.15 and 318.15) K are given in Table 3.1. The uncertainty values for
density are calculated and are included in Table 3.1. Throughout this chapter
m denotes molality of amino acids and mS molality of sodium fluoride.
The apparent molal volumes (V ) are calculated from the measured
densities using the equation (1.1) and the error values associated with them
are evaluated using equation (1.2) and are given in Table 3.1.

52
Table 3.1 Density, and apparent molal volume, V of – amino acids in aqueous sodium fluoride solutions at
different temperatures
mS = 0 mol·kg-1
mS = 0.1 mol·kg-1
mS = 0.3 mol·kg-1
mS = 0.5 mol·kg-1
m
(mol kg-1
)*10
3
(kg m-3
)
V *106
(m3 mol
-1)
*103
(kg m-3
)
V *106
(m3 mol
-1)
*103
(kg m-3
)
V *106
(m3 mol
-1)
*103
(kg m-3
)
V *106
(m3 mol
-1)
T = 303.15 K
Glycine
0 0.9956 1.0002 1.0088 1.0171
0.02 0.9962 45.11 (0.06) 1.0008 45.04(0.06) 1.0094 44.91(0.05) 1.0177 44.78(0.05)
0.04 0.9969 42.56(0.05) 1.0015 42.51(0.05) 1.0101 42.43(0.04) 1.0183 44.76(0.04)
0.06 0.9975 43.37(0.04) 1.0021 43.32(0.04) 1.0106 44.86(0.04) 1.0188 46.34(0.04)
0.08 0.9981 43.77(0.04) 1.0027 43.71(0.04) 1.0111 46.06(0.04) 1.0195 44.70(0.04)
0.1 0.9987 43.99(0.04) 1.0031 45.93(0.04) 1.0117 45.79(0.04) 1.0200 45.64(0.04)
= 4.8×10-4 = 4.5×10-4 = 4.4×10-4 = 4.4×10⁻⁴
Alanine
0 0.9956 1.0002 1.0088 1.0171
0.02 0.9962 59.18 (0.06) 1.0008 59.05 (0.06) 1.0093 63.72 (0.06) 1.0176 63.39 (0.05)
0.04 0.9968 59.15 (0.05) 1.0013 61.52 (0.05) 1.0099 61.22 (0.05) 1.0181 63.36 (0.04)
0.06 0.9973 60.80 (0.05) 1.0019 60.65 (0.04) 1.0104 62.01 (0.04) 1.0186 63.33 (0.04)
0.08 0.9978 61.60 (0.04) 1.0024 61.45 (0.04) 1.0110 61.16 (0.04) 1.0191 63.30 (0.04)
0.1 0.9984 61.06 (0.04) 1.0028 62.92 (0.04) 1.0115 61.62 (0.04) 1.0197 62.30 (0.04)
= 4.2×10-4 = 4.0×10-4 = 4.2×10-4 = 3.9×10⁻⁴
Valine
0 0.9956 1.0002 1.0088 1.0171
0.02 0.9962 87.35 (0.07) 1.0007 92.09 (0.06) 1.0093 91.52 (0.06) 1.0175 95.81 (0.06)
0.04 0.9966 92.35 (0.06) 1.0012 92.04 (0.05) 1.0097 93.94 (0.05) 1.0180 93.35 (0.05)
0.06 0.9972 90.62 (0.05) 1.0017 92.00 (0.05) 1.0102 93.07 (0.05) 1.0185 92.50 (0.05)
0.08 0.9978 89.73 (0.05) 1.0022 91.95 (0.05) 1.0107 92.62 (0.04) 1.0189 93.27 (0.04)
0.1 0.9982 91.20 (0.05) 1.0026 92.91 (0.05) 1.0111 93.31 (0.04) 1.0194 92.74 (0.04)
= 4.0×10-4 = 3.7×10-4 = 3.5×10-4 = 3.5×10⁻⁴

53
Table 3.1 (Continued)
mS = 0 mol·kg-1
mS = 0.1 mol·kg-1
mS = 0.3 mol·kg-1
mS = 0.5 mol·kg-1
m
(mol kg-1
) *103
(kg m-3
)V *10
6
(m3 mol
-1)
*103
(kg m-3
)V *10
6
(m3 mol
-1)
*103
(kg m-3
)V *10
6
(m3 mol
-1)
*103
(kg m-3
)V *10
6
(m3 mol
-1)
= 4.0×10-4 = 3.7×10-4 = 3.5×10-4 = 3.5×10⁻⁴
Leucine
0 0.9956 1.0002 1.0088 1.0171
0.02 0.9961 106.48(0.07) 1.0007 106.11(0.06) 1.0092 110.34(0.06) 1.0175 109.60(0.05)
0.04 0.9965 108.96(0.06) 1.0011 108.57(0.05) 1.0096 110.30(0.05) 1.0179 109.56(0.05)
0.06 0.9970 108.07(0.06) 1.0016 107.68(0.05) 1.0101 108.61(0.05) 1.0183 109.51(0.04)
0.08 0.9975 107.59(0.05) 1.0019 109.73(0.05) 1.0105 108.97(0.05) 1.0186 110.69(0.04)
0.1 0.9981 106.27(0.05) 1.0023 109.93(0.04) 1.0110 108.18(0.05) 1.0191 109.43(0.04)
= 3.8×10-4 = 3.2×10-4 = 3.4×10-4 = 3.0×10⁻⁴
T = 308.15 K
Glycine
0 0.9940 0.9987 1.0071 1.0154
0.02 0.9946 45.13(0.06) 0.9993 45.06(0.06) 1.0077 44.94(0.05) 1.016 44.81(0.05)
0.04 0.9953 42.57(0.05) 1.0000 42.53(0.04) 1.0083 44.91(0.04) 1.0166 44.78(0.04)
0.06 0.9959 43.39(0.04) 1.0006 43.34(0.04) 1.0089 44.88(0.04) 1.0171 46.37(0.04)
0.08 0.9965 43.78(0.04) 1.0011 44.98(0.04) 1.0094 46.09(0.04) 1.0177 45.94(0.03)
0.10 0.9970 45.02(0.04) 1.0016 45.96(0.04) 1.0100 45.82(0.04) 1.0181 47.62(0.03)
= 4.6×10-4 = 4.5×10-4 = 4.4×10-4 = 4.2×10⁻⁴
Alanine
0 0.994 0.9987 1.0071 1.0154
0.02 0.9946 59.23(0.06) 0.9992 64.11(0.06) 1.0076 63.78(0.05) 1.0159 63.46(0.05)
0.04 0.9952 59.19(0.05) 0.9998 61.57(0.05) 1.0081 63.75(0.04) 1.0164 63.43(0.04)
0.06 0.9957 60.85(0.05) 1.0004 60.70(0.04) 1.0087 62.07(0.04) 1.0169 63.40(0.04)
0.08 0.9962 61.66(0.05) 1.0009 61.50(0.04) 1.0092 62.45(0.04) 1.0173 64.58(0.03)
0.10 0.9968 61.12(0.05) 1.0015 60.96(0.04) 1.0097 62.67(0.04) 1.0178 64.31(0.03)
= 4.6×10-4 = 4.3×10-4 = 4.0×10-4 = 3.6×10⁻⁴
54
Table 3.1 (Continued)
mS = 0 mol·kg-1
mS = 0.1 mol·kg-1
mS = 0.3 mol·kg-1
mS = 0.5 mol·kg-1
m
(mol kg-1
) *103
(kg m-3
)V *10
6
(m3 mol
-1)
*103
(kg m-3
)V *10
6
(m3 mol
-1)
*103
(kg m-3
)V *10
6
(m3 mol
-1)
*103
(kg m-3
)V *10
6
(m3 mol
-1)
Valine
0 0.9940 0.9987 1.0071 1.0154
0.02 0.9946 87.44(0.06) 0.9992 92.19(0.06) 1.0076 91.63(0.06) 1.0158 95.94(0.06)
0.04 0.9951 89.92(0.05) 0.9997 92.15(0.05) 1.0080 94.06(0.05) 1.0162 95.90(0.05)
0.06 0.9956 90.72(0.05) 1.0001 93.78(0.05) 1.0085 93.19(0.04) 1.0168 92.61(0.04)
0.08 0.9961 91.10(0.05) 1.0007 92.05(0.05) 1.0090 92.73(0.04) 1.0172 93.39(0.04)
0.10 0.9965 92.32(0.05) 1.0011 93.02(0.05) 1.0093 94.43(0.04) 1.0176 93.83(0.04)
= 3.8×10-4 = 3.9×10-4 = 3.4×10-4 = 3.4×10⁻⁴
Leucine
0 0.9940 0.9987 1.0071 1.0154
0.02 0.9945 106.62(0.07) 0.9992 106.23(0.06) 1.0075 110.49(0.06) 1.0158 109.75(0.05)
0.04 0.9949 109.10(0.06) 0.9996 108.69(0.05) 1.0079 110.45(0.05) 1.0161 112.14(0.05)
0.06 0.9954 108.20(0.05) 1.0000 109.49(0.05) 1.0083 110.40(0.05) 1.0166 109.66(0.04)
0.08 0.9959 107.73(0.05) 1.0004 109.86(0.04) 1.0088 109.12(0.05) 1.0170 109.62(0.04)
0.10 0.9964 107.42(0.05) 1.0008 110.06(0.04) 1.0092 109.32(0.04) 1.0174 109.58(0.04)
= 3.6×10-4 = 3.2×10-4 = 3.2×10-4 = 3.1×10⁻⁴
T = 313.15 K
Glycine
0 0.9922 0.9968 1.0052 1.0134
0.02 0.9928 45.16(0.06) 0.9974 45.09(0.05) 1.0058 44.96(0.05) 1.0140 44.84(0.05)
0.04 0.9935 42.59(0.05) 0.9981 42.55(0.04) 1.0064 44.94(0.04) 1.0146 44.81(0.04)
0.06 0.9941 43.41(0.04) 0.9987 43.36(0.04) 1.0070 44.91(0.04) 1.0151 46.41(0.04)
0.08 0.9946 45.08(0.04) 0.9991 46.27(0.04) 1.0075 46.12(0.04) 1.0156 47.20(0.03)
0.10 0.9952 45.05(0.04) 0.9996 47.00(0.04) 1.0079 47.83(0.03) 1.0160 48.64(0.03)
= 4.6×10-4 = 4.3×10-4 = 4.2×10-4 = 4.2×10⁻⁴

55
Table 3.1 (Continued)
mS = 0 mol·kg-1
mS = 0.1 mol·kg-1
mS = 0.3 mol·kg-1
mS = 0.5 mol·kg-1
m
(mol kg-1
) *103
(kg m-3
)V *10
6
(m3 mol
-1)
*103
(kg m-3
)V *10
6
(m3 mol
-1)
*103
(kg m-3
)V *10
6
(m3 mol
-1)
*103
(kg m-3
)V *10
6
(m3 mol
-1)
Alanine
0 0.9922 0.9968 1.0052 1.0134
0.02 0.9928 59.28(0.06) 0.9973 64.18(0.06) 1.0057 63.86(0.05) 1.0139 63.54(0.05)
0.04 0.9933 61.79(0.05) 0.9979 61.63(0.04) 1.0062 63.82(0.04) 1.0144 63.51(0.04)
0.06 0.9939 60.91(0.04) 0.9984 62.44(0.04) 1.0067 63.79(0.04) 1.0148 65.10(0.04)
0.08 0.9943 62.99(0.04) 0.9989 62.82(0.04) 1.0072 63.76(0.04) 1.0152 65.89(0.03)
0.10 0.9949 62.19(0.04) 0.9994 63.04(0.04) 1.0077 63.73(0.04) 1.0157 65.37(0.03)
= 4.0×10-4 = 4.0×10-4 = 3.8×10-4 = 3.4×10⁻⁴
Valine
0 0.9922 0.9968 1.0052 1.0134
0.02 0.9927 92.63(0.07) 0.9973 92.32(0.06) 1.0056 96.71(0.06) 1.0138 96.09(0.05)
0.04 0.9933 90.04(0.06) 0.9977 94.80(0.05) 1.0061 94.19(0.05) 1.0142 96.05(0.05)
0.06 0.9938 90.84(0.05) 0.9983 92.23(0.05) 1.0065 94.98(0.04) 1.0147 94.38(0.04)
0.08 0.9943 91.21(0.05) 0.9987 93.45(0.05) 1.0070 94.11(0.04) 1.0150 95.97(0.04)
0.10 0.9948 91.42(0.05) 0.9991 94.16(0.04) 1.0074 94.56(0.04) 1.0156 93.97(0.04)
= 4.0×10-4 = 3.6×10-4 = 3.4×10-4 = 3.3×10⁻⁴
Leucine
0 0.9922 0.9968 1.0052 1.0134
0.02 0.9926 111.85(0.07) 0.9972 111.43(0.06) 1.0056 110.66(0.05) 1.0138 109.93(0.05)
0.04 0.9932 106.71(0.06) 0.9977 108.86(0.05) 1.0060 110.62(0.05) 1.0141 112.33(0.04)
0.06 0.9937 106.66(0.05) 0.9981 109.65(0.05) 1.0063 112.23(0.04) 1.0144 113.11(0.04)
0.08 0.9941 107.88(0.05) 0.9985 110.03(0.05) 1.0068 110.53(0.04) 1.0149 111.02(0.04)
0.10 0.9945 108.60(0.05) 0.9990 109.22(0.05) 1.0072 110.49(0.04) 1.0154 109.75(0.04)
= 3.6×10-4 = 3.3×10-4 = 3.0×10-4 = 3.0×10⁻⁴

56
Table 3.1 (Continued)
mS = 0 mol·kg-1
mS = 0.1 mol·kg-1
mS = 0.3 mol·kg-1
mS = 0.5 mol·kg-1
m
(mol kg-1
) *103
(kg m-3
)V *10
6
(m3 mol
-1)
*103
(kg m-3
)V *10
6
(m3 mol
-1)
*103
(kg m-3
)V *10
6
(m3 mol
-1)
*103
(kg m-3
)V *10
6
(m3 mol
-1)
T = 318.15 K
Glycine
0 0.9902 0.9945 1.0029 1.0111
0.02 0.9908 45.19(0.06) 0.9951 45.13(0.05) 1.0035 45.00(0.05) 1.0117 44.87(0.05)
0.04 0.9914 45.16(0.05) 0.9957 45.10(0.04) 1.0041 44.97(0.04) 1.0123 44.85(0.04)
0.06 0.9921 43.43(0.04) 0.9964 43.38(0.04) 1.0046 46.60(0.04) 1.0128 46.45(0.03)
0.08 0.9926 45.11(0.04) 0.9968 46.31(0.04) 1.0051 47.41(0.03) 1.0131 49.69(0.03)
0.10 0.9932 45.08(0.04) 0.9972 48.06(0.04) 1.0055 48.88(0.03) 1.0136 49.67(0.03)
= 4.6×10-4 = 4.2×10-4 = 4.0×10-4 = 3.8×10⁻⁴
Alanine
0 0.9902 0.9945 1.0029 1.0111
0.02 0.9907 64.44(0.06) 0.9950 64.27(0.06) 1.0034 63.94(0.05) 1.0116 63.63(0.05)
0.04 0.9914 59.30(0.05) 0.9955 64.24(0.05) 1.0039 63.91(0.04) 1.0120 66.04(0.04)
0.06 0.9919 60.97(0.05) 0.996 64.21(0.04) 1.0043 65.54(0.04) 1.0125 65.20(0.03)
0.08 0.9924 61.79(0.04) 0.9966 62.91(0.04) 1.0048 65.10(0.03) 1.0129 65.99(0.03)
0.10 0.9930 61.24(0.04) 0.9971 63.13(0.04) 1.0052 65.81(0.03) 1.0133 66.45(0.03)
= 4.3×10-4 = 4.0×10-4 = 3.5×10-4 = 3.4×10⁻⁴
Valine
0 0.9902 0.9945 1.0029 1.0111
0.02 0.9907 92.77(0.07) 0.9950 92.47(0.05) 1.0033 96.89(0.05) 1.0115 96.26(0.05)
0.04 0.9912 92.72(0.06) 0.9955 92.43(0.05) 1.0038 94.36(0.05) 1.0119 96.22(0.04)
0.06 0.9918 90.97(0.05) 0.9959 94.07(0.04) 1.0042 95.15(0.04) 1.0124 94.55(0.04)
0.08 0.9923 91.34(0.05) 0.9962 96.15(0.04) 1.0045 96.77(0.04) 1.0126 97.38(0.04)
0.10 0.9928 91.55(0.05) 0.9967 95.34(0.04) 1.0051 94.73(0.04) 1.0130 97.10(0.04)
= 4.0×10-4 = 3.3×10-4 = 3.3×10-4 = 2.9×10⁻⁴

57
Table 3.1 (Continued)
mS = 0 mol·kg-1
mS = 0.1 mol·kg-1
mS = 0.3 mol·kg-1
mS = 0.5 mol·kg-1
m
(mol kg-1
) *103
(kg m-3
)V *10
6
(m3 mol
-1)
*103
(kg m-3
)V *10
6
(m3 mol
-1)
*103
(kg m-3
)V *10
6
(m3 mol
-1)
*103
(kg m-3
)V *10
6
(m3 mol
-1)
Leucine
0 0.9902 0.9945 1.0029 1.0111
0.02 0.9907 106.93(0.06) 0.9949 111.64(0.06) 1.0033 110.87(0.05) 1.0115 110.13(0.04)
0.04 0.9911 109.43(0.05) 0.9954 109.06(0.05) 1.0036 113.32(0.05) 1.0118 112.54(0.04)
0.06 0.9916 108.53(0.05) 0.9958 109.85(0.05) 1.0040 112.45(0.04) 1.0121 113.33(0.04)
0.08 0.9920 109.33(0.05) 0.9961 111.50(0.05) 1.0044 111.99(0.04) 1.0125 112.47(0.04)
0.10 0.9924 109.80(0.05) 0.9966 110.44(0.04) 1.0049 110.70(0.04) 1.0128 112.92(0.04)
= 3.4×10-4 = 3.2×10-4 = 3.0×10-4 = 2.6×10⁻⁴
Values within parenthesis indicates the error inV

58
Usually the partial molal volumes (V0) are obtained using the
equation (1.3) by the method of least squares. However in the cases where
molality dependence of V is found to be either negligible or having no
definite trend, the partial molal volumes at infinite dilution, V0
are evaluated
by taking an average of all the data points ( Bhat and Ahluwalia 1985, Wang
et al 1999, Yan et al 2004). In the present case, the values of V0 are evaluated
by taking an average of all the data points. The values of partial molal
volumes V0, along with the literature values of partial molal volumes of
amino acids in water, are given in Table 3.2.
Table 3.2 Partial molal volume (0
V ) of – amino acids in aqueous
sodium fluoride solutions at different temperatures
0V * 106 / m3 mol-1 at various ms / mol kg-1
0.00 (Water)Amino
AcidPresent Work Literature 0.1 0.3 0.5
T = 303.15 K
Glycine 43.76 (0.42) 39.5a 43.59b 43.89c 44.10 (0.61) 44.81 (0.64) 45.25 (0.32)
Alanine 60.36 (0.50) 59.80a 60.63c 61.12 (0.63) 61.94 (0.47) 63.14 (0.21)
Valine 90.25 (0.84) 90.22c 92.20 (0.18) 92.89 (0.40) 93.53 (0.59)
Leucine 107.48 (0.50) - 108.40 (0.70) 109.28 (0.44) 109.76 (0.23)
T = 308.15 K
Glycine 43.98(0.49) 43.90d 43.98e 44.37(0.63) 45.33(0.26) 45.90(0.53)
Alanine 60.41(0.51) 60.44d 60.88e 61.77(0.61) 62.94(0.35) 63.84(0.25)
Valine 90.30(0.81) 91.42f 91.51g 92.64(0.33) 93.21(0.50) 94.33(0.68)
Leucine 107.81(0.41) 108.40 i 108.87(0.70) 109.96(0.30) 110.15(0.50)
T = 313.15 K
Glycine 44.26(0.53) 44.15c 44.52j 44.85(0.84) 45.75(0.57) 46.38(0.73)
Alanine 61.43(0.63) 61.35f 62.9b 62.82(0.42) 63.79(0.02) 64.68(0.45)
Valine 91.23(0.42) 91.58 f 93.39(0.50) 94.91(0.48) 95.29(0.46)
Leucine 108.34(0.95) 109.00k 109.84(0.44) 110.91(0.33) 111.23(0.48)
T = 318.15 K
Glycine 44.79(0.34) 44.17l 45.59(0.77) 46.57(0.74) 47.11(1.09)
Alanine 61.55(0.83) 61.46g 63.75(0.30) 64.86(0.40) 65.46(0.50)
Valine 91.87(0.37) 91.93l 94.09(0.75) 95.58(0.53) 96.30(0.49)
Leucine 108.80(0.51) 109.37g 110.50(0.49) 111.87(0.49) 112.28(0.50)
Values within parenthesis indicates the error in0
V
a Yan et al (2004),
b Bhattacharya and Sengupta (1985),
c Lark and Bala (1983),
d Munde
and Kishore (2003),e Lark et al (2004),
f Gopal and Agarwal (1973),
g Kikuchi et al (1995),
i Yan et al (1999),
j Zhao et al (2004),
k Duke et al (1994),
l Banipal and Kapoor (1999).

59
The contribution of the zwitterionic end group V0
(NH3+, COO
-),
the methylene group V0(CH2) and other alkyl chains of homologous series of
amino acids to V0
at different temperatures are evaluated using equations (1.4) to
(1.7) and are reported in Table 3.3.
Table 3.3 Contributions of zwitterionic groups (NH3+, COO
-), CH2 and
other alkyl side chains to partial molal volumes (0
V ) of
– amino acids in aqueous sodium fluoride solutions at
different temperatures
0V * 10
6 / m
3 mol
-1 at various ms / mol kg
-1
Group0.00 (Water) 0.1 0.3 0.5
T = 303.15 K
NH3+, COO
-28.26 28.55 29.26 30.09
CH2- 15.73 15.96 15.98 15.94
CH3CH- 31.46 31.92 31.96 31.88
(CH3)2CHCH- 62.92 63.84 63.92 63.76
(CH3)2CH CH2 CH - 78.65 79.80 79.90 79.70
T = 308.15 K
NH3+, COO
-28.35 28.95 30.00 30.86
CH2- 15.75 15.98 15.95 15.89
CH3CH- 31.50 31.96 31.90 31.78
(CH3)2CHCH- 63.00 63.92 63.80 63.56
(CH3)2CH CH2 CH - 78.75 79.90 79.75 79.45
T = 313.15 K
NH3+, COO
-28.92 29.56 30.41 31.41
CH2- 15.79 16.05 16.14 15.96
CH3CH- 31.58 32.10 32.28 31.92
(CH3)2CHCH- 63.16 64.20 64.56 63.84
(CH3)2CH CH2 CH - 78.95 80.25 80.70 79.80
T = 318.15 K
NH3+, COO
-29.25 30.44 31.32 31.93
CH2- 15.83 16.01 16.13 16.11
CH3CH- 31.66 32.02 32.26 32.22
(CH3)2CHCH- 63.32 64.04 64.52 64.44
(CH3)2CH CH2 CH - 79.15 80.05 80.65 80.55

60
The partial molal volumes of transfer 0
V of amino acids from
pure water to sodium fluoride water mixtures are calculated using
equation (1.8) and the results are given in Table 3.4.
Table 3.4 Partial molal volume of transfer (0
V ) of – amino acids in
aqueous sodium fluoride solutions at different temperatures
0V * 10
6 / m
3 mol
-1 at various ms / mol kg
-1
Amino Acid0.1 0.3 0.5
T = 303.15 K
Glycine 0.34 1.05 1.49
Alanine 0.76 1.58 2.78
Valine 1.95 2.64 3.28
Leucine 0.92 1.80 2.28
T = 308.15 K
Glycine 0.39 1.35 1.92
Alanine 1.36 2.53 3.43
Valine 2.34 2.91 4.03
Leucine 1.06 2.15 2.34
T = 313.15 K
Glycine 0.59 1.49 2.12
Alanine 1.39 2.36 3.25
Valine 2.16 3.68 4.06
Leucine 1.50 2.57 2.89
T = 318.15 K
Glycine 0.80 1.78 2.32
Alanine 2.20 3.31 3.91
Valine 2.22 3.71 4.43
Leucine 1.70 3.07 3.48
The zwitterionic end group contribution V0
(NH3+, COO
-), the
methylene group contribution V0
(CH2) and the contribution from other
alkyl chains of homologous series of amino acids to V0
are evaluated using
equations (1.4) to (1.7) and are given in Table 3.5

61
Table 3.5 Contributions of zwitterionic groups (NH3+, COO
-), CH2 and
other alkyl side chains to partial molal volumes of transfer
(0
V ) of – amino acids in aqueous sodium fluoride
solutions at different temperatures
0V * 10
6 / m
3 mol
-1 at various ms / mol kg
-1
Group0.1 0.3 0.5
T = 303.15 K
NH3+, COO
-0.287 1.000 1.830
CH2- 0.235 0.256 0.208
CH3CH- 0.470 0.512 0.416
(CH3)2CHCH- 0.940 1.024 0.832
(CH3)2CH CH2 CH - 1.175 1.280 1.040
T = 308.15 K
NH3+, COO
-0.594 1.642 2.500
CH2- 0.229 0.196 0.143
CH3CH- 0.458 0.392 0.286
(CH3)2CHCH- 0.916 0.784 0.572
(CH3)2CH CH2 CH - 1.145 0.980 0.715
T = 313.15 K
NH3+, COO
-0.638 1.485 2.488
CH2- 0.257 0.347 0.170
CH3CH- 0.514 0.694 0.340
(CH3)2CHCH- 1.028 1.388 0.680
(CH3)2CH CH2 CH - 1.285 1.735 0.850
T = 318.15 K
NH3+, COO
-1.187 2.076 2.680
CH2- 0.181 0.296 0.284
CH3CH- 0.362 0.592 0.568
(CH3)2CHCH- 0.724 1.184 1.136
(CH3)2CH CH2 CH - 0.905 1.480 1.420
The standard partial molal volumes of amino acids are used to
determine the number of water molecules, nH, hydrated to the amino acid by
using equations (1.9) to (1.13) and are given in Table 3.6.
The hydration number nH values evaluated from the compressibility
data using the standard equation (1.18) are also presented in Table 3.6.

62
Table 3.6 Hydration number (nH) of – amino acids in aqueous sodium
fluoride solutions at different temperatures
nH at various ms / mol kg-1
0.1 0.3 0.5Amino
AcidFrom
volume
data
From
compressibility
data
From
volume
data
From
compressibility
data
From
volume
data
From
compressibility
data
T = 303.15 K
Glycine 1.87 2.73 1.69 2.25 1.58 1.88
Alanine 2.26 2.73 2.05 2.41 1.75 2.12
Valine 3.24 2.76 3.07 2.61 2.91 2.40
Leucine 3.30 2.63 3.08 2.51 2.96 2.36
T = 308.15 K
Glycine 1.80 2.36 1.56 1.92 1.42 1.44
Alanine 2.09 2.44 1.80 2.15 1.58 1.83
Valine 3.13 2.23 2.99 2.21 2.71 1.88
Leucine 3.19 2.38 2.91 2.33 2.86 2.23
T = 313.15 K
Glycine 1.68 2.01 1.46 1.52 1.30 1.09
Alanine 1.83 2.14 1.59 1.82 1.36 1.54
Valine 2.94 2.18 2.56 1.97 2.47 1.57
Leucine 2.94 2.08 2.68 2.00 2.60 1.94
T = 318.15 K
Glycine 1.50 1.67 1.25 1.15 1.12 0.83
Alanine 1.60 1.80 1.32 1.43 1.17 1.19
Valine 2.77 1.92 2.40 1.60 2.21 1.34
Leucine 2.78 2.02 2.44 1.96 2.33 1.85
On the basis of McMillan-Mayer theory (McMillan and Mayer
1945) of solutions, Friedman and Krishnan (1973 b) considered that the
thermodynamic transfer properties of solutes in aqueous solutions could be
explained in terms of the cosolutes interaction. The pair and triplet volume
interaction parameters are obtained by fitting transfer data to equation (1.14).

63
The pair and triplet compressibility interaction coefficients VAB /
KAB / AB and VABB / KABB / ABB are given in Table 3.7.
Table 3.7 Pair interaction coefficients, VAB / KAB / AB and Triplet
interaction coefficients VABB / KABB / ABB of – amino acids
in aqueous sodium fluoride solutions at different
temperatures
Amino
Acid
VAB * 106
m3mol
-2kg
VABB * 106
m3
mol-3
kg2
KAB * 1014
m3
mol-1
kg Pa-1
KABB * 1014
m3mol
-1kg Pa
-1AB * 10
3
m3
mol-2
kgABB * 10
3
m3
mol-3
kg2
T = 303.15 K
Glycine 1.825 -0.390 1.827 -1.125 0.043 -0.042
Alanine 3.842 -1.676 0.755 -0.168 0.028 -0.022
Valine 10.665 -10.783 0.561 -0.267 0.031 -0.012
Leucine 5.065 -3.920 1.075 -0.967 0.015 -0.002
T = 308.15 K
Glycine2.070 -0.062 2.481 -1.883 0.004 0.011
Alanine 7.330 -5.600 0.923 -0.383 0.014 -0.007
Valine 10.575 -12.737 0.890 -0.717 0.049 -0.053
Leucine 5.920 -4.880 0.250 -0.133 0.037 -0.030
T = 313.15 K
Glycine 3.169 -1.422 3.253 -2.758 0.025 -0.022
Alanine 7.495 -6.183 1.055 -0.533 0.017 -0.012
Valine 12.060 -11.237 0.775 -0.233 0.056 0.062
Leucine 8.475 -8.213 0.338 -0.227 0.039 -0.030
T = 318.15 K
Glycine 4.359 -2.814 4.604 -4.453 0.027 -0.032
Alanine 12.145 -11.840 1.347 -0.533 0.027 -0.020
Valine 12.260 -11.147 1.504 -1.083 0.033 -0.030
Leucine 9.575 -8.887 0.202 -0.100 0.015 0.007
The variation of limiting partial molal volume V0 with temperature
is expressed using the quadratic equation (1.15) (Pal and Kumar 2004). The

64
coefficients a, b and c are determined and these coefficients are used to
interpret the effect of the hydrocarbon chain on water structure using the
general hydrophobicity criteria proposed by Hepler (1969). The values of a, b
and c are given in Table 3.8.
Table 3.8 Temperature coefficients, a, b and c of – amino acids in
aqueous sodium fluoride solutions
Amino
Acida coefficient
b coefficient
m3·mol
-1·K
-1
c coefficient
m6·mol
-2·K
-2
ms = 0.1 / mol kg-1
Glycine 467.87 -2.826 0.005
Alanine 274.11 -1.543 0.003
Valine 310.76 -1.531 0.003
Leucine 254.97 -1.083 0.002
ms = 0.3 / mol kg-1
Glycine 298.85 -1.746 0.003
Alanine 72.57 -0.251 0.001
Valine 372.95 -1.991 0.004
Leucine 326.47 -1.565 0.003
ms = 0.5 / mol kg-1
Glycine 75.10 -0.308 0.001
Alanine 95.94 -0.360 0.001
Valine 235.85 -1.094 0.002
Leucine 690.28 -3.905 0.007
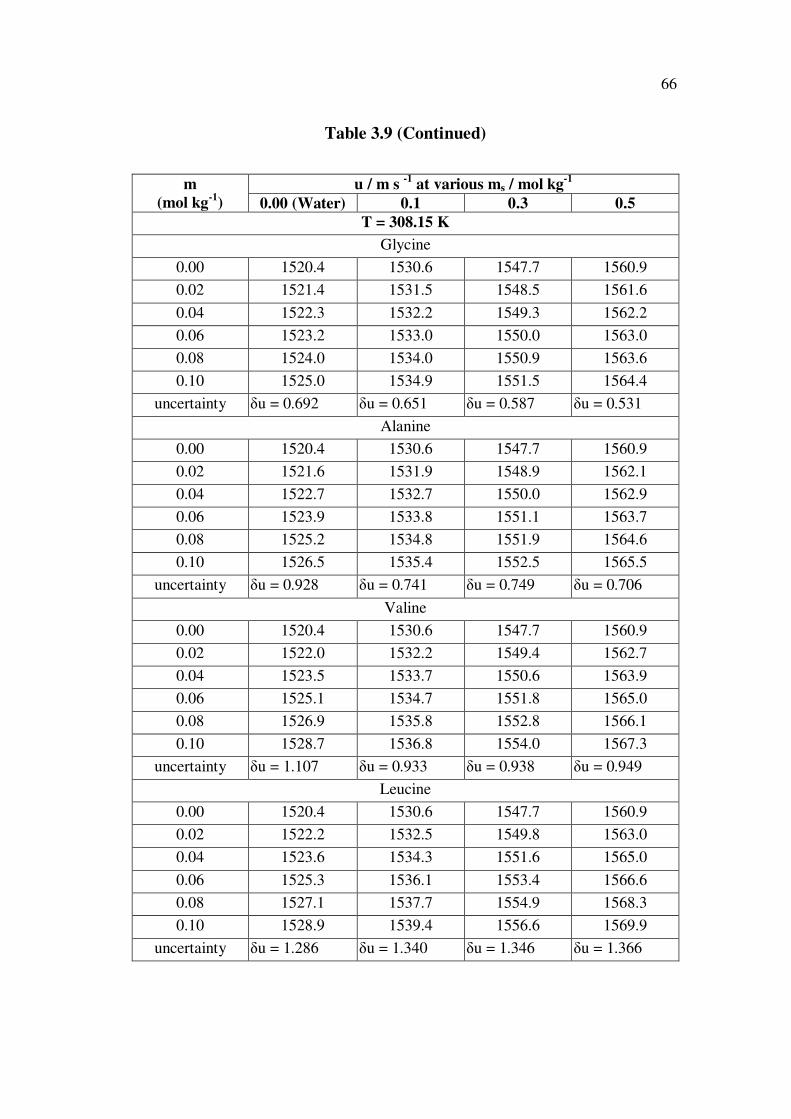
The ultrasonic speed values of the homologous – amino acids in
aqueous sodium fluoride solutions at temperatures T = (303.15, 308.15,
313.15 and 318.15) K are given in Table 3.9. The uncertainty values u for
ultrasonic speed are calculated and are included in Table 3.9.

65
Table 3.9 Ultrasonic speed (u) of – Amino acids in Aqueous Sodium
Fluoride solutions at different temperatures
u / m s-1
at various ms / mol kg-1
m
(mol kg-1
) 0.00 (Water) 0.1 0.3 0.5
T = 303.15 K
Glycine
0.00 1512.0 1521.3 1538.7 1552.3
0.02 1513.1 1522.3 1539.6 1553.1
0.04 1513.9 1523.1 1540.3 1553.9
0.06 1514.9 1524.1 1541.3 1554.8
0.08 1515.9 1525.0 1542.2 1555.3
0.10 1516.8 1526.2 1543.0 1556.0
uncertainty u = 0.729 u = 0.734 u = 0.661 u = 0.569
Alanine
0.00 1512.0 1521.3 1538.7 1552.3
0.02 1513.2 1522.5 1540.0 1553.5
0.04 1514.3 1523.6 1540.9 1554.7
0.06 1515.5 1524.4 1541.9 1555.4
0.08 1516.6 1525.5 1542.5 1556.3
0.10 1517.4 1526.6 1543.6 1556.9
uncertainty u = 0.839 u = 0.793 u = 0.723 u = 0.706
Valine
0.00 1512.0 1521.3 1538.7 1552.3
0.02 1513.6 1523.0 1540.5 1554.2
0.04 1515.3 1524.4 1541.7 1555.4
0.06 1516.3 1525.7 1542.7 1556.6
0.08 1517.5 1526.4 1543.7 1557.5
0.10 1518.9 1527.6 1544.8 1558.6
uncertainty u = 1.027 u = 0.946 u = 0.903 u = 0.943
Leucine
0.00 1512.0 1521.3 1538.7 1552.3
0.02 1514.0 1523.2 1540.8 1554.4
0.04 1515.8 1525.1 1542.7 1556.4
0.06 1517.3 1526.9 1544.2 1557.9
0.08 1518.9 1528.5 1545.8 1559.8
0.10 1520.3 1529.9 1547.3 1561.4
uncertainty u = 1.262 u = 1.327 u = 1.301 u = 1.381
66
Table 3.9 (Continued)
u / m s-1
at various ms / mol kg-1
m
(mol kg-1
) 0.00 (Water) 0.1 0.3 0.5
T = 308.15 K
Glycine
0.00 1520.4 1530.6 1547.7 1560.9
0.02 1521.4 1531.5 1548.5 1561.6
0.04 1522.3 1532.2 1549.3 1562.2
0.06 1523.2 1533.0 1550.0 1563.0
0.08 1524.0 1534.0 1550.9 1563.6
0.10 1525.0 1534.9 1551.5 1564.4
uncertainty u = 0.692 u = 0.651 u = 0.587 u = 0.531
Alanine
0.00 1520.4 1530.6 1547.7 1560.9
0.02 1521.6 1531.9 1548.9 1562.1
0.04 1522.7 1532.7 1550.0 1562.9
0.06 1523.9 1533.8 1551.1 1563.7
0.08 1525.2 1534.8 1551.9 1564.6
0.10 1526.5 1535.4 1552.5 1565.5
uncertainty u = 0.928 u = 0.741 u = 0.749 u = 0.706
Valine
0.00 1520.4 1530.6 1547.7 1560.9
0.02 1522.0 1532.2 1549.4 1562.7
0.04 1523.5 1533.7 1550.6 1563.9
0.06 1525.1 1534.7 1551.8 1565.0
0.08 1526.9 1535.8 1552.8 1566.1
0.10 1528.7 1536.8 1554.0 1567.3
uncertainty u = 1.107 u = 0.933 u = 0.938 u = 0.949
Leucine
0.00 1520.4 1530.6 1547.7 1560.9
0.02 1522.2 1532.5 1549.8 1563.0
0.04 1523.6 1534.3 1551.6 1565.0
0.06 1525.3 1536.1 1553.4 1566.6
0.08 1527.1 1537.7 1554.9 1568.3
0.10 1528.9 1539.4 1556.6 1569.9
uncertainty u = 1.286 u = 1.340 u = 1.346 u = 1.366

67
Table 3.9 (Continued)
u / m s-1
at various ms / mol kg-1
m
(mol kg-1
) 0.00 (Water) 0.1 0.3 0.5
T = 313.15 K
Glycine
0.00 1528.0 1540.1 1555.8 1566.4
0.02 1529.0 1540.9 1556.5 1567.0
0.04 1529.8 1541.5 1557.1 1567.5
0.06 1530.7 1542.1 1557.7 1568.2
0.08 1531.8 1543.1 1558.4 1568.9
0.10 1532.7 1543.9 1559.3 1569.7
uncertainty u = 0.716 u = 0.537 u = 0.521 u = 0.501
Alanine
0.00 1528.0 1540.1 1555.8 1566.4
0.02 1529.1 1541.3 1556.9 1567.5
0.04 1530.3 1542.3 1557.9 1568.6
0.06 1531.4 1543.4 1558.9 1569.6
0.08 1532.5 1544.5 1559.6 1571.1
0.10 1533.5 1545.4 1560.1 1571.8
uncertainty u = 0.847 u = 0.812 u = 0.673 u = 0.684
Valine
0.00 1528.0 1540.1 1555.8 1566.4
0.02 1529.7 1541.7 1557.6 1568.1
0.04 1531.2 1543.2 1558.7 1569.4
0.06 1532.8 1544.2 1559.7 1570.6
0.08 1534.4 1545.4 1560.8 1571.9
0.10 1536.2 1546.5 1562.1 1572.9
uncertainty u = 1.238 u = 0.966 u = 0.923 u = 0.987
Leucine
0.00 1528.0 1540.1 1555.8 1566.4
0.02 1530.0 1542.1 1557.8 1568.5
0.04 1531.6 1543.8 1559.7 1570.3
0.06 1533.4 1545.5 1561.6 1572.1
0.08 1535.3 1547.3 1563.2 1573.9
0.10 1537.2 1549.0 1564.9 1575.6
uncertainty u = 1.390 u = 1.349 u = 1.384 u = 1.397

68
Table 3.9 (Continued)
u / m s-1
at various ms / mol kg-1
m
(mol kg-1
) 0.00 (Water) 0.1 0.3 0.5
T = 318.15 K
Glycine
0.00 1535.2 1547.3 1562.9 1572.1
0.02 1536.2 1548.0 1563.5 1572.6
0.04 1537.1 1548.7 1564.0 1573.1
0.06 1537.8 1549.2 1564.7 1573.7
0.08 1538.9 1550.1 1565.4 1574.6
0.10 1539.8 1551.0 1566.2 1575.2
uncertainty u = 0.695 u = 0.554 u = 0.501 u = 0.485
Alanine
0.00 1535.2 1547.3 1562.9 1572.1
0.02 1536.5 1548.4 1563.9 1573.1
0.04 1537.2 1549.3 1564.8 1574.2
0.06 1538.3 1550.1 1565.5 1575.2
0.08 1539.6 1550.8 1566.4 1576.3
0.10 1540.5 1551.4 1566.9 1577.3
uncertainty u = 0.807 u = 0.625 u = 0.618 u = 0.799
Valine
0.00 1535.2 1547.3 1562.9 1572.1
0.02 1536.9 1548.8 1564.6 1573.7
0.04 1538.4 1550.4 1565.7 1575.0
0.06 1539.9 1551.6 1566.9 1576.3
0.08 1541.5 1553.0 1568.2 1577.7
0.10 1543.1 1554.2 1569.3 1578.6
uncertainty u = 1.196 u = 1.055 u = 0.962 u = 1.002
Leucine
0.00 1535.2 1547.3 1562.9 1572.1
0.02 1537.0 1549.3 1564.9 1574.1
0.04 1539.0 1550.9 1566.9 1576.2
0.06 1540.7 1552.6 1568.8 1577.9
0.08 1542.6 1554.5 1570.5 1579.8
0.10 1544.4 1556.1 1571.9 1581.7
uncertainty u = 1.408 u = 1.338 u = 1.393 u = 1.458

69
The apparent molal compressibilities (K ) of the homologous
– amino acids in aqueous sodium fluoride solutions at temperatures
T = (303.15, 308.15, 313.15 and 318.15) K are calculated using the
equation (1.16) and are listed in Table 3.10.
Table 3.10 Apparent molal compressibility (K ) of – amino acids in
aqueous sodium fluoride solutions at different temperatures
K * 1015
/ m3
mol-1
Pa-1
at various ms / mol kg-1
m
(mol kg-1
) 0.00 (Water) 0.1 0.3 0.5
T = 303.15 K
Glycine
0.02 -25.56 -21.87 -17.81 -14.23
0.04 -23.40 -21.19 -17.17 -14.23
0.06 -23.14 -21.41 -16.91 -13.79
0.08 -23.01 -20.82 -16.12 -12.96
0.10 -22.35 -20.44 -15.92 -11.92
Alanine
0.02 -22.30 -21.50 -18.66 -15.00
0.04 -20.85 -17.94 -15.34 -15.01
0.06 -19.87 -15.36 -13.78 -10.73
0.08 -18.66 -15.13 -11.34 -9.89
0.10 -17.08 -14.14 -11.75 -8.63
Valine
0.02 -21.61 -19.28 -20.51 -17.90
0.04 -18.66 -15.05 -10.41 -10.87
0.06 -13.86 -12.72 -6.65 -8.55
0.08 -12.94 -7.34 -4.79 -4.49
0.10 -11.79 -6.09 -3.41 -3.89
Leucine
0.02 -22.67 -18.90 -18.68 -17.44
0.04 -17.57 -16.78 -16.01 -16.18
0.06 -14.47 -16.58 -12.94 -11.49
0.08 -13.66 -12.94 -11.07 -10.76
0.10 -12.92 -10.51 -10.24 -10.36

70
Table 3.10 (Continued)
K * 1015
/ m3
mol-1
Pa-1
at various ms / mol kg-1
m
(mol kg-1
) 0.00 (Water) 0.1 0.3 0.5
T = 308.15 K
Glycine
0.02 -22.35 -18.75 -14.90 -11.50
0.04 -23.11 -18.10 -14.91 -10.23
0.06 -21.90 -17.39 -14.03 -10.21
0.08 -20.57 -17.36 -13.90 -9.91
0.10 -20.05 -16.79 -13.05 -9.19
Alanine
0.02 -21.98 -19.65 -15.69 - 14.75
0.04 -20.55 -14.82 -14.37 -9.67
0.06 -19.57 -16.01 -15.30 -7.99
0.08 -19.80 -14.85 -12.77 -6.82
0.10 -20.81 -12.79 -10.20 -6.91
Valine
0.02 -21.23 -16.05 -17.45 -14.97
0.04 -17.62 -14.68 -8.80 -7.36
0.06 -17.39 -8.18 -7.30 -6.62
0.08 -18.71 -7.78 -5.25 -4.31
0.10 -18.64 -5.30 -3.46 -3.44
Leucine
0.02 - 20.86 -18.44 -18.22 -17.04
0.04 -17.34 -14.94 -14.27 -13.84
0.06 -17.60 -13.79 -12.98 -12.01
0.08 -18.46 -11.85 -11.39 -10.78
0.10-18.11 -11.26 -10.69 -9.55

71
Table 3.10 (Continued)
K * 1015
/ m3
mol-1
Pa-1
at various ms / mol kg-1
m
(mol kg-1
) 0.00 (Water) 0.1 0.3 0.5
T = 313.15 K
Glycine
0.02 -22.12 -15.73 -12.12 -8.92
0.04 -21.46 -15.11 -10.81 -7.66
0.06 -20.73 -13.49 -10.38 -7.64
0.08 -20.69 -13.32 -9.82 -7.63
0.10 -20.41 -12.96 -9.72 -7.35
Alanine
0.02 -18.88 -16.55 -12.83 - 12.11
0.04 -18.12 -15.94 -11.54 -12.12
0.06 -18.38 -15.24 -11.11 -9.99
0.08 -16.33 -14.90 -8.95 -12.09
0.10 -16.29 -13.60 -6.61 -10.10
Valine
0.02 -19.38 -15.68 -15.70 -12.27
0.04 -18.75 -12.21 -8.58 -7.24
0.06 -18.04 -9.33 -4.00 -6.05
0.08 -17.70 -7.16 -3.41 -4.15
0.10 -18.63 -5.33 -3.30 -3.86
Leucine
0.02 -17.44 -16.49 -15.22 -16.83
0.04 -16.17 -14.53 -13.94 -11.11
0.06 -16.20 -12.48 -12.18 -9.24
0.08 -15.85 -12.17 -11.39 -10.27
0.10 -15.65 -12.29 -10.64 -10.40

72
Table 3.10 (Continued)
K * 1015
/ m3
mol-1
Pa-1
at various ms / mol kg-1
m
(mol kg-1
) 0.00 (Water) 0.1 0.3 0.5
T = 318.15 K
Glycine
0.02 -21.92 -12.89 -9.43 -6.37
0.04 -20.51 -12.90 -8.14 -6.39
0.06 -19.62 -12.50 -8.10 -5.94
0.08 -19.81 -11.86 -8.09 -5.65
0.10 -19.67 -11.47 -7.80 -5.54
Alanine
0.02 -19.95 -13.64 -10.09 -9.50
0.04 -15.88 -10.94 -8.81 -8.82
0.06 -15.37 -9.14 -5.31 -9.07
0.08 -16.53 -8.63 -5.88 -8.85
0.10 -15.86 -6.94 -3.35 -8.23
Valine
0.02 -19.09 -12.73 -12.85 -9.60
0.04 -16.30 -14.12 -7.11 -5.86
0.06 -16.84 -9.56 -4.74 -5.94
0.08 -16.74 -7.61 -3.21 -3.70
0.10 -16.68 -7.05 -3.70 -1.42
Leucine
0.02 -15.86 -16.20 -14.95 -14.12
0.04 -16.52 -12.91 -12.96 -13.45
0.06 -15.40 - 11.33 -12.80 -9.90
0.08 -15.18 - 10.87 -11.44 -10.38
0.10 -14.50 - 10.66 -9.90 -9.89

73
K /
(10
-15m
3.m
ol
-1.P
a-1
)
The partial molal compressibility (K0) of the homologous amino
acids has been evaluated using equation (1.17) by least square fit method
(Figure 3.1). The calculated values of K0 (along with error) and the
experimental slope values Sk are given in Table 3.11. The literature values of
partial molal compressibility of amino acids in water are also given in
Table 3.11 for comparison.
-24.0
-20.0
-16.0
-12.0
-8.0
-4.0
0.0
0.00 0.02 0.04 0.06 0.08 0.10 0.12
m/(mol.kg-1
)
Figure 3.1 Plot of apparent molal compressibility (K ) against molality
(m) of ( ) glycine, ( ) alanine, ( ) valine, ( ) leucine at
T = 303.15 K of 0.1 M sodium fluoride solution

74
Table 3.11 Partial molal compressibility (K0), slopes (Sk) of – Amino acids in aqueous sodium fluoride solutions at
different temperatures
K0 * 10
15Sk * 10
18K
0 * 10
15Sk * 10
18K
0 * 10
15Sk * 10
18K
0 * 10
15Sk * 10
18Amino
acids m3mol
-1Pa
-1kg m
3mol
-2Pa
-1m
3mol
-1Pa
-1 kg m
3mol
-2Pa
-1m
3mol
-1Pa
-1 kg m
3mol
-2Pa
-1m
3mol
-1Pa
-1 kg m
3mol
-2Pa
-1
at various ms / mol kg-1
0.00 (Water) 0.1 0.3 0.5
T = 303.15 K
Glycine -25.54(0.12) 0.34 -22.12(0.06) 0.16 -18.23(0.08) 0.24 -15.19(0.10) 0.29
Alanine -23.55(0.20) 0.63 -22.08(0.30) 0.88 -19.52(0.30) 0.89 -17.21(0.30) 0.89
Valine -23.38(0.42) 1.26 -22.32(0.55) 1.70 -21.11(0.69) 1.99 -19.45(0.57) 1.71
Leucine -23.28(0.40) 1.17 -21.33(0.34) 1.03 -20.33(0.35) 1.09 -19.12(0.33) 0.98
T = 308.15 K
Glycine -23.74 (0.13) -23.5m
0.36 -19.07(0.08) 0.23 -15.57(0.08) 0.24 -11.69(0.08) 0.25
Alanine -21.47(0.09) 0.15 -19.74(0.25) 0.69 -17.44(0.22) 0.63 -14.79(0.33) 0.93
Valine -19.94(0.15) 0.20 -18.92(0.47) 1.42 -17.91(0.54) 1.57 -15.18(0.46) 1.30
Leucine -19.79(0.30) 0.21 -19.29(0.29) 0.87 -18.90(0.30) 0.90 -18.06(0.29) 0.90

75
Table 3.11 (Continued)
K0 * 10
15Sk * 10
18K
0 * 10
15Sk * 10
18K
0 * 10
15Sk * 10
18K
0 * 10
15Sk * 10
18Amino
acids m3mol
-1Pa
-1kg m
3mol
-2Pa
-1m
3mol
-1Pa
-1kg m
3mol
-2Pa
-1 m
3mol
-1Pa
-1 kg m
3mol
-2Pa
-1m
3mol
-1Pa
-1 kg m
3mol
-2Pa
-1
at various ms / mol kg-1
0.00 (Water) 0.1 0.3 0.5
T = 313.15 K
Glycine -22.34(0.07) -22.4n
0.21 -16.32(0.12) 0.37 -12.31(0.09) 0.29 -8.79(0.06) 0.16
Alanine -19.69(0.12) -19.8n
0.35 -17.33(0.11) 0.35 -14.72(0.24) 0.75 -12.50(0.11) 0.20
Valine -19.26(0.06) -19.2n
0.13 -17.67(0.41) 1.29 -15.98(0.53) 1.50 -12.69(0.34) 1.00
Leucine -17.43(0.07) -17.8n
0.19 -16.82(0.19) 0.53 -16.19(0.19) 0.58 -15.69(0.30) 0.68
T = 318.15 K
Glycine -21.87(0.10) -21.56g 0.26 -13.49(0.06) 0.19 -9.31(0.06) 0.17 -6.70(0.04) 0.12
Alanine -18.98(0.18) -17.85g
0.38 -14.57(0.25) 0.79 -11.61(0.27) 0.82 -9.65(0.05) 0.13
Valine -18.45(0.11) -18.23g
0.22 -15.57(0.31) 0.89 -12.98(0.40) 1.11 -10.86(0.30) 0.93
Leucine -16.71(0.07) -16.35g
0.22 -16.33(0.23) 0.66 -15.90(0.19) 0.58 -15.00(0.21) 0.58
Values within parenthesis indicates the error in K0
mWadi and Ramasami (1997),
nKharakoz (1991),
gKikuchi et al (1995).

76
The contributions of charged end groups K0 (NH3
+, COO
-), K
0
(CH2) group and other alkyl chain of the amino acids to K0 have been
estimated using equations (1.4) to (1.7) and are given in Table 3.12.
Table 3.12 Group contributions of partial molal compressibility (K0) of
– amino acids in aqueous sodium fluoride solutions at
different temperatures
K0* 10
15 / m
3 mol
-1 Pa
-1 at various ms / mol kg
-1
Group 0.00 (Water) 0.1 0.3 0.5
T = 303.15 K
NH3+, COO
--25.34 -22.35 -18.06 -14.71
CH2- 0.47 0.13 -0.58 -1.01
CH3CH- 0.94 0.27 -1.16 -2.02
(CH3)2CHCH- 1.88 0.54 -2.32 -4.04
(CH3)2CH CH2 CH - 2.35 0.67 -2.90 -5.05
T = 308.15 K
NH3+, COO
--24.060 -19.360 -15.310 -10.990
CH2- 0.943 0.038 -0.713 -1.313
CH3CH- 1.886 0.076 -1.426 -2.626
(CH3)2CHCH- 3.772 0.152 -2.852 -5.252
(CH3)2CH CH2 CH - 4.715 0.190 -3.565 -6.565
T = 313.15 K
NH3+, COO
--22.750 -16.630 -12.090 -8.220
CH2- 1.025 -0.134 -0.902 -1.399
CH3CH- 2.050 -0.268 -1.804 -2.798
(CH3)2CHCH- 4.100 -0.536 -3.608 -5.596
(CH3)2CH CH2 CH - 5.125 -0.670 -4.510 -6.995
T = 318.15 K
NH3+, COO
--22.250 -12.980 -8.080 -5.210
CH2- 1.085 -0.668 -1.455 -1.781
CH3CH- 2.170 -1.336 -2.910 -3.562
(CH3)2CHCH- 4.340 -2.672 -5.820 -7.124
(CH3)2CH CH2 CH - 5.425 -3.340 -7.275 -8.905

77
The transfer partial molal compressibilities K0
of amino acids
from pure water to sodium fluoride water mixtures are calculated using
equation (1.8) and the values are given in Table 3.13.
Table 3.13 Transfer partial molal compressibility ( K0) of – Amino
acids in aqueous sodium fluoride solutions at different
temperatures
K0* 10
15 / m
3 mol
-1 Pa
-1 at various ms / mol kg
-1
0.1 0.3 0.5Amino Acid
T = 303.15 K
Glycine 3.42 7.31 10.35
Alanine 1.47 4.03 6.34
Valine 1.06 2.27 3.93
Leucine 1.95 2.95 4.16
T = 308.15 K
Glycine 4.67 8.17 12.05
Alanine 1.73 4.03 6.68
Valine 1.02 2.03 4.76
Leucine 0.5 0.89 1.73
T = 313.15 K
Glycine 6.02 10.03 13.55
Alanine 2.36 4.97 7.19
Valine 1.59 3.28 6.57
Leucine 0.61 1.24 1.74
T = 318.15 K
Glycine 8.38 12.56 15.17
Alanine 4.41 7.37 9.33
Valine 2.88 5.47 7.59
Leucine 0.38 0.81 1.71
The contributions of K0 (NH3
+, COO
-), K
0 (CH2) and other
alkyl chain of the homologous amino acids to transfer partial molal
compressibilities K0 are evaluated using equations (1.4) to (1.7) and are
listed in Table 3.14.

78
Table 3.14 Group Contributions of Transfer Partial molal
compressibility ( K0) of – Amino acids in Aqueous
Sodium Fluoride solutions at different temperatures
K0* 10
15 / m
3 mol
-1 Pa
-1 at various ms / mol kg
-1
Group 0.1 0.3 0.5
T = 303.15 K
NH3+, COO
-2.881 7.284 10.630
CH2- -0.317 -1.048 -1.479
CH3CH- -0.634 -2.096 -2.958
(CH3)2CHCH- -1.268 -4.192 -5.916
(CH3)2CH CH2 CH - -1.585 -5.240 -7.395
T = 308.15 K
NH3+, COO
-4.695 8.748 13.070
CH2- -0.905 -1.656 -2.256
CH3CH- -1.810 -3.312 -4.512
(CH3)2CHCH- -3.620 -6.624 -9.024
(CH3)2CH CH2 CH - -4.525 -8.280 -11.280
T = 313.15 K
NH3+, COO
-6.122 10.660 14.530
CH2- -1.159 -1.927 -2.424
CH3CH- -2.318 -3.854 -4.848
(CH3)2CHCH- -4.636 -7.708 -9.696
(CH3)2CH CH2 CH - -5.795 -9.635 -12.120
T = 318.15 K
NH3+, COO
-9.271 14.170 17.040
CH2- -1.753 -2.540 -2.866
CH3CH- -3.506 -5.080 -5.732
(CH3)2CHCH- -7.012 -10.160 -11.464
(CH3)2CH CH2 CH - -8.765 -12.700 -14.330
The viscosity data of the homologous – amino acids in aqueous
sodium fluoride solutions at temperatures T = (303.15, 308.15, 313.15 and
318.15) K are given in Table 3.15. The uncertainty values for viscosity are
calculated and are also given in Table 3.15.

79
Table 3.15 Viscosity ( ) of – Amino acids in Aqueous Sodium
Fluoride solutions at different temperatures
/ m Pa s at various ms / mol kg-1
m
(mol kg-1
) 0.00 (Water) 0.1 0.3 0.5
T = 303.15 K
Glycine
0.00 0.797 0.819 0.853 0.896
0.02 0.801 0.821 0.855 0.898
0.04 0.803 0.823 0.857 0.902
0.06 0.805 0.826 0.859 0.904
0.08 0.808 0.828 0.862 0.907
0.10 0.810 0.831 0.866 0.910
uncertainty = 1.75×10-3
= 2.17×10-3
= 1.99×10-3
= 1.80×10⁻³
Alanine
0.00 0.797 0.819 0.853 0.896
0.02 0.800 0.822 0.858 0.899
0.04 0.804 0.825 0.863 0.903
0.06 0.807 0.829 0.867 0.908
0.08 0.811 0.834 0.871 0.912
0.10 0.816 0.838 0.876 0.918
uncertainty = 2.87×10-3
= 3.04×10-3
= 4.08×10-3
= 2.99×10⁻³
Valine
0.00 0.797 0.819 0.853 0.896
0.02 0.803 0.824 0.858 0.901
0.04 0.808 0.830 0.865 0.907
0.06 0.814 0.837 0.872 0.915
0.08 0.821 0.844 0.880 0.924
0.10 0.830 0.852 0.888 0.933
uncertainty = 4.93×10-3
= 4.95×10-3
= 5.65×10-3
= 5.28×10⁻³
Leucine
0.00 0.797 0.819 0.853 0.896
0.02 0.804 0.825 0.859 0.901
0.04 0.809 0.832 0.866 0.907
0.06 0.817 0.841 0.875 0.916
0.08 0.827 0.849 0.884 0.927
0.10 0.834 0.857 0.893 0.937
uncertainty = 5.74×10-3
= 5.83×10-3
= 5.92×10-3
= 5.87×10⁻³

80
Table 3.15 (Continued)
/ m Pa s at various ms / mol kg-1
m
(mol kg-1
) 0.00 (Water) 0.1 0.3 0.5
T = 308.15 K
Glycine
0.00 0.719 0.747 0.775 0.810
0.02 0.721 0.749 0.777 0.812
0.04 0.723 0.751 0.779 0.814
0.06 0.725 0.753 0.781 0.817
0.08 0.728 0.755 0.783 0.820
0.10 0.729 0.758 0.787 0.822
uncertainty = 1.64×10-3
= 1.50×10-3
= 1.45×10-3
= 1.51×10⁻³
Alanine
0.00 0.719 0.747 0.775 0.810
0.02 0.722 0.750 0.781 0.815
0.04 0.726 0.753 0.786 0.819
0.06 0.729 0.756 0.790 0.823
0.08 0.733 0.760 0.793 0.827
0.10 0.736 0.765 0.797 0.832
uncertainty =2.64×10-3
= 2.47×10-3
= 3.46×10-3
= 3.33×10⁻³
Valine
0.00 0.719 0.747 0.775 0.810
0.02 0.724 0.753 0.780 0.814
0.04 0.730 0.759 0.786 0.820
0.06 0.736 0.766 0.793 0.827
0.08 0.743 0.772 0.800 0.834
0.10 0.747 0.778 0.806 0.842
uncertainty = 4.44×10-3
= 4.61×10-3
= 4.69×10-3
= 4.39×10⁻³
Leucine
0.00 0.719 0.747 0.775 0.810
0.02 0.726 0.752 0.780 0.816
0.04 0.731 0.758 0.787 0.823
0.06 0.739 0.765 0.793 0.830
0.08 0.746 0.773 0.802 0.839
0.10 0.753 0.781 0.811 0.849
uncertainty = 5.20×10-3
= 5.16×10-3
= 5.26×10-3
= 5.41×10⁻³

81
Table 3.15 (Continued)
/ m Pa s at various ms / mol kg-1
m
(mol kg-1
) 0.00 (Water) 0.1 0.3 0.5
T = 313.15 K
Glycine
0.00 0.653 0.682 0.707 0.738
0.02 0.655 0.684 0.709 0.740
0.04 0.656 0.686 0.712 0.742
0.06 0.658 0.688 0.714 0.744
0.08 0.660 0.690 0.715 0.747
0.10 0.662 0.692 0.718 0.749
uncertainty = 1.36×10-3
= 1.25×10-3
= 1.27×10-3
= 1.71×10⁻³
Alanine
0.00 0.653 0.682 0.707 0.738
0.02 0.655 0.685 0.712 0.741
0.04 0.659 0.688 0.715 0.744
0.06 0.661 0.691 0.718 0.748
0.08 0.664 0.695 0.722 0.751
0.10 0.668 0.698 0.726 0.756
uncertainty = 2.28×10-3
= 1.71×10-3
= 4.05×10-3
= 3.51×10⁻³
Valine
0.00 0.653 0.682 0.707 0.738
0.02 0.657 0.686 0.712 0.744
0.04 0.662 0.690 0.717 0.749
0.06 0.668 0.695 0.723 0.756
0.08 0.673 0.703 0.729 0.762
0.10 0.678 0.708 0.736 0.769
uncertainty = 3.91×10-3
= 3.93×10-3
= 4.59×10-3
= 4.50×10⁻³
Leucine
0.00 0.653 0.682 0.707 0.738
0.02 0.658 0.688 0.713 0.743
0.04 0.663 0.693 0.719 0.749
0.06 0.669 0.700 0.727 0.756
0.08 0.677 0.707 0.733 0.765
0.10 0.682 0.714 0.741 0.772
uncertainty = 4.55×10-3
= 4.59×10-3
= 4.78×10-3
= 4.76×10⁻³

82
Table 3.15 (Continued)
/ m Pa s at various ms / mol kg-1
m
(mol kg-1
) 0.00 (Water) 0.1 0.3 0.5
T = 318.15 K
Glycine
0.00 0.597 0.623 0.648 0.675
0.02 0.599 0.625 0.649 0.676
0.04 0.600 0.627 0.652 0.677
0.06 0.602 0.629 0.653 0.679
0.08 0.604 0.631 0.655 0.681
0.10 0.605 0.632 0.657 0.684
uncertainty = 1.67×10-3
= 1.12×10-3
= 1.15×10-3
= 0.98×10⁻³
Alanine
0.00 0.597 0.623 0.648 0.675
0.02 0.599 0.626 0.652 0.680
0.04 0.602 0.630 0.656 0.683
0.06 0.604 0.632 0.658 0.687
0.08 0.607 0.635 0.661 0.690
0.10 0.610 0.638 0.665 0.693
uncertainty = 1.99×10-3
= 2.12×10-3
= 3.74×10-3
= 2.69×10⁻³
Valine
0.00 0.597 0.623 0.648 0.675
0.02 0.600 0.626 0.652 0.680
0.04 0.605 0.630 0.657 0.686
0.06 0.610 0.635 0.663 0.692
0.08 0.615 0.641 0.669 0.697
0.10 0.619 0.646 0.673 0.703
uncertainty = 3.50×10-3
= 3.34×10-3
= 4.33×10-3
= 4.50×10⁻³
Leucine
0.00 0.597 0.623 0.648 0.675
0.02 0.601 0.628 0.653 0.680
0.04 0.605 0.634 0.658 0.686
0.06 0.611 0.640 0.663 0.693
0.08 0.618 0.646 0.670 0.700
0.10 0.622 0.651 0.678 0.706
uncertainty = 3.99×10-3
= 4.17×10-3
= 4.19×10-3
= 4.52×10⁻³

83
The viscosity B coefficients of – amino acids in aqueous sodium
fluoride solutions are obtained using equation (1.23) and are given in
Table 3.16. The values of viscosity B coefficients of amino acids in water,
available in literature are also given in Tables 3.16 for comparison.
Table 3.16 Viscosity B - coefficient of – amino acids in aqueous
sodium fluoride solutions at different temperatures
B * 103 / m
3 mol
-1 at various ms / mol kg
-1
0.00 (Water)
Amino
Acid
Present Work Literature 0.1 0.3 0.5
T = 303.15 K
Glycine 0.145 (0.006) - 0.153 (0.006) 0.157 (0.015) 0.160 (0.008)
Alanine 0.247 (0.012) 0.241o
0.252 (0.012) 0.257 (0.007) 0.259 (0.011)
Valine 0.426 (0.028) - 0.432 (0.013) 0.440 (0.009) 0.449 (0.020)
Leucine 0.497(0.030) - 0.500 (0.009) 0.506 (0.014) 0.511 (0.030)
T = 308.15 K
Glycine 0.147 (0.010)0.1466
i
0.148p 0.148 (0.008) 0.154 (0.015) 0.159 (0.007)
Alanine 0.246 (0.007) 0.247p
0.249 (0.017) 0.251 (0.012) 0.257 (0.007)
Valine 0.417 (0.017) 0.418i
0.426 (0.006) 0.427 (0.007) 0.430 (0.013)
Leucine 0.488 (0.018) 0.483i
0.495 (0.018) 0.499 (0.025) 0.505 (0.025)
T = 313.15 K
Glycine 0.142 (0.012)0.144
q
0.145r 0.147 (0.000) 0.148 (0.013) 0.154 (0.007)
Alanine 0.241 (0.015) 0.247s
0.244 (0.007) 0.248 (0.011) 0.249 (0.013)
Valine 0.413 (0.007) 0.413t
0.423 (0.028) 0.426 (0.015) 0.426 (0.013)
Leucine 0.484 (0.022) 0.480t
0.491 (0.018) 0.499 (0.015) 0.501 (0.019)
T = 318.15 K
Glycine 0.141 (0.017) 0.139t
0.146 (0.009) 0.147 (0.012) 0.147 (0.015)
Alanine 0.230 (0.009) 0.238s
0.235 (0.012) 0.240 (0.015) 0.243 (0.007)
Valine 0.410 (0.009) 0.408t
0.416 (0.016) 0.420 (0.015) 0.422 (0.007)
Leucine 0.471 (0.026) 0.471t
0.474 (0.009) 0.483 (0.032) 0.490 (0.009)
Values within parenthesis indicates the standard error in viscosity B coefficient
o Zhao (2006),
i Yan et al (1999),
p Sandhu and Kashyap (1987),
q Islam and Wadi (2004),
r Bhattacharya and Sengupta (1988),
s Bhattacharya and Sengupta (1980),
t Rajagopal and
Jayabalakrishnan (2010c)

84
The zwitterionic end group, the methylene group and other alkyl
side chain group contributions of amino acids to viscosity B coefficient have
been calculated using equations (1.4) to (1.7). The evaluated values are given
in Table 3.17.
Table 3.17 Contribution to the viscosity B coefficient from zwitterionic
groups, CH2 and other alkyl side chains of amino acids in
aqueous sodium fluoride solution at different temperatures
B * 103 / m
3 mol
-1 at various ms / mol kg
-1
Group0.1 0.3 0.5
T = 303.15 K
NH3+, COO
-0.072 0.075 0.077
CH2- 0.087 0.088 0.089
CH3CH- 0.174 0.176 0.178
(CH3)2CHCH- 0.348 0.352 0.356
(CH3)2CH CH2 CH - 0.435 0.440 0.445
T = 308.15 K
NH3+, COO
-0.068 0.073 0.078
CH2- 0.087 0.086 0.086
CH3CH- 0.174 0.172 0.172
(CH3)2CHCH- 0.348 0.344 0.344
(CH3)2CH CH2 CH - 0.435 0.430 0.430
T = 313.15 K
NH3+, COO
-0.066 0.066 0.071
CH2- 0.086 0.088 0.087
CH3CH- 0.172 0.176 0.174
(CH3)2CHCH- 0.344 0.352 0.348
(CH3)2CH CH2 CH - 0.430 0.440 0.435
T = 318.15 K
NH3+, COO
-0.066 0.066 0.066
CH2- 0.083 0.085 0.086
CH3CH- 0.166 0.17 0.172
(CH3)2CHCH- 0.332 0.340 0.344
(CH3)2CH CH2 CH - 0.415 0.425 0.430

85
It is of interest to examine the transfer B-coefficient B from the B-
coefficient data using the equation (1.8) and transfer B coefficient of R group
B(R). The results are given in Table 3.18.
Table 3.18 Viscosity B - Coefficient transfer ( B) and transfer B
coefficients of R group, B(R) of – Amino acids in
Aqueous Sodium Fluoride solutions at different temperatures
B*103
B(R)*103
B *103
B(R *103
B *103
B(R *103
m3mol
-1m
3mol
-1 m
3mol
-1 m
3mol
-1 m
3mol
-1 m
3mol
-1
at various ms / mol kg-1
Amino
acids
0.1 0.3 0.5
T = 303.15 K
Glycine 0.008 - 0.012 - 0.015 -
Alanine 0.005 -0.003 0.010 -0.002 0.012 -0.003
Valine 0.006 -0.002 0.014 0.002 0.023 0.008
Leucine 0.003 -0.005 0.009 -0.003 0.014 -0.001
T = 308.15 K
Glycine 0.001 - 0.007 - 0.012 -
Alanine 0.003 0.002 0.005 -0.002 0.011 -0.001
Valine 0.009 0.008 0.010 0.003 0.013 0.001
Leucine 0.007 0.006 0.011 0.004 0.017 0.005
T = 313.15 K
Glycine 0.005 - 0.006 - 0.012 -
Alanine 0.003 -0.002 0.007 0.001 0.008 -0.004
Valine 0.010 0.005 0.013 0.007 0.013 0.001
Leucine 0.007 0.002 0.015 0.009 0.017 0.005
T = 318.15 K
Glycine 0.005 - 0.006 - 0.006 -
Alanine 0.005 0.000 0.010 0.004 0.013 0.007
Valine 0.006 0.001 0.010 0.004 0.012 0.006
Leucine 0.003 -0.002 0.012 0.006 0.019 0.013
The temperature derivatives of B coefficient (dB/dT) have also
been calculated and are reported in Table 3.19.

86
Table 3.19 Temperature coefficient (dB/dT) of – Amino acids in
aqueous sodium fluoride solutions at different temperatures
(dB/dT) / m3
mol-1
K-1
at various ms / mol kg-1
Amino
acids 0.00 (Water) 0.1 0.3 0.5
Glycine -0.0009 -0.0004 -0.0007 -0.0009
Alanine -0.0011 -0.0011 -0.0011 -0.0011
Valine -0.0010 -0.0010 -0.0012 -0.0017
Leucine -0.0016 -0.0016 -0.0014 -0.0013
The solvation of any solute can be judged from the magnitude of
B / V0(Zhao 2006). The values of B /V
0are given in Table 3.20.
Table 3.20 Ratio of B - coefficient to partial molal volume (B / V0) of
– amino acids in aqueous sodium fluoride solutions at
different temperatures
B / V0 at various ms / mol kg
-1Amino
acids 0.00 (Water) 0.1 0.3 0.5
T = 303.15 K
Glycine 3.31 3.47 3.50 3.53
Alanine 4.09 4.12 4.14 4.10
Valine 4.72 4.68 4.74 4.80
Leucine 4.62 4.61 4.63 4.66
T = 308.15 K
Glycine 3.34 3.33 3.40 3.46
Alanine 4.07 4.03 3.99 4.03
Valine 4.62 4.60 4.58 4.56
Leucine 4.53 4.55 4.54 4.58
T = 313.15 K
Glycine 3.21 3.28 3.23 3.32
Alanine 3.92 3.88 3.89 3.85
Valine 4.53 4.53 4.49 4.47
Leucine 4.47 4.47 4.50 4.50
T = 318.15 K
Glycine 3.15 3.20 3.15 3.12
Alanine 3.74 3.69 3.70 3.71
Valine 4.46 4.42 4.39 4.38
Leucine 4.33 4.29 4.32 4.36

87
Free energy of activation of viscous flow is another useful
parameter to assess the complexity of liquid structure. The viscosity data are
used to estimate the free energy of activation per mole of the solvent ( µ10*
)
and solute ( µ20*
) as suggested by Feakins et al (1993) and Eyring et al (1941)
from equations (1.26) and (1.27). The values of ( µ10*
) and the partial molal
volume of solvent ( 0
1V ) are given in Table 3.21. The values of the free energy
of activation per mole of the solute ( µ20*
) are given in Table 3.22.
Table 3.21 Free energy of activation of solvent 0*
1 and mean volume of
solvent ( 0
1V ) of Aqueous Sodium Fluoride solution at
different temperatures
ms
mol kg-1
0*
1
kJ mol-1
0
1V
m3
mol-1
T = 303.15 K
0.0 9.04 18.09
0.1 9.10 18.05
0.3 9.16 17.99
0.5 9.31 17.92
T = 308.15 K
0.0 8.93 ; 8.93u
18.12 ; 18.11u
0.1 9.02 18.08
0.3 9.11 18.02
0.5 9.21 17.95
T = 313.15 K
0.0 8.83 18.16
0.1 8.94 18.12
0.3 9.02 18.05
0.5 9.12 17.99
T = 318.15 K
0.0 8.74 18.19
0.1 8.85 18.16
0.3 8.94 18.09
0.5 9.04 18.03u Lark et al (2006)

88
Table 3.22 Free energy of activation of solute 0*
2 of – Amino acids
in Aqueous Sodium Fluoride solution at different
temperatures
0*
2 / kJ mol-1
at various ms / mol kg-1Amino
acids 0.00 (Water) 0.1 0.3 0.5
T = 303.15 K
Glycine 32.82 34.10 34.96 35.66
Alanine 49.34 50.30 51.37 52.10
Valine 78.43 79.77 81.36 83.09
Leucine 90.72 91.52 92.90 94.09
T = 308.15 K
Glycine
33.37
33.05v
33.72 34.89 35.89
Alanine
49.69
50.54v
50.50 51.19 52.44
Valine 78.05 79.95 80.53 81.48
Leucine
90.60
89.76v
92.03 93.15 94.44
T = 313.15 K
Glycine 32.94 33.91 34.37 35.52
Alanine 49.60 50.43 51.39 51.92
Valine 78.53 80.55 81.56 81.98
Leucine 91.17 92.69 94.40 95.14
T = 318.15 K
Glycine 33.11 34.11 34.60 34.88
Alanine 48.48 49.72 50.87 51.65
Valine 79.06 80.51 81.68 82.44
Leucine 90.40 91.35 93.28 94.76v Lark et al (2007)

89
3.4 DISCUSSION
The density values (Table 3.1) increase with increase in
concentration of amino acids. The increase in density with concentration is
due to the shrinkage in the volume which in turn is due to the presence of
solute molecules. Increase of density also indicates the increase in solute -
solvent and solvent - solvent interactions (Thirumaran and Sabu 2009).
It is observed (Table 3.1) that V values increase with increase in
concentration of sodium fluoride as well as at different temperatures for all
amino acids studied, thereby showing the presence of strong solute -solvent
interactions. Similar conclusions are obtained for some – amino acids in
aqueous metformin hydrochloride (Rajagopal and Jayabalakrishnan 2010c).
The values of V0 are by definition free from solute-solute interactions and
therefore provide information regarding solute-solvent interactions (Belibagli
and Agranci 1990). Further, the increase in V0
for all the amino acid
concentration (Table 3.2) indicates that the solute - cosolute interactions
increase with the increase in sodium fluoride concentration. Similar trend in
V0 values has been reported for some amino acids in aqueous sodium
chloride (Yuan et al 2006) and sodium caproate (Wang et al 2004). The
values of V0 increase with increase in temperature. This may be due to the
release of some solvent molecules from the loose solvation layers of the
solutes in solution (Wadi and Ramasami 1997). The increase in V0 values
from glycine to leucine (Figure 3.2) may be attributed to the increased
hydrophobicity/non polar character of the side chain in the homologous
– amino acids and hence glycine would cause the largest volume contraction
followed by alanine, valine and leucine. Similar increase in V0
values with
increasing side chain length from glycine to valine have been reported by
Banipal and Kapoor (1999).

90
V0/(
10
6m
3m
ol-1
)
4 0
5 0
6 0
7 0
8 0
9 0
1 0 0
1 1 0
0 .0 0 1. 00 2 .0 0 3 .0 0 4 .00 5.0 0 6 .0 0
nc
Figure 3.2 Plot of partial molal volume (V0) against number of carbon
atoms in alkyl side chain (nc) of ( ) 0 M, ( ) 0.1 M, ( ) 0.3
M, ( ) 0.5 M of sodium fluoride solution at T = 303.15K
It is seen from Table 3.3 that the values of V0 (NH3
+, COO
-)
increase with increasing concentration of sodium fluoride while no regular
trend is noted with V0 (CH2). This indicates that the interactions between
cosolute and charged end groups (NH3+, COO
-) of amino acids are much
stronger than those between the cosolute and (CH2). This leads to the
reduction in the electrostriction of the solvent water due to increased amino
acid - sodium fluoride interactions, thereby contributing to the more positive
values of the partial molal volume. It is also seen that the contribution to V0
increases with increase in the size of alkyl side of the amino acids for all
temperatures. Similar results are available in literature for some amino acids
in aqueous CaCl2 (Yan et al 2004).

91
The values of V0 and V
0 for all amino acids are positive and
increase with the molality of sodium fluoride in the solutions (Tables 3.2 and
3.4). These results can be explained by the cosphere overlap model, as
developed by Friedman and Krishnan (1973 b). Properties of the water
molecules in the hydration cosphere depend on the nature of the solute
species. The types of the interaction occurring between the sodium and
fluoride ions and amino acids can be classified as (Bhat et al 1988):
(1) Ion-ion interaction between Na+
of cosolute and the COO-
group of amino acid.
(2) Ion-ion interaction between F– of cosolute and the NH3
+
group of amino acid.
(3) Ion-nonpolar group interactions between cosolute – amino
acid.
The first two types of interactions will produce positive V0
values whereas the last type of interactions results in negative V0. For polar
species, the volume of water molecules is smaller in the solvation sphere due
to the effect of electrostriction and a decrease in the hydrogen-bonded
network of water molecules in the solvation sphere than in the bulk. So the
overlap of two hydrophilic hydration cospheres relaxes some water molecules
to the bulk giving rise to a positive change in volume. For nonpolar species,
the hydrophobic hydration gives a positive volume contribution. So the
overlap of two hydrophobic hydration cospheres relaxes some water
molecules from the solvation sphere of the bulk giving rise to a negative
change in volume. The influence of hydrophilic species on the hydrophobic
hydration sphere of apolar species gives a negative volume effect. The
positive value of V0 indicates the interaction between the charge centres of
amino acids dominates other forms of interactions. A similar conclusion has
been reported for some amino acids and peptides in aqueous sodium acetate

92
(Wang et al 1999), sodium caproate (Wang et al 2004), sodium chloride
(Yuan et al 2006) and glycylglycine in aqueous sodium fluoride (Lin et al
2006).
Table 3.5 shows that the values of V0 (NH3
+, COO
-) are greater
than V0 (CH2) and increases with increasing concentration of sodium
fluoride and the contribution to V0 increases with increase in the size of
alkyl side of the amino acids. This also indicates that the interactions between
sodium fluoride and charged end groups (NH3+, COO
-) of amino acids are
stronger. A similar linear correlation has also been reported for some amino
acids in aqueous guanidine hydrochloride (Yan et al1998) and potassium
thiocynate (Wadi and Goyal 1992) solutions.
The nH values (obtained by both volume and compressibility data)
show a tendency to decrease with an increase in the concentration of sodium
fluoride as well as temperature (Table 3.6). The decrease in nH values with the
increase in the concentration of sodium fluoride also shows that sodium
fluoride has dehydration effect on amino acids. Further, increase in
temperature also reduces the electrostriction. The reduction in the
electrostriction with increasing sodium fluoride concentration and
temperature is confirmed by the decrease in nH. Also the decrease of the
hydration number of the amino acids with the increasing NaF molalities
indicates that the interactions involving ions (Na+, F
-) with the charged
centres of amino acids become stronger, that weakens the electrostriction of
the charged centres with the water molecules, and strengthens the hydration
competitions between ions and the charged centres of the amino acids, then nH
decrease. This is in consistent with the observed increase in V0 with
increasing sodium fluoride concentrations. This also supports the view that
electrolytes have a dehydration effect on the amino acids in solution (Ogawa
et al 1984b, Wang et al 1999). The observed nH values follow the order: Leu
> Val > Ala > Gly.

93
It is seen from Table 3.7 that the VAB values are positive and VABB
are negative showing the dominance of pair interactions over triplet
interactions. The positive values of the pair interaction coefficients VAB also
suggest that interaction occurs due to the overlap of hydration spheres of the
solute-cosolute molecules (Rajagopal and Jayabalakrishnan 2010c) which
again supports the conclusion drawn from the cosphere overlap model.
The values of KAB are positive and KABB are negative
(Table 3.7). The change in KAB values from glycine to L-leucine comes from
the difference in the interactions of the alkyl side chains of the amino acids
with sodium fluoride, as the interactions of zwitterionic end groups for
different amino acids with sodium fluoride are almost same. This suggests
that alkyl side chains of the amino acids play an important role in modulating
the volume of transfer. Similar conclusions are given by Banipal and Singh
(2004b) for some amino acids, diglycine and lysozyme in aqueous n-propanol.
The positive AB values and negative ABB values (Table 3.7)
suggest the dominance of pair interaction that occur due to the overlap of
hydration spheres of amino acids and sodium fluoride molecules, which
supports the conclusion drawn from the cosphere overlap model using
volumetric data. Similar results are also available in literature (Lark et al
2006).
According to Hepler’s criteria, when V0 / T > 0 and
2V
0/ T
2
< 0 the solute has the hydrophilic character while V0 / T < 0 and
2V
0 / T
2
> 0 the solute has hydrophobic character. It is observed from Table 3.8 that
values of (2V
0/ T
2) are greater than 0 (i.e. The temperature derivative
coefficient c positive), indicating that all studied amino acids have
hydrophobic character and also these amino acids act as structure maker in
aqueous sodium fluoride solutions (Gekko and Noguchi 1979, Soto et al

94
2004). Therefore, the effects of the charged end groups of amino acids are the
prominent factor for the feature of temperature dependence of V0 of amino
acids.
The ultrasonic speed (Table 3.9) increases with increase in the
concentration of amino acids as well as increasing of sodium fluoride
concentrations. Molecular association is thus responsible for the observed
increase in ultrasonic speed in these mixtures. The increase in ultrasonic
speed in these solutions may be attributed to the cohesion brought about by
the ionic hydration.
It can be seen from Table 3.10 that the K values of the amino acid
in aqueous sodium fluoride solutions are negative indicating that the water
molecules around ionic charged groups of amino acids are less compressible
than the water molecules in the bulk solution (Soto et al 2004). This further
supports the conclusion that the interaction of ions with amino acid
zwitterions localized at the head groups decreases the electrostriction of water
caused by the charged centres of amino acids resulting in an increase in
volume, therefore, increasing the compressibility of the solution.
Hydrophobic solutes often show negative compressibility as well, due to the
ordering that is induced by them in water structure (Iqbal and Verrall 1989,
Conway and Verrall 1966).
It is also found that K0 values are negative (Table 3.11) and
increase linearly with the increase in concentration of sodium fluoride in
solutions. It indicates that the solute – solvent interactions increase on
increasing concentration of sodium fluoride in solutions. Sk values are
positive for all the amino acids studied which indicate the presence of weak
solute – solute interactions. A similar observation was made by Ogawa et al
(1984b) for some amino acids in aqueous alkali-chloride solutions.

95
A linear regression analysis of the K0 values as a function of nc at
various sodium fluoride concentrations gives the contributions of (NH3+,
COO-) and (CH2). It is seen from Table 3.12 that the contributions of (NH3
+,
COO-) to K
0 is less than that of (CH2) and increases with increasing
concentration of sodium fluoride. This indicates that the interactions between
cosolute and charged end groups (NH3+, COO
-) of amino acids are much
stronger than those between the cosolute and (CH2). Similar conclusion is
obtained by Pal and Kumar (2005b) for some amino acids in aqueous
magnesium chloride.
The apparent molal compressibilities of transfer ( K0) from water
to sodium fluoride at infinite dilution are given in Table 3.13 and are found to
be positive. These positive values of transfer may be attributed to the
interactions occurring between Na+ and COO
-, and F
- and NH3
+ ions. This
observation states that the dehydration of solute and cosolute is high.
Table 3.14 shows that the contributions of (NH3+, COO
-) to K
0 is
larger than that of (CH2) and increases with increasing concentration of
sodium fluoride. This indicates that the interactions between sodium fluoride
and charged end groups (NH3+, COO
-) of amino acids are stronger. Thus
supports the conclusion drawn from volumetric studies.
From Table 3.15, it is observed that the values of viscosity increase
with increase in solute as well as sodium fluoride concentration. Viscosity
variation is attributed to the structural changes. This increasing trend indicates
the existence of molecular interaction occurring in these systems. Also the
increase in viscosity of the solution on addition of solute indicate the structure
making ability of the solutes (Iqbal and Chaudhry 2009)
It is well established that viscosity B coefficient is a measure of
solute solvent interactions and is directly dependent on the size, shape and
charge of the solute molecules. Thus, the B values reflect the net structural

96
r
effects of the charged groups and the hydrophobic CH2 groups on the solvent.
The values of viscosity B coefficient for all the amino acids studied in water
and in aqueous sodium fluoride solutions at the four different temperatures
are positive indicating that the ion – solvent interactions are strong. Further,
Table 3.16 shows that the B values of the amino acids increase with increase
in molality of aqueous sodium fluoride (Figure 3.3), which shows that the ion
solvent interactions become stronger with the increase in concentration of
sodium fluoride. The viscosity B coefficient decreases with the increase in
temperature thereby showing that the ion solvent interactions are further
weakened with the increase in temperature, which may be attributed to the
decrease in solvation of ions by water. The viscosity B coefficient values for
amino acids in aqueous sodium fluoride solutions show the following order:
glycine < L-alanine < L-valine < L-leucine.
1.00
1.01
1.02
1.03
1.04
1.05
0.00 0.02 0.04 0.06 0.08 0.10 0.12
c/ (mol.dm-3
)
Figure 3.3 Plot of relative viscosity ( r) against molarity ( c ) of ( )
glycine, ( ) alanine, ( ) valine, ( ) leucine of 0.1 M sodium
fluoride solution at T = 303.15K

97
It is observed from Table 3.17, that viscosity B-coefficient
increases with increase in number of carbon atoms (nc), in the alkyl chain of
the amino acids. From Table 3.18, it is seen that the contributions of (NH3+,
COO-) and (CH2) groups to viscosity B-coefficient in water, at T = 308 K,
agree well with the literature values (Lark et al 2007). Moreover, the
magnitudes of B (NH3+, COO
-) systematically increase, in negligible manner,
with the increase in the concentration of sodium fluoride. The variation of B
(CH2) with concentration of sodium fluoride is almost insensitive. Similar
results on group contribution to B-coefficient are available in literature
(Banipal and Singh 2004b, Yan et al 2001). Furthermore, the values of B
(NH3+, COO
-) decrease with increase in temperature, whereas, no such regular
trend is observed for B (CH2). This indicates the predominance of the
interactions between zwitterionic centres with sodium fluoride in the structure
making ability of the solute.
The transfer B coefficients, B are positive (Table 3.18) for the
studied concentration range of the solvent. The B (W NaF) values reflect
the net effect of the interactions of sodium fluoride with R groups and
charged centres of amino acids. To get the contributions of these interactions
separately, transfer B coefficient of R group B(R) (W NaF) are calculated
by subtracting the transfer B coefficient of glycine from transfer B coefficient
of each amino acid. It is observed that the contribution due to the interactions
between charged centres of amino acids and sodium fluoride molecules are
much greater than that due to interactions between R groups of amino acids
and sodium fluoride molecules. This result is identical to the conclusion
obtained by Belibagli and Agranci (1990).
The sign of dB/dT values is found to provide important information
regarding structure making or structure breaking ability of the solute in the
solvent media (Sharma and Ahluwalia 1973). In general, the dB/dT is

98
negative for structure maker and positive for structure breaker solutes in
solutions (Zhao 2006). From Table 3.19, it is seen that dB/dT values are
negative for all amino acids studied. This shows that all the amino acids
studied act as structure makers in aqueous sodium fluoride solutions.
The solvation of any solute can be judged from the magnitude of
B /V0 (Zhao 2006). A value between 0 and 2.5 indicates an unsolvated
spherical species, and any higher value is an indication of solvated ones
(Stokes 1965). Table 3.20 shows that values of B /V0 are greater than 2.5 and
hence all amino acids studied are highly solvated. Also, it is observed that
temperature is having negligible effect on the solvation characters of the
amino acids reported in this work.
It is evident from Tables 3.21 and 3.22, that µ20*
values are
positive and much larger than µ10*
which indicate that ion-solvent
interactions are stronger. It further suggests that the interactions between
solute and solvent molecules in the ground state are stronger than in the
transition state. Thus, the solvation of the solute in the transition state is
unfavourable in free energy terms. Similar results are obtained for Glycine in
aqueous solutions of transition metal chlorides by Mishra and Gautam (2001).
Further, µ20*
increases in the order glycine < L-alanine < L-valine
< L-leucine at a given temperature, indicating that the solvation of amino acid
molecules becomes increasingly unfavourable as the hydrophobicity or the
number of carbon atoms of the side chain increases from glycine to L-leucine.
Similar results are available in literature for - amino acids in aqueous and
mixed aqueous solutions (Palecz 2000, Frank and Wen 1957).