CHAPTER 3 ORAL HEALTH WORKFORCE 3 ORAL HEALTH WORKFORCE . ... Though general dentistry is critical...
12
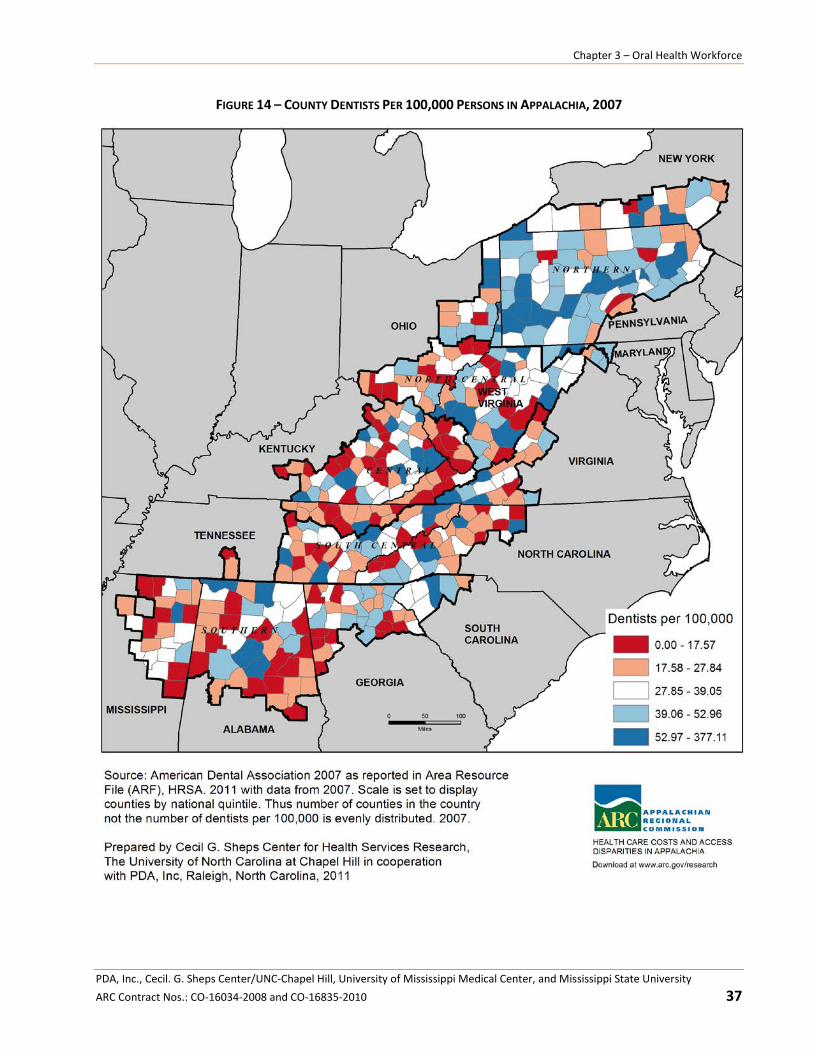
PDA, Inc., Cecil. G. Sheps Center/UNC-Chapel Hill, University of Mississippi Medical Center, and Mississippi State University ARC Contract Nos.: CO-16034-2008 and CO-16835-2010 35 CHAPTER 3 ORAL HEALTH WORKFORCE 3.1 F INDINGS 3.1.1 WORKFORCE C HARACTERISTICS AND S UPPLY T RENDS According to the United States Department of Health and Human Services (DHHS. 2000), the ability of the oral health workforce to adequately meet the preventive and care needs of the population is a national concern. Professional workforce capacity is unevenly distributed, and the Appalachian Region has far fewer dental providers than the United States average. Even within the Appalachian Region, workforce concentrations vary significantly. Opportunities to improve Appalachian oral health care access, thus, involve the number and distribution of dentists, as well as expanded roles of dental hygienists and other auxiliary dental providers and staff. In addition to the uneven distribution of dental care providers, national policy makers are also concerned about workforce trends that show a shift toward part-time work, and scarcity of specialists. Available geographic data on the oral health workforce do not distinguish between full- and part-time providers; however, the number of dentists practicing part-time has been increasing, from fewer than ten percent in 1975 to 20 percent in 2004 to as many as 25 percent projected in 2020 (Solomon. 2004). Historically, a high debt load at completion of dental school has been part of the distribution problem, making dentists less likely to practice in poor areas (DHHS. 2000). While medical school graduates in 2010, on average, accumulated $157,944 in debt (AMA. 2011), dental school graduates averaged $177,144 (ADA. 2011). Rural areas typically lack the financial resources to attract dentists (Guay. 2004). Though general dentistry is critical for good oral health care, specialists play a critical role in total oral health care. Eighty five percent of all dentists practiced general dentistry in 2008 (BLS. 2008), limiting access to specialists, such as orthodontists, pediatric dentists, or periodontitis. Anecdotal reports indicate this is especially true in underserved areas. Specialization and length of work week factors are largely absent from national databases, but are critical to the dialogue on the reach and productivity of the oral health workforce. 3.1.2 D ENTISTS Figure 13 shows county dentists per 100,000 persons in the United States in 2007. Counties range from zero to 377 dentists per 100,000 persons. The map is scaled in quintiles: areas in blue have a higher ratio of dentists (from 39 to 377 per 100,000 persons); areas in red have a lower ratio of dentists (from zero to 27 per 100,000 persons); white counties are average. The 2007 average for the United States was 65 dentists per 100,000 people, or 1,546 people per dentist. The western third of the country and northeastern states have the most dentists per population, while the middle third and southeastern states have the fewest. With regard to the distribution of high and low supply counties, Appalachia appears to be a microcosm of the United States. Distribution patterns in Figure 14 mimic those in Figure 13. However, the Appalachian Region averaged only 48 dentists per 100,000 persons in 2007, or about 2,100 people per dentist (Area Resource File (ARF) raw data files. 2007). This is 36 percent more people per dentist than the national average. Northern Appalachian states had more dentists per population than Southern and Central Appalachian states. Every Appalachian state, except Maryland, had low supply counties.
Transcript of CHAPTER 3 ORAL HEALTH WORKFORCE 3 ORAL HEALTH WORKFORCE . ... Though general dentistry is critical...

PDA, Inc., Cecil. G. Sheps Center/UNC-Chapel Hill, University of Mississippi Medical Center, and Mississippi State University ARC Contract Nos.: CO-16034-2008 and CO-16835-2010 35
CHAPTER 3 ORAL HEALTH WORKFORCE 3.1 FINDINGS 3.1.1 WOR K F OR CE C HAR AC T ER I ST IC S AN D SU P PL Y TR END S According to the United States Department of Health and Human Services (DHHS. 2000), the ability of the oral health workforce to adequately meet the preventive and care needs of the population is a national concern. Professional workforce capacity is unevenly distributed, and the Appalachian Region has far fewer dental providers than the United States average. Even within the Appalachian Region, workforce concentrations vary significantly. Opportunities to improve Appalachian oral health care access, thus, involve the number and distribution of dentists, as well as expanded roles of dental hygienists and other auxiliary dental providers and staff. In addition to the uneven distribution of dental care providers, national policy makers are also concerned about workforce trends that show a shift toward part-time work, and scarcity of specialists. Available geographic data on the oral health workforce do not distinguish between full- and part-time providers; however, the number of dentists practicing part-time has been increasing, from fewer than ten percent in 1975 to 20 percent in 2004 to as many as 25 percent projected in 2020 (Solomon. 2004). Historically, a high debt load at completion of dental school has been part of the distribution problem, making dentists less likely to practice in poor areas (DHHS. 2000). While medical school graduates in 2010, on average, accumulated $157,944 in debt (AMA. 2011), dental school graduates averaged $177,144 (ADA. 2011). Rural areas typically lack the financial resources to attract dentists (Guay. 2004). Though general dentistry is critical for good oral health care, specialists play a critical role in total oral health care. Eighty five percent of all dentists practiced general dentistry in 2008 (BLS. 2008), limiting access to specialists, such as orthodontists, pediatric dentists, or periodontitis. Anecdotal reports indicate this is especially true in underserved areas. Specialization and length of work week factors are largely absent from national databases, but are critical to the dialogue on the reach and productivity of the oral health workforce. 3.1.2 DENT I ST S Figure 13 shows county dentists per 100,000 persons in the United States in 2007. Counties range from zero to 377 dentists per 100,000 persons. The map is scaled in quintiles: areas in blue have a higher ratio of dentists (from 39 to 377 per 100,000 persons); areas in red have a lower ratio of dentists (from zero to 27 per 100,000 persons); white counties are average. The 2007 average for the United States was 65 dentists per 100,000 people, or 1,546 people per dentist. The western third of the country and northeastern states have the most dentists per population, while the middle third and southeastern states have the fewest. With regard to the distribution of high and low supply counties, Appalachia appears to be a microcosm of the United States. Distribution patterns in Figure 14 mimic those in Figure 13. However, the Appalachian Region averaged only 48 dentists per 100,000 persons in 2007, or about 2,100 people per dentist (Area Resource File (ARF) raw data files. 2007). This is 36 percent more people per dentist than the national average. Northern Appalachian states had more dentists per population than Southern and Central Appalachian states. Every Appalachian state, except Maryland, had low supply counties.

An Analysis of Oral Health Disparities and Access to Services in the Appalachian Region
PDA, Inc., Cecil. G. Sheps Center/UNC-Chapel Hill, University of Mississippi Medical Center, and Mississippi State University 36 ARC Contract Nos.: CO-16034-2008 and CO-16835-2010
FIGURE 13 – COUNTY DENTISTS PER 100,000 PERSONS IN THE U.S., 2007
Chapter 3 – Oral Health Workforce
PDA, Inc., Cecil. G. Sheps Center/UNC-Chapel Hill, University of Mississippi Medical Center, and Mississippi State University ARC Contract Nos.: CO-16034-2008 and CO-16835-2010 37
FIGURE 14 – COUNTY DENTISTS PER 100,000 PERSONS IN APPALACHIA, 2007
An Analysis of Oral Health Disparities and Access to Services in the Appalachian Region
PDA, Inc., Cecil. G. Sheps Center/UNC-Chapel Hill, University of Mississippi Medical Center, and Mississippi State University 38 ARC Contract Nos.: CO-16034-2008 and CO-16835-2010
Fewer providers create potential workload issues for dentists in rural areas. In 2008, there was 36 percent less dental workforce capacity in rural than urban areas. There were only 22 generalist dentists per 100,000 people in rural areas, compared to 30 per 100,000 people in urban areas (Doescher, et al. 2009). Improving the geographic distribution of dentists appears to require more than producing dental school graduates in the state. Speaking at the Appalachian Regional Commission (ARC) 2011 Healthy Families, Healthy Future conference, Julie McKee, DMD, Chief Dental Officer for the State of Kentucky, presented statistics on retention of dentists from Kentucky dental schools. She noted that in 2006, only 49 percent of University of Kentucky Dental School graduates remained in Kentucky; only 14 percent of University of Louisville Dental School graduates remained in the state (McKee. 2011). Another issue plaguing the dental workforce in the United States is lack of diversity in regard to age, sex and racial/ethnic composition. Little data exist on the makeup of the dental workforce; existing data show the majority of dentists are male, white and middle-aged. As of 2004, men made up 81 percent of all dentists in the United States (Solomon. 2004). The American Dental Association (ADA) reports that while 25 percent of the United States population is of a racial/ethnic minority background, only 12 percent of United States dentists fit into this classification (ADA 2011). In 2008, the Washington, Wyoming, Alaska, Montana and Idaho (WWAMI) Rural Health Research Center at the University of Washington reported that 42 percent of non-metropolitan dentists were aged 56 or older, while only 15 percent were age 39 or younger. Considering the increased dental needs of the aging population over the next several decades, aging of the dental workforce is worrisome. Appendix G shows county trends and economic status in the dental workforce in Appalachian counties. Diversity in the dental workforce is especially critical for underserved areas, where minority dentists see a very high number of minority patients (ADA, 2011). One study by Davidson, et al. (2007) looked at the American Dental Education Association’s 2003 survey of dental graduates and found three characteristics associated with provision of care to minority patients: female gender, under-represented racial/ethnic minority group and lower parents’ income. This can be considered a problem, or it may point to opportunities for enhancing the oral health workforce in underserved areas. Workforce shortages call for creative alternatives, but these have been slow to emerge. Over the past decade, there has been a strong argument to place a greater focus on provision of culturally appropriate care in dental school curriculums (Haden, et al. 2003). Expanded roles for non-dentist oral health workers is gaining more national acceptance. Appalachian states have been generally more restrictive than others in regard to expanded practice for dental hygienists and other non-dentists. South Carolina, a notable exception, and Kentucky expanded practice opportunities in 2006. Pilot projects, started in Appalachian North Carolina, have demonstrated that pediatricians can also successfully provide topical dental fluoride and dental sealants to large numbers of children. Yet, the practice has been slow to translate to the general population of pediatricians.

Chapter 3 – Oral Health Workforce
PDA, Inc., Cecil. G. Sheps Center/UNC-Chapel Hill, University of Mississippi Medical Center, and Mississippi State University ARC Contract Nos.: CO-16034-2008 and CO-16835-2010 39
3.1.3 DENTA L HY GI EN I ST S To compensate for workforce shortages and contain costs of providing care, the dental profession has always employed auxiliary dental providers. Over time, these oral health practitioners have separated into new professions, dental hygienists and dental assistants. Dental assistants make up the majority of the allied oral health workforce, and in most states, no formal training requirements for this role exist (BLS. 2010). The Bureau of Labor Statistics (BLS) Occupational Employment Statistics (OES) program produces estimates of people employed in certain occupations. Figure 15 shows the estimates of self-reported (including non-credentialed) “dental hygienists” per 1,000 persons in the United States in 2010. BLS uses sub-state areas for aggregating, some of which include both Appalachian and non-Appalachian territory. The blue areas indicate the higher two quintiles, with 1.86 to 3.88 hygienists per 1,000 persons. The red areas indicate the lower two quintiles, with zero to 0.93 hygienist per 1,000 persons. The states in the Central and Southern United States, along with Alaska and Utah, have the fewest dental hygienists; the states in the Northern United States, from Washington to Michigan to Maine, have the most dental hygienists. The national average is one hygienist per 730 people. Because many of the sub-state BLS areas fall across Appalachian lines, it is difficult to draw regional conclusions; however, Figure 15 indicates that Alabama, Georgia, North Carolina and Pennsylvania are the Appalachian states with the highest ratios of dental hygienists per population. Licensure for each is state governed. Gradually, some states are permitting auxiliary dental providers to perform tasks previously limited to dentists.

An Analysis of Oral Health Disparities and Access to Services in the Appalachian Region
PDA, Inc., Cecil. G. Sheps Center/UNC-Chapel Hill, University of Mississippi Medical Center, and Mississippi State University 40 ARC Contract Nos.: CO-16034-2008 and CO-16835-2010
FIGURE 15 – DENTAL HYGIENISTS PER 1,000 POPULATION BY BLS REGION IN THE U.S., MAY 2010
Note: Areas with no reported data were registered as zero.

Chapter 3 – Oral Health Workforce
PDA, Inc., Cecil. G. Sheps Center/UNC-Chapel Hill, University of Mississippi Medical Center, and Mississippi State University ARC Contract Nos.: CO-16034-2008 and CO-16835-2010 41
The scope of practice for dental hygienists is largely determined by regulations established by state licensing boards. The specific tasks dental hygienists can perform and the level of dentist supervision required to perform those tasks vary by state. Some states, typically Western states, are nationally recognized for placing fewer restrictions on dental hygienists, allowing them to perform a wider variety of functions with fewer requirements for direct supervision (HRSA. 2004; Kleiner, Park. 2008). Other states put many more restrictions on dental hygienists, often limiting their professional portfolio, wages, and permission to provide basic dental services needed in underserved communities (HSRA. 2004; Kleiner, Park. 2008). The American Dental Hygienists Association (ADHA) refers to the combination of permitted tasks and accompanying levels of dentist supervision as the “autonomy” of dental hygienists. Most of the tasks permitted for dental hygienists fall under the umbrella of oral health assessment and education (HRSA. 2004). Some basic tasks typically performed by dental hygienists include cleaning (or prophylaxis) and administration of fluoride, x-rays and topical anesthesia. Other tasks, such as placing sutures and administering nitrous oxide (N2O) and local anesthesia, are permitted for dental hygienists in only some states, and with varying levels of supervision. All permitted tasks are assigned supervision levels by states. According to the Health Resource and Services Administration (HRSA. 2004), the level of supervision a dentist provides can be categorized as personal, direct, indirect, general or unsupervised:
• Personal supervision implies the immediate presence and active participation of the dentist in the procedure or services being provided to the patient. Generally, this level of supervision applies when a dentist is the primary provider of a service and the hygienist is assisting.
• Direct supervision usually indicates that the dentist has prescribed and/or authorized the services being provided to the patient while the dentist is physically present in the office. In some states, this level of supervision requires that the dentist examine the patient after the hygienist has completed the service and prior to the patient’s departure.
• Indirect supervision suggests that the dentist has authorized the work to be performed by the hygienist at some time in his interface with the patient (either immediately or at some prior point), and that the dentist is physically present and readily available to the hygienist.
• General supervision often means that the dentist has authorized a hygienist to perform a hygiene task that is not always a patient-specific authorization but may be a task-specific authorization, i.e., may perform a dental hygiene assessment on patients. The dentist is not required to be present in the facility where the services are performed, but should be available or have dental coverage available to the hygienist as needed. He may also authorize the performance of the task in a setting other than the dental office. In some cases, written authorization or a prescription from the authorizing dentist is required for the patient to receive hygiene services. This authorization may need to be patient-specific, or it may be part of a formal hygiene protocol for treating patients. In some states, dental boards or legislatures have appended a provision to general supervision that requires the patient be informed that the supervising dentist is not on the premises.
• Unsupervised indicates the most autonomous form of practice for a hygienist. When unsupervised practice is described in law, the tasks permitted are usually well defined and focused on special competencies of dental hygienists such as oral hygiene instruction and education, dental hygiene treatment planning, oral prophylaxis or fluoride treatments. In situations where unsupervised practice is permitted, as is the case in the state of Washington, there is often a stipulation for the hygienist to refer the patient to a dentist for any needed dental services or dental treatment (HRSA. 2004).

An Analysis of Oral Health Disparities and Access to Services in the Appalachian Region
PDA, Inc., Cecil. G. Sheps Center/UNC-Chapel Hill, University of Mississippi Medical Center, and Mississippi State University 42 ARC Contract Nos.: CO-16034-2008 and CO-16835-2010
Under contract with HRSA, the Center for Health Workforce Studies at the School of Public Health at the University at Albany created the Dental Hygiene Professional Practice Index (DHPPI) to document variations in government regulations and practice conditions for the50 states and the District of Columbia. The baseline year was 2001. The DHPPI measures restrictions that affect access to hygiene services, particularly for underserved populations (HRSA 2004). The DHPPI rates states on the basis of restrictions on dental hygienists, including:
• Level of supervision • Type of tasks hygienists are permitted to perform • Reimbursement • Legal influences
The DHPPI was summarized (Krause, et al. 2010), and is included in Appendices E and F. Gradually, between 2001 and 2007, state licensure boards have expanded the scope of oral health services that can be delivered by non-dentists, making oral health care available to more people, generally at lower costs (Kleiner. 2011). However, fear plays a role in expansion of non-dentist labor force capabilities. Most dental practices are small and involve substantial personal capital investment on the part of individual proprietors. With few people covered by generous dental insurance policies, dentists fear loss of paying customers to a less expensive workforce (Kleiner. 2011). The Kleiner report demonstrates that reallocation of tasks from dentists to hygienists reduces the need for dentists. In the Appalachian case, where dentists are in short supply, this could be a good thing. Guided by the DHPPI, in 2001, HRSA rated states as excellent, favorable, satisfactory, limiting or restrictive on a variety of functions. Excellent represents the least restricted hygiene practices, up to completely unsupervised or independent practices. The most recent update on state regulation of dental hygienists was produced by ADHA. Figure 165 compares the 2007 mean ADHA state supervision scores for cleaning and prophylaxis as assigned by the ADHA, and allows for comparison of the levels of restrictions placed on dental hygienists between the states in the Appalachian Region and the rest of the United States. Blue indicates areas where hygienists are afforded greater autonomy to perform cleaning and prophylaxis; red indicates areas where hygienists are more heavily supervised. The nation is split almost down the center, with western states allowing dental hygienists more autonomy and eastern states requiring higher levels of supervision. With the exception of South Carolina and New York, the Appalachian States are almost entirely red (in the lowest two national quintiles), meaning that dental hygienists’ autonomy is more likely to be limited in the Appalachian region than in the nation as a whole.
5 Note that the quantity of licensed dental hygienists in Figure 15 is 10-fold lower than the total number of hygienists in Figure 16.

Chapter 3 – Oral Health Workforce
PDA, Inc., Cecil. G. Sheps Center/UNC-Chapel Hill, University of Mississippi Medical Center, and Mississippi State University ARC Contract Nos.: CO-16034-2008 and CO-16835-2010 43
FIGURE 16 - ADHA RATING OF HYGIENISTS’ AUTONOMY BY STATE, 2007

An Analysis of Oral Health Disparities and Access to Services in the Appalachian Region
PDA, Inc., Cecil. G. Sheps Center/UNC-Chapel Hill, University of Mississippi Medical Center, and Mississippi State University 44 ARC Contract Nos.: CO-16034-2008 and CO-16835-2010
3.2 METHODOLOGY 3.2.1 DATA SOU R CE S The data on the oral health workforce are the most current in this report. Data on supply and distribution of dentists were drawn from the 2009-2010 United States DHHS, HRSA and ARF. This same information for dental hygienists was drawn from the BLS’ May 2010 OES Survey. Statistics on the dentist labor force are maintained by the ADA and uploaded periodically, but not annually, to the ARF. State scores for permitted functions and supervision levels of dental hygienists were obtained from a survey conducted by, and used with permission from, the ADHA. Assignment of hygienist permission scores was guided by the HRSA’s DHPPI. Data on state licensure are available directly from the states, and in the 2004 HRSA’s report “The Professional Practice Environment of Dental Hygienists in the Fifty States and the District of Columbia, 2001”. The map in Figure 16 was provided directly by ADHA and is printed with its permission. We changed only the colors to provide consistency with the red/white/blue color-scheme used throughout this report. 3.2.2 DATA ANA LY S I S The supply of dentists and dental hygienists per state population was rank-ordered and separated into equal quintiles. The actual high and low ratios of professionals to population in each quintile were then summarized for indexing purposes. This permitted the UNC Sheps geographers to develop descriptive choroplethic maps in which red is assigned to low values, white to average values, and blue to high values. The dataset for dental hygienist permissions was constructed from information available on the permitted functions and supervision levels of Registered Dental Hygienists on ADHA’s website, and can be found in Appendix B. 3.2.3 MAPPI N G Data on supply and distribution of dentists were merged with corresponding county boundaries, and displayed by aggregating data into national quintiles. The same information on dental hygienists required an additional step, whereby the BLS regions were mapped by using reference data on the BLS site to merge counties to the analysis regions. The available data were then merged to those boundaries, and displayed by aggregating data into national quintiles. The Mean State Supervision Scores for Cleaning and Prophylaxis by a Dental Hygienist data was taken as presented in a choroplethic map (ADHA. 2007). A map was then created using the categories of supervision outlined in the Findings section above, because individual state values were not available.

Chapter 3 – Oral Health Workforce
PDA, Inc., Cecil. G. Sheps Center/UNC-Chapel Hill, University of Mississippi Medical Center, and Mississippi State University ARC Contract Nos.: CO-16034-2008 and CO-16835-2010 45
3.3 DISCUSSION 3.3.1 THE OR A L HEA LTH WO R KF OR C E AND AP PA LAC HIA The ratios of both dentists and dental hygienists to population in the Appalachian Region are substantially lower than the national average. Communities in the Appalachian Region may have trouble recruiting enough providers for many reasons. Among these, the average new dental graduate in the United States is deeply in debt, and rural regions often lack the financial resources and other support systems to competitively recruit this new talent. Also, dental hygienists practicing in states in the Appalachian Region are bound by some of the most restrictive conditions in the country, limiting their roles and impact. Incentives for dental professionals to work in the Appalachian Region are important. Speaking at ARC’s 2011 Annual Conference, Healthy Families, Healthy Future, Julie Watts McKee, DMD, Kentucky State Dental Officer, noted that, because in 2006, fewer than half of Kentucky dental graduates remained in Kentucky, that state is refocusing its efforts to connect its dental school students with state opportunities (Shepherd, McKee. 2011). The American Recovery and Reinvestment Act of 2009 provided time-limited funds to increase National Health Service Corps loan forgiveness and salary stipends to dental professional who work in underserved areas. The Appalachian Region would benefit from an extension of this program. The national oral health workforce is largely homogeneous, and there is an urgent need to diversify. Dentists who belong to underrepresented racial/ethnic minority groups and female dentists are more likely to serve those populations where some of the greatest disparities exist. As the population of the United States changes composition, there is a greater need to increase diversity within the dentist workforce. In 2002, the dentist workforce was overwhelmingly white, male and middle-aged (Mertz, O'Neil. 2002). Approximately 86 percent of the dentist workforce was non-Hispanic white (Mertz, O'Neil. 2002; Mitchell, Lassiter. 2006); about 80 percent of practicing dentists was between the ages of 35 and 65 (Mertz, O'Neil. 2002); and about 87 percent of practicing dentists was male (Mertz, O'Neil. 2002). There is evidence that more women are entering dental schools (DHHS. 2000; Mertz, O'Neil. 2002); however, dental school enrollments are not seeing the same level of increase in racially diverse students (DHHS. 2000), with the exception of an increased enrollment of Asian and Pacific Islander students (Haden, et al. 2003). Given the issue of lower enrollment of minority students in dental schools (DHHS. 2000; Valachovic. 2002), it may take great effort to diversify the dentist workforce. Diversity in the dentist workforce is even less likely to be found in rural areas (Butters, Winter. 2002). Increased diversity in the dentist workforce may address issues related to access to care for the underserved, particularly minority patients, because minority dentists are more likely to have minority patients (Haden, et al. 2003). Dental school students who are minorities, who are female and who grew up in low income families are more likely to be willing to practice in underserved areas (Davidson, et al. 2007), further reinforcing the need to increase diversity in dental school enrollment. In an effort to provide adequate care to the underserved and to a more diverse population, changes to dental school curriculums have been argued to be necessary to include training students to provide culturally appropriate care (Haden, et al. 2003). Addressing the supply of specialty dentists in Appalachia will be more difficult. They command higher salaries and need a larger population base. In 2009, Appalachia Kentucky had only 19 pediatric dentists (Shepherd, McKee. 2011). Programs that rely on specialists to lead non-specialists offer more promise. For example, Governor Steve Beshear’s Healthy Smiles Kentucky, an all-out effort to improve dental health of Kentucky’s children, particularly in Appalachia, confronts major labor shortages and is currently moving even beyond dental hygienists to create public awareness of good oral health hygiene practices through local oral health coalitions. There are similar stories from Tioga County, Pennsylvania Area Health Education Center.

An Analysis of Oral Health Disparities and Access to Services in the Appalachian Region
PDA, Inc., Cecil. G. Sheps Center/UNC-Chapel Hill, University of Mississippi Medical Center, and Mississippi State University 46 ARC Contract Nos.: CO-16034-2008 and CO-16835-2010
3.3.2 PR ACT IC E CON DIT IO N S FOR DENTA L HY GI EN I S TS In many locations, non-dentist professionals are increasing access to preventive dental care. These non-dentists include persons trained in expanded practice roles, like hygienists and dental auxiliaries, as well as other medical professionals, like pediatricians. Change is occurring slowly and practice conditions for dental hygienists in the Appalachian Region, in 2007, were among the most restrictive in the nation. South Carolina, a notable exception, ranked among the most permissive in the United States. One other Appalachian state, New York, was average. However, more than half of the Appalachian states (seven of thirteen) rated among the most restrictive. Restrictive practice conditions prevent dental hygienists from independently providing services that could increase access to care. 3.3.3 IM PL ICA TI ON S Economics of supply and demand will work against changing the oral health workforce distribution nationally. Easing the restrictions on dental hygiene practices in the Appalachian states may help to increase access to preventive care and treatment for remote populations in the Appalachian Region. It could also open the door for dental hygienists to provide oral hygiene education and make critical referrals to dentists when restorative services are necessary. Krause, Mosca and Livingston (2003) suggested that less restrictive environments for dental hygienists might alleviate some of the oral health disparities in underserved areas, assuming that tighter restrictions may block access to care. If more services can be provided without dentists physically present, especially to populations with compromised access, preventive oral health care might be made more immediately available in some cases. The Appalachian Region would also benefit from a policy initiative setting goals for minimum dental care access for all residents. This necessity would involve workforce goals. Success would be measured in generational improvements and would require engagement of training institutions, state licensure boards, the insurance industry, dentists, and public health officials, among others. Chapters 2 and 5 of this report discuss some promising state-level initiatives. Programs like those in Kentucky, West Virginia and Pennsylvania that involve multiple stakeholders: residents, dental providers and dental educators, bring changes that cross economic divides and are showing promise for sustained improvements in oral health status.