Chapter 3 – Impacts of Power Generation and Transmission
76
49 MARYLAND CUMULATIVE ENVIRONMENTAL IMPACT REPORT — 15TH EDITION Chapter 3 – Impacts of Power Generation and Transmission Striking the electric chain wherewith we are darkly bound. - Lord Byron (George Gordon Noel Byron), Childe Harold Electricity supply is a public good that has facilitated tremendous improve- ments in human health and safety as well as economic development. How- ever, the benefits of electric power are accompanied by certain impacts that are associated with both the inputs and the outputs of traditional power plants. This chapter describes each of these impact areas in some detail, and discusses PPRP’s efforts to better understand the magnitude of these impacts in Maryland and how they can be managed, minimized, and/or mitigated. Also critical to reducing environmental impacts is controlling the amount of electrical energy we use, and the amount of fossil fuel consumed to generate that electricity. Other chapters of this report provide more information on how Maryland is promoting energy efficiency and the development of more sustainable energy sources. This figure illustrates the primary environmental impacts associated with fossil fuel and nuclear plants, which produce the great majority of electricity generated in Maryland. Transmission lines are also necessary to convey electrical power from where it is generated to its industrial, commercial, and residential users.
Transcript of Chapter 3 – Impacts of Power Generation and Transmission

49
M a r y l a n d C u M u l at i v e e n v i r o n M e n ta l i M pa C t r e p o r t — 1 5 t h e d i t i o n
Chapter 3 – Impacts of Power Generation and Transmission
Striking the electric chain wherewith we are darkly bound. - Lord Byron (George Gordon Noel Byron),
Childe Harold
Electricity supply is a public good that has facilitated tremendous improve-ments in human health and safety as well as economic development. How-ever, the benefits of electric power are accompanied by certain impacts that are associated with both the inputs and the outputs of traditional power plants.
This chapter describes each of these impact areas in some detail, and discusses PPRP’s efforts to better understand the magnitude of these impacts in Maryland and how they can be managed, minimized, and/or mitigated. Also critical to reducing environmental impacts is controlling the amount of electrical energy we use, and the amount of fossil fuel consumed to generate that electricity. Other chapters of this report provide more information on how Maryland is promoting energy efficiency and the development of more sustainable energy sources.
This figure illustrates the primary environmental impacts associated with fossil fuel and nuclear plants, which produce the great majority of electricity generated in Maryland. Transmission lines are also necessary to convey electrical power from where it is generated to its industrial, commercial, and residential users.

50
M a r y l a n d C u M u l at i v e e n v i r o n M e n ta l i M pa C t r e p o r t — 1 5 t h e d i t i o n
3.1 Impacts from Generating Facilities3.1.1 AirQuality
BackgroundonAirQualityinMaryland
There are 33 power plants operating in Maryland with a capacity rating of at least two megawatts (MW), as shown in Figure 2-1 on page 13. Most (23 out of the 33) burn fossil fuels to produce electricity, which gives rise to many different air pollutants, including oxides of nitrogen (NOx), sulfur dioxide (SO2), volatile organic compounds (VOCs), particulate matter (PM), and mercury. Fossil fuel combustion also produces greenhouse gases (GHG) including carbon dioxide (CO2) and methane. To improve the quality of air, the State of Maryland has taken a number of actions to regulate air pollution, many focused on coal-fired power plants.
The federal Clean Air Act (CAA) was the first major federal environmental law in the U.S. that required the development and enforcement of regulations to protect the general public from air pollutants known to cause harmful effects to human health. The CAA authorized the United States Environmental Protection Agency (EPA) to develop ambient air qual-ity standards — referred to as National Ambient Air Quality Standards (NAAQS) — for six common air pollutants (“criteria” pollutants). The NAAQS represent the maximum pollutant concentrations that are allowable in ambient air. “Primary” NAAQS are based on health risk assessments and are designed to protect public health, including the health of sensitive populations such as asthmatics, children, and the elderly. “Secondary” NAAQS are designed to protect the public welfare by preserving visibility and preventing damage to crops, animals, vegetation, and buildings. Table 3-1 lists the current NAAQS.
The six criteria pollutants, most of which are emitted by any fossil fuel-fired power plant, are as follows:• Nitrogen dioxide (NO2) – a product of fossil fuel combustion. The generic nitrogen-based
exhaust product from power plants and other combustion sources is termed NOx and primarily composed of nitric oxide (NO) and NO2. NOx emitted by combustion sources is primarily in the form of NO, which is rapidly converted to NO2 in the atmosphere. In the presence of sunlight and heat, NO2 reacts with VOCs to form ground-level ozone (smog).
Table 3-1 National Ambient Air Quality Standards
Pollutant Averaging Times Primary NAAQS Secondary NAAQSCarbon Monoxide 8-hour 9 parts per million (ppm) (10 mg/m3) None
1-hour 35 ppm (40 mg/m3) NoneLead Rolling 3-month average 0.15 µg/m3 Same as Primary
Quarterly average 1.5 µg/m3 Same as PrimaryNitrogen Dioxide Annual arithmetic mean 0.053 ppm (100 µg/m3) Same as PrimaryParticulate Matter Annual arithmetic mean (PM2.5) 15.0 µg/m3 Same as Primary
24-hour (PM10) 150 µg/m3 (PM2.5) 35 µg/m3
Same as Primary
Ozone 8-hour 0.075 ppm Same as Primary 1-hour (applies only in limited areas) 0.12 ppm Same as Primary
Sulfur Oxides Annual arithmetic mean 0.03 ppm ------- 24-hour 0.14 ppm ------- 3-hour ------- 0.5 ppm (1,300 µg/m3)
Note: See http://www.epa.gov/air/criteria.html for additional information, including how exceedances of the standards are calculated.

51
C h a p t e r 3 — i M pa C t S o F p o W e r G e n e r at i o n a n d t r a n S M i S S i o n
• SO2 – also a product of combustion. SO2 is released when sulfur-containing fuels, such as oil and coal, are burned.
• PM – dust, soil, and liquid droplets that form during the combustion of fossil fuels or in the atmosphere by chemical transformation and condensation of liquid droplets. Particulate matter is defined by the size of its particles. PM10, for example, contains particles smaller than 10 microns in diameter. PM2.5, also referred to as “fine” particulate matter, is composed of particles 2.5 microns or smaller in diameter.
• Carbon monoxide (CO) – formed by incomplete combustion of carbon-based fuels during the combustion process.
• Lead – a metal emitted into ambient air in the form of particulate matter. • Ozone (O3) – is not emitted directly, but forms in lower levels of the atmosphere as “smog” when
NOx and VOCs react in the presence of sunlight and elevated temperatures. Several other species of oxidized nitrogen are produced from emitted NOx by reactions in the atmosphere, including nitric acid (HNO3), nitrates (NO3) and organic nitrates. Collectively, these species are referred to as NOz, and total oxidized nitrogen species (including NOx) in the atmosphere are referred to as NOy.
EPA, along with state and local regulatory agencies, including the Maryland Department of the Environment (MDE), monitor concentrations of the criteria pollutants near ground level at various locations across the country. The monitoring locations in Maryland are shown in Figure 3-1. If monitoring indicates that the concentration of a pollutant exceeds the NAAQS in any area of the country, that area is labeled a “nonattainment area” for that pollutant, meaning that the area is not attaining the national ambient air quality standard. Conversely, any area in which the concentration of a criteria pollutant is below the NAAQS is labeled an “attainment area” for that pollutant.
The attainment/nonattainment designation is made on a pollutant-by-pollutant basis. The air quality in an area, therefore, may be designated as attainment for some pollutants and nonattainment for other pollutants simultaneously. The designation is important because many air regulatory requirements are based in part on whether a source is located in an attainment area, where emissions must be limited to ensure the air stays clean, or in a nonattainment area, where emissions must be reduced to bring the area into attainment. As such, air pollution control requirements are generally more stringent for sources located in nonattainment areas.
Currently, all of Maryland is in attainment with the NAAQS for most of the criteria pollutants (SO2, NO2, PM10, CO, and lead). The entire State of Maryland has been recently designated as "attainment" for the 24-hour PM2.5 standard established in 2006. How-ever, the Baltimore area, the Washington, D.C. area, and the Hagerstown area
Figure 3-1 Maryland Monitoring Station Locations
� � � � � � � �
� � � �� � � � � � � �
� � � � � � �� � � � �
��
���
��
�
�����������������������������������
� �� �� �� ��

52
M a r y l a n d C u M u l at i v e e n v i r o n M e n ta l i M pa C t r e p o r t — 1 5 t h e d i t i o n
are designated as nonattainment for the annual PM2.5 standard, established in 1997. In addition, much of the urbanized portion of Maryland is not meeting the NAAQS for ozone. Ozone is recognized as a regional pollutant, rather than a local issue, and in the Clean Air Act Congress recognized that ozone pollution and its precursors can be transported from state to state. The Act created the Northeast Ozone Transport Region (OTR), comprised of 12 states (including Maryland) and the District of Columbia. As part of the OTR, the entire state must follow requirements as if all counties are an ozone nonattainment area, even though ozone monitoring indicates that many counties are in attainment and those counties are designated attainment.
In March 2008, EPA revised the 8-hour ozone standard to 0.075 parts per million (ppm) from the previous standard of 0.084 ppm. However, EPA announced in September 2009 that it would reconsider the 2008 ozone standard, proposing any revision by December 2009, finalizing the revision by August 2010, and completing the designation process by August 2011. States must then submit revised State Implementation Plans (SIPs) outlining how they will reduce pollution to meet the standards within three years following the final designations. Figure 3-2 depicts current ozone nonattainment area designations in Maryland.
CurrentEmissionsfromPowerPlants
According to the Commission for Environmental Cooperation of North America, power plants contribute about 22 percent of all NOx, roughly 69 percent of SO2, nearly 40 percent of mercury, and close to 39 percent of CO2 emissions to the total national emissions from all stationary, area, mobile, and other human-related sources (based on 2004 emissions data). These emissions are often discussed in terms of three classes of pollutants: criteria pollut-ants, hazardous air pollutants (HAPs), and greenhouse gases (GHGs).
CriteriaPollutants:SO2,NOx,andPMEmissions
Among the criteria pollutants, SO2 and NOx are among the most stringently regulated by EPA because they are the principal pollutants that react with water vapor and other chemi-
Figure 3-2 Ozone Nonattainment Areas
A L L E G A N Y
ANNEARUNDEL
B A L T I M O R E
CALVERT
C A R O L I N E
C A R R O L LC E C I L
C H A R L E S
D O R C H E S T E R
F R E D E R I C K
G A R R E T T H A R F O R D
H O W A R D K E N T
MONTGOMERY
P R I N C EG E O R G E ' S
Q U E E N
A N N E ' S
S T .M A R Y ' S
S O M E R S E T
T A L B O T
WASHINGTON
W I C O M I C O
W O R C E S T E R
BALT.CITY
������
���������������������������
53
C h a p t e r 3 — i M pa C t S o F p o W e r G e n e r at i o n a n d t r a n S M i S S i o n
cals in the atmosphere to create ozone smog, cause acid precipitation, and impair visibility. Recently, there has been an increased focus on particulate matter (both PM10 and PM2.5), as EPA has recognized that particulates are associated with adverse health effects, includ-ing premature mortality, cardiovascular illness, and respiratory illness. EPA continually tries to better understand which attributes of particles may be causing these health effects, who may be most susceptible to their effects, how people are exposed to PM air pollution, how particles form in the atmosphere, and what the contributions are from various sources in the different regions of the country. This research has allowed EPA to shift its focus over time from regulating total suspended particulates, to PM10, and most recently to PM2.5 emissions.
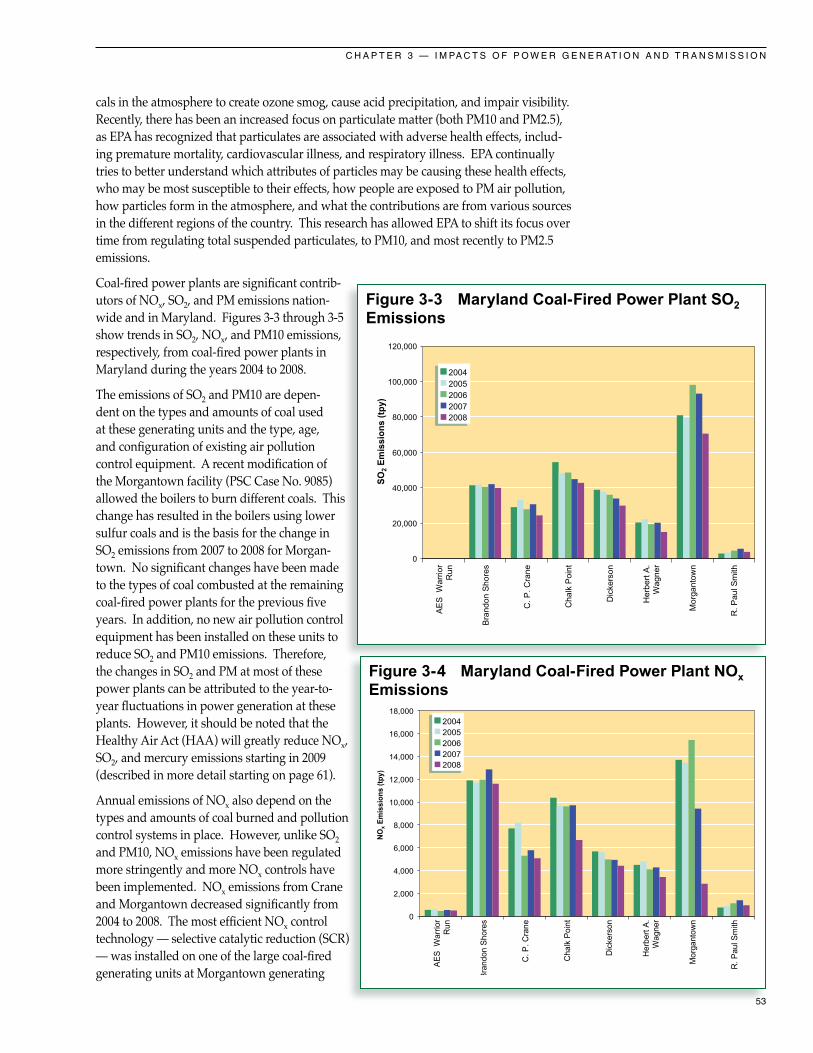
Coal-fired power plants are significant contrib-utors of NOx, SO2, and PM emissions nation-wide and in Maryland. Figures 3-3 through 3-5 show trends in SO2, NOx, and PM10 emissions, respectively, from coal-fired power plants in Maryland during the years 2004 to 2008.
The emissions of SO2 and PM10 are depen-dent on the types and amounts of coal used at these generating units and the type, age, and configuration of existing air pollution control equipment. A recent modification of the Morgantown facility (PSC Case No. 9085) allowed the boilers to burn different coals. This change has resulted in the boilers using lower sulfur coals and is the basis for the change in SO2 emissions from 2007 to 2008 for Morgan-town. No significant changes have been made to the types of coal combusted at the remaining coal-fired power plants for the previous five years. In addition, no new air pollution control equipment has been installed on these units to reduce SO2 and PM10 emissions. Therefore, the changes in SO2 and PM at most of these power plants can be attributed to the year-to-year fluctuations in power generation at these plants. However, it should be noted that the Healthy Air Act (HAA) will greatly reduce NOx, SO2, and mercury emissions starting in 2009 (described in more detail starting on page 61).
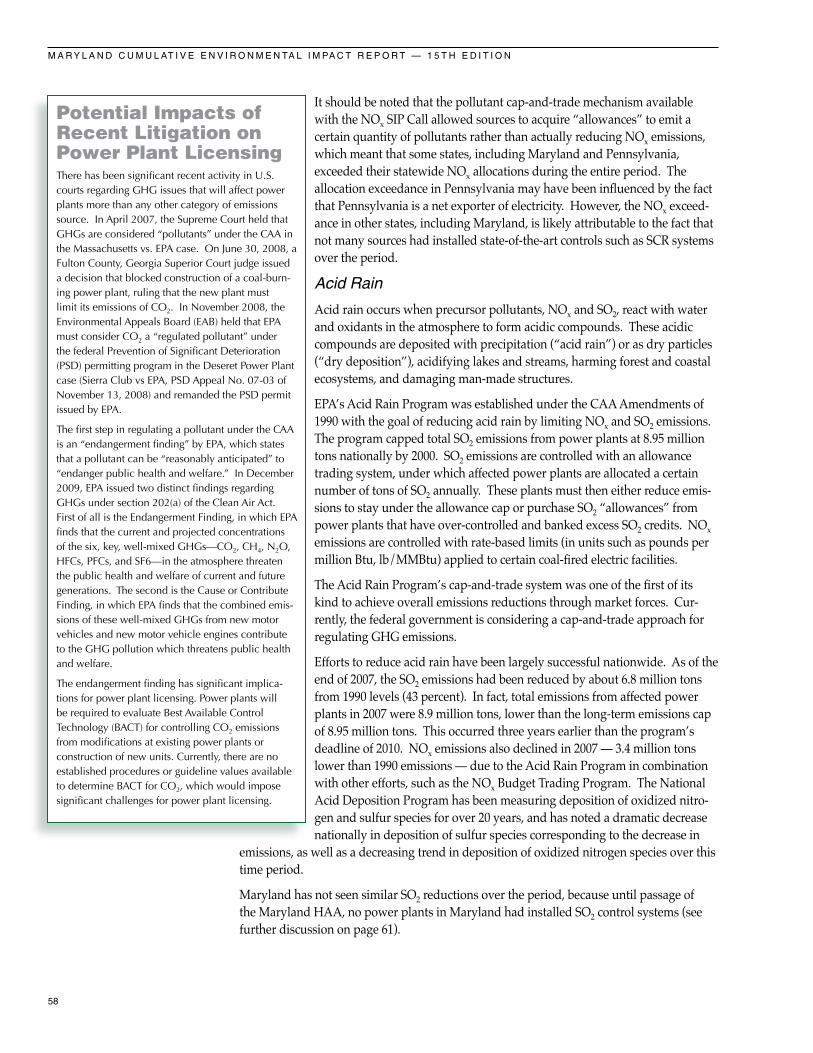
Annual emissions of NOx also depend on the types and amounts of coal burned and pollution control systems in place. However, unlike SO2 and PM10, NOx emissions have been regulated more stringently and more NOx controls have been implemented. NOx emissions from Crane and Morgantown decreased significantly from 2004 to 2008. The most efficient NOx control technology — selective catalytic reduction (SCR) — was installed on one of the large coal-fired generating units at Morgantown generating
Figure 3-3 Maryland Coal-Fired Power Plant SO2 Emissions
������
�����
����
���
����
����
���
�����
�����
��
���
����
����
�����
����
���
������
��
����
�
���
����
���
����
�����
����
��������������������
�
������
������
������
������
�������
�������
��
����
����
����
����
�
Figure 3-4 Maryland Coal-Fired Power Plant NOx Emissions
��
����
����
����
����
�
��������������������
������
�����
����
���
����
����
���
�����
�����
��
���
����
����
�����
����
���
�����
��
���
���
���
����
���
����
�����
����
�
�����
�����
�����
�����
������
������
������
������
������

54
M a r y l a n d C u M u l at i v e e n v i r o n M e n ta l i M pa C t r e p o r t — 1 5 t h e d i t i o n
facilities during this time period, and a process control/process optimization software was installed at Crane, both of which greatly reduced NOx emissions.
HazardousAirPollutantEmissions
In 1990, Congress amended the CAA to regulate a class of pollutants that cause or might cause an adverse impact to health or the environment. These pollutants are referred to as HAPs. There are currently 187 pollutants on EPA’s list of CAA HAPs. Although some HAPs can occur natu-rally (such as asbestos or mercury), most HAPs originate from man-made mobile or stationary industrial sources such as factories, refineries, and power plants.
Although fossil fuel-fired power plants emit HAPs, chemical plants and petroleum refineries
that use and emit highly toxic compounds have historically been considered more significant sources of air toxics than power plants. Prior to the CAA Amendments of 1990, EPA regulations did not apply to HAP emissions from power plants, and even with passage of the Amendments of 1990, power plant HAP emissions were addressed differently by Congress than those from other industrial sources. While many states, including Maryland, have developed toxic air pollutant (TAP) regulations, fuel burning sources in Maryland are exempt from TAP regulations.
Among the HAPs emitted by power plants, mercury is a pollutant of primary concern because of its significant adverse health effects. Coal-fired power plants account for nearly 75 percent of the total mercury and mercury compounds emitted in Maryland during any given year. Figure 3-6 presents annual emissions of mercury from Maryland’s coal-fired power plants from 2004 through 2008 from the Toxic Release Inventory (TRI). However, emissions from Crane have been calculated using stack test information for 2004 through 2008 .
Figure 3-7 presents annual emissions of HAPs, as reported to EPA by Maryland’s coal-fired power plants under the TRI program. The volume of HAPs reported in the TRI database is large, due mainly to large amounts of hydrochloric acid (HCl) being emitted from coal-fired power plants. HCl emissions contribute to dry and wet acidic deposition. Although HCl has been linked with both minor acute and chronic effects, EPA has not classified HCl for carcinogenicity.1 In response to the HAA, many coal-fired power plants in Maryland are installing flue gas desulfur-ization (FGD) systems for SO2 control, which will also reduce HCl emissions.
GreenhouseGasEmissions
A GHG is broadly defined as any gas that absorbs infrared radiation in the atmo-sphere. Common GHGs include water vapor, CO2, methane, NOx, ozone, hydro-chlorofluorocarbons (HCFCs), hydrofluorocarbons (HFCs), perfluorocarbons (PFCs), and sulfur hexafluoride (SF6). Note that EPA recently issued a Greenhouse Gas Reporting Rule (see Section 4.2.4 for details) which includes many of these compounds (and more). The principal GHGs that enter the atmosphere above
Figure 3-5 Maryland Coal-Fired Power Plant PM10 Emissions ����
��������������������
���
���
����
���
���
����
���
���
����
����
���
������
���
���
���
����
����
���
�����
����
���
����
���
���
����
���
�����
���
�����
����
���
�����
����
�
���
���
���
���
�����
�����
��
����
���
������
�����
Interpollutant TradingOn May 16, 2008, EPA published its final rule entitled Implementation of the New Source Review Program for Particulate Matter Less Than 2.5 Micrometers (PM2.5) in the Federal Register (73 FR 28321). The final rule was effective on July 15, 2008. This rule not only allowed for the trading of direct fine particulate matter (PM2.5) but also allowed for the trading of PM2.5 precursors in lieu of direct PM2.5, at given ratios.
Based on EPA’s final PM2.5 ruling, the Pennsylvania Department of Environmental Protection (PADEP) in February 2009 was one of the first state agencies to authorize interpollutant trading of PM2.5 precursors for PM2.5, and also to authorize trading between nonattainment areas. PADEP authorized the transfer and use of 331 tons per year (tpy) of PM2.5 as offsets, which were generated from the interpollutant trading of 13,241 tpy of SO2 emission reduction credits (ERCs) using the EPA recommended interpollutant trading ratio of 40 tons of SO2 to one ton of PM2.5. These PM2.5 ERCs were generated by the shutdown of PPL’s Holtwood facility in Lancaster County and were transferred to Conectiv Mid Merit, LLC, for use at its gas-fired generating units located in York County, Pennsylvania.
1 http://www.epa.gov.ttn.atw.hlthef/hydrochl.html#ref4

55
C h a p t e r 3 — i M pa C t S o F p o W e r G e n e r at i o n a n d t r a n S M i S S i o n
natural levels due to human activities are:• Carbon dioxide (CO2): Carbon dioxide enters
the atmosphere through the burning of fossil fuels (oil, natural gas, and coal), solid waste, trees and wood products, and also as a result of other chemical reactions (e.g., manufacture of cement). Carbon dioxide is also removed from the atmosphere (or “sequestered”) when it is absorbed by plants as part of the biological carbon cycle.
• Methane (CH4): Methane is emitted during the production and transport of coal, natural gas, and oil. Methane emissions also result from livestock and agricultural processes and from the decay of organic waste in municipal solid waste landfills.
• Nitrous oxide (N2O): Nitrous oxide is emitted during agricultural and industrial activities, as well as during combustion of fossil fuels and solid waste.
• Fluorinated gases: Hydrofluorocarbons, perfluorocarbons, and sulfur hexafluoride are synthetic, powerful GHGs that are emitted from a variety of industrial processes. Fluori-nated gases are sometimes used as substitutes for ozone-depleting substances (i.e., CFCs, HCFCs, and halons). These gases are typically emitted in smaller quantities, but because they are potent GHGs, they are sometimes referred to as High Global Warming Potential gases.2
According to the EPA study, Inventory of U.S. Greenhouse Gas Emissions and Sinks: 1990-2007, total GHG emissions in the United States increased about 17 percent from 1990 to 2007. This rise can be attributed largely to the increasing demand for heating fuels and electricity. As Figure 3-8 illustrates, the four major sectors contributing to CO2 emissions from fossil fuel consumption (as defined by EPA) are transportation, industrial, residential, and commercial. The EPA report breaks down the major sectors even further into electric-ity generation (power plants) and combustion. In 1990, the electricity portion accounted for 48 percent of the total GHG emissions; in 2007, the electricity portion accounted for more than 54 percent of total GHG emissions.
Figure 3-9 illustrates CO2 emissions from Maryland power plants for the years 2004 through 2008. In an effort to reduce CO2 emissions, Maryland recently joined the Regional Greenhouse Gas Initiative (RGGI), which is a cooperative effort by Northeastern and Mid-Atlantic states to reduce CO2 emissions through a market-driven regional cap-and-trade program (see further discussion in Section 4.2.1).
2 http://www.epa.gov/climatechange/emissions/
Figure 3-6 Maryland Coal-Fired Power Plant Mercury Emissions
�
���
���
���
���
���
���
���
������
�����
����
�����
�����
��
���
����
����
�����
����
���
����
����
���
���
������
��
����
�
���
����
���
����
�����
����
��������������������
���
����
���
����
����
�����
���
����
��
Figure 3-7 Maryland Coal-Fired Power Plant HAPs Emissions
��������������������
���
���
����
���
���
����
���
����
���
���
���
����
�����
����
��
���
�������
�����
����
���
����
���
����
���
��
���
�
�����
�����
�����
�����
�����
�����
�����
�����
�����
������
��������
������
������
����
����
���

56
M a r y l a n d C u M u l at i v e e n v i r o n M e n ta l i M pa C t r e p o r t — 1 5 t h e d i t i o n
ImpactsfromPowerPlantAirEmissions
Ozone
The persistent ozone “smog” problem in many areas of the country has been one of the most important drivers for regulation of power plant NOx emissions over the past decade. Ozone exists naturally in the upper levels of the atmosphere (from 6 to 30 miles above the Earth’s surface) and protects the Earth from harmful ultraviolet rays. Although ozone is helpful in the stratosphere, it is harmful when it occurs in the troposphere, or the layer clos-est to the Earth’s surface. Ozone is an invisible, but very reactive, gas that is the major com-ponent of photochemical smog. It is not emitted directly into the atmosphere in significant amounts but instead forms through chemical reactions in the atmosphere. Ground-level ozone is formed when the precursor compounds — NOx from both mobile and stationary combustion sources (such as automobiles and power plants, respectively); and VOCs from
Figure 3-9 Maryland Power Plant CO2 Emissions
�
���������
���������
���������
���������
���������
���������
���������
���������
���������
������
�����
����
���
����
����
���
�����
�����
��
���
����
����
�����
����
���
������
��
����
�
���
����
���
����
�����
����
��������������������
��
����
����
����
����
�
Figure 3-8 CO2 Emissions in the United States
Source: U.S.EPA
������������������
��������������
���������������
��������������
�������������������
�
�����
�����
�����
�����
�����
�����
�����
���� ����
��
���
���
����������������������������������
��������������������������������������������
2007 Breakdown by Sector

57
C h a p t e r 3 — i M pa C t S o F p o W e r G e n e r at i o n a n d t r a n S M i S S i o n
industrial, chemical, and petroleum facilities and from natural sources — react in the pres-ence of sunlight and elevated temperatures. Ozone levels are consequently highest during the summer months when temperatures are higher, the hours of daylight are greater, and the sun’s rays are more direct.
Weather plays such an important rule in the formation of ozone that EPA has established an “ozone season” for each of the states, and has developed regulations that require power plants to restrict NOx emissions during the summer months. Maryland’s ozone season extends from April through October (when hot, stagnant conditions are most prevalent).
Ground-level ozone is a problem, not only because it creates unsightly smog and inhibits visibility, but also because of the adverse human health effects it can cause. Breathing air with high ozone concentrations can cause chest pain, throat irritation, and congestion; it can also worsen pre-existing conditions like emphysema, bronchitis, and asthma. Children and the elderly are especially vulnerable to health problems caused by ground-level ozone.
Ozone is a regional problem, and transport of ozone and its precursors across large sections of the United States makes the control and reduction of ozone smog a particularly difficult issue. As mentioned earlier, while much of Maryland achieves the ambient ozone stan-dards, the entire state is designated nonattainment for ozone because of the regional nature of ozone. All of the eastern states from northern Virginia through Maine are collectively referred to as the “Northeast Ozone Transport Region.”
Because ozone pollution is a regional phenomenon, it cannot be addressed effectively on a state-by-state basis. To address regional ozone concerns, EPA, in September 1998, finalized a rule based on analysis conducted by the Ozone Transport Assessment Group (OTAG). The rule requires Maryland, 22 other states, and the District of Columbia to develop regulations to be incorporated into each state’s State Implementation Plan (SIP) to reduce regional transport of ozone from stationary sources of NOx. Because the regulation called for changes to SIPs from this group of states, it is known as the “NOx SIP Call,” and it required power plants and some other large sources to achieve regional reductions in NOx emissions of 70 percent from baseline years beginning in the ozone season 2004. Power plants and other large NOx sources in Maryland and the region reduced emissions to meet the goals of the NOx SIP Call; however, ozone pollution continues to be a problem in the East. Therefore, power plants in the region are also now subject to additional NOx control requirements, including recently enacted federal and State programs.
The NOx rules have resulted in significant reductions in summertime emissions of NOx from sources in Maryland and surrounding states. Between 1999 and 2006, Maryland and surrounding states showed an increase in the number of installations of more advanced NOx controls, such as SCR and selective non-catalytic reduction (SNCR), and an overall increase in the number of NOx control systems. For Maryland and the surrounding five states including Washington D.C., the following observations can be made regarding compliance with the NOx SIP Call: • The number of generating units without any NOx controls dropped significantly in all five states
after the rule (D.C. is the only exception); • Low-NOx burners (LNBs) and over fire air were predominantly used as the NOx control before
and after the rule and the percentage of these type of controls increased with implementation of the rule; and
• Fewer than 20 percent of the units in all six states combined had SCR or SNCR systems after the rule became effective.
58
M a r y l a n d C u M u l at i v e e n v i r o n M e n ta l i M pa C t r e p o r t — 1 5 t h e d i t i o n
It should be noted that the pollutant cap-and-trade mechanism available with the NOx SIP Call allowed sources to acquire “allowances” to emit a certain quantity of pollutants rather than actually reducing NOx emissions, which meant that some states, including Maryland and Pennsylvania, exceeded their statewide NOx allocations during the entire period. The allocation exceedance in Pennsylvania may have been influenced by the fact that Pennsylvania is a net exporter of electricity. However, the NOx exceed-ance in other states, including Maryland, is likely attributable to the fact that not many sources had installed state-of-the-art controls such as SCR systems over the period.
AcidRain
Acid rain occurs when precursor pollutants, NOx and SO2, react with water and oxidants in the atmosphere to form acidic compounds. These acidic compounds are deposited with precipitation (“acid rain”) or as dry particles (“dry deposition”), acidifying lakes and streams, harming forest and coastal ecosystems, and damaging man-made structures.
EPA’s Acid Rain Program was established under the CAA Amendments of 1990 with the goal of reducing acid rain by limiting NOx and SO2 emissions. The program capped total SO2 emissions from power plants at 8.95 million tons nationally by 2000. SO2 emissions are controlled with an allowance trading system, under which affected power plants are allocated a certain number of tons of SO2 annually. These plants must then either reduce emis-sions to stay under the allowance cap or purchase SO2 “allowances” from power plants that have over-controlled and banked excess SO2 credits. NOx emissions are controlled with rate-based limits (in units such as pounds per million Btu, lb/MMBtu) applied to certain coal-fired electric facilities.
The Acid Rain Program’s cap-and-trade system was one of the first of its kind to achieve overall emissions reductions through market forces. Cur-rently, the federal government is considering a cap-and-trade approach for regulating GHG emissions.
Efforts to reduce acid rain have been largely successful nationwide. As of the end of 2007, the SO2 emissions had been reduced by about 6.8 million tons from 1990 levels (43 percent). In fact, total emissions from affected power plants in 2007 were 8.9 million tons, lower than the long-term emissions cap of 8.95 million tons. This occurred three years earlier than the program’s deadline of 2010. NOx emissions also declined in 2007 — 3.4 million tons lower than 1990 emissions — due to the Acid Rain Program in combination with other efforts, such as the NOx Budget Trading Program. The National Acid Deposition Program has been measuring deposition of oxidized nitro-gen and sulfur species for over 20 years, and has noted a dramatic decrease nationally in deposition of sulfur species corresponding to the decrease in
emissions, as well as a decreasing trend in deposition of oxidized nitrogen species over this time period.
Maryland has not seen similar SO2 reductions over the period, because until passage of the Maryland HAA, no power plants in Maryland had installed SO2 control systems (see further discussion on page 61).
Potential Impacts of Recent Litigation on Power Plant LicensingThere has been significant recent activity in U.S. courts regarding GHG issues that will affect power plants more than any other category of emissions source. In April 2007, the Supreme Court held that GHGs are considered “pollutants” under the CAA in the Massachusetts vs. EPA case. On June 30, 2008, a Fulton County, Georgia Superior Court judge issued a decision that blocked construction of a coal-burn-ing power plant, ruling that the new plant must limit its emissions of CO2. In November 2008, the Environmental Appeals Board (EAB) held that EPA must consider CO2 a “regulated pollutant” under the federal Prevention of Significant Deterioration (PSD) permitting program in the Deseret Power Plant case (Sierra Club vs EPA, PSD Appeal No. 07-03 of November 13, 2008) and remanded the PSD permit issued by EPA.
The first step in regulating a pollutant under the CAA is an “endangerment finding” by EPA, which states that a pollutant can be “reasonably anticipated” to “endanger public health and welfare.” In December 2009, EPA issued two distinct findings regarding GHGs under section 202(a) of the Clean Air Act. First of all is the Endangerment Finding, in which EPA finds that the current and projected concentrations of the six, key, well-mixed GHGs—CO2, CH4, N2O, HFCs, PFCs, and SF6—in the atmosphere threaten the public health and welfare of current and future generations. The second is the Cause or Contribute Finding, in which EPA finds that the combined emis-sions of these well-mixed GHGs from new motor vehicles and new motor vehicle engines contribute to the GHG pollution which threatens public health and welfare.
The endangerment finding has significant implica-tions for power plant licensing. Power plants will be required to evaluate Best Available Control Technology (BACT) for controlling CO2 emissions from modifications at existing power plants or construction of new units. Currently, there are no established procedures or guideline values available to determine BACT for CO2, which would impose significant challenges for power plant licensing.

59
C h a p t e r 3 — i M pa C t S o F p o W e r G e n e r at i o n a n d t r a n S M i S S i o n
VisibilityandRegionalHaze
PM2.5 consists of particles (such as dust, soot, and liquid droplets) that are about 1/30th the diameter of a human hair. PM2.5 can be emitted directly from stacks or created when gases react to form particles during transport in the atmosphere. Fine particulate matter is different from many other air pollutants in that it is not a chemical compound itself, but is comprised of various compounds in particle form. Common sources include:• Smoke and soot from forest fires,• Wind-blown dust, • Fly ash from coal burning, • Particles emitted from motor vehicles,• Hydrocarbons associated with vehicles, power plants, and natural vegetation
emissions, and • SO2 and NOx emitted from fossil fuel combustion.
PM2.5 is not the only contributor to decreased visibility and regional haze. Certain gases and larger particles can also interfere with the ability of an observer to view an object. In general, visibility refers to the conditions which can facilitate the appreciation of natural landscapes. The national visibility goal, established as a part of the CAA Amendment of 1977, requires improving the visibility in federally managed “Class I areas.” These areas include more than 150 parks and wilderness areas across the United States that are considered pristine air quality areas (see Figure 3-10 for the protected area near Maryland). Since 1988, EPA and other agencies have been monitoring visibility in these areas.
Beginning in 2004, PPRP has participated in a coordinated effort with Northeast States for Coordinated Air Use Management (NESCAUM) and the State of Vermont to evaluate impacts of visibility-impairing sources in the eastern United States. The study evaluated the tools and techniques currently available for identifying contributions to regional haze in the Northeast and Mid-Atlantic regions. PPRP was involved with the application of a dispersion model, CALPUFF, for estimating visibility degradation in Class I areas. The model identified the contributions of sources in different states in the eastern United States to visibility impairment in various Class I areas in the region. PPRP continues to support and contribute to this ongoing work. PPRP also evaluates the impacts of new power plants on Class I visibility to ensure that growth in the electrical generating sector does not contribute to impairment in these important areas.
Visible Plume Formation – Modeling AnalysisIn response to stringent emissions limits in the Maryland HAA, several coal-fired power plants in Maryland are installing state-of-the-art FGD “scrubbers” to reduce emissions of SO2. The scrubbing process uses water, which adds moisture to the cleaned exhaust gases leav-ing the boiler. This moist exhaust will condense when it leaves the stack, forming airborne water droplets that will be visible to the naked eye. The appearance of the exhaust plume will be similar to that of a cloud. The frequency and duration of this “visible plume” will depend largely on ambient weather conditions.
One of the power plants that will install an FGD scrubber is Mirant’s Morgantown Generating Station located along the Potomac River, adjacent to US Route 301. The presence of a visible plume in close proximity to this major bridge was a concern to local residents and Maryland transportation officials. PPRP undertook a modeling analysis of the expected plume, using established visible plume modeling techniques as well as new techniques developed by PPRP exclusively for this application. The analysis showed that occurrence of ambient meteorological conditions favoring plume formation near the bridge will be infrequent, and that plume-inducing fog will not pose a risk to the safety of motorists using the bridge.
PPRP worked with the Maryland Transportation Author-ity (MTA) and Mirant during the course of this analysis. MTA has taken steps to install fog sensing equipment on the bridge to warn motorists of any fogging hazard. Since the modeling analysis showed that there would be low occurrences of plume induced fog on the bridge, and since MTA will install fog sensing equip-ment, PPRP concluded that public safety on the bridge will be assured.
Figure 3-10 Class I Areas Near Maryland
� � � � � � � �
� � � � � � � � � � � � �
� � � � � � �� � � � �
� � �
� � � � � �
��
���
��
��������������������������
������������������������
�����������������������
��������������������������������
60
M a r y l a n d C u M u l at i v e e n v i r o n M e n ta l i M pa C t r e p o r t — 1 5 t h e d i t i o n
NitrogenDeposition
The Chesapeake Bay is the largest estuary in the United States. Protection and restoration of living resources in the Bay has been the goal of the Chesapeake Bay Program since its inception in 1983. The program is a regional partnership which comprises the states of Maryland, Pennsylvania, and Virginia, the Chesapeake Bay Commission, EPA, and other participating advisory groups.
Reducing nitrogen input from controllable sources is a high priority because excess nitrogen is one of the major sources of eutrophication — caused by the increase of chemical nutrients, typically containing nitrogen or phosphorus — in the Chesapeake Bay. Eutrophi-cation is a process whereby water bodies, such as lakes or estuaries, receive excess nutrients that stimulate excessive plant and algal growth and, ultimately, reduces the dissolved oxygen in the water, thus limiting the oxygen available for use by aquatic organisms. The 1987 Chesapeake Bay Agreement established a goal of reducing controllable nitrogen by 40 percent compared to 1985 levels, and program participants reaffirmed that goal in their 2000 agreement. Although these goals were once again reaffirmed in the 2010 agreement, the Chesapeake Bay partners have acknowledged that the goals would not be met and EPA has initiated a process of developing a total maximum daily load (TMDL) target for the Bay. The Chesapeake Bay Program estimates that approximately 30 percent of the nitrogen load to the Bay comes from atmospheric deposition and subsequent transport of nitrogen through the watershed. Much of this loading comes from NOx emissions from power plants, industrial sources, and mobile sources. Increased efforts have been devoted recently to the role of ammonia in deposition processes.
For more than a decade, PPRP has evaluated the regional sources of NOx emissions and their impacts on the Chesapeake Bay. As a part of this effort, advanced computer modeling systems are used to simulate the transport and subsequent deposition of emissions from these regional sources to the Chesapeake Bay. The actual loading to the Bay is calculated using a methodology similar to that used by the United States Geological Survey for its land-to-bay models. The model allows PPRP to evaluate the relative contribution of Maryland sources and other regional sources to deposition totals. As a part of this study, PPRP has developed an “emissions credit and benefit” scheme to evaluate the impacts of emission reductions for sources located in different states. Using this scheme, regional and local planning agencies can better plan for emission reduction strategies to meet Bay restoration goals.
Recently, PPRP has started working with researchers at the University of Pittsburgh on an issue that is of interest to the Chesapeake Bay Science & Technology Advisory Committee. This work focuses on understanding the magnitude of impacts of nitrogen deposition in close proximity to sources of NOx. Recent studies have shown that these “local impacts” may be associated with significantly higher rates of deposition than previously thought. The University of Pittsburgh researchers have collected local nitrogen deposition measure-ments, and PPRP is working with the researchers to model local impacts and compare model predictions with measurements. This work is particularly timely and relevant since EPA has recently taken action to address ambient standards for NO2. Specifically, EPA has proposed (July 15, 2009) to introduce a one-hour standard for NO2 aimed in part at reducing impacts near roadways. EPA separately has initiated a review of the secondary standard for NO2 in conjunction with the secondary standard for sulfur oxides. Secondary standards development is scheduled to be completed in 2010.
MercuryImpacts
The primary stationary sources of mercury in the U.S. are, in order of decreasing emissions, coal-fired power plants, gold mining, municipal waste combustors, chlor-alkali plants,

61
C h a p t e r 3 — i M pa C t S o F p o W e r G e n e r at i o n a n d t r a n S M i S S i o n
medical waste incinerators, and cement plants. Emissions from some source categories — notably medical waste incinerators — have decreased dramatically in recent years due to stringent EPA regulations.
Since power plants contribute approximately 75 percent of the total mercury emissions in Maryland, PPRP plays a significant role in supporting scientific research on this topic. PPRP has been actively involved in the study of regional sources of mercury emissions and their impacts on the Chesapeake Bay. In cooperation with the University of Maryland, PPRP has sponsored several deposition monitoring programs and continues to evaluate the impacts of toxic emissions from power plants in Maryland. A mercury monitor has been in operation in Beltsville, Maryland, since June 2004. In June 2005, PPRP initiated a project to measure ambient air mercury concentrations at the Piney Run monitoring site in Garrett County, Maryland, using a continuous mercury monitoring instrument. This state-of-the-art monitoring effort will provide valuable data to the mercury research community. PPRP is also involved with other on-going projects related to the effects of mercury emissions. The first project involves working with the Smithsonian Environmental Research Center and the University of Maryland Center for Environmental Science – Chesapeake Bay Laboratory to investigate the biogeochemistry of the processes involved with the fate of atmospheric mercury and how it ends up in fish tissue. In another cooperative project with MDE, researchers are monitoring mercury tissue burden in young fish — a long-term effort that will lead to a better understanding of trends in mercury impacts.
In 2002, Maryland issued a state-wide fish consumption advisory for lakes, reservoirs, and other impoundments due to high mercury levels in fish. This advisory is currently still in effect. PPRP has been involved in conducting a complex modeling study to estimate the quantity of mercury from Maryland and other regional sources that is deposited in water bodies throughout the state. The location of sources of mercury emissions close to Maryland, and the location of some of the water bodies and watersheds evaluated in PPRP’s study, are shown in Figure 3-11.
Implementation of the Maryland HAA will reduce mercury deposition in Maryland by approximately 30 percent. The role of power plants in contributing to mercury deposition within the state, compared to non-power plant regional sources and global background sources, will be greatly reduced.
TheEffectsoftheMarylandHealthyAirActof2006
The Maryland HAA was signed into law in April 2006, and MDE developed enabling regulations for the HAA that became effective in January 2007. The HAA requires substan-tial reductions in emissions of NOx, SO2, and mercury from 15 coal-fired generating units
Figure 3-11 Location of Mercury Sources and Watersheds within Maryland
62
M a r y l a n d C u M u l at i v e e n v i r o n M e n ta l i M pa C t r e p o r t — 1 5 t h e d i t i o n
at seven power plants in Maryland. The HAA also requires Maryland to participate in a multi-state program known as RGGI to reduce emissions of pollutants, including CO2, that contribute to climate change. HAA-mandated emissions reductions will take place in two phases; Phase I begins in 2009/2010, and Phase II will begin in 2012/2013, depending on the pollutant.
The HAA regulates NOx and SO2 emissions based on a pollutant “cap-and-trade” program in which the State establishes annual, state-wide total tonnage emissions caps separately for NOx and SO2, and then allocates a portion of the annual state-wide caps to each of the 15 individual coal-fired power plant generating units subject to the HAA. Power plant owners can comply by reducing emissions at each unit to meet the unit’s cap, or can com-ply with the caps on a system-wide basis, by over-controlling emissions at some plants and trading the excess allowances to other HAA plants that the company owns and operates in Maryland.
The mercury provisions of the HAA do not allow a cap-and-trade program, but require each power plant to achieve a percentage reduction in emissions of mercury from a baseline year of at least 80 percent for Phase I (2010) and 90 percent beginning in Phase II (2013) and thereafter.
In response to the HAA, several of the coal-fired power plants are installing state-of-the-art air pollution control equipment. Most fossil fuel-fired power plants in Maryland are already equipped with some type of air pollution control systems for PM and NOx emissions; however, no power plants in Maryland currently have any add on SO2 controls in operation (although some have switched to burning coal with lower sulfur contents). Under the HAA, power plants in Maryland have flexibility in choosing how they will achieve NOx, SO2 and mercury emissions reduction targets. Even with this flexibility, most of the coal-fired generating units in Maryland are planning to install major new air pollu-tion control systems to reduce NOx, SO2, and mercury, as described below.
ProposedHAAAirPollutionControlProjects
Brandon Shores
The HAA project for Constellation’s Brandon Shores power plant will include the installa-tion of an air pollution control system for each of the two large coal-fired boilers consisting of a wet FGD system for SO2 and mercury removal, a fabric filter baghouse for PM control, powered activated carbon (PAC) injection equipment for removal of mercury, and a sorbent injection system for the reduction of sulfuric acid mist (SAM). The FGD system is predicted to reduce SO2 emissions up to 96 percent. The combination of the PAC system along with the co-benefit of the wet FGD is predicted to reduce mercury emissions up to 90 percent. The co-benefit of the FGD and the use of the SAM injection system is predicted to reduce SAM by up to 80 percent. In past projects, Constellation equipped Brandon Shores Units 1 and 2 with SCR systems for ozone season (May through September) NOx reduc-tions of approximately 90 percent. The company began operating the SCR year-round in January 2009 to reduce annual emissions.
Figure 3-12 is a schematic showing the flue gas and air pollution control train at Brandon Shores. The equipment to the left of the vertical line depicts the existing system (boiler to existing stack). The two sides together (to the left and to the right of the vertical line) depict the design after implementation of the HAA pollution control project. Construction of the HAA pollution control project at Brandon Shores began in 2007 and is scheduled to be completed in the first quarter of 2010.

63
C h a p t e r 3 — i M pa C t S o F p o W e r G e n e r at i o n a n d t r a n S M i S S i o n
H.A. Wagner Generating Station
Constellation received a Certificate of Public Convenience and Necessity (CPCN) that allowed the company flexibility to choose among three alternatives to reduce NOx from Unit 2 and two alternatives to reduce mercury from both Unit 2 and Unit 3 at the Wagner power plant. Proposed NOx alternatives include the installation of a technology known as Rotating Opposed Fired Air (ROFA®), an SNCR system, or both. To reduce NOx emissions from Wagner Unit 2, Constellation installed an SNCR system at the end of 2008 that should achieve reductions of up to 30 percent from this generating unit. In a past project, Constel-lation installed a state-of-the-art SCR system that can achieve approximately 90 percent NOx reduction from Wagner Unit 3 during the ozone season. Similar to Brandon Shores, Constellation began operating the Wagner Unit 3 SCR year-round in January 2009 to reduce annual NOx emissions.
Constellation began installing activated carbon injection (ACI) systems on Wagner Units 2 and 3 in April 2009 to control mercury emissions. These systems are expected to be operational prior to the end of 2009. Constellation will address SO2 reductions from Wagner through sorbent additives, fuel switching to lower sulfur coals and/or using excess emissions allowances from over-controlling Brandon Shores or other plants.
C.P. Crane Generating Station
As with Wagner, Constellation received a CPCN that granted the company flexibility to choose among four alternatives to reduce NOx and mercury from Units 1 and 2. NOx alternatives include various forms of SNCR technologies. Mercury alternatives include ACI and furnace sorbent injection.
Near the end of 2008, Constellation installed SNCR systems on Crane Units 1 and 2, which are targeted to achieve NOx emission reductions of up to 50 percent. For mercury emission control, Constellation began installing a PAC injection system for both Crane units in April 2009. These systems are expected to be operational before the end of 2009. Constellation will address SO2 reductions from Crane through fuel switching to lower sulfur coals or using excess emissions allowances from over-controlling at other Constellation plants.
Morgantown Generating Station
Coal-fired Units 1 and 2 at Mirant’s Morgantown Generating Station are currently equipped with cold-side electrostatic precipitators (ESPs) for particulate emission control, and a combination of LNBs and separated overfire air (SOFA) to control NOx emissions. State-of-the-art SCR systems were installed on each unit to provide additional NOx control; the systems became operational in 2007 (Unit 1) and 2008 (Unit 2).
Figure 3-12 Schematic of the Flue Gas Train at Brandon Shores
������ ��� ��� ��������������
������
�����
����������������
������������
������������
���������� ���
���������������
�����
�����������������������
�����
�������� ���

64
M a r y l a n d C u M u l at i v e e n v i r o n M e n ta l i M pa C t r e p o r t — 1 5 t h e d i t i o n
Mirant’s HAA air pollution control project for Morgantown consists of wet FGD systems and SAM controls, as well as associated enhancements of the facility necessary for the operation of these systems. The wet FGD is predicted to reduce SO2 emissions up to 92 percent. The co-benefit of both the FGD and the use of an interim SAM injection system is predicted to reduce SAM by at least 69 percent. Mercury emissions will be reduced as a result of the operation of the SCR and FGD systems. Construction of the FGD systems is scheduled to be completed and operations started by late 2009 and early 2010 to coincide with the planned shutdown periods for both units. Space has been allocated for future installation of baghouses and/or ACI equipment if additional mercury emission controls are required.
Chalk Point Generating Station
Current control equipment on Mirant’s Chalk Point Unit 1 includes LNB with overfire air for NOx control and ESPs for PM control. A selective autocatalytic reduction (SACR) system was installed on Unit 2 for NOx control in 2006. An SCR system was installed on Unit 1 to comply with the HAA NOx limitations; the system became operational during the 2008 ozone season. The SCR is predicted to reduce NOx emissions by at least 85 percent. Mirant is also installing a wet FGD system at Chalk Point to reduce SO2 emissions. The FGD systems are predicted to reduce SO2 emissions by at least 92 percent. SAM will be controlled by sorbent injection, resulting in a predicted reduction of at least 62 percent. Mercury emissions will be reduced as a co-benefit of the operation of these new pollution control technologies. The construction associated with the FGD systems is scheduled to be completed and operations started by late 2009 and early 2010 to coincide with the planned shutdown periods for both units. As with Morgantown, space has been allocated for future installation of baghouses and/or ACI equipment if additional mercury emissions control is required.
Dickerson Generating Station
Current air pollution control systems at Mirant’s Dickerson station in Montgomery County include high-efficiency particulate matter control devices and LNB with SOFA for NOx con-trol. Mirant installed SNCR systems to reduce NOx emissions from all three of the plants coal-fired units, which began operation during the 2008 ozone season. The SNCR systems were predicted to reduce NOx emissions by approximately 25 percent from the previous years. Additional HAA controls being installed at Dickerson include a wet FGD system to reduce SO2 emissions by at least 92 percent. SAM will be controlled by sorbent injection, resulting in a reduction of at least 49 percent. Mercury emissions will be reduced as a co-benefit of the operation of these new pollution control technologies. The construction associated with the FGD systems is scheduled to be completed and operations started by late 2009 and early 2010 to coincide with the planned unit shutdown periods for all three units. Space has been allocated for future installation of baghouses and/or ACI equipment if additional mercury emissions control is required.
R.P. Smith Generating Station
Allegheny Energy Supply owns and operates the R.P. Smith generating station in Wash-ington County, Maryland. To date, Allegheny has not indicated how the R.P. Smith facility will comply with the HAA. The ESP on the plant's Unit 4 was replaced with an electro-static fabric filter (ESFF) technology manufactured by GE Energy. The installation of this new ESFF will bring a co-benefit of reducing mercury emissions.

65
C h a p t e r 3 — i M pa C t S o F p o W e r G e n e r at i o n a n d t r a n S M i S S i o n
AirQualityBenefits
The implementation of the HAA will result in significant decreases in emissions of SO2, NOx, and mercury from coal-fired power plants in Maryland. These reductions will result in anticipated improvements in air quality within Maryland, including improvements related to ground-level ozone concentrations, acid deposition, mercury and nutrient load-ing to the Chesapeake Bay and watershed, and reduced concentrations of sulfate aerosols that contribute to the current nonattainment status for PM2.5.
As part of the licensing process for these HAA pollution control activities over 2006-2007, PPRP assessed impacts of each of the projects separately. In a recent follow-up project, PPRP conducted an air quality modeling analysis to quantify the cumulative benefits of all seven of the HAA emissions reductions projects. In less than 12 months, PPRP conducted environmental impact analyses for more than seven major licensing cases and a cumulative impact analysis for all of the pollution control projects.
PPRP’s analysis indicates that the HAA will have a significant positive effect on the envi-ronment in Maryland. In particular, the emissions reductions will help the State manage three important environmental challenges: maintaining PM2.5 concentrations at levels below ambient air quality standards, acidic deposition of sulfur (i.e., acid rain, mercury), and harmful nutrient loading to the Chesapeake Bay. An ozone benefit assessment is currently underway.
OtherAirQualityRegulatoryDriversAffectingPowerPlants
There are several other major air quality regulatory programs that apply to power plants in Maryland, in addition to the federal ozone and NAAQS-based regulations and Maryland’s HAA. These include the Clean Air Interstate Rule (CAIR) and the Clean Air Mercury Rule (CAMR), described in greater detail below, and EPA’s new GHG emissions reporting rule, which is discussed in Chapter 4 (see page 144). Both CAIR and CAMR have been the sub-ject of a considerable amount of litigation as part of the regulatory development process.
CleanAirInterstateRule
The EPA finalized CAIR on March 10, 2005. In its current form, CAIR would affect 28 eastern states and Washington, D.C. and was designed to reduce formation and downwind transport of PM2.5 and ozone by limiting emissions of precursor pollutants SO2 and NOx. Ultimately, CAIR would have reduced SO2 emissions in these states by over 70 percent and NOx emissions by over 60 percent from 2003 levels. However, in July 2008, the U.S. Court of Appeals for the D.C. Circuit issued an opinion vacating and remanding CAIR stating that, “EPA’s approach — region-wide caps with non state-specific quantitative contribution determinations or emissions requirements — is fundamentally flawed” and “The trad-ing program is unlawful because it does not connect states’ emissions reductions to any measure of their own significant contributions.”3
Following several requests for rehearing, the Court issued an order in December 2008 that leaves CAIR in effect while the EPA develops a new clean air program for power plants in accordance with the July 2008 decision. EPA noted that the development and finalization of a replacement rule could take about two years.
CleanAirMercuryRule
CAMR is the first-ever federal action designed to regulate mercury from electric generating units. Finalized by EPA on March 15, 2005, the rule is similar to CAIR in that it would have
3 United States Court of Appeals for the District of Columbia Circuit, dated 11 July 2008.

66
M a r y l a n d C u M u l at i v e e n v i r o n M e n ta l i M pa C t r e p o r t — 1 5 t h e d i t i o n
created a market-based cap-and-trade program to be implemented in two phases. How-ever, on February 8, 2008, the D.C. Circuit removed power plants from the Clean Air Act list of sources of hazardous air pollutants, thus vacating CAMR for power plants. Since then, EPA has asked the Supreme Court to review the D.C. Circuit Court’s vacatur of the rule (February 6, 2009). In the meantime, according to EPA’s website, the EPA has decided to begin developing emission standards for power plants under the CAA, consistent with the Court’s opinion.
3.1.2 ImpactstoWaterResourcesOther than a small segment of western Maryland and small estuarine water bodies of the Atlantic Shore, the bulk of Maryland’s drainage system feeds the Chesapeake Bay. All of Maryland’s primary rivers drain into the Chesapeake Bay: Potomac, Patuxent, Patapsco,
Impacts of NOx and SO2 Control Regulations on Air Emissions in MarylandIn October 1998, EPA promulgated the “Finding of Significant Contribution and Rulemaking for Certain States in the Ozone Transport Assessment Group (OTAG) Region for Purposes of Reducing Regional Transport of Ozone,” which is commonly known as the “NOx SIP Call.” The NOx SIP Call applied to 20 states in the eastern United States and the District of Columbia and required NOx reductions of up to 28 percent from 1996 emissions levels by the year 2007. All power plants in Maryland were subject to the requirements of the NOx SIP Call and most of the power plants installed some type of air pollution control equipment to comply with the rule.
The two figures at top right illustrate the changes in “ozone season” (May through September) NOx emissions from power plants in Maryland and the changes in the number of emissions controls systems installed on these units since passage of the NOx SIP Call.
There were substantial reductions in NOx emissions prior to the NOx SIP Call between 1999 and 2002, as power plants in the Eastern U.S., including Maryland, became subject to another, earlier NOx control program, the Ozone Transport Commission (OTC) rule.
In April 2006, Maryland enacted the HAA, which requires significant reductions in NOx, SO2, and mercury emissions from coal-fired power plants in Maryland. To comply with the HAA and other air regulatory programs, owners of coal-fired power plants in Maryland have installed or are in the process of installing advanced add-on control equipment, including SCR and SNCR to further reduce NOx emissions.
The trends in SO2 emissions for power plants in Maryland between 1999 and 2006 are shown in the lower graph. No significant reductions in SO2 emissions occurred in Maryland between 1999 and 2006. This is because no add-on controls were installed on power plants during this period. However, several coal-fired units in Maryland are installing state-of-the-art SO2 controls in the form of wet FGD scrubbers to comply with the HAA. FGD systems such as these will reduce SO2 emissions substantially (upward of 80 percent in many cases).
�����
�����
�����
�����
�����
�����
����
����
����
����
����
����
����
����
����
���
���
���
���
���� �� �� �� �� � �� �� ��
�����������������������������
�� ����������������������� �������������������������� ������������������������ ��������������
� ������������� �������������� ���������������������������������� �����������������������������
��������������������������������������������
�������
�������
�������
�������
�������
�������
�������
�������
�������
�������
����������� ���� ���� ���� ���� ���� ���� ����
����
��
������
���
���
��������
SO2 Emissions from Coal-fired Power Plants in Maryland
Trends in NOx Emissions and Controls for Power Plants in Maryland
67
C h a p t e r 3 — i M pa C t S o F p o W e r G e n e r at i o n a n d t r a n S M i S S i o n
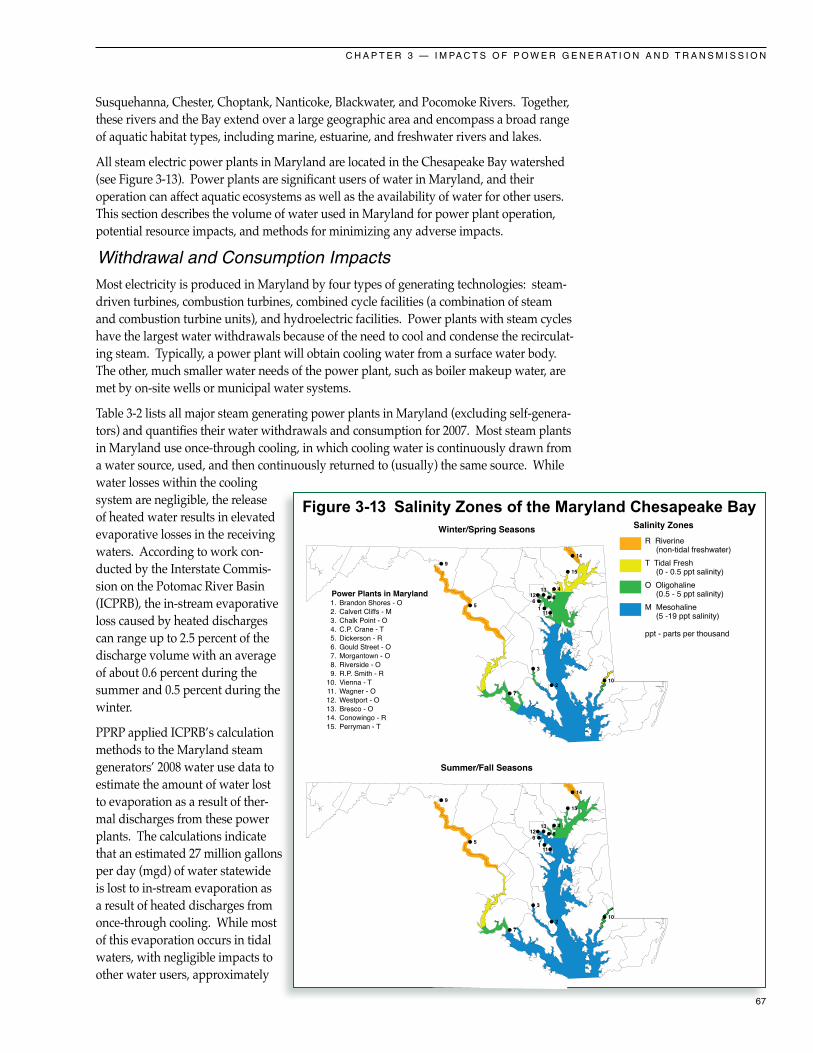
Susquehanna, Chester, Choptank, Nanticoke, Blackwater, and Pocomoke Rivers. Together, these rivers and the Bay extend over a large geographic area and encompass a broad range of aquatic habitat types, including marine, estuarine, and freshwater rivers and lakes.
All steam electric power plants in Maryland are located in the Chesapeake Bay watershed (see Figure 3-13). Power plants are significant users of water in Maryland, and their operation can affect aquatic ecosystems as well as the availability of water for other users. This section describes the volume of water used in Maryland for power plant operation, potential resource impacts, and methods for minimizing any adverse impacts.
WithdrawalandConsumptionImpacts
Most electricity is produced in Maryland by four types of generating technologies: steam-driven turbines, combustion turbines, combined cycle facilities (a combination of steam and combustion turbine units), and hydroelectric facilities. Power plants with steam cycles have the largest water withdrawals because of the need to cool and condense the recirculat-ing steam. Typically, a power plant will obtain cooling water from a surface water body. The other, much smaller water needs of the power plant, such as boiler makeup water, are met by on-site wells or municipal water systems.
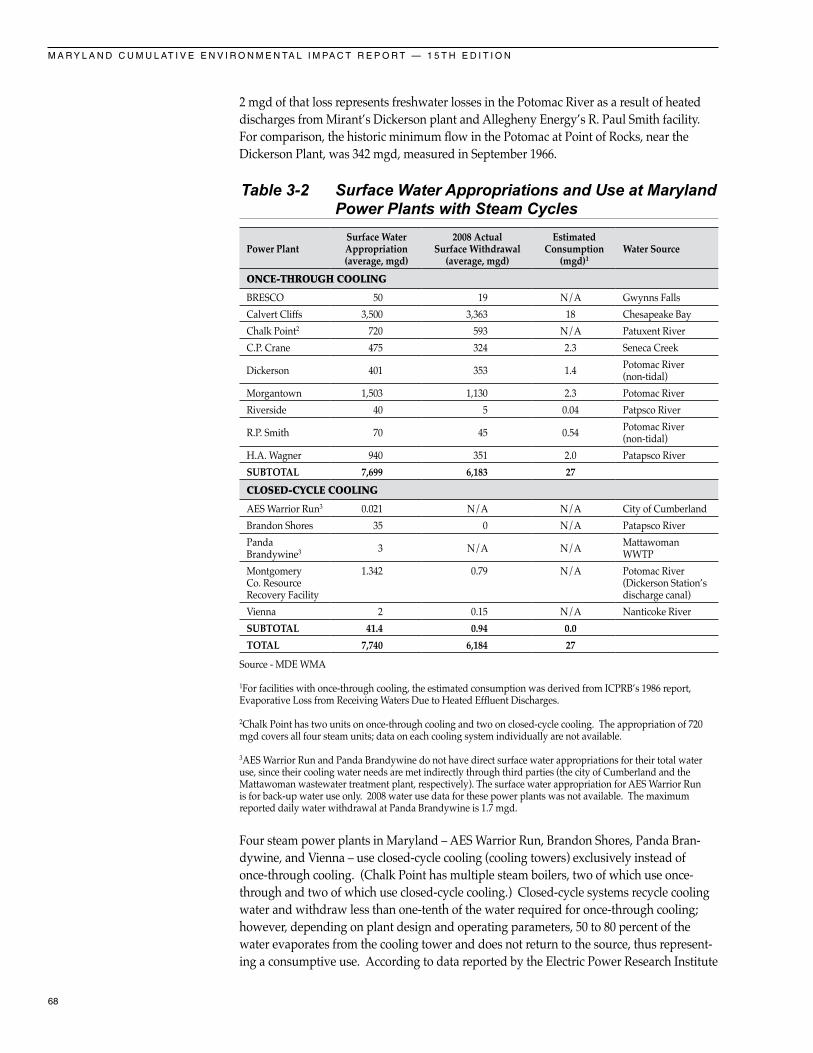
Table 3-2 lists all major steam generating power plants in Maryland (excluding self-genera-tors) and quantifies their water withdrawals and consumption for 2007. Most steam plants in Maryland use once-through cooling, in which cooling water is continuously drawn from a water source, used, and then continuously returned to (usually) the same source. While water losses within the cooling system are negligible, the release of heated water results in elevated evaporative losses in the receiving waters. According to work con-ducted by the Interstate Commis-sion on the Potomac River Basin (ICPRB), the in-stream evaporative loss caused by heated discharges can range up to 2.5 percent of the discharge volume with an average of about 0.6 percent during the summer and 0.5 percent during the winter.
PPRP applied ICPRB’s calculation methods to the Maryland steam generators’ 2008 water use data to estimate the amount of water lost to evaporation as a result of ther-mal discharges from these power plants. The calculations indicate that an estimated 27 million gallons per day (mgd) of water statewide is lost to in-stream evaporation as a result of heated discharges from once-through cooling. While most of this evaporation occurs in tidal waters, with negligible impacts to other water users, approximately
Figure 3-13 Salinity Zones of the Maryland Chesapeake Bay���������������������
�������������������
����������������������������������������������������������������������������������������������������������������������������������������������������������������������������������������������������������������������������������������������������������������������������������������������
������������������
������������������
��������������
��������������������������������������
�����������������������������������������
�����������������������������������������
��������������������������������������
������������������������
● �
● �
● �
● �
● �
��●��●
● ��
● �
� ●
� ●��●
● �
● ��
● ��
● �
● �
● �
● �
��●��●
● �
� ●
� ●��●
● �
● �
● ��
● ��
● ��
68
M a r y l a n d C u M u l at i v e e n v i r o n M e n ta l i M pa C t r e p o r t — 1 5 t h e d i t i o n
2 mgd of that loss represents freshwater losses in the Potomac River as a result of heated discharges from Mirant’s Dickerson plant and Allegheny Energy’s R. Paul Smith facility. For comparison, the historic minimum flow in the Potomac at Point of Rocks, near the Dickerson Plant, was 342 mgd, measured in September 1966.
Table 3-2 Surface Water Appropriations and Use at Maryland Power Plants with Steam Cycles
Power PlantSurface Water Appropriation (average, mgd)
2008 Actual Surface Withdrawal
(average, mgd)
Estimated Consumption
(mgd)1Water Source
ONCE-THROUGH COOLING
BRESCO 50 19 N/A Gwynns FallsCalvert Cliffs 3,500 3,363 18 Chesapeake BayChalk Point2 720 593 N/A Patuxent RiverC.P. Crane 475 324 2.3 Seneca Creek
Dickerson 401 353 1.4 Potomac River (non-tidal)
Morgantown 1,503 1,130 2.3 Potomac RiverRiverside 40 5 0.04 Patpsco River
R.P. Smith 70 45 0.54 Potomac River (non-tidal)
H.A. Wagner 940 351 2.0 Patapsco RiverSUBTOTAL 7,699 6,183 27 CLOSED-CYCLE COOLING
AES Warrior Run3 0.021 N/A N/A City of CumberlandBrandon Shores 35 0 N/A Patapsco RiverPanda Brandywine3 3 N/A N/A Mattawoman
WWTPMontgomery Co. Resource Recovery Facility
1.342 0.79 N/A Potomac River (Dickerson Station’s discharge canal)
Vienna 2 0.15 N/A Nanticoke RiverSUBTOTAL 41.4 0.94 0.0 TOTAL 7,740 6,184 27
Source - MDE WMA
1For facilities with once-through cooling, the estimated consumption was derived from ICPRB’s 1986 report, Evaporative Loss from Receiving Waters Due to Heated Effluent Discharges.
2Chalk Point has two units on once-through cooling and two on closed-cycle cooling. The appropriation of 720 mgd covers all four steam units; data on each cooling system individually are not available.
3AES Warrior Run and Panda Brandywine do not have direct surface water appropriations for their total water use, since their cooling water needs are met indirectly through third parties (the city of Cumberland and the Mattawoman wastewater treatment plant, respectively). The surface water appropriation for AES Warrior Run is for back-up water use only. 2008 water use data for these power plants was not available. The maximum reported daily water withdrawal at Panda Brandywine is 1.7 mgd.
Four steam power plants in Maryland – AES Warrior Run, Brandon Shores, Panda Bran-dywine, and Vienna – use closed-cycle cooling (cooling towers) exclusively instead of once-through cooling. (Chalk Point has multiple steam boilers, two of which use once-through and two of which use closed-cycle cooling.) Closed-cycle systems recycle cooling water and withdraw less than one-tenth of the water required for once-through cooling; however, depending on plant design and operating parameters, 50 to 80 percent of the water evaporates from the cooling tower and does not return to the source, thus represent-ing a consumptive use. According to data reported by the Electric Power Research Institute

69
C h a p t e r 3 — i M pa C t S o F p o W e r G e n e r at i o n a n d t r a n S M i S S i o n
(EPRI), closed-cycle cooling systems consume on average about 1.5 times more water per megawatt-hour than once-through systems.
Cooling water withdrawals at steam electric facilities represent the majority of surface water usage in Maryland. In 2008, combined water withdrawal for all steam generating power plants in Maryland is estimated at 6.2 billion gallons per day (see Table 3-2). All other non-power plant users in the state have a combined appropriation of less than 4 billion gallons per day. By comparison, the Potomac River has an average discharge of roughly 7 billion gallons per day, and the Susquehanna River discharges an average of about 23 billion gallons per day (actual daily flows in both the Susquehanna and the Potomac fluctuate greatly, both seasonally and from year to year).
Nuclear power plants also fall within the steam generating category; however, they use nuclear reactions instead of fossil fuel combustion to create the thermal energy. The exist-ing fleet of operating nuclear facilities generate more waste heat than fossil fuel-fired plants of the same capacity, and according to data from the Nuclear Regulatory Commission (NRC), require 10 to 30 percent more cooling water to produce the same energy. Nuclear stations generally operate at a lower steam temperature and pressure compared to fossil fuel-fired generating plants, which causes a somewhat lower efficiency in the conversion of thermal energy to mechanical and, ultimately electrical energy. Consequently, more thermal energy is rejected to the cooling system, per megawatt-hour generated, than would be in a fossil fuel plant, and more cooling water is needed to absorb that waste heat.
Maryland has one nuclear power plant operating on the western shore of the Chesapeake Bay, Calvert Cliffs, which withdraws an average of 3.3 billion gallons per day from the Bay. This is the largest single appropriation of water in the State of Maryland, 13 times more than the municipal supply for the Baltimore City metropolitan area of 250 million gallons per day. While the majority of this water is returned to the Bay, an estimated 18 mgd of Bay water is lost to evaporation as a result of the heated discharge (see Table 3-2). The proposed Unit 3 at Calvert Cliffs will utilize a cooling tower and thus will not withdraw as much Bay water as Units 1 and 2, although its water consumption due to evaporation will be greater.
In addition to cooling water, certain other processes, such as the operation of wet FGD scrubbers, also require substantial amounts of water. For instance, Mirant plans to install FGD scrubbers at its Morgantown facility and has agreed that the water source for the scrubbers will be the Potomac River (in order to minimize the need for additional ground water withdrawals at the plant). Mirant estimates that the scrubbers will require an additional 3.44 mgd of Potomac River water, more than half of which will be consumed by evaporation. This represents a minor increase over the previous allocation of 1,500 mgd of Potomac River water for cooling at the plant. The water will be pumped from the tidal portion of the Potomac River and will be brackish in nature, requiring purification before it can be used in the FGD system. Mirant has made plans to install a desalination plant at Morgantown to facilitate use of brackish Potomac River water in this application.
Low-FlowIssues
Consumptive users of water in the nontidal portion of the Potomac River must comply with Maryland’s consumptive use regulations for the Potomac River Basin (COMAR 26.17.07). The intent of this regulation is to ensure that during low-flow periods, upstream users allow sufficient water to continue downstream to supply water demands in the Washington, D.C., metropolitan area.
The consumptive use regulations require users consuming more than 1 mgd of water from the Potomac River to maintain low-flow augmentation storage, and release water from this
70
M a r y l a n d C u M u l at i v e e n v i r o n M e n ta l i M pa C t r e p o r t — 1 5 t h e d i t i o n
storage to offset their consumption during low-flow periods. Alternatively, users can comply with the rules by reducing consumptive use to less than 1 mgd during low-flow periods. The consumptive use regulations specify the amount of augmenta-tion storage that must be secured to avoid the potential for curtailment of water withdrawals during low-flow periods.
A power plant developer can build ponds or tanks to store cooling water, which could carry the facility through a short-term drought. However, it is typically not feasible for plant developers to construct on-site storage that could supply enough water to support operations through a prolonged period of withdrawal restrictions. Plants that propose to withdraw cooling water from nontidal waters of the Potomac, therefore, accept the risk that severe drought conditions may require them to curtail their operations. It is recognized that severe drought conditions correlate quite well with condi-tions of heavy electricity consumption, but the goal of providing on-site water storage is to reduce the risk of curtailment, not entirely eliminate it.
As an example, Mirant agreed to incorporate on-site water storage to meet Potomac River low-flow requirements as part of the 2007 licensing case to modify the Dickerson Generating Station for the installation of a wet scrubber. Typically, about 85 percent of the water used in a wet scrubber is consumptively lost through evaporation out of the stack. Mirant projected that operating at peak load for 24 hours could create a consumptive use of water slightly over 1 mgd. In addition, Mirant operates two combustion turbines at Dickerson that consume additional water under certain operating conditions. To comply with the consumptive use regulations, Mirant proposed to limit Potomac River water consumption to 1 mgd for the FGD unit and the two combustion turbines. In addition, Mirant proposed to use an on-site pond with a capacity of 4.5 million gallons to supplement the water supply during periods of low flow to minimize the risk that generation would be curtailed. PPRP and MDE agreed with this approach for complying with the consumptive use requirements, and the Maryland Public Service Commission (PSC) issued a CPCN with conditions reflecting the approach.
CoolingSystemAlternativesandAdvances
With increasing pressures to minimize water withdrawals, power plant developers are finding more efficient means of cooling. Once-through cooling, the original standard for power plants, is not a viable option for new power plants, particularly in light of EPA’s newly promulgated regulations under the Clean Water Act Section 316(b), designed to reduce ecological effects of cooling water withdrawals. Closed-cycle cooling towers have become standard on new steam generating power plants, reducing water withdrawals substantially compared to once-through cooling systems. As noted previously though, their consumptive use is somewhat higher.
The reuse of effluent from wastewater treatment plants (WWTP) is also becoming more acceptable and viable for power plants. The Panda Brandywine combined cycle facility, located in Prince George’s County, currently utilizes about 1.5 mgd of treated effluent
Great Falls Park on the Potomac River

71
C h a p t e r 3 — i M pa C t S o F p o W e r G e n e r at i o n a n d t r a n S M i S S i o n
from the Mattawoman WWTP for its cooling water needs. In 2007, Constellation agreed to use treated effluent from Anne Arundel County’s Cox Creek WWTP to supply the FGD system being installed at the Brandon Shores power plant. In addition, CPV Maryland has proposed a new gas-fired power plant in Charles County that would also use treated effluent as its source of cooling water.
Effluent reuse has been established as an alternative that can be economically attractive and technically viable for sites located near large WWTPs. With respect to environmental impacts, effluent reuse still represents a consumptive loss of freshwater resources, since the treated effluent that is used and evaporated in the cooling towers would otherwise be discharged to surface water. However, aquatic impacts are reduced because effluent reuse does not involve direct withdrawals from a surface water body.
Dry cooling systems are also making significant inroads to the power industry. Once thought infeasible due to their large size, aesthetics, parasitic power use, required land, and capital outlay, dry cooling towers are now being seriously evaluated as potential alternatives to wet cooling systems. Although currently there are no major power plants in Maryland using dry cooling systems, a hybrid dry cooling system has been included in the plans for the proposed Unit 3 development at the Calvert Cliffs power plant. Hybrid dry cooling systems combine both a "wet" portion, like traditional closed-cycle systems, plus an air-cooled "dry" portion. As appropriations for cooling water become more restricted, dry cooling becomes a more attractive option.
GroundWaterWithdrawals
The use of ground water for process cooling is severely restricted in Maryland, but some of Maryland’s power plants are significant users of ground water for other purposes. Ground water is used for boiler feedwater in coal-fired power plants, inlet air cooling, emissions control in gas- and oil-fired combustion turbines, and potable water throughout the power plants. High-volume ground water withdrawals have the potential to lower the water table of an area, thus reducing the amount of water available for other users. Excessive withdrawals from Coastal Plain aquifers can also cause intrusion of salt water into the aquifer. Although large volumes of ground water are available in the Coastal Plain aquifers, withdrawals must be managed over the long-term to ensure adequate ground water supplies are available in the future.
The impact of these withdrawals has been a key issue in southern Maryland, where there is a signifi-cant reliance on ground water for public water supply. Currently five power plants withdraw ground water from southern Maryland coastal plain aquifers for plant operations. These plants are: Constellation’s Calvert Cliffs Nuclear Power Plant, Mirant’s Chalk Point and Morgantown power plants, Southern Maryland Electric Cooperative's (SMECO’s)
Evaluating Drawdown ImpactsLong-term monitoring data show how pumping from a ground water aquifer affects the water level over time. MDE regulations define “available drawdown” in an aquifer as 80 percent of its historic pre-pumping level. The significance of the current drawdown can then be estimated by comparing current drawdown to the total available drawdown (see drawing below for an illustrated example).
������������������������������
��������
�����������������������������
���������������
�����������������������������������������������������
������������������
���������������������������������������������������������������
���������������������������������������������������
���������������������������������������
�������
�������������
���������������������������������
���
���
���
���
���
���
���
���
���
����
����
����
���

72
M a r y l a n d C u M u l at i v e e n v i r o n M e n ta l i M pa C t r e p o r t — 1 5 t h e d i t i o n
combustion turbine facility (located at the Chalk Point plant), and Panda Brandywine’s combined cycle power plant. These five plants withdraw ground water from three aquifers: the Aquia, the Magothy, and the Patapsco. Two additional power plants utilize ground water: Perryman, located in Harford County northeast of Baltimore, and Vienna located in Dorchester County on the Eastern Shore. Figure 3-14 shows the ground water withdrawal rates expressed as daily averages from 1975 to 2008 for each of these power plants. The withdrawal rates and associated appropriations limits are also shown in Figure 3-14. As noted in Table 3-3, power plants typically withdraw ground water at rates well below their appropriation permit limits. The average withdrawal for all seven power plants in 2008 was 1.31 mgd compared to a combined daily appropriations limit of 2.66 mgd. The amount of ground water withdrawn by power plants has fluctuated between about 0.9 and 2.2 mgd over the past 30 years.
Three government agencies – the Maryland Geological Survey, the U.S. Geological Survey, and PPRP – jointly operate a ground water monitoring program to measure the water levels in these aquifers to ensure the long-term availability of ground water. MDE Water Management Administration (WMA), the permitting authority for all ground water appropriations, uses the data from this joint monitoring program to assess the significance of impacts to aquifers when reviewing additional appropriations requests.
Long-term monitoring indicates a steady decline in water levels in the Aquia, Magothy, and Patapsco aquifers. However, these declines are not solely due to withdrawal from power plants, and are considered acceptable by MDE WMA when compared to the amount of water available in the aquifers. The amount of water available is expressed as the aquifer’s “available drawdown,” which is defined in MDE regulations as 80 percent of the distance from the historic pre-pumping water level to the top of the pumped aquifer.
Figure 3-14 Average Daily Groundwater Withdrawal Rates at Maryland Power Plants
�������������������� �������� ������������������������ �������� ���������������������� ��������
������������������ �������� ����������������������� �������� ��������������������� ��������
������������������ �������� ���������������� ��������
����
����
����
����
����
����
����
����
����
����
����
����
����
����
����
����
����
����
����
����
����
����
����
����
����
����
����
����
����
����
����
����
����
����
�
���
���
���
���
���
���
���
���
���
�
����
����
����
����
����
�
����

73
C h a p t e r 3 — i M pa C t S o F p o W e r G e n e r at i o n a n d t r a n S M i S S i o n
Table 3-3 Average Daily Ground Water Withdrawal Rates (in mgd) at Maryland Power Plants
Chalk Point (Magothy Aquifer)
Chalk Point (U. Patapsco
Group Aquifer)
Vienna (Columbia Aquifer)
Panda (L. Patapsco Aquifer)
Morgantown (L. Patapsco
Aquifer)
Calvert Cliffs
(Aquia Aquifer)
SMECO (U. Patapsco Aquifer)
Perryman (Talbot
Aquifer)
Total Average Daily
Withdrawal
Current Appropria-tion Limit
0.66 0.66 0.05 0.064* 0.82 0.45 0.02 0.1 2.66
1975 0.75 0.04 0.8 0.22 1.811976 0.95 0.07 0.8 0.2 2.021977 0.7 0.06 0.8 0.25 1.811978 0.7 0.06 0.7 0.24 1.71979 0.85 0.07 0.8 0.25 1.971980 0.77 0.3 0.04 0.8 0.25 2.161981 0.69 0.37 0.02 0.65 0.27 21982 0.6 0.4 0.02 0.6 0.27 1.891983 0.7 0.43 0.03 0.6 0.25 2.011984 0.62 0.37 0.03 0.7 0.28 21985 0.64 0.26 0.03 0.6 0.27 1.81986 0.5 0.41 0.02 0.62 0.26 1.811987 0.43 0.36 0.03 0.52 0.38 1.721988 0.43 0.37 0.03 0.67 0.25 1.751989 0.55 0.46 0.04 0.73 0.07 1.851990 0.6 0.44 0.02 0.67 0.09 0.01 1.831991 0.44 0.46 0.01 0.57 0.15 0.01 1.641992 0.37 0.41 0.04 0.58 0.15 0.01 1.561993 0.25 0.47 0.03 0.67 0.19 0.01 1.621994 0.41 0.49 0.02 0.64 0.18 0.01 1.751995 0.53 0.41 0.02 0 0.54 0.23 0.02 0.01 1.761996 0.45 0.38 0.02 0.1 0.65 0.29 0 0.001 1.89
1997 0.5 0.41 0.01Not
Available 0.58 0.41 0 0.001 1.91
1998 0.57 0.35 0.02 0.06 0.54 0.37 0.01 0 1.921999 0.53 0.31 0.02 0.05 0.56 0.39 0.01 0 1.872000 0.382 0.322 0.019 0.04 0.606 0.412 0.008 0.005 1.792001 0.427 0.426 0.017 0.051 0.337 0.395 0.007 0.031 1.692002 0.346 0.296 0.02 0.067 0.423 0.392 0.009 0.004 1.562003 0.454 0.222 0.022** 0.486 0.489 0.407 0.009 0.01 2.082004 0.439 0.341 0.008*** 0.076 0.575 0.415 0.11 0.025 1.982005 0.362 0.382 0.013 0.074 0.243 0.34 0.02 0.002 1.442006 0.322 0.249 0.009 0.097 0.251 0.354 0.018 0.002 1.30
2007 0.279 0.061 0.009 0.072 0.136 0.362 0.015 0.002 0.94
2008 0.335 0.042 0.008 0.068 0.476 0.368 0.011 0.001 1.31
Source: U.S. Geological Survey, MDE*Panda was granted a higher appropriation during construction of its pipeline for conveying treated effluent.
** No report was submitted to MDE for the period July-December 2003. The amount shown was estimated using the total volume withdrawn of 4,131,683 gallons reported for the period January-June 2003.
*** No report ws submitted to MDE for the period January-June 2004. The amount shown was estimated using the total volume withdrawn of 1,505,770 gallons reported for the period July through December 2004.

74
M a r y l a n d C u M u l at i v e e n v i r o n M e n ta l i M pa C t r e p o r t — 1 5 t h e d i t i o n
While power plants have contributed to the decline in the water levels in these aquifers, increased withdrawals from municipal well fields in southern Maryland have caused most of the recent declines. Water quantity impacts to each of the three aquifers are summarized below.• Aquia Aquifer at Calvert Cliffs – Water levels in the Aquia Aquifer at Calvert Cliffs have
declined approximately 82 feet over the period 1982 to 2007, with most of the decline occurring since 1990. This acceleration in water level declines is due to the withdrawal from municipal well fields at Lexington Park in St. Mary’s County and Solomons Island in Calvert County. The water levels at Lexington Park and Solomons Island have declined nearly 26 feet since 1997 and approximately 108 feet since 1982. The impacts from the water level declines are considered acceptable given the 315 feet of available drawdown currently estimated in the Aquia Aquifer at Calvert Cliffs based on MDE's available drawdown criteria described above.
• Magothy Aquifer at Chalk Point – MDE WMA has required industrial users of the Magothy Aquifer to use deeper aquifers like the Patapsco to allay concerns over water level declines in the Magothy. As a result, the Chalk Point power plant reduced its ground water withdrawal from the Magothy during the time period 1990 to 2005 by about 44 percent compared to the period before 1980. This reduction has resulted in a commensurate reduction in the rate of water level decline at the facility during this same period. However, water levels continue to decline in the aquifer due to the extensive continued use in Annapolis and Waldorf. The drawdown at Chalk Point between 1975 and 2006 has been approximately 41 feet, and a total of about 84 feet since pumping at Chalk Point began in 1964. Prior to pumping in 1962, the elevation of the poten-tiometric head in the Magothy formation was 28 feet above msl; thus the available drawdown is 80 percent of 600 feet plus 28 feet, approximately equivalent to 500 feet. Consequently, the total drawdown of 84 feet is small compared to the estimated total available drawdown of approxi-mately 500 feet for the Magothy Formation in the vicinity of Chalk Point.
• Upper Patapsco Aquifer at Chalk Point – The water level surface in the Upper Patapsco Aquifer declined up to 22 feet at Chalk Point between 1990 and 2007. Recent measurements indicate that a total drawdown of nearly 64 feet between 1975 and 2006 at Chalk Point. These declines will not impact the approximately 512 feet of available drawdown in the Upper Patapsco Aquifer at Chalk Point.
• Lower Patapsco Aquifer at Morgantown – The water level surface of the Lower Patapsco Aquifer in the vicinity of the Morgantown power plant has declined up to 28 feet between 1990 and 2006. Since 1997, water levels in the vicinity of the Morgantown power plant have remained relatively constant. By the year 2010, Mirant expects water demands at the Morgan-town power plant to increase, due to the installation of FGD scrubbers.
ImpactstoWaterQualityandAquaticBiota
Potential impacts from steam-electric power plants on rivers and estuaries may include a reduction in river flow volumes due to evaporative water loss in the plant’s cooling system, mortality of aquatic organisms as a result of entrainment in the cooling system, impinge-ment of larger organisms on cooling system screens, and elevated temperatures of receiving waters after power plant discharge.
Water usage and the resulting environmental impacts have been monitored by various agencies and organizations. These issues have been a major responsibility of PPRP since it was established in 1972. In systems where multiple sources of potential impacts can affect water quality and aquatic habitats, the combined effects may compound or intensify the effects of the individual sources, and accumulate in downstream areas. Although permit requirements and regulations may not require an assessment of cumulative effects, the health of the contiguous system is determined by the impact of multiple influences. PPRP has conducted aquatic impact assessment studies at all of Maryland’s existing plants and
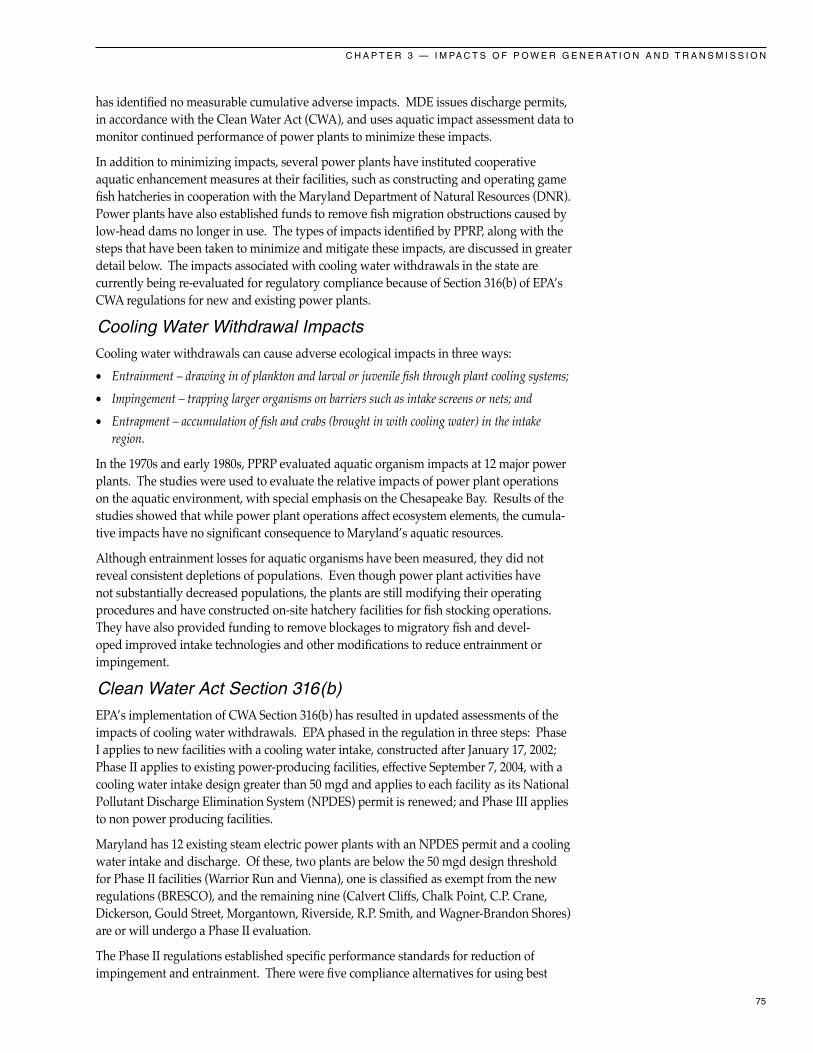
75
C h a p t e r 3 — i M pa C t S o F p o W e r G e n e r at i o n a n d t r a n S M i S S i o n
has identified no measurable cumulative adverse impacts. MDE issues discharge permits, in accordance with the Clean Water Act (CWA), and uses aquatic impact assessment data to monitor continued performance of power plants to minimize these impacts.
In addition to minimizing impacts, several power plants have instituted cooperative aquatic enhancement measures at their facilities, such as constructing and operating game fish hatcheries in cooperation with the Maryland Department of Natural Resources (DNR). Power plants have also established funds to remove fish migration obstructions caused by low-head dams no longer in use. The types of impacts identified by PPRP, along with the steps that have been taken to minimize and mitigate these impacts, are discussed in greater detail below. The impacts associated with cooling water withdrawals in the state are currently being re-evaluated for regulatory compliance because of Section 316(b) of EPA’s CWA regulations for new and existing power plants.
CoolingWaterWithdrawalImpacts
Cooling water withdrawals can cause adverse ecological impacts in three ways:• Entrainment – drawing in of plankton and larval or juvenile fish through plant cooling systems;• Impingement – trapping larger organisms on barriers such as intake screens or nets; and• Entrapment – accumulation of fish and crabs (brought in with cooling water) in the intake
region.
In the 1970s and early 1980s, PPRP evaluated aquatic organism impacts at 12 major power plants. The studies were used to evaluate the relative impacts of power plant operations on the aquatic environment, with special emphasis on the Chesapeake Bay. Results of the studies showed that while power plant operations affect ecosystem elements, the cumula-tive impacts have no significant consequence to Maryland’s aquatic resources.
Although entrainment losses for aquatic organisms have been measured, they did not reveal consistent depletions of populations. Even though power plant activities have not substantially decreased populations, the plants are still modifying their operating procedures and have constructed on-site hatchery facilities for fish stocking operations. They have also provided funding to remove blockages to migratory fish and devel-oped improved intake technologies and other modifications to reduce entrainment or impingement.
CleanWaterActSection316(b)
EPA’s implementation of CWA Section 316(b) has resulted in updated assessments of the impacts of cooling water withdrawals. EPA phased in the regulation in three steps: Phase I applies to new facilities with a cooling water intake, constructed after January 17, 2002; Phase II applies to existing power-producing facilities, effective September 7, 2004, with a cooling water intake design greater than 50 mgd and applies to each facility as its National Pollutant Discharge Elimination System (NPDES) permit is renewed; and Phase III applies to non power producing facilities.
Maryland has 12 existing steam electric power plants with an NPDES permit and a cooling water intake and discharge. Of these, two plants are below the 50 mgd design threshold for Phase II facilities (Warrior Run and Vienna), one is classified as exempt from the new regulations (BRESCO), and the remaining nine (Calvert Cliffs, Chalk Point, C.P. Crane, Dickerson, Gould Street, Morgantown, Riverside, R.P. Smith, and Wagner-Brandon Shores) are or will undergo a Phase II evaluation.
The Phase II regulations established specific performance standards for reduction of impingement and entrainment. There were five compliance alternatives for using best

76
M a r y l a n d C u M u l at i v e e n v i r o n M e n ta l i M pa C t r e p o r t — 1 5 t h e d i t i o n
technology available to minimize adverse environmental impact at facilities. However, as a result of a lawsuit by several environmental groups, states, and industry groups, the U.S. Court of Appeals made a ruling on the Phase II rule, rejecting many of its provisions (Riverkeeper et al. v. USEPA, decided January 25, 2007). A portion of this ruling was appealed to the U.S. Supreme Court with respect to the cost-benefit test. The court ruled in March 2009 that the cost-benefit test is allowed; specifically the court stated: “The EPA permissibly relied on cost-benefit analysis in setting the national performance standards and in providing for cost-benefit variances from those standards as part of the Phase II regulations.” EPA is expected to issue a revised rule for public comment some time in 2010, addressing the other issues required by the Riverkeeper case and the U.S. Supreme Court ruling on cost-benefit testing.
In March 2007, EPA suspended the Phase II 316(b) rule due to the court ruling. Most power plants with once-through cooling water intakes, including those in Maryland, were required to submit a comprehensive study by the January 2008 deadline, to demonstrate how they would meet its requirements. These facilities were already in the process of collecting the necessary information. The suspension means that 316(b) permit conditions will be developed based on best professional judgment. Thus, studies and analyses will proceed that can be used for either best professional judgment or for the EPA rule, if and when it is reinstated. This includes any impingement and entrainment studies already undertaken to update the biological data for each facility, including Calvert Cliffs, Chalk Point, C.P. Crane, Dickerson, Gould Street, Morgantown, Riverside, R.P. Smith, and Wag-ner-Brandon Shores. Analyses of field data (where required) is also expected to proceed to show the impact of current level of impingement and entrainment relative to the calcula-tion baseline and in comparison with historical data. In the past several years, PPRP and MDE have been evaluating these analyses as part of each facility’s NPDES permit renewal process.
CoolingWaterDischargeImpacts
Impacts to aquatic biota from power plant cooling water system discharges include elevated temperatures, discharge of chemicals used for biofouling treatment (e.g., chlorine), discharge of metals eroded from internal plant structures (e.g., copper), and, in the case of Maryland’s only nuclear power plant, discharge of radiological materials. Each of these impacts is discussed below.
ThermalChanges
Biological impacts from heated effluents depend upon the magnitude and duration of the temperature difference between discharge water and river water. Small organisms that pass through a plant’s cooling system experience the greatest temperature stress, both in magnitude and duration. Exposed organisms in the receiving waters are more likely to experience smaller increases in temperature of shorter duration due to dispersion of the thermal plume and mobility of most of the exposed aquatic biota (e.g., fish, blue crabs). PPRP conducted studies to determine the effects of thermal discharges at each existing power plant in the state. Because different aquatic biota occupies different habitat types in Maryland waters, study results are presented here according to the habitats where power plants are located (see Figure 3-13 on page 67). The following pages present a brief sum-mary of the findings in those studies.
Mesohaline Habitat – The largest power plants (in MWs) in the state discharge into meso-haline habitat during all or part of the year. PPRP studied thermal discharges from Chalk Point, Morgantown, Calvert Cliffs, and H.A. Wagner power plants as part of extensive fieldwork in the 1970s and 1980s. Thermal plume dimensions for these power plants varied with season, tidal stage, wind velocity and direction, and plant operating levels.

77
C h a p t e r 3 — i M pa C t S o F p o W e r G e n e r at i o n a n d t r a n S M i S S i o n
The effects of thermal discharges from the power plants located in the mesohaline habitats of the Chesapeake Bay have been localized and are not considered significant. PPRP found no cumulative adverse impacts to the habitats of the Chesapeake Bay ecosystem. How-ever, PPRP will continue to evaluate the habitats if additional power plant discharges are proposed; new technology would then be considered to reduce thermal discharges.
Tidal Fresh and Oligohaline Habitat – Two plants, Vienna and C.P. Crane, discharge into tidal fresh and oligohaline waters. PPRP studies showed that the thermal plume at Vienna was small and its discharge effects were negligible. The thermal plume at C.P. Crane affected about 40 percent of the volume of the receiving water embayment. C.P. Crane effluents also resulted in a slight increase in nearfield salinity due to plant-induced changes in the nearby bay circulation pattern, but these factors did not affect nearfield dissolved oxygen.
Recently, MDE required studies at C.P. Crane to repeat some of the historical fishery sur-veys conducted in the late 1970s, as a condition for NPDES permit renewal. The purpose of the surveys was to demonstrate that the fish populations in the vicinity of the Crane power plant remain unaffected by its thermal discharge. The study showed that differences in the fish community apparent between the 2003-2005 results and the results of the 1979-1980 study reflect long-term changes in the upper Bay fish community and are not suggestive of a plant discharge effect. The results also suggest that there is no consistent effect of the thermal discharge on the fish community composition or distribution.
Findings at the plants in these tidal fresh and oligohaline habitats were consistent with those at facilities in mesohaline areas. Thermal discharge effects were small and localized. PPRP studies found no evidence that fish movements were blocked by thermal plumes in the plants’ receiving waters in these particular habitats.
Nontidal Freshwater Habitat – R.P. Smith and Dickerson are the only once-through cool-ing power plants located in nontidal riverine habitat in Maryland. The thermal impact of their discharges on the Potomac River ecosystem was assessed in a long-term freshwater benthic study conducted by PPRP over an 8-year period in the 1980s. While this long-term study documented that the thermal discharges from these two plants had an adverse impact on benthic communities in the immediate area of the discharges, these effects were localized. The affected percentage of the total river bottom is very small. To assess whether these localized impacts on benthic communities may be affecting fish populations within the river, the discharge permit for the Dickerson facility included a requirement for a multi-year study of growth and condition of several fish species in the vicinity of the plant. Based on data on fish condition collected over a 21-year period near the plant and at reference locations, there was no indication that fish near the plant were affected by the localized discharge effects on benthic communities.
ChemicalDischarges
Concerns regarding the impacts of copper and chlorine discharged from cooling water systems into sensitive waters of the Chesapeake Bay watershed in the late 1970s and early 1980s led to extensive studies by PPRP as well as others.
Copper – In the late 1970s and early 1980s, oysters in the vicinity of the Chalk Point, Calvert Cliffs, and Morgantown power plant discharges were found to be bioaccumulating copper that was present in the effluent discharge. The copper resulted from erosion of the copper condenser tubes within the plants’ cooling systems. While PPRP studies showed that oyster growth and survival were not adversely affected, the elevated levels of copper concentrations in oysters posed a potential risk to the health of individuals who might consume them. Power plants replaced the copper condenser tubes with titanium tubes

78
M a r y l a n d C u M u l at i v e e n v i r o n M e n ta l i M pa C t r e p o r t — 1 5 t h e d i t i o n
where this problem was most significant, primarily in estuarine waters. The titanium tubes eliminated the metals erosion, which also resulted in less maintenance on the condenser tubes. Currently, NPDES permitting for all power plant discharges includes an evaluation of maximum discharge levels for copper (as well as other metals) to protect human health and the environment.
Chlorine – This substance is sometimes used by power plants to control bio-fouling of con-denser tubes in cooling water systems. While it may be an effective means of controlling biological organisms within the cooling system, it can also cause mortality in the aquatic biota of the receiving water body. Presently, the NPDES permits for all power plants in Maryland require that chlorine not be discharged into the state’s waters for more than two hours in any one day from any one unit, and no more than one unit may discharge at any one time. An exception may be granted if a facility demonstrates that more chlorination is needed to control macroinvertebrates. Chlorinated discharge impacts are now considered resolved and no further action is needed.
Wastewater discharged from coal ash ponds, air pollution control equipment, and other equipment at power plants can contaminate drinking water sources, impact fish and other wildlife, and create other detrimental environmental effects. In September 2009, the U.S. EPA announced plans to revise the existing standards for water discharges from coal-fired power plants to reduce pollution and minimize these effects.
Earlier in 2009, EPA completed a multi-year study of power plant wastewater discharges and concluded that current regulations, which were issued in 1982, have not kept pace with changes that have occurred in the electric power industry over the last three decades. Air pollution controls installed to remove pollution from smokestacks have made great strides in cleaning the air people breathe, reducing respiratory and other illnesses. However, some of the equipment used to clean air emissions does so by “scrubbing” the boiler exhaust with water ("wet" FGD systems) and when the water is not properly managed, it sends the pollution to rivers and other waterbodies. Treatment technologies are available to remove these pollutants before they are discharged to waterways, but these systems have been installed at only a fraction of the power plants.
As part of the multi-year study, EPA measured the pollutants present in the wastewater and reviewed treatment technologies, focusing mostly on coal-fired power plants. Many of the toxic pollutants discharged from these power plants come from coal ash ponds and the FGD systems used to scrub SO2 from air emissions. Types of treatment systems for FGD systems include settling ponds, chemical precipitation, biological treatment, constructed wetlands, and zero-liquid discharge. Once the new rule for electric power plants is final-ized, EPA and states would incorporate the new standards into wastewater discharge permits. More information about EPA’s study is provided in a report that was published in October 2009. For more information on wastewater discharges from power plants, please visit: http://www.epa.gov/waterscience/guide/steam/.
ImpactsofHydroelectricFacilities
While only two large-scale hydroelectric projects (with capacities greater than 10 MW) are present in Maryland, seven additional small-scale facilities also generate electricity within the state (see map and table in Chapter 2 on page 25).
Hydroelectric facilities may present special environmental concerns that are not encoun-tered at steam electric power plants. Development and operation of hydroelectric facilities can cause three main types of impacts:
Changes in water quality – Impoundments created for hydroelectric dams significantly alter river flow from free-flowing streams to deep water flow. This alteration causes

79
C h a p t e r 3 — i M pa C t S o F p o W e r G e n e r at i o n a n d t r a n S M i S S i o n
changes in natural water clarity, thermal stratification, and lower dissolved oxygen con-centrations upstream of the dam, which, in turn, may result in low dissolved oxygen levels in the water discharged from the dam. To mitigate these impacts, a procedure known as turbine venting was implemented at Conowingo Dam on the Susquehanna River. This venting allows air to be entrained into the water passing through the turbines and increases the oxygen content of the water. Similarly, an aeration weir was constructed in the Deep Creek Station tailrace to increase oxygen in water from the dam’s discharge.
Changes in water quantity – Operating hydroelectric facilities in a peaking mode (in response to peak electrical demand) produces unnatural, and frequently extreme water level fluctuations in impoundments as well as downstream from the dams. Additional small-scale projects may also divert some flow away from the natural streambed. Fluctua-tions in water level and flow may reduce fish abundance as well as food sources important to fish growth and survival. Several studies, initiated in the early 1990s and completed in 1998 were conducted at Conowingo Dam to determine the minimum flow necessary to protect and enhance aquatic biota as well as whether a continuous flow is needed; these studies are being revisited as a part of the relicensing process (see below).
Direct adverse effects on fish populations – Dams prevent the natural upstream and downstream movement of both resident and migratory fish species. Entrainment of fish attempting to move downstream past the dam may cause mortality due to the turbines. Factors that affect fish mortality include the type of turbine, the proportion of flow diverted through the turbine, and the size of fish. Fish lifts at Conowingo have begun to restore anadromous fish populations upstream of the dam and operational changes have been used to reduce mortality of downstream migrating fish. Studies are continuing at Conowingo to investigate further reductions on migratory fish impacts.
Historically, the Susquehanna River supported large spawning runs of migratory species such as American shad, river herring, and striped bass. The massive anadromous fish migrations extending as far upstream as Cooperstown, New York, were eliminated with the construction of four major hydroelectric facilities on the lower Susquehanna in the early 1900s (Maryland’s Conowingo Dam, and Holtwood, Safe Harbor, and York Haven dams in Pennsylvania).
When the FERC licenses for the four Susquehanna River hydroelectric facilities were being considered for renewal in the early 1970s, a major issue that arose was restoration of migratory fish to the Susquehanna. Participants in the FERC license proceedings included PPRP, on behalf of the State of Maryland; the State of Pennsylvania; the State of New York; the U.S. Fish and Wildlife Service; and several non-governmental organizations (NGOs). The ultimate goal of the resource agencies and NGOs was to restore migratory fish runs throughout the Susquehanna River basin. This goal was pursued through an active restoration program (e.g., trapping and trucking adult fish to areas above the dams, hatchery rearing of larval and juvenile shad for stocking in the river) and the installation of fish passage devices at all four dams.
By the year 2000, restoration programs had been operating for nearly 30 years, and fish passage devices had been installed at all four hydroelectric facilities. For the first time since the dams had been constructed, the entire Susquehanna River had been re-opened to migratory fish. This has created the potential for shad and other species to move as far upstream as New York State, representing renewed access to well over 400 miles of historic habitat.
Growth of the Susquehanna River shad stock in response to the restoration efforts and installation of fish passage devices has been problematic. Growth peaked in 2001, when nearly 200,000 American shad were passed over Conowingo Dam, but has since declined

80
M a r y l a n d C u M u l at i v e e n v i r o n M e n ta l i M pa C t r e p o r t — 1 5 t h e d i t i o n
for reasons that are not clear (see Figure 3-15). On-going monitoring of restoration progress also revealed some issues that need to be addressed. One concern at the present time is the low percentage of shad that are able to move past the Holtwood Dam during high flow years once they have successfully moved past the Conowingo Dam. In 2004, only 3.1 percent of the shad passing over Conowingo Dam succeeded in moving beyond Holtwood Dam. Concerns also exist regarding the percentage of shad that move past York Haven Dam. A more thorough assessment of that issue may not be possible until a higher passage efficiency is achieved at Holtwood Dam. PPRP, working with dam owners and other state and federal agencies, is continuing efforts to enhance upstream migratory fish passage as well as safe downstream passage of juveniles through operational and/or engineering modifica-tions. The FERC licenses for three of the four lower Susquehanna facilities expire at the end of 2014, and agency consultation on relicensing is already underway. Fish pas-sage and flow issues will be further studied and addressed as part of this process.
CurrentHydroelectricLicensingProjects
Conowingo – Exelon Generation Company is licensed by FERC to operate the 549.5-MW Conowingo Hydroelectric Project, located on the Susquehanna River in Harford and
Cecil counties. The current license for Conowingo was issued in August 1980 and expires on September 1, 2014. Exelon intends to submit an application to FERC for continued operation of the project; this application must be submitted by September 2012. PPRP will coordinate all Maryland agency reviews and provide input on the license application, which FERC must consider as part of its review. Some issues that PPRP has recommended for further study during relicensing include upstream and downstream fish passage, flow and water level management, the project’s effect on salinity in the Bay, dissolved oxygen (DO) levels, eel passage, sediment and debris management, and recreation. PPRP’s goal is to determine appropriate study plans in consultation with Exelon and other resource agencies, to evaluate these issues, and ultimately to reach agreement on license conditions prior to Exelon’s submission of a final license application to FERC.
Jennings Randolph – In March 2008, Fairlawn Hydroelectric Company filed a notice of intent to seek a FERC license for the Jennings Randolph Hydroelectric Project. The proposed project would use the existing Jennings Randolph Dam, owned by the U.S. Army Corps of Engineers (COE) and located on the Potomac River in Mineral County, West Virginia, and Garrett County, Maryland. The developer’s plans include a total installed capacity of about 13 MW, and would not involve any change in the volume or timing of
Figure 3-15 Number of American Shad Passed at Conowingo Dam (Susquehanna River), 1985-2009 and at Conowingo East, Holtwood, Safe Harbor, and York Haven Dams, 1997 - 2009
�
������
�������
�������
�������
���� ���� ���� ���� ���� ���� ���� ���� ���� ���� ���� ���� ����
���
����
���
�������������������������������������������
�
������
�������
�������
�������
����
����
����
����
����
����
����
����
����
����
����
����
����
����
����
����
����
����
����
����
����
����
����
����
����
����
���
����
���

81
C h a p t e r 3 — i M pa C t S o F p o W e r G e n e r at i o n a n d t r a n S M i S S i o n
releases compared to currently COE operations. Fairlawn is conducting the necessary studies regarding water quality modeling, fish entrainment, wetlands, and protected spe-cies, to support its license application to FERC, expected in 2011.
3.1.3 TerrestrialImpactsMaryland’s diverse physiography, geology, and climate have produced a variety of eco-regions that have fostered numerous, and sometimes unique, habitats ranging from ocean barrier islands in the east through salt marshes, fields and forests of the coastal plain, into rolling piedmont hills, and on to ancient forested mountains with remnant alpine glades to the west. While human activities (agriculture, urban/suburban development, etc.) have impacted all of these areas to some extent, the majority of the landscape continues to possess a wide variety of habitats that support diverse communities of flora and fauna. Many of these communities help define their regions, and may contain rare, threatened, or endangered species.
The State of Maryland has enacted the following regulations (COMAR 08 and 26) that afford protection to habitats and species in terrestrial and wetland environments: • Waterway Construction;• Water Quality and Water Pollution Control; • Erosion and Sediment Control;
Deep Creek Hydroelectric Station: Balancing Multiple Resource UsesThe 3,900-acre Deep Creek Lake was formed in 1925 by the construction of a rockwall dam across Deep Creek, a tributary of the Youghiogheny River. The Deep Creek Hydroelectric Station (DCHS) includes two turbines with a combined generating capacity of about 20 MW.
Operation of the facility affects recreational users of the lake and the river. The Youghiogheny River is Maryland’s only designated “wild” river. It supports a trout fishery and is one of the most challenging whitewater runs in the country. In 1994, the owner of DCHS agreed to negotiate conditions to be required under a water appropriations permit administered by MDE. Working with PPRP and MDE, conditions were designed to achieve two objectives: 1) to provide a reliable and economical source of electricity; and 2) to enhance Deep Creek Lake’s and the Youghiogheny River’s natural and recreational resources.
Lake Water Levels — Recreational lake users typically want minimal and consistent drawdown of the lake during summer, with a higher than historic level in the autumn to extend the boating season. Historically, the power company lowered the water level in the fall and winter to prevent ice damage to the spillway. To help evaluate possible alternative operating strategies, a computer model of historical lake inflow, storage, and electricity generation was developed. The model was used to create monthly operating rules for the DCHS that balanced electricity generation with the maintenance of desirable lake water levels.
Downstream Fisheries — Naturally high water temperatures in the Youghiogheny River and low dissolved oxygen (DO) levels in the hydroelectric station’s discharge historically limited trout habitat. The discharge from the hydroelectric station tends to be cooler than the river because it draws cooler water from the bottom of the lake. PPRP developed a protocol for station operators that regulates the timing and volume of water discharges during periods of peak temperatures in the Youghiogheny River, such that downstream trout habitat is enhanced. The protocol uses river flow and temperature changes, and available predictions of maximum air temperature and cloud cover for the region. The goal is to maintain the river temperature below 25°C. The plant owner also installed structures to aerate discharge water to alleviate the low DO problem.
Whitewater Recreation — The Youghiogheny River is an exceptional whitewater recreation resource that depends on releases from the DCHS for adequate flow volume in most summer months. Whitewater boaters rely on timed and dependable releases from the hydroelectric facility to plan trips in advance. Operation of the facility is scheduled around providing suitable flow for boating at fixed times on most Fridays, Saturdays, and Mondays during the whitewater recreation season (April 15 through October 15), except when lake levels are too low.
Deep Creek Station’s water appropriations permit was renewed in 2007 for another 12-year period. MDE, with assistance from PPRP, working with affected stakeholder groups, reviewed the permit conditions and made minor adjustments to the permit with the goal of continuing to promote optimal use of Deep Creek Lake and affected downstream natural resources.
82
M a r y l a n d C u M u l at i v e e n v i r o n M e n ta l i M pa C t r e p o r t — 1 5 t h e d i t i o n
• Nontidal Wetlands; • Tidal Wetlands;• Forest Conservation; and• Threatened and Endangered Species.
Construction and operation of power generation and transmission facilities (i.e., power plants; pipelines for water, natural gas, and oil; electric transmission lines; roadways and railways) can have significant effects on terrestrial environments and wetlands. Specifi-cally, these facilities can:• Physically change or eliminate existing habitats; • Disturb or displace wildlife; • Emit particulate matter or gases to the atmosphere that later deposit on the landscape; and • Release toxic material through permits or inadvertent spills.
Construction of a new power generating facility may occur entirely within an existing developed area or it may require the clearing of a significant number of acres of natural habitat. Transmission lines must also be maintained in an open or shrubby condition, contributing to detrimental fragmenting of the forest habitat through which the lines travel. Habitat alterations accompanying both construction and maintenance can permanently impact ecological character and function. Air emissions from power plants can also signifi-cantly impact terrestrial habitats through changes in soil chemistry as a result of acidic and nutrient deposition.
PPRP’s role in the CPCN process is to facilitate compliance with these regulations and natural resource objectives. The Waterways Construction, Water Quality and Water Pollu-tion Control, and Erosion and Sediment Control laws require best management practices (BMPs) to eliminate or minimize disturbance in and discharges to Maryland waters. These BMPs are uniformly included as conditions in a CPCN. A CPCN also includes specific conditions to avoid, minimize, or mitigate adverse impacts to wetlands, forests, and species habitats. Conditions placed on a CPCN that address natural resource impacts may be more stringent than individual statutes.
Wetlands
In the 1780s, Maryland had about 1,650,000 acres of nontidal wetlands (24.4 percent of the surface area); 220 years later, in 2009, Maryland has only about 345,000 acres of nontidal wetlands (4.8 percent of its surface area), a reduction of approximately 80 percent. To address such losses, the State developed regulations under Maryland’s 1991 Nontidal Wet-lands Protection Act, with the goal of no net loss of nontidal wetlands. Similarly, the 1994 Tidal Wetlands Regulations were developed to regulate activities in tidal wetlands. Under Maryland’s nontidal wetlands regulations, permanent impacts to nontidal wetlands must be mitigated at various ratios depending on the type of wetlands affected. For example, a ratio of 3:1 is applied to scrub/shrub and forested Wetlands of Special State Concern; a ratio of 2:1 is applied to other scrub/shrub and forested wetlands, and to herbaceous wetlands of special State concern; and a ratio of 1:1 is applied for emergent wetlands. Mitigation ratio requirements are similar for State tidal wetlands. Temporary impacts and impacts to wetlands buffers do not usually have replacement mitigation requirements but may require compensatory or enhancement measures.
The CPCN process includes assessing potential wetlands impacts and developing appro-priate mitigation equal to or greater than those required by these regulations. While wetlands are present at nearly all Maryland’s power facilities, impacts to these wetlands are rare. Where especially valuable wetlands are present, the CPCN process can identify

83
C h a p t e r 3 — i M pa C t S o F p o W e r G e n e r at i o n a n d t r a n S M i S S i o n
special conditions to ensure their protection. For example, the CPCN to construct the Kelson Ridge generating facility in Charles County included the following conditions to protect the Zekiah Swamp Natural Environmental Area, a Nontidal Wetland of Special State Concern:• Preparation of a protection plan that ensures the wetland recharge rates to Piney Branch Bog
are maintained at or below current conditions through the use of shallow infiltration beds and vegetated terraces; and
• Establishment of a permanent protection buffer with no vegetation clearing, earthworks, or other disturbances allowed within 300 feet of Piney Branch Bog.
Forests
Similar to the wetland concerns, historical losses of Maryland’s forest resources prompted enactment of the 1991 Forest Conservation Act (FCA). With the exception of projects located in heavily forested Allegany and Garrett Counties, all construction developments of greater than 40,000 square feet must comply with the FCA. Under the FCA, existing forest condition and character became an integral part of the development planning process, including power plant and transmission line siting, across the State. The FCA requires the applicant to submit both a Forest Stand Delineation defining the nature and character of the existing forest and a Forest Con-servation Plan for protecting the most ecologically valuable areas of forest. Under the FCA, tree conservation, replanting, and other environmental parameters must be considered before any development disturbs forest resources.
If the applicant demonstrates that clearing of forest will be minimized, an exemption from FCA requirements for rights-of-way and land for construction of electric generating facilities can be granted by the PSC. To date, however, all CPCNs issued since the FCA was enacted have included conditions that ensure applicants comply with the FCA where applicable. The CPCN process also considers the quality of forest resources lost as conditions are developed. For example, the CPCN to construct the Rock Springs generating facility in Cecil County included restoration conditions to compensate for values of mature forest lost and some of the nitrogen deposition caused by the facility’s emissions. Specifically, the applicant was required to plant 50 acres of young trees to replace 20 acres of mature forest. The reforestation was directed to riparian areas to increase the likelihood that deposited nitrogen would be intercepted before reaching Chesapeake Bay tributaries.
ThreatenedandEndangeredSpecies
Regardless of the kind of habitat involved, areas that support State-listed threatened and endangered flora and fauna are protected under the Maryland Threatened and Endangered Species regulations. Table 3-4 lists the number of protected species by taxonomic group that the CPCN process considers when evaluating potential adverse effects and develop-ing protective conditions.
Although few applications for power generating or transmission facili-ties affect threatened and endangered species, individual cases have considered potential impacts to the bald eagle, tiger beetle, Delmarva fox squirrel, carpenter frog, purple pitcher plant, New Jersey rush, and winterberry. Most recently, the proposed expansion of the Calvert Cliffs
Table 3-4 Types of State-Listed Rare, Threatened, and Endangered Species
GroupNumber of listed species
Plants 841
Planarians 5
Mollusks 22
Crustaceans 27
Spiders 3
Insects/Collembola 1
Insects/Coleoptera 23
Insects/Diptera 1
Insects/Ephemeroptera 1
Insects/Homoptera 2
Insects/Lepidoptera-Butterflies 39
Insects/Lepidoptera-Moths 23
Insects/Odonata 109
Insects/Trichoptera 1
Fishes 27
Amphibians 11
Reptiles 15
Birds 78
Mammals 31

84
M a r y l a n d C u M u l at i v e e n v i r o n M e n ta l i M pa C t r e p o r t — 1 5 t h e d i t i o n
Nuclear Power Plant required the removal of a bald eagle’s nest. Although the bald eagle has been delisted by the U.S. Fish and Wildlife Service under the Endangered Species Act, it is still State-listed as threatened in Maryland (the bald eagle continues to receive federal protection under the Bald and Golden Eagle Protection Act and Migratory Bird Treaty Act). Thus, the project developer, UniStar Nuclear, was required to obtain a permit from Mary-land DNR for “take,” or removal, of the nest. Under the terms of the permit, the removal of the tree must occur outside of the nesting season when the nest is inactive. As mitigation developed during the CPCN process, UniStar committed to protecting an area in the vicin-ity of the project where bald eagles have historically nested successfully. The CPCN issued for Calvert Cliffs Unit 3 also requires UniStar to maintain a buffer distance between any land disturbed during construction and the habitat of the federally endangered tiger beetle, which lives in the cliffsides near the Bay shoreline. Two species of tiger beetle present at the Calvert Cliffs site are on both the federal threatened and State endangered lists.
Some projects, however, have the potential to cause significant adverse effects to several threatened or endangered species. For example, the Roth Rock Windpower Project proposed by Synergics for western Maryland’s Backbone Mountain would have adversely affected a number of State threatened or endangered species. The mourning warbler, a state-endangered breeding bird, is known from only a few sites in the state but has been recorded most reliably in the northern portion of the project area. Species that rely on rocky habitats including the State-endangered Allegheny woodrat, southern rock vole, and small-footed bat, would likely have suffered severe impacts from construction in the southern portion of the project area. To avoid impacts to these state-endangered and other species, DNR recommended two exclusion zones within the project area, in which no construction of wind turbines or access roads would occur.
Wildlife
The effects of wind power development on birds and bats have been studied since the late 1980s in the United States and even earlier in Europe. At that time, most of the attention brought upon wind power facilities was due to excessive fatalities to golden eagles and other raptors at the Altamont Pass Wind Farm located in California. Since then, wind power facilities in all parts of the country have been investigated for impacts to birds and bats. Most of these studies focused on direct fatalities to birds and bats that collide with turbines, but some also examined indirect effects of displacement of wildlife from areas that are developed.
Wind power facilities can impact birds and bats through the loss of habitat from the footprint of the constructed facilities. Depending on the number of wind turbines, usually installed in linear arrays, facilities can occupy large areas on the landscape when the tur-bines, service roads, and operations buildings are considered as a whole. A much greater area is often needed during the project construction phase as the large towers and turbine blades require broad lay-down areas during assembly. The loss of habitat can lead to the eradication or displacement of species in these areas.
All of the wind power facilities proposed for construction in Maryland have been in the predominantly forested habitats of Garrett and Allegany counties. The forests of western Maryland are considered to be a southern extension of the northern hardwood forests that extend more broadly to the north, and historically included pure stands of white pine, eastern hemlock, and red spruce. At present, however, logging, coal mining, and home construction have fragmented much of these forests. Where contiguous forest exists, wind power development could increase fragmentation. Fragmentation affects birds and bats as well as other terrestrial species through direct loss of forested habitat, the encroachment of species that can have direct (e.g., brown-headed cowbirds that parasitize songbird nests)
85
C h a p t e r 3 — i M pa C t S o F p o W e r G e n e r at i o n a n d t r a n S M i S S i o n
or indirect (e.g., raccoons that can be disease vectors for rare mammals) detrimental effects, the potential disruption of corridors for daily movement or seasonal migration, and the failure of the resident species to adapt to the wind power facility.
In Maryland, land-based wind power facilities of less than 70 MW of generating capac-ity can apply for exemption with the PSC from having to obtain a CPCN. Although this exempts developers from the coordinated PPRP environmental review, they must still comply with all environmental laws and regulations. To date, two projects have been granted exemptions and a third is under consideration before the PSC. All three of these projects are located on mountain ridges that historically have been densely forested. More recently, greater concern has been given to bats, especially to those in the eastern states, where high levels of fatality have been reported at wind power facilities constructed on forested mountain ridge tops.
Wind turbines can kill birds and bats that collide with them, or as recent research has shown, cause their deaths through barotrauma, that is a fatal hemorrhaging of the lungs of bats from the rapid change in air pressure near the spinning turbine blade. After more than a decade of study at a number of wind power facilities in the U.S. and abroad, there is evidence that the numbers of bird fatalities are small at most locations. Per turbine, two to three birds are killed annually on average. Studies at facilities constructed on eastern Appalachian ridges in West Virginia and Pennsylvania report similar rates of bird fatality. In contrast, the numbers of bats killed at these regional facilities are among the highest ever reported, and annual estimates range into the thousands for each project. It is currently believed that most of the bat fatalities occur during the late summer to fall migration period as bats move to their over-wintering habitat.
The cumulative impact of bird fatalities, at present, is not considered to be severe for any one species, as no single species appears to be disproportionately affected. In addition, operational (e.g., lighting that can attract birds) and design (e.g., guyed structures) circum-stances that can contribute to higher fatalities are better understood and new wind power facilities are constructed with reduced lighting and no guy wires to minimize impacts. Birds considered most at risk are songbirds that migrate nocturnally. High fatality events for these species often coincide with nights that have a low cloud cover resulting in birds flying closer to ground level. Although the Migratory Bird Treaty Act prohibits the “take” of any birds, the U.S. Fish and Wildlife Service, in practice, only requires that good faith efforts be employed to avoid fatalities.
The cumulative impact to bat species is of greater concern. The high level of recorded bat fatalities has been distributed among only a few species, predominantly red and hoary bats. These two species undertake long distance seasonal migrations and typically roost in trees, whereas most other species have shorter seasonal movements to and from caves in which they over-winter. While the specific population characteristics of these species are uncertain, they are relatively long-lived and they produce few offspring annually, both characteristics that make them less able to sustain a high level of fatalities. Recent PPRP-funded studies of bat activity in western Maryland have recorded high numbers of these two species during spring monitoring.
Wind turbines have killed several other species of bats, but so far none have been identified as a threatened or endangered species. Western Maryland provides year-round habitat to the federally endangered Indiana bat, and the State-listed as In Need of Conservation small-footed bat. Most records of these two species come from winter cave surveys when the bats are hibernating. Much less is known of their habits during the flying season as they disperse throughout the landscape; however, a recent radio-tracking study followed a single female Indiana bat from a Pennsylvania cave to Carroll County, Maryland. The sea-

86
M a r y l a n d C u M u l at i v e e n v i r o n M e n ta l i M pa C t r e p o r t — 1 5 t h e d i t i o n
sonal and daily activity patterns of these rare species must be investigated further before concerns about the risks posed by proposed wind turbines can be adequately addressed and mitigation activities defined.
Due to the urgency of the need to address the issue of wind power impacts to birds and bats, the Maryland General Assembly required that the PSC establish a technical advisory group (TAG) to develop siting guidelines that would seek to minimize the risk to birds and bats. The TAG produced Siting Guidelines to Mitigate Avian and Bat Risks from Wind Power Projects, which addressed five aspects related to wind power development:1. Standards that will avoid or minimize impacts on birds and bats from the construction and
operation of wind-energy generating facilities. 2. A tiered system of standards that vary with the size of the wind-energy generating facility and
the associated generating capacity. 3. Assessments of avian and bat populations before issuance of a CPCN. 4. Additional monitoring studies of avian and bat populations and behavior during and after
construction of a wind project. 5. Mitigation appropriate to address any impact on avian and bat populations above a threshold
level.
In support of the siting guidelines, PPRP has developed monitoring protocols for birds and bats during pre- and post-construction phases. Pre-construction monitoring protocols for birds include a breeding bird survey and Phase 1 Avian Risk Assessment. Monitoring protocols for bats include using ultrasonic acoustic detector to measure bat activity and some field captures using mist-netting to establish the presence/absence of endangered or threatened species (i.e., Indiana bat, small-footed bat). Additionally for bats, the project site should be evaluated for habitat suitability. Post-construction monitoring protocols include a study of bird and bat fatalities over a period of three years.
3.1.4 SocioeconomicsandLandUseIssuesCulturalandArcheologicalResources
Maryland has an extensive archeological and historical record as a result of over 12,000 years of human habitation. In recognition of this, programmatic protections have been established at the state, regional and local levels to both support and enhance federal protection and preservation initiatives that have been guided since 1966 by the National Historic Preservation Act.
The Maryland Historical Trust (MHT) is the primary State unit for identifying, studying, evaluating, preserving, protecting, and interpreting the state’s significant prehistoric and historic districts, sites, structures, cultural landscapes, heritage areas, cultural objects, and artifacts, as well as less tangible human and community traditions. Formed in 1961, MHT operates within the Division of Historical and Cultural Programs, which is an agency of the Maryland Department of Planning. Maryland’s State Historic Preservation Officer, appointed by the Governor pursuant to the National Historic Preservation Act of 1966, is a member of MHT’s staff. Also within the Division of Historical and Cultural Programs is the Maryland Heritage Areas Authority, which oversees the State’s Heritage Preservation and Tourism Areas legislation. The Heritage Area Authority is designed to promote historic preservation and areas of natural beauty in order to stimulate economic development through tourism.
Regional and local historic preservation organizations exist throughout Maryland, with activities ranging from the administration of Certified Heritage Areas (CHAs) to the restoration and preservation of historic properties.

87
C h a p t e r 3 — i M pa C t S o F p o W e r G e n e r at i o n a n d t r a n S M i S S i o n
State assessment of the effects of power plant construction and operation on cultural resources is codified under Maryland State law (Article 83B, 5-617 & 5-618 of the Anno-tated Code of Maryland). The Code requires state agencies to consider the effects of their undertakings on properties included in or eligible for inclusion in the National Register of Historic Places and the Maryland Register of Historic Properties, and to consult with MHT prior to final action by the agency on a request for a permit, license, or financial assistance. Furthermore, CHAs are programmatically supported by State agencies. Specifically, when carrying out activities in a CHA, a State agency must:• Consult, cooperate, and, to the maximum extent feasible, coordinate their activities with the
entity responsible for the management of each CHA;• Ensure that the activities are consistent with the CHA’s management plan; and • Ensure that activities will not have an adverse effect on the resources of the heritage area unless
there is no prudent and feasible alternative.
Energy facilities can have an adverse effect upon a cultural resource through physical disturbance or by altering its setting or association. In general, if a resource is determined to be culturally significant, the most desirable treatment from a project’s adverse effects is to avoid the resource, or to otherwise minimize and mitigate the adverse effect. However, more innovative treatments are needed when adverse effects include the destruction of significant archeological or historical properties.
Such is the case in PPRP’s environmental review of UniStar’s proposed Calvert Cliffs Unit 3. Phase II fieldwork on identified archeological sites within the project boundary determine one site to be eligible for listing on the National Register of Historic Places (NRHP) – a domestic African-American habitation site dating to the 19th century. PPRP recommended that UniStar avoid the site or, if avoidance is not feasible, mitigate adverse effects through Phase III data recovery excavations. As for historic resources, UniStar's impact assessment found that three of the four on-site resources that were recommended as NRHP-eligible would be adversely affected by project construction. The State agencies recommended in the CPCN licensing conditions innovative treatments that will comprise much of the mitigation of adverse effects. This was accomplished through a negotiated Memorandum of Agreement (MOA) between the NRC, MHT, UniStar and other interested parties.
Adverse effects from construction and operation of Calvert Cliffs Unit 3 upon historical and archaeological resources would be confined largely within the project boundaries and buffered by a heavily forested perimeter. As a result, the State concluded that the project would not significantly affect other existing or emerging state- or locally-designated cultural components in the lower Patuxent peninsula, including the Southern Maryland Heritage Area, since the cultural landscape would be fundamentally unchanged.
VisualImpacts
Construction of energy generation facilities invariably changes the character and quality of a landscape. In Maryland, because landscapes are important components of its Heritage Area, Greenprint, Rural Legacy and other public and private land conservation programs, the overall impact of energy facility on visual amenity is of concern during the State's environmental reviews.
Visual impacts comprise the changes in available views of the landscape and the effect of those changes on people. Visual impact is dependent on a number of factors, including the visual scale and scope of a landscape alteration, the elements and patterns that combine to form the character and distinctiveness of a landscape, and the availability of views of a

88
M a r y l a n d C u M u l at i v e e n v i r o n M e n ta l i M pa C t r e p o r t — 1 5 t h e d i t i o n
particular landscape. While visual scale and scope of a landscape alteration and availability of views of a landscape are tangible concepts, defining a landscape in terms of its character and distinctiveness is more subjective. Basic design elements of form, line, color, and texture are often used to describe and evaluate landscapes. The Bureau of Land Manage-ment’s (BLM) Visual Resource Management (VRM) system (http://www.blm.gov/nstc/VRM/index.html) uses these elements to construct a visual resource contrast rating for determining whether the potential visual impacts from proposed developments will meet the management objectives established for the area, or whether mitigation will be required. VRM was designed to ensure that the scenic values of public lands and outstanding scenic landscapes are considered before uses are permitted that may have negative visual impacts. Similarly, PPRP’s visual assessment goal is to ensure that available views of the landscape around energy projects are considered, and mitigation is prescribed, if adverse visual impacts are predicted. Recent environmental reviews illustrate this approach.
In Charles County, CPV Maryland proposed to construct a nominally rated 640 MW generating facility in the Piney Ridge Business Park. The facility would have a relatively low profile, with prominent structures comprising the heat recovery steam generators and air-cooled condensers, which could be as high as 112 feet, and exhaust stacks, which would be 150 feet tall. An auxiliary boiler stack would be 125 feet tall. Located within an industri-al park, the existing landscape was characterized by surrounding industrial facilities and a Pepco transmission line adjacent to the western boundary of the site. Views toward the site from nearby residential and recreation areas would be screened by vegetation and partially obstructed by the Pepco transmission line. Views of the power plant would be prominent only from passing vehicles due to the proximity of the facility to Billingsley Road. The State agencies concluded that given the relatively low profile of the facility, a weak contrast the facility would add to other elements of the landscape within the industrial park, and limited or obstructed views toward the power plant, mitigation should be limited to compliance with setbacks and buffer requirements annotated in the Charles County Zoning Ordinance to conceal the facility from traffic on Billingsley Road.
Visual impact assessment for Calvert Cliffs Unit 3 and SMECO’s proposed Holland Cliff to Hewitt Road transmission line considered both the existing landscapes of Calvert County and several county, State and federal programmatic elements that identify landscape as an integral component.
Calvert County has acted to preserve its heritage through its comprehensive planning process and in its participation with regional, State, and federal programs. The Compre-hensive Plan identifies open spaces and greenways, primarily along the county’s shoreline on the Patuxent River and Chesapeake Bay. Eco-tourism and resource-based recreation have become the basis for its tourism program. The Southern Maryland Heritage Area Tourism Management Plan is a major blueprint for highlighting the region’s cultural heritage, with all or parts of four heritage clusters in Calvert County. Southern Maryland Heritage Driving Tours and Southern Maryland Bicycle Routes are thematic tours of interpretive sites, museums, and festivals. Among State programs, Maryland’s Greenways and Water Trails Program identifies eight greenways in Calvert County. At the federal level, Congress established the Captain John Smith Chesapeake National Historic Trail, the first water trail in the United States. The trail encompasses the routes of John Smith’s two voyages around the Chesapeake Bay in 1608, and includes gateways and public access sites in Calvert County. The Star-Spangled Banner National Historic Trail commemorates the Chesapeake Campaign of the War of 1812 and includes several interpretive sites in Calvert County. Calvert County is also a stop on the National Underground Railroad Network to Freedom and is on the Maryland Women’s Heritage Trail.

89
C h a p t e r 3 — i M pa C t S o F p o W e r G e n e r at i o n a n d t r a n S M i S S i o n
Due to its location within the heavily wooded parcel, relatively low profile and plume abated cooling tower, the State agencies concluded that Calvert Cliffs Unit 3 would not be visible from land, even when there is loss of foliage during winter. As a result, the views of the landscape in the context of most heritage, recreation and other programmatic elements in Calvert County would be unchanged. Looking landward from the Chesapeake Bay, the new intake and discharge structures and tops of the containment building and cool-ing tower would be visible, although view change would be marginal. Nevertheless, the State agencies concluded that the project could have an adverse effect upon the Captain John Smith Chesapeake National Historic Trail by creating additional visual elements that contrast with the trail’s potential for public recreational use and historical interpretation and, as a result, recommended additional consultations with the National Park Service (NPS) are necessary during the federal licensing process to ensure that the project’s effects on the trail are understood and mitigated to the extent possible.
TransportationElectricity generation and transmission differentially impact Maryland’s transportation infrastructure. Construction of generation facilities can congest local roads with construc-tion worker traffic and trucks hauling materials to the project site. Depending on the generation technology, these impacts can be significant and persistent. Transmission line construction, on the other hand, is less labor intensive and requires fewer materials inputs. As a result, transportation issues associated with transmission line construction are usually limited to oversize/overweight load considerations and temporary road closures during the stringing of overhead conductors or trenching for underground cable installation.
To illustrate, construction traffic was a major concern in the State’s environmental review of Calvert Cliffs Unit 3. Calvert County would see an increase in traffic on major roads lead-ing to the construction site, particularly during the peak construction period when nearly 4,000 construction workers are on-site. Local traffic congestion was predicted during shift changes at intersections near Calvert Cliffs, which would cause periodic delays. Because of this, the Maryland State Highway Administration (SHA) requested a detailed Transporta-tion Management Plan from the project developer.
Mitigation was required because projected morning peak turning movements from construction worker traffic would interfere with through traffic at the entrance to the con-struction site, causing delays and compromising traffic safety. Even so, mitigation initially proposed by the project developer was determined to be unacceptable due to engineering and safety considerations. With an expedited construction schedule and several issues still unresolved, the State agencies conditioned its recommendations on the execution of a Memorandum of Agreement between UniStar Nuclear and SHA for the planning, engi-neering and construction of roadway improvements for the mitigation of traffic impacts, with all improvements to be substantially in place and completed before one thousand construction workers are on-site.
Other transportation modes that are integral to many of Maryland’s generation facilities are rail and barge. Rail has traditionally been a primary carrier of coal to baseload facili-ties in the State. More recently, several energy producers have been granted licenses to construct or expand barge unloading facilities, both to import coal and limestone and to export synthetic gypsum. The latter a consequence of pollution control technology to satisfy the requirements of Maryland’s HAA. Where barge facilities have been proposed, rail is usually a backup.
The State's socioeconomic reviews of proposed barge unloading facilities have generally considered the impacts of increased barge traffic on existing commercial and recreational marine traffic, including potential effects on commercial fisheries. For Mirant’s proposed

90
M a r y l a n d C u M u l at i v e e n v i r o n M e n ta l i M pa C t r e p o r t — 1 5 t h e d i t i o n
barge facility at Morgantown, impacts to U.S. Navy operations within the Potomac River Test Range were also considered. Another transportation-related concern associated with the Morgantown barge unloader was traffic between Morgantown and the Chalk Point generating station. Morgantown would be the primary source of coal and limestone for Chalk Point, and the destination for gypsum by-product from Chalk Point, thus increasing rail traffic between the two facilities. Trucks were proposed as alternate transport in the event of a disruption in rail service. PPRP’s concerns about the impacts of truck traffic on roads between Morgantown and Chalk Point resulted in a number of licensing conditions that restricted the use of trucks to emergency situations for only a limited period of time, and only after consultation with State and local authorities. Consultation would also include designation of a truck route between the two facilities.
LandUse
Land use and land value issues continue to be a major focus of the State's environmental reviews. Maryland’s energy infrastructure overlays economic and programmatic land uses, where compatibility is often of issue. Most new generation facilities in Maryland have avoided land pre-emption – the taking of land from another use – by locating themselves within existing sites dedicated to power generation or within industrial parks or districts. Indeed, several of the State’s environmental reviews over the past two years have assessed the impacts of major modifications to existing facilities, which have no pre-emptive effect upon land use. This does not imply that indirect land use impacts are necessarily negligible. Construction, expansion or modification of generation facilities can affect the setting or association of nearby land uses that may be manifested in changes to their resource or economic value. As a result, the State’s assessments of land use impacts from the construction and operation of generation facilities are broadly based, encompass-ing cultural, aesthetic, resource and economic values of the land.
This requires a complete inventory of land use designations in the area of potential effect, from formal zoning to the many State, local and federal programs that place various protections and restrictions on land use. Protected lands can include agricultural or environmental easements, public lands or even cultural designations that have a distinct locational component. An example of the latter is the Maryland Heritage Areas program that overlays a thematic element upon distinct geographic areas.
The adverse effect of power plants on residential property values is an issue that has been increasingly raised in permitting cases in Maryland. Although a considerable amount of research has been done to examine hazardous facilities, very little has been done in associ-ating conventional generating facilities, high voltage transmission lines, and new technolo-gies, such as wind farms, to property values. As a result, residential property value impact estimates have lacked the credibility needed to influence public policy decisions related to the siting of energy facilities.
Residential property value is dependent on many factors including the size and amenities of the property itself, improvements made to the property, and the perceived value of the surrounding neighborhood. Previous research has suggested that distance to “environ-mental disamenities” is a contributing factor in adversely affecting property value. Prop-erty value declines have been more consistently observed in residential properties that are near higher-risk disamenities (e.g. hazardous waste facilities) or facilities that lack adequate land or vegetation buffers. Because risk is not strongly associated with most types of power plants, their influence on residential property values has been largely ignored.
Although heightened risk is generally associated with nuclear power plants, PPRP found little evidence that Calvert Cliffs Unit 3 would significantly affect property values in

91
C h a p t e r 3 — i M pa C t S o F p o W e r G e n e r at i o n a n d t r a n S M i S S i o n
Calvert County. As part of a general investigation of property value impacts due to power plants and industrial facilities in Maryland that PPRP conducted, several hedonic models were run using data from the MD Property View 2003 edition. The analysis took into account structural and environmental attributes of owner-occupied residential properties. Using multiple regression, the models took the distance from each property to the reactor building at Calvert Cliffs, and estimated to what extent that distance affected the assessed value of that property.
The general conclusion was that values of properties near Calvert Cliffs are influenced by factors aside from their distance to the power plant. In other words, the data failed to reveal a correlation between distance to the reactor building and residential property values. This may be partly attributable to the influence of waterfront amenities on property values, but may also be associated with the extent to which the nuclear plant at Calvert Cliffs is buffered from residential land uses.
As a consideration in its environmental reviews, PPRP is continuing its focus on property value effects from electric transmission and transmission facilities through both ongoing reviews of published literature and sponsored research. Improved statistical methods and continued data mining of MD Property View data is expected to yield additional insight into land value impacts from electric generation and transmission facilities.
Noise
Noise consists of vibrations in the air that gradually decrease, or attenuate, the farther they travel. For people who live or work near a power plant, the noise impacts, along with visual and traffic impacts can be the most significant type of effect caused by the facility.
Noise, measured in decibels (dB), is made up of many components of different frequency (pitch) and loudness. Three decibels is approximately the smallest change in sound inten-sity that can be detected by the human ear. An additional 10 units on the decibel scale is perceived subjectively as a doubling of the loudness. Ranges of typical A-weighted sound levels for various common sounds are shown in Figure 3-16.
The sensitivity of the human ear varies according to the frequency of sound; consequently, a weighted noise scale is used when discussing noise impacts. This A-weighted decibel (dBA) scale weights the various components of noise based on the response of the human ear. For example, the ear perceives middle frequencies better than low or high frequencies; therefore, noise composed predominantly of the middle frequencies is assigned a higher loudness value on the dBA scale.
The State of Maryland has adopted noise pollution standards, found in COMAR 26.02.03, which are adopted from the draft federal standards on noise. The State regulations provide certain exemptions for specified noise sources and noise generating activities. For example,
Figure 3-16 Ranges of Typical Sound Levels for Common Sounds
���� �� �� �� �� �� ��� ��� ���
����������������������������������
������������������
�������������������������������
�����������������������������
�����������������������������������������������
����������������������������������������������
����������������������������������������������������������������������
���������������������������������������
�����������������������������������
�������������������������
�����������������������������������������������������������

92
M a r y l a n d C u M u l at i v e e n v i r o n M e n ta l i M pa C t r e p o r t — 1 5 t h e d i t i o n
the regulations allow for construction activity to generate noise levels up to 90 dBA during daytime hours, but the nighttime standard may not be exceeded during construction. Table 3-5 lists the maximum allowable noise levels specified in the State regulations, by zoning designation and time of day. Some counties and municipalities in Maryland have their own noise limits, including Montgomery County, Charles County, and Baltimore City.
As sound waves radiate outward from a noise source, they lose intensity; thus, the sound decreases with distance. Ensuring adequate buffer distances is an effective method of controlling noise impacts. Structures such as berms and walls may also be constructed to provide noise control, and have been used in transportation applications for many years. Vegetative buffers may be used in conjunction with such structures for additional noise abatement.
In cases where developers propose new generating units on small sites — where the nearest residents may be less than a half-mile away — noise impacts to surrounding communi-ties can be a serious concern. Modeling noise sources and nearest receptors is part of the review of impacts that both the applicant and PPRP conduct in order to assess the noise impacts of proposed facilities. When calculations suggest that the applicable noise limits are likely to be exceeded, measures to meet the allowable levels are recommended and incorporated into the CPCN. If the noise analysis conducted during the licensing review is based on a number of assumptions, and there is uncertainty surrounding the potential for noise-related concerns, PPRP typically recommends that the applicant submit
an updated analysis after the specific equipment to be installed has been selected. Further-more, post-construction monitoring can be performed to verify the noise estimates, once a facility begins operation.
With the increasing interest in renewable energy sources, new generating technology is being developed for which there may be little quantitative information available regarding noise characteristics. Landfill gas and wind power projects are just two examples that have different noise characteristics than conventional power plants.
In September 2007, PPRP conducted monitoring to obtain more specific information about the noise characteristics of landfill gas generators. These measurements helped PPRP evaluate its current method for predicting noise impacts from proposed generating units. Day and night noise levels were recorded at two landfill gas generators in Maryland and compared to the predictions made during the licensing evaluating of those units. The noise measurements revealed that the predictive techniques used by PPRP are very conservative.
Trucks, backup alarms, and traffic noise were audible at residential receptors near the East-ern Landfill in Baltimore County, although these noise sources are not associated with the operation of the landfill gas generator. Even with the presence of other onsite operations and road traffic, the measured noise levels were well below the State’s nighttime noise limit of 55 dBA. The same circumstances held true at the Brown Station Road landfill in Prince George’s County. During the day the primary audible noise source was road traffic travel-ing on Brown Station Road. Noise from the landfill gas generator was not audible over the traffic noise on Brown Station Road, and was just barely audible above the background during infrequent lulls in the traffic. The noise levels at the residential receptors during the evening hours were dominated by cricket/insect noise.
Table 3-5 Maximum Allowable Noise Levels (dBA) for Receiving Land Use Categories
Zoning Designation
Industrial Commercial Residential
Day 75 67 65
Night 75 62 55
Source: COMAR 26.02.03 Note: Day refers to the hours between 7 AM and 10 PM; night refers to the hours between 10 PM and 7 AM.

93
C h a p t e r 3 — i M pa C t S o F p o W e r G e n e r at i o n a n d t r a n S M i S S i o n
There are presently no operational wind turbines in the state where we could make direct noise measurements. Those wind power sites that have been approved have sufficient buffer distances from residences that noise is not expected to be an issue. However, noise concerns have been an issue at other communities outside Maryland that are in close prox-imity to operating wind turbines. After the first large-scale wind project is brought on line, PPRP expects to do additional monitoring to gather confirmatory data on the magnitude and characteristics of wind turbine noise.
3.1.5 RadiologicalIssuesProduction of nuclear power in the United States is licensed, monitored, and regulated by the NRC. Provisions in the operating licenses of each plant allow utilities to discharge very low levels of radioactive material to the environment. The kind and quantity of releases are strictly regulated and must fall within limits defined in federal law as protective of human health and the environment. The NRC regulates releases from power plants according to the principle that the exposure of the environment and humans to radiation be kept “as low as reasonably achievable.”
Pathways of exposure to radioactive material in the environment are similar to those for other pollutants. An aqueous (water) pathway dose can be received internally or externally by ingesting contaminated water and seafood, or by exposure to contaminated sediments and water. An atmospheric pathway dose can result from exposure to or inhalation of radioactive gas or airborne particles, or ingestion of radionuclides deposited on or assimi-lated by terrestrial vegetation and animals.
Nuclear power plants are minor contributors to radiation exposure in the United States. As Figure 3-17 illustrates, natural radiation sources account for nearly 50 percent of the average radiation dose to human beings. Of the remain-ing approximately 50 percent of the radiation dose to human beings arising from man-made sources, less than 0.05 percent is attributed to commercial nuclear power production.
Figure 3-18 shows the locations of nuclear power plants in and near Maryland. Calvert Cliffs Nuclear Power Plant, in Calvert County, is the only nuclear power station in the state. The next closest plant, Peach Bottom Atomic Power Station, is on the Susquehanna River just north of the Pennsylvania/Maryland border. Both these facilities release very low levels of radionuclides into Maryland’s environment. Because of the potential, direct impact of releases from these two plants on Maryland’s natural resources, PPRP conducts monitoring in the vicinity of Calvert Cliffs and Peach Bottom (Table 3-6). Constella-tion and Exelon also conduct environmental monitoring programs near Calvert Cliffs and Peach Bottom, respec-tively. These monitoring programs are used to assess the radiological effects on the environment attributable to each of the power plants. PPRP publishes its environmen-tal assessments biennially.2
2 Environmental Radionuclide Concentrations in the Vicinity of the Calvert Cliffs Nuclear Power Plant and the Peach Bottom Atomic Power Station: 2004-2005. PPRP-R-30
Figure 3-17 Estimated Effective Radiation Dose from Natural and Man-Made Sources
Note: Other background includes cosmic radiation, terrestrial radiation, and naturally occurring radionuclides deposited in the body through ingestion of food, water, and milk and by inhalation.
��������������������������������������������������������
��������������������
���������������
�������
����������
�����
����� �����������������

94
M a r y l a n d C u M u l at i v e e n v i r o n M e n ta l i M pa C t r e p o r t — 1 5 t h e d i t i o n
Figure 3-18 Nuclear Power Plants In and Around Maryland
Hope CreekSalem
Three Mile Island
PeachBottom
Limerick
North Anna
Calvert Cliffs
Susquehanna
V I R G I N I A
P E N N S Y LVA N I A
N E W
J E R S E Y
DE
LA
WA
RE
M A R Y L A N D
Table 3-6 Nuclear Power Plant Environmental Monitoring Elements
Matrix No. Stations Locations Analytes Collection Frequency1. Air Filter 8 Calvert Co., Baltimore, Cecil Co., Harford Co.,
Eastern Shorea, b, 7Be, 137Cs continuous (exchanged weekly)
2. Charcoal Filter 8 Calvert Co., Baltimore, Cecil Co., Harford Co., Eastern Shore
131I continuous (exchanged weekly)
3. Potable Water 7
1
1
1
Calvert Co.
Baltimore City
Patuxent River
Potomac River
a, b, 3H quarterly
monthly
quarterly
quarterly4. Raw Water 1
1
Patuxent River
Potomac River
a, b, 3H monthly
monthly5. Precipitation 1 Baltimore City a, b, 3H, 7Be weekly6. Raw Milk 1
1
St. Mary's Co.
Cecil Co.
89Sr, 90Sr, 131I, 140Ba, 137Cs, 40K
quarterly (beginning in 2009)
7. Sediment 28 Chesapeake Bay (near CCNPP) g quarterly8. Tray Oysters 2 Chesapeake Bay g quarterly9. Sediment 19 Chesapeake Bay & Susquehanna River (near
PBAPS)g semi-annually
10. Finfish 1 Susquehanna River g semi-annually11. Submerged Aquatic Vegetation (SAV)
3 Chesapeake Bay & Susquehanna River g semi-annually

95
C h a p t e r 3 — i M pa C t S o F p o W e r G e n e r at i o n a n d t r a n S M i S S i o n
CalvertCliffsNuclearPowerPlant
Constellation Generation Group owns and operates the Calvert Cliffs facility, on the western shoreline of the Chesapeake Bay. Each of the two units are pressurized water reactors with a total generating capacity of approximately 830 MW. The units began service in May 1975 and April 1977.
As noted above, Calvert Cliffs routinely releases small levels of gas-eous, particulate, and liquid radioactive material into the atmosphere and the Chesapeake Bay. The level of radioactivity of these materials at any given time depends on many factors, including plant operating conditions and conditions of the nuclear fuel. Releases of radioactiv-ity to the environment from Calvert Cliffs have been well within the regulatory limits since the beginning of its operation. PPRP has monitored radionuclide levels in the Chesapeake Bay and environ-ment surrounding Calvert Cliffs since 1975.
Radioactive noble gases, primarily isotopes of xenon and krypton, constitute most of the radioactive material released to the atmosphere from Calvert Cliffs. Noble gases are chemically inert, are not readily incorporated into biological tissues, and are not bioconcentrated. They are readily dispersed in the atmosphere, and most have short half-lives, thus, decaying rapidly to stable forms. For these reasons, the noble gases do not represent a threat to human or ecological health. The most recently compiled results (for the years 2006 and 2007) from weekly air and annual vegetation monitoring conducted by Constel-lation Generation Group and independently by PPRP indicate that releases of radioactivity to the atmosphere by the Calvert Cliffs plant were not detectable in air, precipitation, or vegetation.
Although atmospheric releases consist mainly of radioactive noble gases, which have little environmental significance, aqueous dis-charges contain radionuclides that can be accumulated by biota or become trapped in sediments at the bottom of the Bay. Over time, these radionuclides may potentially contribute to a radiation dose to humans by being transported through the food chain. For the Calvert Cliffs plant, the principal environmentally active radionuclides in 2006 and 2007 were primarily forms of radioactive iron, cobalt, iodine, and tellurium. Historically, the quantities of principal environmentally active radionuclides released from Calvert Cliffs and subsequently detected in Bay sediments have been quite small (approximately one percent, or less, of all radioactivity detected in sediments, which includes historic nuclear weapons testing fallout and naturally occurring radionuclides). Total principal environ-mentally active radionuclide releases have declined over the past two decades due to improvements in coolant water filtration technology. The monitoring program will con-tinue throughout the licensed operating lifetime of Units 1 and 2 as well as the proposed Calvert Cliffs Unit 3, should that additional reactor be constructed. Monitoring by PPRP is conducted to satisfy NRC requirements to verify that any releases from normal plant operations result in potential doses to humans below regulatory limits. The monitoring also meets State of Maryland requirements to research the environmental effects of electric power generation, maintain State of Maryland oversight of environmental monitoring, and to quantify the environmental impact, if any, of the new reactor at Calvert Cliffs.
Calvert Cliffs Unit 3
UniStar Nuclear has submitted an application to the NRC for constructing Unit 3, a new 1,600 MW nuclear reactor unit on the same power plant site, just south of the two existing units. The reactor would be one of the largest single unit reactors in the world, and its addition to the existing site would nearly double the site generating capacity. Unit 3 would use a cooling tower (pictured at the top of the artist's rendering above), reducing water withdrawal impacts to the Bay. The proposal of a new nuclear facility in Maryland brings with it siting, environmental, health, and community issues that are being addressed as part of the licensing processes overseen both at the federal level by the NRC and at the State level by the Maryland PSC. Federal licensing will include technology selection, safety, and waste disposal. The State has an opportunity to comment on the federal licensing process as a participant in the case. The PSC review is separate from NRC licensing and serves an important role in addressing issues specific to Maryland. As with any proposed power plant, PPRP conducted an envi-ronmental review of the non-nuclear issues and provided a consolidated set of recommendations to protect the interests of the State. PPRP will also be the lead state agency for NRC review of Calvert Cliffs Unit 3. Calvert Cliffs Unit 3 received its CPCN on May 29, 2009. The NRC is expected to issue a draft Environmental Impact Statement in Spring 2010. If granted approval, UniStar intends to begin construction in 2010, with an on-line date sometime in 2016.

96
M a r y l a n d C u M u l at i v e e n v i r o n M e n ta l i M pa C t r e p o r t — 1 5 t h e d i t i o n
Bay oysters are ideal indicators of environmental radionuclide concentrations because they do not move and readily ingest and concentrate metals. Oysters have been historically commercially harvested near Calvert Cliffs, and have the greatest potential for contributing to a human radiation dose through seafood consumption. PPRP has monitored the uptake of radionuclides in test oysters placed seasonally on platforms on the Bay floor in the vicinity of the Calvert Cliffs discharge since 1996. The oysters are collected at scheduled time intervals and analyzed for radionuclide content in their tissues. Radiosilver (110mAg) has historically been the principal plant-related radionuclide accumulated by test oysters and oysters on natural beds. Since the fourth quarter of 2001, concentrations of 110mAg in oysters have fallen below analytical detection limits. The lack of 110mAg detection reflects a recent downward trend in 110mAg releases, as well as other principal environmentally active radionuclide releases, from Calvert Cliffs.
As part of its assessment program, PPRP estimates doses of radiation to individuals consuming seafood. The doses are calculated based on maximum or worst-case estimates of the amount of plant-related radioactive material potentially available in the seafood. Results indicate that radiation doses attributable to operations at Calvert Cliffs are well below feder-ally mandated limits (see Table 3-7).
Chesapeake Bay sediments are also useful indicators of environmental radionuclide concentrations because they serve as natural sinks for both stable and radioactive metals. PPRP collects sediment samples seasonally from eight transects extending bayward north and south of the Calvert Cliffs plant. There were no plant-related radionuclides detected in Bay sediments during the 2006-2007 reporting period (see Figure 3-19).
Results of analyses of environmental samples collected in the vicinity of Calvert Cliffs can be found in the periodic environmental reports described above. A comparison of radio-
Table 3-7 Estimated Maximum Radiation Dose (mrem) Attributable to Calvert Cliffs and Peach Bottom
Exposure Route Maximum Dose Estimate (2006)Maximum Dose Estimate (2007)
EPA Regulatory Limit (40CFR190 Subpart B)
NRC Regulatory Limit (10CFR50 Appendix I)
Ingestion (mrem)
Oyster ingestion, whole body dose (from CCNPP) < 0.011 (child)b 25 3
Oyster ingestion, other organ dose (from CCNPP) < 0.057 (adult gastro-intestinal tract)b 25 10
Finfish ingestion, whole body dose (from PBAPS) 0.006 maximum (adult)b 25 3
Finfish ingestion, other organ dose (from PBAPS) 0.010 maximum (teen liver)b 25 10
Inhalation (mrem)
Whole body dose (gaseous, from CCNPP) 0.0022 (child)a 0.0013 (child)a 25 3
Other organ dose (gaseous, from CCNPP) 0.01 ( child skin)a 0.0046 (adult skin)a 25 10
Whole body dose (gaseous, from PBAPS) 1.05 (adult)c 0.206 (infant)c 25 3
Other organ dose (gaseous, from PBAPS) 3.12 (infant thyroid)c 5.48 (infant thyroid)c 25 10
Notes:a Source: Annual Radiological Environmental Operating Reports for 2006 and 2007, Constellation Generation Groupb Source: PPRP biennial reportsc Source: Annual Radiation Dose Assessment Reports for 2006 and 2007, Exelon Nuclear

97
C h a p t e r 3 — i M pa C t S o F p o W e r G e n e r at i o n a n d t r a n S M i S S i o n
nuclide concentrations in environmental samples collected in 2006 and 2007 with levels de tected since 1978 shows the following: • Plant-related radionuclides were not detected in sediments or shellfish during 2006 and 2007;• Although radionuclide concentrations fluctuate seasonally and annually, no long-term accumu-
lation of plant-related radioactivity in Bay aquatic life and sediments is evident;• The radioactivity introduced into the environment by Calvert Cliffs, when detected, is very small
compared with background radioactivity from natural sources and weapons test fallout; and • Radiation doses to humans due to atmospheric and aqueous releases are well within regulatory
limits (see Table 3-7).
In summary, environmental, biological, and human health effects of releases of radioactiv-ity from Calvert Cliffs are insignificant.
PeachBottomAtomicPowerStation
Exelon Generation Company, a subsidiary of Exelon Corporation, operates Peach Bottom Atomic Power Station (PBAPS). Peach Bottom began operations in 1974 and is located on Conowingo Reservoir, 2.7 miles north of the Pennsylvania-Maryland border. The plant’s two operating units are boiling water reactors, each with a generating capacity of approxi-mately 1,100 MW. PPRP has monitored radionuclide levels from the plant since 1979.
Like Calvert Cliffs, Peach Bottom routinely releases very low levels of gaseous, particulate, and liquid radioactive material into the atmosphere and the Susquehanna River. Estimated doses to humans, based on liquid and atmospheric releases of radioactivity from the plant, have been well within regulatory limits since the beginning of its operation (Table 3-7).
Information from Exelon’s monitoring programs shows that in recent years, noble gases accounted for most of the identifiable radioactivity released to the atmosphere by the plant. The most recently compiled results from weekly air and annual vegetation monitoring conducted by Exelon Nuclear and independently by PPRP (for the years 2006 and 2007) indicate that releases of radioactivity to the atmosphere by the Peach Bottom plant were not detectable in air, precipitation, or vegetation.
Of the radionuclides released by Peach Bottom to the Susquehanna River in 2006 and 2007, 89 percent was tritium, which is not bioaccumulated and therefore not principal environmentally active. Very small quantities of radioactive cobalt, zinc, iron, chromium, and manganese accounted for most of the remaining liquid radioactive material released.
Figure 3-19 Proportion of Natural vs. Man-Made Radionuclides in Sediment Samples near CCNPP and PBAPS
Calvert Cliffs Nuclear Power Plant (CCNPP)
Peach Bottom Atomic Power Station (PBAPS)
Man-made sources���������������
����������
Co-600.24%Mn-54
0.03%
Cs-1370.18% ������������
������
�����������������
����������������
���������
Man-made sources���������������
Cs-1370.5% ������������
�����
����������������
���������

98
M a r y l a n d C u M u l at i v e e n v i r o n M e n ta l i M pa C t r e p o r t — 1 5 t h e d i t i o n
These particular radionuclides are principal environmentally active (see Figure 3-20) because they can, if released in sufficient quantities, be readily accumulated by aquatic life such as mussels and finfish.
Finfish collected semi-annually by PPRP from the Conowingo Reservoir area contained small concen-trations of historical, fallout-related radionuclides and Peach Bottom-related radionuclides. Radioac-tivity related to Peach Bottom plant was detected in sediments collected semi-annually down-river of the plant (see Figure 3-19). It is estimated that historically, less than 20 percent of the radioactivity released in Peach Bottom water discharge is found in sediments of the Conowingo Reservoir. The remaining radioactivity is transported downstream bound to sediment and, deposited in the lower Susquehanna River and upper Chesapeake Bay. In recent years, however, radioactivity releases associ-
ated with Peach Bottom have been mostly non-detectible in sediments below Conowingo Reservoir and upper Chesapeake Bay.
Similar to the studies at Calvert Cliffs, PPRP has estimated radiation doses to individuals consuming finfish using the maximum plant-related radionuclide concentrations found in the finfish. However, because the Susquehanna River is a source of drinking water, its ingestion, in addition to fish consumption, may potentially contribute to a human radiation dose. As shown in Table 3-7, the annual total body doses associated with the consumption of finfish and drinking water are well below federal limits. As shown in Figure 3-17, the annual total body dose resulting from consumption of fish and drinking water, relative to other modes of dose accumulation, is small.
Results of analyses of environmental samples collected in the vicinity of Peach Bottom can be found in the periodic environmental reports described above. Comparing PPRP’s radiological monitoring of Peach Bottom-related radioactivity of aquatic life and sediments collected from 2006 and 2007 with monitoring results since 1979 shows the following: • The levels of plant-related radioactive material detected in aquatic life and sediments represent
a small portion of the radioactive material in the Susquehanna River-Chesapeake Bay system compared with that from natural sources and weapons test fallout;
• No long-term accumulation of plant-related radioactive material in river biota is evident;• Long-term operation of Peach Bottom Atomic Power Station has not caused significant accumu-
lation of radioactive material within the Conowingo Reservoir; and• Radiation doses to humans due to atmospheric and aqueous releases are well within regulatory
limits (see Table 3-7).
In summary, environmental, biological, and human health effects of releases of radioactiv-ity from Peach Bottom are insignificant.
RadioactiveWaste
In addition to the production of atmospheric and liquid effluent releases as a by-product of normal power generation operations, both Calvert Cliffs and Peach Bottom generate radioactive waste products which require disposal.
Figure 3-20 Principal Environmentally Active Annual Aqueous Releases, 1987-2007
����
���
����
����
����
����
����
����
����
����
����
����
����
����
����
����
����
����
����
����
����
����
����
����
�
�
�
�
�
�
�
��������������������������������������������������������������������
����������

99
C h a p t e r 3 — i M pa C t S o F p o W e r G e n e r at i o n a n d t r a n S M i S S i o n
Low-LevelRadioactiveWaste(LLRW)
This type of waste consists of materials such as contaminated gowns, toweling, glassware, resin, equipment, and reactor control rods that are used in the normal daily operation and maintenance of the power plant. Much of the waste is safety and testing equipment that have become contaminated through normal use. Resin is used to remove radioactivity from wastewater through an ion-exchange process. Depending on the waste type and radio-activity level, waste is dried, compressed, and sealed into high-integrity containers, metal boxes, or 55-gallon drums. These containers may, in turn, be sealed into shipping casks. Low-level radioactive waste from Calvert Cliffs, similar to LLRW from other industries, is transported by truck to licensed radioactive waste processing firms located in Utah, South Carolina, Texas, and Tennessee, depending on the type of waste. Other LLRW from Calvert Cliffs may be incinerated, supercompacted, or chemically reduced, depending on the waste processing vendor and type of waste.
High-LevelRadioactiveWaste(IrradiatedFuel)
Spent nuclear fuel from both Calvert Cliffs and Peach Bottom are presently stored at each site within spent fuel pools for the recently discharged fuel or, in the case of older fuel generated in earlier years of plant operation, at dry storage independent facilities located within the protected plant area. These Independent Spent Fuel Stor-age Installations (ISFSIs) are licensed by the NRC for 20 years. ISFSI design and construction must conform to strict NRC specifications (10CFR72) that protect against unauthorized entry, earthquakes, and other natural phenomena such as floods and hurricanes. The Yucca Mountain, Nevada repository is currently under consideration as a central long-term storage facility for irradiated fuel. If the Yucca Mountain reposi-tory should not be available at the end of an ISFSI’s 20-year license, nuclear power plant operators will be required to apply for a new license and modify their ISFSIs.
Exelon’s dry cask storage facility at Peach Bottom currently has 41 casks loaded with 68 fuel assemblies each, for a total of 2,788 assemblies. Three more casks were scheduled for loading in spring 2009. As of April 2009, Peach Bottom had utilized 64 percent of its available storage.
Calvert Cliffs recently announced plans to seek a license renewal from the NRC for its existing ISFSI and to request a license modification to accommodate a newer stor-age cask design. The facility’s current license, which expires in November 2012, allows for a maximum of 120 horizontal storage modules, although only 72 have been constructed to date and only 63 have been loaded. Each module can accommodate 48 spent fuel assemblies as currently designed. Calvert Cliffs has filled 53 percent of its currently licensed storage capacity. The application for a modified ISFSI permit, which is expected to be submitted in the spring of 2010, would seek to give the facility greater flexibility in the future to adapt and improve its management of spent fuel.
3.1.6 PowerPlantCombustionBy-productsCoal, like many fuels, produces gaseous and solid “by-products” during combustion. The solid by-products result from components of coal not consumed during combustion. This section of the report focuses on the solid coal combustion by-products (CCBs) produced by coal-fired power plants in Maryland. The discussion focuses on beneficial reuse of CCBs and on-going research efforts to identify additional uses for CCBs. The ultimate goal is that all CCBs produced in Maryland, including those currently stockpiled, will be reused in environmentally beneficial and/or environmentally benign ways.

100
M a r y l a n d C u M u l at i v e e n v i r o n M e n ta l i M pa C t r e p o r t — 1 5 t h e d i t i o n
Due to a lack of federal regulation, Maryland enacted state regulations for disposal of CCBs, effective December 1, 2008. Companies producing CCBs are required to file CCB Annual Generator Tonnage Reports detailing the amount of CCBs generated, how they were disposed of or reused, and chemical analysis of the CCBs.
When properly engineered and correctly applied, CCBs can be utilized in civil engineering, mine restoration, and agricultural applications (Table 3-8). The beneficial use of CCBs as raw materials in applications that are environmentally sound, technically safe, and com-mercially competitive will lead to a reduction in the disposal of these raw materials and may contribute to reduced GHG emissions. The most direct contribution to reducing GHG emissions occurs when fly ash is used as a supplementary material in concrete and concrete products. By substituting fly ash in place of cement, the carbon emissions associated with cement production are reduced. For each ton of fly ash utilized, a reduction of approxi-mately one ton of CO2 can be achieved. A continued increase in the beneficial utilization of Maryland CCBs will likely lead to:• Decreased need for landfill space;• Conservation of the natural resources of the state;• Reduction in the cost of producing electricity;• Lower electricity cost for consumers; and• Substantial savings for end-users of CCBs.
CCBGeneration
CCBs are produced during the combustion process incident to the production of electric-ity at coal-burning power plants. According to DOE, in 2008, coal-fired power plants in Maryland generated an estimated 2 million tons of CCBs. These CCBs are the non-com-bustible mineral matter present in coal and any unburned carbon remaining as a result of incomplete combustion.
The two primary types of CCBs produced by Maryland’s coal-burning power stations, fly ash and bottom ash, are differentiated by their physical characteristics. Fly ash is the finely divided residue or ash that is transported from the furnace along with emission gases. It is captured in electrostatic precipitators or baghouses and has reliable pozzuolanic proper-ties. Fly ash is composed of very fine, and generally spherical, glassy particles. Conversely, bottom ash is collected from the bottom of the furnace and is composed of coarser, angular, porous, or glassy particles. There is little difference in the chemical makeup of fly ash and bottom ash. The principal difference is that the particles of bottom ash are much larger than particles of fly ash. During coal combustion, if temperatures are sufficiently high, a portion of the resulting ash will become molten and convert to slag.
The exact chemical nature of CCBs depends upon the nature of the coal burned and the combustion process used. For the most part, power plants in Maryland burn bituminous coal from the eastern United States, which produces predominantly ASTM Class F fly ash. Class F fly ash is distinguished from Class C fly ash by having less than 10 percent calcium (expressed as CaO) by weight. The ash is typically composed of more than 85 percent silicon, aluminum, and iron oxides, much of which is present in glassy aluminosilcates.
Class F fly ash may also contain trace metals such as titanium, nickel, manganese, cobalt, arsenic, and mercury. Electric utilities are required to include all applicable constituents of their CCBs when reporting chemical releases through EPA’s TRI program. Established in 1986, the TRI is a database maintained by the U.S. EPA listing the quantities of toxic chemicals released to the environment annually by facilities in certain industries. Electric utilities became subject to TRI reporting requirements in 1997.

101
C h a p t e r 3 — i M pa C t S o F p o W e r G e n e r at i o n a n d t r a n S M i S S i o n
Table 3-8 CCB Beneficial Use Options
TYPE OF COAL COMBUSTION PRODUCT
Potential Use
FBC Pulverized Coal FGD
Fly ash Bed ash Fly ash Bottom ash Boiler slag SludgeROADWAYS Cement/concrete/grout X X X X Embankment/structural fill X X X X Flowable fill X X X Road base/subbase X X X X Snow and ice control X X Synthetic aggregate X X Wetland liner X RECLAMATION USEAbandoned surface mine reclamation X X X X Reclamation of existing surface mined lands X X X X Subsidence remediation and control X X X X X Underground placement to mitigate AMD X X X X Wetland and pond liner X X X Treatment of coal refuse X X X AGRICULTURE Agricultural liming substitute X X X Soil amendment X X X X X Pond & animal manure holding facility liner X X X Livestock feedlot and hay storage pad X X X X New soil blends X X X X Commercial fertilizer X X X Treatment of bio-solids X X X X X MANUFACTURINGPaint X Wallboard X Roofing granules X X Cement industry X X Steel industry X X Fillers (plastics, alloys and composites) X Mineral wool insulation X Ceramic products X Recovery of metals X X OTHER ENGINEERING USESBrick X Concrete block X X X Landfill liner, daily cover, cap X X X X Blasting grit X X Pipe bedding X X Water filtration X Drainage media X X Waste stabilization/solidification X X X X X Treatment of sewage sludge X X X Pond liner X X Dredged material stabilization X X X X
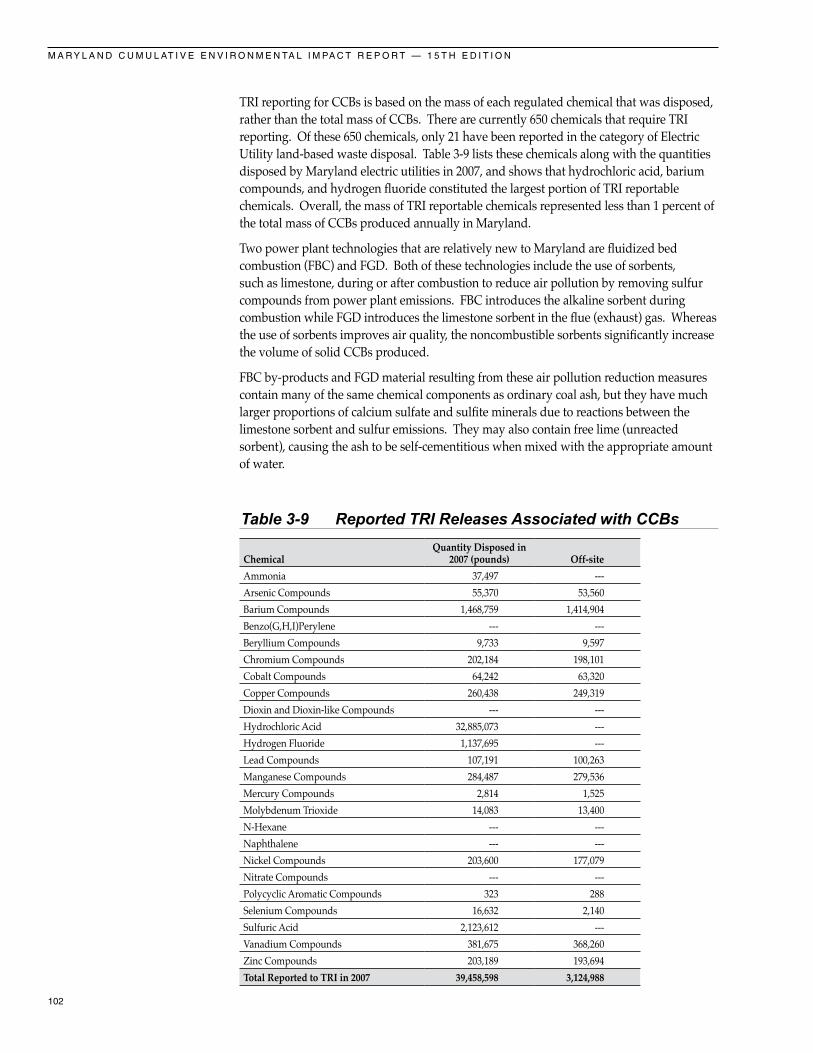
102
M a r y l a n d C u M u l at i v e e n v i r o n M e n ta l i M pa C t r e p o r t — 1 5 t h e d i t i o n
TRI reporting for CCBs is based on the mass of each regulated chemical that was disposed, rather than the total mass of CCBs. There are currently 650 chemicals that require TRI reporting. Of these 650 chemicals, only 21 have been reported in the category of Electric Utility land-based waste disposal. Table 3-9 lists these chemicals along with the quantities disposed by Maryland electric utilities in 2007, and shows that hydrochloric acid, barium compounds, and hydrogen fluoride constituted the largest portion of TRI reportable chemicals. Overall, the mass of TRI reportable chemicals represented less than 1 percent of the total mass of CCBs produced annually in Maryland.
Two power plant technologies that are relatively new to Maryland are fluidized bed combustion (FBC) and FGD. Both of these technologies include the use of sorbents, such as limestone, during or after combustion to reduce air pollution by removing sulfur compounds from power plant emissions. FBC introduces the alkaline sorbent during combustion while FGD introduces the limestone sorbent in the flue (exhaust) gas. Whereas the use of sorbents improves air quality, the noncombustible sorbents significantly increase the volume of solid CCBs produced.
FBC by-products and FGD material resulting from these air pollution reduction measures contain many of the same chemical components as ordinary coal ash, but they have much larger proportions of calcium sulfate and sulfite minerals due to reactions between the limestone sorbent and sulfur emissions. They may also contain free lime (unreacted sorbent), causing the ash to be self-cementitious when mixed with the appropriate amount of water.
Table 3-9 Reported TRI Releases Associated with CCBs
Chemical
Quantity Disposed in 2007 (pounds)
Off-site
Ammonia 37,497 ---Arsenic Compounds 55,370 53,560Barium Compounds 1,468,759 1,414,904Benzo(G,H,I)Perylene --- ---Beryllium Compounds 9,733 9,597Chromium Compounds 202,184 198,101Cobalt Compounds 64,242 63,320Copper Compounds 260,438 249,319Dioxin and Dioxin-like Compounds --- ---Hydrochloric Acid 32,885,073 ---Hydrogen Fluoride 1,137,695 ---Lead Compounds 107,191 100,263Manganese Compounds 284,487 279,536Mercury Compounds 2,814 1,525Molybdenum Trioxide 14,083 13,400N-Hexane --- ---Naphthalene --- ---Nickel Compounds 203,600 177,079Nitrate Compounds --- ---Polycyclic Aromatic Compounds 323 288Selenium Compounds 16,632 2,140Sulfuric Acid 2,123,612 ---Vanadium Compounds 381,675 368,260Zinc Compounds 203,189 193,694Total Reported to TRI in 2007 39,458,598 3,124,988

103
C h a p t e r 3 — i M pa C t S o F p o W e r G e n e r at i o n a n d t r a n S M i S S i o n
The AES Warrior Run power plant in Cumberland is currently the only Maryland power plant that uses FBC. In FBC technology, coal and finely ground limestone are fed into the combustion chamber and mixed together by forcing air into the chamber. The heat in the combustion chamber causes the limestone to decompose to an oxide that captures SO2. FBC units can remove more than 95 percent of the sulfur produced from burning coal. The resulting combined ash is self-cementing: a silica, alumina, and calcium-based material which, when mixed at a ratio of 65 percent solids to 35 percent water, will set up and harden to a cement or concrete-like material with excellent structural and engineering properties.
FGD material is produced when the flue gas enters a spray tower or absorber and is mixed with a sorbent slurry of water and finely ground limestone or lime. The calcium reacts with the SO2 to form calcium sulfite or calcium sulfate, which are segregated by dewatering and settling. FGD scrubbers are scheduled to come online at the Brandon Shores, Dicker-son, Chalk Point, and Morgantown power stations in 2010. Starting in 2010, FGD scrubbers will begin to introduce about one million tons per year of FGD material into the CCB waste stream. However, oxidized calcium sulfite or calcium sulfate (synthetic gypsum) is suitable for use as a natural gypsum substitute.
In the absence of being placed in accordance with sound engineering principles, landfilled CCBs have the potential to adversely impact Maryland’s terrestrial and aquatic resources. The importance of sound engineering placement of CCBs was highlighted at the B.B.S.S. Mine Reclamation Site. Between 1995 and 2007, Constellation Energy Group (formerly Baltimore Gas & Electric) provided Reliable Contracting Co., Inc. with approximately 200,000 to 400,000 tons per year of CCBs, primarily unstabilized Class F fly ash, to reclaim a former sand and gravel mine in Anne Arundel County owned by B.B.S.S., Inc. The site relies on a natural soil cover and its underlying geology to minimize the potential for leachate to impact the regional ground water system. In October 2006, MDE requested that PPRP provide assistance to an independent evaluation of the source of heavy metals and dissolved sulfate detected in residential wells near the site. A statistical comparison of residential and monitoring well water quality data indicated that fly ash placement in the Turner and Waugh Chapel Pits at the site likely contributed to deterioration of ground water quality in the site vicinity. Constellation and MDE entered into a
Figure 3-21 Distribution of Beneficial Use CCB Projects in Maryland
� � � � � � � �
� � � �� � � � � � � �
� � � � � � ��� � � �
��
��
��
��
�
�
�
�
�
�
�
�
� �
��
�
�
��
�
�
��������������� ����������� ��������� ��������� ���������������������� ���������������������
������������������������ ����������������������������������� �������������������������� �������������������������� �������������������������������������� ������������������������� ����������������������� ������������� ��������������������� ����������� �������������������������������
������������������������ ������������������������ ����������������������������������������������������������������� ������������ ��������������� ��������������������������������� ������������ ���������� ����������
���
�
���
�

104
M a r y l a n d C u M u l at i v e e n v i r o n M e n ta l i M pa C t r e p o r t — 1 5 t h e d i t i o n
Consent Decree in October 2007 that lays out an approach to resolve the identified impacts. Careful planning and execution of the disposal and/or reuse of CCBs is necessary to minimize impact to the surrounding environment.
DispositionandBeneficialUse
Of the approximately two million tons of CCBs produced by Maryland power plants in 2008, about one-half of these were placed in disposal sites (see locations in Figure 3-21) with the largest disposal site being the Westland ash site in Montgomery County. In contrast, the largest beneficial user, AES Warrior Run, placed all (378,034 tons in 2008) plant-generated CCBs in surface coal mine restoration projects in Western Maryland. In 2008, the remainder of the Maryland beneficial use stream was used in a variety of applica-tions including: • Concrete, block, and cement manufacturing (399,039 tons of CCBs); • Blasting grit (39,926 tons); and • Snow and ice control (11,400 tons).
Beginning in 2010, FGD material generated at Mirant Mid-Atlantic plants in Maryland will be provided to wallboard manufacturers as a replacement for natural gypsum. The Brandon Shores plant, owned by Constellation, plans to landfill all FGD material until an acceptable user is established.
Fly ash, bottom ash, slag, and FGD material have different primary beneficial uses because each component has distinct physical and chemical properties suited to a specific beneficial use application. Fly ash is used in the largest quantities and the widest range of applica-tions among the CCBs (see Table 3-8) because of its pozzolanic properties. Use in cement and concrete production tops the list of leading fly ash applications, followed by structural fills and waste stabilization. The relatively uniform spherical shape and particle distribu-tion of fly ash improves properties of flowable fill and the fluidity of grout. For waste stabilization, fly ash can act as a drying agent for wet materials such as sludge, sediment or dredged material. Figure 3-22 highlights the quantity of CCBs generated and disposed by Maryland’s coal-fired power plants annually.
The primary beneficial uses for bottom ash are road base/sub base, structural fill, and snow and ice control. Minor uses include concrete, mining applications, and cement clinker raw feed. Bottom ash is also used as fine aggregate in asphalt paving mixtures. Owing to its considerable abrasive properties, slag is used almost exclusively in the manufacture of blasting grit and roofing granules. Primary beneficial use applications for FGD material are wallboard and concrete manufacturing, mining applications, structural fill, and agricul-tural applications. Structural fill and concrete manufacturing account for the majority of the beneficial use of FGD material. Although agricultural use as a soil conditioner currently accounts for only a small fraction of FGD material reuse, agricultural application has the potential to exceed the volume of FGD material used in wallboard manufacturing.
Figure 3-22 CCB Generation and Disposal, 2008
�
�������
�������
�������
�������
�������
�������
�������
�������
������������������ �������������������������
��������� ����������������������
�������������������������������������
����

105
C h a p t e r 3 — i M pa C t S o F p o W e r G e n e r at i o n a n d t r a n S M i S S i o n
PPRPDemonstrationProjects
With the beneficial reuse of about one-half of all CCBs generated, Maryland is above the national average of approximately 43 percent, as reported by the American Coal Ash Association in 2007. PPRP believes that this percentage can be further increased even with the greatly increased production of FGD material beginning in 2010. Since 1994, PPRP has supported research and demonsteration projects regarding beneficial uses of CCBs. Of particular interest are applications which could use massive quantities of CCBs.
This approach led to systematic investigation of the severely disturbed mined lands of Maryland to determine how stabilized CCBs or other problem materials stabilized with pozzuolanic CCBs might be used to return these areas to constructive use, reduce acid mine drainage, prevent further subsidence, and restore natural drainage patterns. In support of the overall CCB research program, PPRP supports a geographic information laboratory and mapping service in the Geography Department and a leachate testing capability in the Chemistry Department at Frostburg State University (FSU). A soils and material science laboratory has also been established at FSU and is operated by the Western Maryland Resource Conservation and Development Council, Inc.
Several field-scale projects have been initiated or completed to demonstrate various grout-ing applications of CCBs.
The Winding Ridge Project – Monitoring effluent from the Frazee Mine on Winding Ridge began in 1995 to establish a baseline to measure the effectiveness of backfilling this small mine with CCBs. It was partially filled with 5,600 cubic yards of fly ash, FBC material, and mine water in 1996. This treatment has reduced all heavy metals in the mine effluent below detection limits. The project received international recognition at the World of Coal Ash Conference in 2007. PPRP published a 10-year update on the project in October 2008.
The Siege of Acre Project – An isolated segment of Kempton Mine 42 was found to be producing unusually acidic drainage with a pH of 2.2. A DOE grant was obtained to drill observation holes to the three tunnels that make up the segment and plan grouting to cover the 750 feet of exposed mine pavement and debris in each tunnel.
The Kempton Man Shaft Project – In 2003, fly ash, FBC material, and mine water were used to intrusion grout around this 420-foot mine shaft at Kempton, Maryland in hopes of reducing the cone of depression it creates in the regional water table under the sensitive wetlands on the North Branch of the Potomac River. The impact of the grouting continues to be monitored.
The McDonald Mine Project – In August 2005, the McDonald Mine in the Georges Creek Coal Basin blew out and overwhelmed the doser treating its effluent. PPRP and the Mary-land Bureau of Mines are collaborating on investigations of how to bring the increased flow under control, manage the large volume of sediment being generated, and provide more effective treatment in the limited space available between the mine discharge and Georges Creek.
The Hoyes Run Project – Hoyes Run is a highly valued trout stream that runs adjacent to the Key Stone Quarry in Garrett County, Maryland. During periods of low flow, its entire flow was lost to solution channels developed in a loss zone near the Quarry. The solution channels generally filled with stream sediment and debris and were thus candidates for sealing with permeation grouting using conventional chemical grouts. However, when conventional chemical grouting was tried these grouts expanded with such pressure that partings in the streambed rocks increased causing even greater stream loss. A grout of fly ash and fine particle FBC material filled the solution channels and effectively seal the streambed without causing any problems so long as the channel entrances can be identified

106
M a r y l a n d C u M u l at i v e e n v i r o n M e n ta l i M pa C t r e p o r t — 1 5 t h e d i t i o n
and isolated for grout injection. As new solution channels develop, they are being identi-fied for grouting in each low flow season.
In addition to these demonstration projects, PPRP supports research that can be used by others for implementing CCBs and waste-to-energy ash in beneficial applications. Some studies of special note include include:
Weathering Studies of CCB-based Pozzolan Stabilized Materials (PSM) – On-going research has been conducted at the Western Maryland Resource Conservation & Develop-ment Council, Inc. (RC&D) Materials Testing Laboratory to establish use of PSM as a flowable fill for abandoned underground mine applications. Initiated in June 2005, CCB weathering experiments document the physical and chemical degradation of CCB grout that could occur if placed as cover on abandoned underground mine pavement and exposed to AMD. To simulate abandoned mine conditions and determine environmental impacts, blocks of varying CCB composition were placed in flowing water ranging from pH 7 to pH 3.0. Samples of the circulating water were collected quarterly for the first
year and periodically afterward to analyze for trace metals and selected contaminants of concern. Due to the inherent buffering capabilities of the CCB grout when exposed to AMD, the circulating water is analyzed daily for pH and adjusted back to the specified pH level using a 5 percent sulfuric acid solution. To date, monitoring has shown no decrease in stan-dard water quality parameters (i.e., calcium, potassium, sulfate, and TDS) as expected from surficial CCB grout weathering under acidic conditions. The weathering blocks demonstrate great potential for neutralizing AMD if placed in stream beds or as a covering on abandoned mine pavement. Further field study is expected and analysis of the blocks continues.
Dredged Material (DM) Stabilization – PPRP is a member of the DM Management Program Innovative Reuse Committee providing guidance on the beneficial use of massive amounts of material including DM and CCB blends. As an additive to DM, CCBs promote drying and condition-ing of an otherwise poor engineering material. Preliminary and on-going laboratory tests of Baltimore Harbor DM blended with Maryland CCBs have resulted in a structurally stable material with excellent engineering properties.
Cost Studies – PPRP has developed cost estimates for placing fly ash and FBC material in abandoned underground mines as grout to become stabilized material and for placing Class F fly ash and lime kiln dust (LKD), the most plentiful high lime content industial waste product avail-able in Maryland, to trigger the pozzuolanic reaction in fly ash to become stabilized material in pit mines. These estimates suggest the use of CCBs in these applications will be competitive when mine filling is required and will be competitive with proposed methods of landfilling in terms of cost.
Investigation of Works Project Administration (WPA) Maryland Mine Sealing Program – The largest mine sealing program ever undertaken in Maryland was that of the WPA in the 1930s. It was largely judged a fail-ure in terms of reducing acid mine drainage. The extent of the Program and reasons for its failure to impact acid mine drainage were investigated as guidance for large-scale use of CCBs in mine applications.
Maryland FGD Installations and Synthetic Gypsum ProductionAnticipated By-product to be Generated by FGD Units Installed on Maryland Power Plants in 2010
PlantEstimated Average Mass
(tons/year)
Morgantown 375,000
Brandon Shores 240,000
Dickerson 185,000
Chalk Point 175,000
Source: Maryland Department of the Environment, 2009
Four Maryland power plants are currently preparing to install FGD scrubbers, which will begin operating in 2010. Although these scrubbers will reduce air emis-sions, an increase in synthetic gypsum production will occur. Synthetic gypsum can be beneficially utilized in the production of wallboard and currently accounts for nearly 30 percent of all wallboard produced in the U.S. Since synthetic gypsum contains mercury that is present in the flue gas of coal-fired power plants, concerns have been raised regarding the potential for mercury exposure from wallboard. A recent study by Exponent found that both synthetic and natural (mined) gypsum contain mercury, although synthetic gypsum typically has higher levels of mercury. When measuring the volatilization of mercury from both natural and synthetic gypsum wallboard, the results (0.92 +/- 0.11 and 5.9 +/- 2.4 ng/m3, respectively) were well below the U.S. EPA reference concentrations for elemental mercury in indoor air of 300 ng/m3, the Agency for Toxic Substances and Disease Registry minimal risk level (MRL) of 200 ng/m3, and even the background mercury concentrations for indoor air.

107
C h a p t e r 3 — i M pa C t S o F p o W e r G e n e r at i o n a n d t r a n S M i S S i o n
Maryland’s Carbon Storage and Use Plan – PPRP is developing Maryland’s Carbon Sequestration Plan and Carbon Dioxide Storage and Use Plan through research at FSU in collaboration with the Maryland Geologic Survey, U.S. DOE, and industry. The FSU Coal and Shale Analysis Laboratory, founded in 2008, conducts research on the preferential displacement of methane molecules from organic molecules of shale and coal by CO2 and investigates beneficial uses of CO2 such as injection to increase yield in abandoned gas wells, recovering coal-bed methane from unmineable seams, and CO2 as a replacement for fluids in deep well fracturing. Data to support the carbon storage and use plan is also gathered at the Western Maryland Regional GIS Center, where the first phase of planning is complete. Phase I included the identification and mapping of geologic units with the potential to sequester CO2. The resulting map of potential CO2 repositories is shown in Figure 3-23. Phase II began in 2009 and involved the location of leaky abandoned natural gas wells that impact the integrity of the Deer Park Anticline for CO2 storage.
Cataloguing of Maryland Mine Information – Any program for the massive use of CCBs in Maryland mines required organizing the information scattered in numerous collec-tions in the State. With the majority of the information in the Ort Library at FSU, PPRP sponsored a project through the Maryland Bureau of Mines to inventory the Ort Library material and create a reference guide to expedite the development and planning of mine restoration projects.
Figure 3-23 Potential Geologic Repositories for CO2 in Maryland

108
M a r y l a n d C u M u l at i v e e n v i r o n M e n ta l i M pa C t r e p o r t — 1 5 t h e d i t i o n
3.2 Transmission Line and Pipeline Rights-of-Way
More than 2,000 miles of electric power transmission line rights-of-way are located throughout Maryland. These rights-of-way are constructed and maintained as long, linear corridors that are often markedly distinct from the surrounding environment. The corridors may cross streams and rivers, split patches of forest, traverse farms and open areas, run alongside roads and through residential areas, or span wetlands and other sensitive habitats, resulting in a variety of effects. To provide public review and to ensure that environmental and other concerns are addressed, CPCN applications for new corridor construction and for modifications in existing corridors must be provided to and approved by the PSC. PPRP coordinates the review of these applications to identify both temporary construction effects and potential long term impacts in the same manner as for proposed power generating facilities.
In general, overhead transmission line corridors vary from approximately one hundred to several hundred feet wide, depending on the power-carrying capacity and the number of lines routed through the corridor. As they stretch across the Maryland landscape, transmis-sion corridors are bound to cross natural features such as streams and floodplains, but because of their relatively narrow width it is usually possible to avoid wetlands, forests, rare species habitat, historical and archeological sites, and scenic viewsheds. Several new transmission lines across Maryland have been proposed recently in response to PJM trans-mission planning and federal studies that indicate the northeast U.S. is in critical need of increased transmission capacity and reliability. Furthermore, should offshore windpower facilities be built near the Maryland coast, additional large capacity transmission lines may also be needed on the Eastern Shore. Applications for interstate transmission projects of this sort raise many unique environmental or other issues, such as preserving natural habitats along the Atlantic Coast, shielding the views and vulnerable stream habitats of suburban central Maryland, protecting the sensitive bottom habitats of the Chesapeake Bay, or insuring the security of power delivery to populations and facilities in Washington, D.C., Baltimore, Maryland, and other urban areas.
Three major transmission projects are currently in various stages of review. In late 2008, SMECO submitted a CPCN application to upgrade an existing 69-kV line in its territory to a 230-kV line along a 30-mile route. Shortly thereafter, in February 2009, Pepco Holdings, Inc. (PHI) submitted a CPCN application for the first part of the 230-mile long, 500-kV Mid-Atlantic Power Pathway (MAPP) project. This segment of MAPP would cross the Potomac River into southern Maryland from a substation at Possum Point, Virginia and run for 72 miles in existing rights-of-way to a substation at the Calvert Cliffs Nuclear Power Plant. Future parts of the project (for which applications are expected in fall 2010) include crossing under the Chesapeake Bay and building a new 13-40-mile transmission right-of-way across Dorchester County to a substation near Vienna, Maryland and then eastward on existing right-of-way in Wicomico County to the Delaware State line. A third project, which submitted a CPCN application in May 2009, is the Potomac-Appalachian Transmis-sion Highline (PATH). At 765 kV, this 20- to 30-mile long line would be the largest capacity line ever built in Maryland. The Maryland portion would be within Frederick County, and, in most places, will expand the width of an existing right-of-way. The line would cross the Potomac River upstream of Point of Rocks and connect to the existing power grid through a new substation to be built near Kemptown.
PPRP reviews the environmental impacts of transmission line projects like these from a number of perspectives. Brief discussions of the review considerations and typical impacts are provided in the subsections below for vegetation and land cover, wetlands, wildlife,

109
C h a p t e r 3 — i M pa C t S o F p o W e r G e n e r at i o n a n d t r a n S M i S S i o n
threatened and endangered species, and Maryland’s Green Infrastructure, followed by a summary of the cumulative effects of transmission line rights-of-way. Impacts on water resources and the Chesapeake Bay are discussed in Section 3.2.2.
3.2.1 ImpactstoVegetationandLandCoverAny transmission line right-of-way in Maryland that is longer than a mile or two will generally pass through a mosaic of land cover types, including forested areas, agricultural lands, residential and urban development, and infrastructure such as roads, power facili-ties, airports, and military bases. Along the transmission line corridor, mixed hardwood and coniferous forests, agricultural field edges, and undeveloped pockets within urban areas provide wildlife habitat. At frequent intervals the corridor will be located adjacent to or across streams and their associated riparian and wetland areas.
In existing transmission line rights-of-way, past maintenance will have shifted the vegeta-tion toward low-profile species, such as grasses, ferns, flowering plants or forbs, shrubs, and tree saplings. Many of the species present in the right-of-way may be non-native species that were planted after the initial clearing to prevent soil erosion, or weedy and invasive species that have taken advantage of the corridor to move into new territory. In a few places, where clearing to maintain the right-of-way has not been frequent, taller veg-etation may be present, but generally the right-of-way will be open, with sparse vegetation cover and a different assemblage of plant and animal species than is present in the adjacent areas. The bordering ecosystems (within 100-300 feet of the right-of-way boundaries) will also be degraded to some degree where the vegetation has been disturbed or altered by right-of-way construction and maintenance.
Shrubs and small trees are most likely to be found in low-lying areas associated with streams or wetlands crossed by the right-of-way. These areas are accessed less frequently because of wetness, and the plant community will tend to be more diverse and mature than in upland locations. Forested areas adjacent to the right-of-way will typically comprise regionally important species such as Loblolly Pine (Pinus taeda), Virginia Pine (Pinus virginiana), Shortleaf Pine (Pinus echinata), Southern Red Oak (Quercus falcata), Black Oak (Quercus velutina), Scarlet Oak (Quercus coccinea), Pin Oak (Quercus palustris), Willow Oak (Quercus phellos), Northern Red Oak (Quercus rubra), Black Walnut (Juglans nigra), Tuliptree (Liriodendron tulipifera), Sweetgum (Liquidambar styraciflua) and Red Maple (Acer rubrum).
The most obvious impact of transmission line rights-of-way is the replacement of forested land cover with a cleared strip of land. The impact to the surrounding vegetation depends to a large extent on maintenance practices. Maintaining a cleared transmission line right-of-way through a forest splits the forest into disconnected pieces and provides invasive species with routes into the forest interior. The effects are less severe in agricultural areas, particularly if the transmission company permits continued use of the land for crops or pasture. In residential or commercial areas, environmentally sensitive maintenance of rights-of-way can actually augment nearby streams and wildlife habitat, thereby providing buffers that retard environmental degradation from urban development and runoff.
When a new transmission line is built, there are additional, temporary impacts from construction access by cranes and other heavy equipment, construction traffic on unpaved access roads, boring for transmission line pole foundation installation, and wire installa-tion activities. Activities to minimize construction impacts normally include restoration of contours to pre-construction conditions and controlling erosion until re-vegetation stabilizes the disturbed areas. The Maryland State agencies generally recommend that the vegetation be restored to native species and that the natural functions of the pre-construc-tion ecosystem be protected.

110
M a r y l a n d C u M u l at i v e e n v i r o n M e n ta l i M pa C t r e p o r t — 1 5 t h e d i t i o n
Transmission companies are required to maintain rights-of-way in a safe condition that assures the reliable delivery of power in accordance with national safety standards. Although it has been common practice to achieve this goal by clearing and mowing the right-of-way, such vegetation management practices are usually unnecessary and can be excessive in sensitive areas and through forested habitat. The State agenices recommend leaving the right-of-way in a natural state to the maximum extent possible, creating curved or wavy right-of-way boundaries, pruning trees to create a feathered right-of-way edge, and piling brush from any necessary clearing operations so that it provides wildlife habitat. Research, including PPRP-sponsored projects, is continuing on this subject to identify improved best management practices and right-of-way maintenance techniques that build upon the guidelines set forth in the ANSI A-300 IVM-Part 7 standard. Low-frequency, local herbicide treatments or selective clearing are usually sufficient to remove any vegetation that constitutes a threat to the lines. Some areas, such as wetlands and ravines, should be maintained in nearly natural condition to provide wildlife corridors across the right-of-way (see Section 3.2.10).
Trees in or near transmission line rights-of-way can present special maintenance problems. While it is environmentally desirable to remove as few trees as possible, the PSC has estimated that fallen trees and branches are the largest cause of power outages in Mary-land, accounting for almost two-thirds of the 6.5 million customer-hours of electric service interruption in the state in 2006. To address this issue, DNR has joined with the Maryland Electric Reliability Tree Trimming (MERTT) Council, which typically focuses on lower-voltage lines, to develop a clear picture of trees that cause power outages in Maryland. Utility foresters, using equipment and data collection procedures provided by DNR, are identifying each instance of a tree-caused power outage and recording the location, type of tree, and other details. DNR is assembling the data from utilities throughout the state into a common data base and analyzing the data to provide the PSC with accurate information on the causes of such outages. The results will be used by MERTT Council members and DNR to develop improved maintenance practices that identify and remove hazardous trees while maintaining the maximum possible protection for valuable tree resources and forest habitat.
3.2.2 ImpactstoStreams,Rivers,andWatershedsTransmission line rights-of-way crossing streams, rivers, and their watersheds create temporary ecological impacts during construction, and permanent ecological impacts after-ward if they are maintained in an unnatural, cleared state. Constructing and maintaining transmission lines can also affect streams near the right-of-way both directly and indirectly. The primary direct effects are from disturbance caused by construction or maintenance vehicles crossing or working from stream beds, floodplains, or bank areas, which may release sediment, construction debris, and contaminants into the stream. Vulnerable aquatic or riparian zone species may also be disturbed by noise, dust, and construction-caused changes in drainage patterns or soil.
Tree removal during construction can result in immediate as well as long-term soil erosion that increases sediment loads in streams. Left uncorrected, increased sediment can lead to changes in stream morphology and diminished water quality, ultimately degrading the ecological condition of the stream. Removing vegetation from the riparian area reduces stream shading and decreases the amount of leaf litter, woody debris, and rootwads present in the stream system. This may change crucial ecological conditions of a stream, such as increasing water temperatures and reducing habitat and food sources that threaten survival and reproduction of cold water species including brook trout.

111
C h a p t e r 3 — i M pa C t S o F p o W e r G e n e r at i o n a n d t r a n S M i S S i o n
In most cases, long-term effects can be minimized by placing transmission line towers a considerable distance from the stream bank, so that the wires span the stream and riparian area. This configuration is particularly effective at reducing impacts if the right-of-way is maintained in natural vegetation in the riparian area. However, older rights-of-way are frequently entirely cleared, reducing cover and shading, increasing runoff from slopes and erosion near tower foundations, and allowing mowing or the application of herbicides that may affect the stream and its inhabitants. Transmission line owners are encouraged by the State to adopt the most ecologically friendly maintenance practices as practical for these older rights-of-ways.
Large rivers are impacted similarly, but in most cases experience additional impacts. These rivers are often too wide to avoid placing towers directly adjacent to the water, or in the river itself. For example, the 500-kV line crossing the lower Potomac River near Moss Point includes six towers in the river and is currently being considered for a second crossing. All of Maryland’s major rivers, both tidal and nontidal, are crossed by transmission lines. At present, only one of these crossings — SMECO’s transmission line between St. Mary’s County and Calvert County near the mouth of the Patuxent River — is accomplished by a cable beneath the river.
Impacts from transmission support structures placed in the riverbed include disturbance to fish and bottom dwelling organism habitat, redirection of currents and erosion patterns, and potential hazards to navigation. Above the waterline, the towers may provide oppor-tunities for some birds, while interfering with others. Frequently, they also prominently degrade the visual environment along the river. This effect is particularly onerous on Maryland’s designated scenic rivers, including the existing crossings of the Patuxent River, the Monocacy River, and portions of the Potomac River.
Transmission lines that cross numerous streams and rivers within a single watershed may degrade the overall biological health of the watershed. Any local effects that propagate downstream, such as warmer water temperatures or increased sediment load, will accu-mulate. In lower reaches of the watershed, the summed effects could cause a shift in water quality, initiate changes in aquatic species composition, or modify the configuration of the drainage channel. To minimize such effects, the State agencies typically recommend that towers be located as far from stream banks as possible, and require vegetation and construction management practices that minimize the movement of disturbed soil and construction debris toward streams. Where possible, an underground crossing may be an effective way to eliminate both visible and environmental impacts (see Section 3.2.9 for additional details).
ImpactstotheChesapeakeBay
The Chesapeake Bay is Maryland’s largest and most unique water resource. Almost all of the state’s watersheds drain into the Bay, and its health is directly affected by human activities in these watersheds, in the tidal rivers that flow into it, and in the wetlands that surround it. Transmission line rights-of-way affect the Bay through their impacts on these watersheds, rivers, and wetlands, and additional direct impacts could be introduced by a transmission line planned to cross the Bay itself. Over the years, a number of proposals to build such a transmission line have been made, and modern technology has dramatically improved the feasibility and cost effectiveness of such a project.
To protect the Bay from adverse impacts of shore line development, Maryland has defined a “Critical Area” that includes, in addition to the waters of the Bay and the submerged land below them, all land within 1,000 feet of either the mean high water line of tidal waters or the landward edge of tidal wetlands. The Critical Area Act (1984) authorizes State and local governments to assess impacts caused by construction disturbances, run-off, and

112
M a r y l a n d C u M u l at i v e e n v i r o n M e n ta l i M pa C t r e p o r t — 1 5 t h e d i t i o n
activities within the 1,000-foot buffer zone. Any projects which may directly or indirectly affect the Critical Area in the state, including transmission line rights-of-way, are required to seek and obtain approval from the Critical Area Commission. The State discourages new lines in the Critical Area and recommends protective construction and vegetation management approaches.
A transmission line across the Bay itself, presumably underwater, would be expected to have short-term, acute impacts caused by construction activities, and long-term impacts from the construction disturbance, maintenance activities, and the operation of the electric power line once it is energized. Submarine cables exist in several areas of the United States, although none are in a water body as productive and biologically diverse as the Chesa-peake Bay. Turbidity, temperature, and salinity changes in the water column, and physical barriers on or in the bottom sediments, will be of concern. Heat released during the opera-tion of the cable could create a permanent warm area, affecting benthic habitats, spawning times of sessile species, and water mixing patterns. Aquatic habitats may be affected by re-suspension of sediments from this area during construction that may release contami-nants or nutrients into the water column. The depth profile of the bay, and its strong tidal influences, would allow disturbances that re-suspend sediments or contaminants to have effects well beyond the immediate physical footprint of the cable path, such as adjacent oyster and clam beds. A disturbance that transects the Bay, either short-term or long-term, could impact distribution and migration routes of commercially and ecologically important aquatic species, such as striped bass, American shad and eels, and blue crabs.
Any proposal for a transmission line across the Bay would be subject to extensive review by State and federal agencies. A thorough pre-construction assessment of sediments, wetlands, benthic community conditions, nesting areas, and sensitive and protected species habitats would likely be required to identify any potential impacts.
ImpactstoGroundWater
Impacts to ground water due to transmission lines mainly occur during the construction or installation of the structures, whether above ground or underground. The construction of new overhead transmission tower foundations may require drilling to depths that can penetrate the water table. For example, the estimated drilling depths required for new structures in the SMECO Holland Cliff to Hewitt Road 230-kV transmission line project are approximately 40 feet below ground surface. While there may be concern that such drilling could cause an adverse impact on potable ground water in the Coastal Plain aquifers beneath the right-of-way, typically the upper 40 to 60 feet of strata beneath the land surface in Calvert County, where the project will be located, consists of a mix of gravel, sand, silt and clay associated with the Lowland and Upland deposits. The shallowest potable supply of ground water in Calvert County is obtained from the Piney Point Aquifer, which is typi-cally located 200 to 300 feet below ground surface across the county, according to Maryland Geological Survey reports. As structure heights increase for higher voltage overhead transmission lines, the required drilling depths may be deeper than that of the SMECO project; therefore, the drilling depths and depth to groundwater will need to be considered for proposed transmission line projects in Maryland.
Alternatives to traditional overhead construction, such as underground and submarine cable installations, are becoming increasingly more common as the technology advances. Potential impacts associated with underground installations may include the redirection of ground water flow associated with the construction of underground duct banks and splice boxes or backfilling the trenches with material of differing porosity. Another potential effect could be an increase in ground water temperature due to the heating of an under-ground cable during its operation. The existence and magnitude of these impacts will be
113
C h a p t e r 3 — i M pa C t S o F p o W e r G e n e r at i o n a n d t r a n S M i S S i o n
dependent upon several factors, including the project location, installation depth, construc-tion technique employed, soil type, depth to ground water, transmission line voltage, and operating conditions, which are all evaluated during the State agencies' environmental review of any proposed transmission line projects in Maryland.
3.2.3 ImpactstoWetlandsWetlands are among Maryland’s most valuable natural resources. Tidal wetlands are protected by the Critical Area Act (see the Chesapeake Bay discussion in Section 3.2.2), and non-tidal wetlands — including wetlands in utility rights-of-way — fall under the Non-Tidal Wetlands Protection Act. Maryland’s overall goal is no net loss of non-tidal wetlands acreage or function. To address this goal, the State requires that any unavoidable wetland losses be replaced at least acre for acre. Greater replacement ratios (up to 3:1) are specified for forested wetlands and Wetlands of Special State Concern. To construct a transmission line project in a wetland, the utility must obtain a Letter of Exemp-tion, a State Programmatic General Permit, or an Individual Wetlands Permit that details project-specific conditions from MDE, or the U.S. Army Corps of Engineers, or both. While new routes are usually planned so as to avoid wetlands and forested wetlands, rights-of-way constructed prior to the Non-Tidal Wetlands Protection Act were less favorably sited, and many undesirable wetland impacts exist.
Wetland impacts result when vegetation, soil, or water flow is altered by the transmission line right-of-way, either directly or indirectly. Access roads within wetlands are particu-larly damaging because fill is used to raise the roadbed above the water table, thereby changing both the natural drainage and the soil. Parts of the wetland that are isolated from their water source by the road or associated ditching can dry out. In addition, invasive plants may grow into the wetland on the dry elevated road bed and compete with the wetland plants for sunlight and water without proper management practices. The prefer-able access for pole placement and line maintenance near wetland areas is via access points on either side of the wetland, avoiding direct impacts. Where upland access is not possible, matting can often be placed over the wetland area to minimize damage from equipment and activities, without building permanent roads.
Indirect construction and maintenance impacts to wetlands are primarily caused by soil disturbance in uplands that allows runoff to convey loosened soil into streams and associ-ated wetland areas. Construction noise and dust can also disrupt nearby wetland habitat, and should be avoided during critical reproductive periods for the plants and animals that make up the wetlands ecosystem. Subsequent to construction, it is particularly important to use only EPA-approved and appropriate herbicides in or near wetland areas, and to refrain from mowing or using other equipment within wetlands areas. Overall, transmis-sion line construction has the least impacts on wetlands when poles can be placed on high ground on either side of a ravine, well away from wetland areas, or in horizontally-bored duct banks below the wetland (see Section 3.2.9).
3.2.4 ImpactstoWildlifeA large portion of the transmission line rights-of-way in Maryland is located in unde-veloped areas that provide abundant wildlife habitat in forests, streams, and wetlands. Although many construction impacts are temporary, with original conditions restored as much as possible after construction is completed, the long-term habitat alterations often continue to affect birds, terrestrial animals, amphibians, and fish.
A transmission line right-of-way through a forested area creates cleared areas within unnatural edges that are not desirable habitat for forest interior-dwelling species, and often provides a corridor for invasive species that compete with or prey upon native forest
114
M a r y l a n d C u M u l at i v e e n v i r o n M e n ta l i M pa C t r e p o r t — 1 5 t h e d i t i o n
species. The effects are particularly severe near forested streams and wetlands as discussed in Sections 3.2.2 and 3.2.3. There are less drastic impacts in shrub-scrub and agricultural areas, but even in these habitats the maintenance of the right-of-way in a mowed state can result in a gap between natural habitat patches. Such gaps can present an insurmountable barrier to some species, thereby isolating the populations in the patches. Even highly mobile species may not be able to maintain a coherent population because individuals that attempt to cross the cleared area are exposed to a much higher risk of predation than in their preferred habitat.
Forest-interior-dwelling (FID) species are particularly sensitive to the size of the remnant patch. Interior habitat is defined as a contiguous zone of forest that is more than 300 feet inside of the edges of the forest area, and is dependent on the shape of the area as well as its total size. Long-term research by the Maryland DNR indicates that interior habitat usable by some plant and animal species can exist in forest parcels as small as a couple of acres, but sufficient interior habitat to support resident breeding populations of FID birds generally requires forest areas on the order of several hundred acres. According to the Natural Heritage Program, the populations of many FID birds are declining in Maryland, often because of loss of suitable amounts of forest interior habitat. Thus, the effect on FID species of a transmission line corridor that splits or reshapes the edges of a large forest parcel may be significant, and the impact can be drastic in patches smaller than 100 acres or in riparian areas. PPRP and the DNR Wildlife and Heritage Service recommend that utility corridors not be placed at all in: a) contiguous upland forests greater than 50 acres; b) riparian forests greater than 300 feet in width that border a stream for at least 600 feet; c) riparian forests at least 150 feet wide and connected to a or b; and d) forest patches 10 acres or larger and within 300 feet of forest that meet criteria a, b, or c.
Another potential impact of transmission lines is bird collisions and electrocutions. The U.S. Fish and Wildlife Service and the Avian Power Line Interaction Committee (APLIC), which included participation by the Edison Electric Institute, have cooperatively developed guidelines to help prevent injuries to birds that contact power lines. The State uses the voluntary guidelines, which were released in 2005, to help utilities develop Avian Protec-tion Plans that meet the specific needs of their facilities, protecting birds from electrocution and collisions as well as reducing the likelihood of power outages caused by bird collisions.
3.2.5 ImpactstoThreatenedandEndangeredSpeciesMost rare, threatened, or endangered species are composed of small populations that occupy localized environmental niches that meet their specific life-cycle criteria. Avoiding anthropogenic effects in these locations is the critical step in protecting the species, since even small disturbances may place the remaining population at risk. New transmission line corridors are usually an undesirable disturbance, although the changes that have been introduced by existing transmission line rights-of-way sometimes create an ideal niche for a threatened or endangered species.
For example, eagle nests have been found on transmission line towers (see Figure 3-24). In other places, rare species such as the showy goldenrod (Solidago speciosa) have colonized the right-of-way. If care is used in maintenance or modification of such rights-of-way, coexistence with their new, protected inhabitants is possible. On the other hand, when a potential transmission line route in western Maryland was investigated recently, it was found to cross a wetland system containing 11 rare, threatened, or endangered species. The wetland, including a sphagnum peat bog and associated meadow with surrounding brushy areas and hemlock forest, was a designated Non-tidal Wetland of Special State Concern. The impacts of a new transmission line right-of-way across this wetland would be significant.

115
C h a p t e r 3 — i M pa C t S o F p o W e r G e n e r at i o n a n d t r a n S M i S S i o n
The Maryland DNR Wildlife and Heritage Service, Natural Heritage Program, maintains inventories of all of the State’s designated rare, threatened, and endangered plant and animal species, with particular attention to those that require special habitat protection to support viable populations. The route of every proposed new or modified transmission line is compared against this database to identify all possible impacts. When habitats and approximate areas where rare species may be found in the vicinity of a proposed project are identified, specific recommendations are made for protecting the population and mitigating the impacts, including avoid-ing disturbances during breeding seasons or migrations, controlling hydrology impacts during and after construction, controlling and monitoring sediment disturbance, and restricting actions or operations that will damage individuals of a vulnerable population.
3.2.6 ImpactstoMaryland’sGreenInfrastructure
The Maryland DNR, through programs such as the Green Infrastructure Assessment, has established land conservation strategies to preserve and enhance the State’s ecological health. DNR’s programs assess ecological habitat, coordinate management efforts, and acquire natural lands where possible. DNR’s Green Infrastructure network comprises areas of large, contiguous forest habitat – known as hubs – and narrower natural corridors that connect the hubs to allow their faunal and floral populations to interact.
Rights-of-way that are constructed and maintained through Green Infrastructure hubs and corridors split them into small, disconnected pieces (fragments), and diminish their ability to function as integrated habitat units. While the area of the removed forest may not be great, there may be severe consequences for many species that depend on the hub or corridor habitat. Invasive plants such as Japanese honeysuckle, Asiatic bittersweet, and wicker microstegium can grow prolifically in the cleared-edge habitats of transmission line rights-of-way and can spread into the forest interior, limiting the growth of native species. Careful vegetation management in the right-of-way can mitigate some of these effects.
For existing transmission line rights-of-way that already cut through Green Infrastructure habitat, expansions of the right-of-way into the surrounding natural territories are discour-aged by DNR, and vegetation management plans that enhance the habitat are encouraged. Siting new transmission lines within Green Infrastructure network components is regarded as a last resort, to be employed only if it is not possible to bypass the Green Infrastructure system and align the new transmission line with pre-existing disturbed and degraded areas. In all cases, DNR attempts to ensure that disturbance to the habitat network is minimized or mitigated, and that subsequent right-of-way maintenance follows a special-ized and appropriate plan that enhances the functioning of the ecological network as much as possible.
3.2.7 ImpactstoAirQualityAs the population of Maryland and neighboring states throughout the northeastern U.S. continues to grow, there is concern that the demand for electricity may outstrip the capabil-ity of the existing transmission infrastructure and local power plants to provide electricity reliably. Among the actions being taken to ensure adequate supplies of electricity region-ally is the proposed construction of three new multi-state, high-voltage transmission
Figure 3-24Photograph of Eagle’s Nest in Tower

116
M a r y l a n d C u M u l at i v e e n v i r o n M e n ta l i M pa C t r e p o r t — 1 5 t h e d i t i o n
lines, namely MAPP, PATH, and TrAIL (see Section 2.6.4 for details), that will allow for the importation of power from under-utilized power plants in the Ohio River Valley and West Virginia. New transmission capacity could also stimulate construction of new power plants within the region.
Concerns have been raised regarding the impact that these new transmission lines will have on the distribution of generation in the region. These concerns are focused on the possibility that easier access to transmission into Maryland will result in increased genera-tion at coal-fired power plants outside of the state, in relation to electricity generation at in-state coal-fired plants or at power plants fueled by natural gas. This shift in generation has the potential to increase overall emissions of CO2 and other air pollutants such as SO2, NOx, and mercury. Maryland has actively implemented programs (the HAA) and is par-ticipating in regional programs (e.g., RGGI) to prevent increases in emissions of CO2 and to reduce emissions of SO2, NOx, and mercury. As part of the CPCN process for these new transmission lines, PPRP is evaluating the potential for increased emissions and the effects of these increases using two different types of models – the HAIKU model to estimate the effect of the transmission lines on future generation, and the CALPUFF model to estimate the effects of emissions of SO2, NOx, and mercury on air quality in the state.
3.2.8 SocioeconomicsandLandUseIssues
CulturalandArcheologicalResources
Although two of the proposed high-voltage transmission lines in Maryland will utilize existing corridors, others would traverse one of Maryland’s newest CHAs, in addition to many other cultural assets in Maryland. Even within existing corridors, the proposed SMECO 230-kV transmission line and the MAPP segment between Chalk Point and Calvert Cliffs would be constructed on taller poles with a potentially more expansive visual footprint. While forest stands along these rights-of-way in Calvert County reduce the visibility of poles and the SMECO project reduces the number of poles by 30 to 40 percent, the adverse effect of transmission line structures on key cultural and heritage resources is still an important consideration in the State’s environmental reviews.
Visual effects from transmission lines are varied. Structures or conductors that are highly visible against the sky can block distant views and undermine the aesthetic qualities of a landscape. When located in proximity to domestic or nominal structures, the scale of the transmission line can distort the sense of place associated with an area. When collocated with other transmission lines, multiple poles and conductors add clutter to a corridor, severely compromising views in that direction. Visual impact is also a function of the scenic values of a landscape. Transmission lines that cross a blighted landscape may add clutter or obstruct views, but have little effect of the landscape’s scenic value. The opposite is true when a transmission line is within a landscape that has a high scenic value.
It is in this context that the State agencies evaluated indirect cultural resource impacts from the proposed SMECO Holland Cliff to Hewitt Road transmission line. Located in southern Calvert County and southeast St. Mary’s County, the project would replace existing poles, which are primarily made of wood, approximately 65 feet tall, with weathering steel poles ranging from 110 to 140 feet. Where additional clearance is needed, poles would be up to 160 feet tall. Although the vertical dimension of the transmission line would increase its visibility, span lengths between poles would be greater, reducing the number of structures within the corridor by 30 to 40 percent.
The State's environmental review demonstrated that landscapes along much of the transmission line corridor are rural, characterized by low density residential housing, agriculture and open space, except where the corridor skirts Prince Frederick and passes

117
C h a p t e r 3 — i M pa C t S o F p o W e r G e n e r at i o n a n d t r a n S M i S S i o n
through St. Leonard’s Shores and Town Creek, where built environment predominates. The transmission corridor passes through two clusters of the Southern Maryland Certified Heritage Area, and is proximate to many existing and proposed greenways, trail systems, driving and bicycle tours in Calvert and St. Mary’s counties or elements associated with the Chesapeake Bay Gateways Network. Parts of the corridor are near the Captain John Smith Chesapeake National Historic Trail or the Star-Spangled Banner National Historic Trail. Although the resource values of these cultural entities include a significant visual com-ponent, the State agencies concluded that key heritage resources would not be adversely affected by the project because the visual landscape would be largely unchanged and the existing corridor has been dedicated to utility use for more than 50 years.
Other proposed transmission lines in Maryland would occupy new corridors. PATH, for example, cuts through southern Frederick County from a crossing of the Potomac River through the C&O Canal National Historical Park upstream from Point of Rocks to Kemp-town Junction. The landscape of southern Frederick County contains many key heritage resources, including Sugarloaf Mountain and the Carrollton Manor Rural Legacy Area. The Heart of the Civil War CHA, a partner in the Journey Through Hallowed Ground National Heritage Area, also overlays Frederick County, and some preliminary corridor alternatives are proximate to the Monocacy National Battlefield. In Dorchester County, a MAPP corridor will have to negotiate protected lands including the proposed Harriet Tubman Underground Railroad National Historic Park. While landscapes in Frederick and Dorchester counties are not pristine, their cultural resource values are still important, both from a preservation viewpoint and for the economic benefit of heritage tourism.
Undergrounding is often touted as a preferred alternative to above ground high voltage transmission lines. While underground cables are less visible, construction impacts, particularly on cultural resources can be significantly higher because excavation is far more extensive for underground installations. This was clearly evident in SMECO’s proposed Holland Cliff to Hewitt Road transmission line, which includes an underground segment through the Navy Recreation Center (Navy Center) in Solomons.
Because the project is subject to both federal and State historic preservation laws and regula-tions, SMECO commissioned an archeological assessment of the likelihood that archeologi-cal sites would be affected. Within the Navy Center, investigators assessed the likelihood of adverse effects on known sites on the property by conducting a field assessment of alternative routes that SMECO is considering through the Navy Center. The Navy Center has been systematically surveyed for cultural deposits over the years, and several sites have been identified, five of which are within or adjacent to the proposed right-of-way. Quarters A, an historic property on the Maryland Inventory of Historic Places, is also located within the Navy Center. MHT has concluded that further consultation between SMECO, the U.S. Department of Agriculture (USDA) and MHT will be required to assess potential impacts upon archeological resources and historic properties within the Navy Center. Prior to construction, Phase II testing will be required on archeological sites within or adjacent to the selected right-of-way through the Navy Center to determine the need for further archeo-logical work to enable MHT to determine whether the project will have an adverse effect upon NRHP eligible sites and recommend appropriate mitigation or avoidance measures.
VisualImpacts
Construction of transmission facilities invariably changes the character and quality of a landscape. In Maryland, because landscapes are important components of its Heritage Area, Greenprint, Rural Legacy and other public and private land conservation programs, the overall impact of an energy facility on visual amenity is of concern to PPRP during the State's environmental reviews.

118
M a r y l a n d C u M u l at i v e e n v i r o n M e n ta l i M pa C t r e p o r t — 1 5 t h e d i t i o n
Visual impacts from overhead transmission lines are a concern because, as linear facilities, they extend through multiple landscapes. As such, adverse effects upon views are difficult to avoid and mitigate. Visual impacts from SMECO’s proposed 230-kV transmission line between Holland Cliff and Hewitt Road were offset partly by design considerations that utilized an existing 69-kV transmission corridor, reduced the number of poles, and under-grounded the line through the Navy Center at Solomons, Patuxent River and Town Creek community in St. Mary’s County. By routing the line within an existing corridor, landscape change was minimized and some near views of poles were eliminated with the reduction in the number of structures.
Still, PPRP evaluated visual effects because the project would replace existing 65-foot wood poles, with steel poles ranging from 110 to 140 feet. Where additional clearance is needed, poles would be up to 160 feet tall. In addition, a transition station, similar to a small substation, would be constructed in the Navy Center to transition the transmission line from overhead to underground.
PPRP’s visual assessment allowed the State agencies to conclude that the 230-kV steel poles would be more visible than the 69-kV wooden poles because they are taller, but there would be fewer structures. The transition station would be in the existing transmission corridor within the Navy Center with restricted public views. That the existing corridor has been dedicated to utility use and a transmission line has been an enduring part of the landscape in Calvert and St. Mary’s counties was considered a mitigating factor. Even though the transmission corridor passes through two clusters of the Southern Maryland Certified Heritage Area, key heritage resources would not be adversely affected by the project. Nor would the project have an adverse effect of the many existing and proposed greenways, trail systems, driving and bicycle tours in Calvert and St. Mary’s counties or elements associated with the Chesapeake Bay Gateways Network. The project would not have an adverse effect upon the Captain John Smith Chesapeake National Historic Trail or the Star-Spangled Banner National Historic Trail.
Transportation
Electricity generation and transmission differentially impact Maryland’s transportation infrastructure. Transmission line construction is less labor intensive and requires fewer materials inputs than the construction of generation facilities. As a result, transportation issues associated with transmission line construction are usually limited to oversize/over-weight load considerations and temporary road closures during the stringing of overhead conductors or trenching for underground cable installation. While the transportation impacts from transmission line operation are minimal, the input requirements (fuel) of production facilities and their inevitable waste streams can be significant traffic generators.
Vehicle access to transmission line rights-of-way is often via local roads that can be dam-aged by heavy vehicles. Although the SHA requires hauling permits when moving over-size/overweight loads, permits pertain to State maintained roads and bridges only. While several counties issue hauling permits for local roadways, Calvert and St. Mary’s counties, where SMECO’s proposed Holland Cliff to Hewitt Road 230-kV transmission line would be located, do not. Calvert County does require a bond for multi-axle vehicles larger than dump trucks traveling over county roads in the event that the road surface is damaged. To mitigate damage to local roads, the State recommended conditions requiring SMECO to submit travel routing plans to Calvert and St. Mary’s counties public works departments prior to dispatching oversize/overweight vehicles to transmission line staging areas or construction sites.

119
C h a p t e r 3 — i M pa C t S o F p o W e r G e n e r at i o n a n d t r a n S M i S S i o n
LandUse
Land use and land value issues continue to be a major focus of the State's environmental reviews. Maryland’s energy infrastructure overlays economic and programmatic land uses, creating the potential for significant use conflicts. Two transmission line proposals for Maryland largely utilize existing corridors, minimizing direct land impact. This does not imply that indirect land use impacts are necessarily negligible. Construction, expansion or modification of generation or transmission facilities can affect the setting or association of nearby land uses that may be manifested in changes to their resource or economic value. As a result, PPRP’s assessments of land use impacts from the construction and operation of generation and transmission facilities are broadly based, encompassing cultural, aesthetic, resource and economic values of the land.
This requires a complete inventory of land use designations in the area of potential effect, from formal zoning to the many State, local and federal programs that place various protections and restrictions on land use. Protected lands can include agricultural or environmental easements, public lands or even cultural designations that have a distinct locational component. An example of the latter is the Maryland Heritage Areas program that overlays a thematic element upon distinct geographic areas. The Civil War Heritage Area and the Heart of Chesapeake Country CHA, plus the land use components that define them, will be the focus of land use assessments of the proposed PATH and MAPP (Eastern Shore) transmission lines.
The adverse effect of transmission lines on residential property values is an issue that has been increasingly raised in permitting cases in Maryland. Although a considerable amount of research has been done to examine hazardous facilities, very little has been done in associating conventional generating facilities, high voltage transmission lines, and new technologies, such as wind farms, to property values. As a result, residential property value impact estimates have lacked the credibility needed to influence public policy deci-sions related to the siting of energy facilities.
As a consideration in its environmental reviews, PPRP is continuing its focus on property value effects from electric transmission facilities through both on-going reviews of pub-lished literature and sponsored research. Improved statistical methods and continued data mining of MD Property View data is expected to yield additional insight into land value impacts from electric generation and transmission facilities.
3.2.9 CumulativeEffectsThe impacts imposed by transmission line rights-of-way can be distributed over the land-scape and affect many types of terrestrial natural resources. Small impacts to a resource at several locations can add to a significant overall impact, for example on a forest or a watershed. At sensitive locations, too, small impacts to several different resources (e.g., for-est, wetland, and stream) can disrupt the overall integrity of the ecosystem. These additive impacts of the right-of-way are called cumulative effects, and are a serious concern where ecosystems are near a critical threshold or are already degraded. Because the health of an ecosystem depends on functional interactions between its components, cumulative impacts can have a result much greater than a simple tally of the individual impacts would suggest.
Cumulative effects can be assessed in several ways. The effect of multiple stresses on an ecosystem is usually measured in a context that defines a standard for permissible impacts or a goal for restoration. For example, Maryland’s Green Infrastructure network defines areas where natural conditions should be maintained or restored, while the Critical Area Law restricts development in all sensitive habitats around Chesapeake Bay and its tidal

120
M a r y l a n d C u M u l at i v e e n v i r o n M e n ta l i M pa C t r e p o r t — 1 5 t h e d i t i o n
tributaries. Individual resources, on the other hand, are handled in terms of specific impact thresholds or goals. For example, Maryland has set a “no net loss” standard for forests, under the Forest Conservation Act, and for freshwater wetlands, under the Non-Tidal Wetlands Protection Act.
Forest clearing in a right-of-way provides an example of the nature of cumulative effects. The proposed MAPP project will require expanding the cleared width of approximately 30 miles of an existing right-of-way in southern Maryland. Although the additional clearing is only 100 feet, and may not have large local consequences, overall it amounts to over 360 acres of forest. The permanent removal of this much forest is a significant environmental cost of the transmission line right-of-way.
Another transmission line right-of-way in southern Maryland, which was recently evalu-ated in response to a CPCN application to upgrade the capacity of the line, illustrates the multiplicity of impacts that must be considered. The right-of-way crosses in excess of 20 streams, at least 14 acres of Chesapeake Bay Critical Area, requires at least 20 poles in or near wetlands, fragments forest-interior-dwelling species habitat along its entire length, and affects a total of 178.9 acres of Green Infrastructure hubs or corridors. These statistics alone speak to the large and measurable cumulative effects that transmission line rights-of-way can have on some of Maryland’s most critical natural resources.
3.2.10 TransmissionLineDesignConsiderations
VegetationManagementAlternativesforTransmissionLineRights-of-Way
The manner in which a utility manages the vegetation in a transmission line right-of-way often affects nearby vegetation, streams, and wildlife. Guidelines for right-of-way man-agement practices seek to balance electrical reliability, environmental impacts, and visual degradation.
TraditionalManagement
Traditional right-of-way management has historically used a simplistic paradigm of clear-ing all vegetation, reseeding with grasses, mowing frequently, and/or applying herbicides to kill shrubs and tree seedlings that invade the right-of-way. This approach allowed easy access to the transmission line, but was frequently detrimental to natural habitats. A cleared right-of-way through a forest acts as a corridor for invasive species and predators, and reduces the amount of forest interior habitat that is available. Where the right-of-way is part of a grassland environment, mowing can disturb nesting sites for grassland species that depend on tall grass cover during their breeding season. Some herbicides, if used near streams and wetlands, can enter the food chain and have unintended health impacts on wildlife.
GuidelinesoftheWorkingCommitteeonUtilities
Over 40 years ago the Working Committee on Utilities of the President’s Council on Recreation and Natural Beauty prepared an extensive report on “actions required to assure that utility transmission and distribution lines and utility plant sites are compatible with environmental values.” Most of the recommended alternative management practices for minimizing the impact of transmission lines remain valid today. Among the suggested practices that are seldom adopted by transmission line owners are the following:• Right-of-way clearing should be kept to the minimum width necessary to prevent interference
from trees and other vegetation. Selective tree cutting and removal should be used, targeting only trees which could cause damage to the line.
121
C h a p t e r 3 — i M pa C t S o F p o W e r G e n e r at i o n a n d t r a n S M i S S i o n
• The right-of-way edges through forests or timber areas should be curved, undulating boundaries, not straight "walls" that create a "tunnel" effect.
• Small trees and plants should be used to feather the height of the right-of-way vegetation from grass and shrubbery near the center to larger trees at the edges.
NERCRegulations
Improperly maintained vegetation in a transmission line right-of-way can fall on the lines and cause power outages. The North American Electric Reliability Corporation (NERC), operating under the oversight of the Federal Energy Regulatory Commission, develops and enforces reliability standards for transmission lines. The NERC Standard for all transmission lines operated at 200 kV and above requires the transmission owners to have a formal Transmission Vegetation Management Program document (TVMP). The TVMP must identify and document clearances to be maintained between vegetation and overhead conductors, taking into account voltage, line sag under maximum load, and conductor sway caused by wind.
The clearance distances to be achieved by vegetation management work are to be based upon local conditions and the expected time frame in which the transmission owner plans to return for future vegetation management work. The minimum distances that should occur during a management cycle will be those necessary to prevent flashover between vegetation and conductors and will vary due to such factors as altitude and operating voltage. The transmission owner’s TVMP should clearly specify these distances for differ-ent portions of the line, and must include a schedule of inspections based on anticipated growth of vegetation and other factors.
To implement the TVMP, the transmission owner is required to develop a written plan describing the annual location-specific vegetation management that will be carried out to ensure reliability.
CurrentPracticeinMaryland
The NERC regulations can be met by the traditional approach, but they do not require it. The alternatives suggested in the Guidelines of the Working Committee on Utilities, and other advanced techniques, can be implemented as long as the required clearances are maintained. In general, for many locations, most Maryland utilities use uniform, system-wide practices that may exceed NERC requirements.
StateConditionsforApproval
Most Maryland utilities indicate that they now use a combination of selective herbicide application and mechanical cutting rather than exclusively one or the other. To encour-age the implementation of environmentally friendly maintenance in rights-of-way, PPRP has, through its membership in the MERTT Council (see page 108), compiled information on innovative practices that reduce adverse effects on local wildlife and plant communi-ties, such as reduced mowing frequencies. Several of Maryland’s utilities have adopted maintenance programs to improve wildlife habitats in rights-of-way in limited areas. The introduction of desirable species into the right-of-way through “right tree/right place” plantings or wildlife habitat enhancement projects is often possible. Where implemented, such programs have created better, more stable habitats for wildlife, and have actually saved thousands of dollars in annual maintenance costs.
Some research indicates that planting “connecting corridors” in the right-of-way between otherwise separated forest patches could be beneficial as travel corridors for many forest species. Such corridors could consist of native low-growing trees and shrubs that do not grow tall enough to present a danger to the overhead transmission lines. The State agen-

122
M a r y l a n d C u M u l at i v e e n v i r o n M e n ta l i M pa C t r e p o r t — 1 5 t h e d i t i o n
cies encourage utilities to identify opportunities to create such cross-right-of-way connec-tions, particularly in areas where the right-of-way fragments habitat used by forest interior dwelling species or crosses riparian areas and wetlands. PPRP continues to research the benefits of innovative best management practices for power line rights-of-way vegetation management.
UndergroundTransmissionOptions
Underground transmission lines have both advantages and disadvantages. The most obvi-ous advantages are reduced visual impacts and required right-of-way widths. Sometimes these improvements also coincide with reduced environmental impacts, but in sensitive areas burying a transmission cable can be more disruptive than an overhead line.
Underground transmission lines are generally placed four to five feet underground, in pipes, ducts, or buried directly in the earth (as shown in Figure 3-25). Instead of the wide spacing between conductors that is required for overhead lines, the cables are placed closer together and insulated to protect the wires from each other and to dissipate heat. Typi-cally, individual cables are placed in conduits (made of polyethylene, PVC, or fiberglass), and then circuit groups of three cables are set in concrete duct banks several feet wide or buried side-by-side in specially prepared soil. Modern underground cables do not require the pressurized liquid or gas insulating and cooling systems predominant in older cable types, and thus, have far fewer environmental disadvantages. Underground transmission lines also require periodic above-ground supportive substations, depending on the type, capacity, and length of the line.
Underground cables are manufactured in finite lengths that need to be spliced together, generally every 900 to 2,000 feet. Splices may be placed in either permanent concrete vaults or temporary vaults that are filled in after construction. At the ends of underground lines, the conductors are connected to above ground lines by means of risers — structures that are similar to above-ground transmission line poles, however, are somewhat bulkier.
Because underground duct banks contain the transmission cables in close proximity, the right-of-way can be narrower than comparable above-ground lines. This can be a major advantage of underground lines in crowded or sensitive areas. Although highly dependent on the situation, for short distances, right-of-way widths of approximately 20 feet are possible, whereas in open country a 30- to 50-foot width is preferred. Most of this width is to permit access for construction and maintenance equipment, since the duct bank itself is usually less than 10 feet wide. The area over the duct banks also has to be secure from disturbances that could expose or contact the cable, and tree roots and other belowground vegetation must be managed aggressively to avoid interference with the cables and to restrict the removal of soil water, which helps cool the cables.
Removing the heat generated during the operation of an underground line is a major design consideration. During normal operation, the core of a modern cable is nearly as hot as boiling water, and potentially hotter than that during emergency (overload) conditions. The excess heat is dispersed into the soil around the cable, resulting in potential impacts to soil flora and fauna. Soil will conduct this heat energy away from the cable best when it is saturated with water and not allowed to dry out — conditions which are particularly easy to achieve below rivers and streams or other areas near or below the water table.
Construction of underground transmission lines by trenching and then backfilling may dis-turb the entire length of the right-of-way (see Figure 3-25). This can be a disadvantage in environmentally sensitive areas, such as wetlands, compared to the limited areas affected by overhead tower construction, which can often span sensitive areas. An alternative to avoid disturbance to surface features such as rivers, roads, or cultural features is using

123
C h a p t e r 3 — i M pa C t S o F p o W e r G e n e r at i o n a n d t r a n S M i S S i o n
horizontal directional drilling, in which the boreholes for the duct banks are drilled underground from a well-defined entrance point. A large staging area may be needed around the entrance point, however. The construction method that is used depends on several factors, including the thermal properties of the soil and the presence of sensitive areas. The cost of the construction will depend on the techniques and materials used, and typically varies from slightly more expensive to several times as expensive as overhead installations. Each installation must be evaluated on a site-specific basis to determine actual cost.
Underground lines can be a reasonable alternative where overhead lines are difficult to place or would create aesthetic or environmental issues. They may be able to be placed along (or under) existing road or other rights-of-way, reducing the amount of new land disturbance required. However, underground obstacles such as other utilities or sanitary and storm sewers can greatly increase the construction costs or create the potential for adverse environmental effects, which need to be considered.
Other negative aspects of underground transmission include much longer cable repair times if they are damaged, although they are generally longer lasting and more secure. Underground transmission lines are protected from many natural or accidental events that can take overhead lines out of service. However, this increased reliability is typically offset by a longer repair period. While overhead lines can generally be fixed quickly — often within hours — damaged underground cables have to be pulled up and replaced with new cable segments, which may take several days. The long-term maintenance and repair of under-ground cables can also be more environmentally disruptive than overhead lines.
Electric fields are not an issue with underground transmission because soil attenuates the fields quickly. Underground lines also produce lower magnetic fields because the lines are closely spaced, allowing cancellation of the fields.
Newer underground techniques make burial of transmission lines a viable alternative in many areas. It may be reasonable to install a portion of a line underground to avoid specific impacts. However, every project and location has a specific combination of factors that must be considered to determine whether an under-ground line is suitable or possible.
Figure 3-25 Modern Underground Transmission Line Installation
Source: ABB, 2008

124
M a r y l a n d C u M u l at i v e e n v i r o n M e n ta l i M pa C t r e p o r t — 1 5 t h e d i t i o n
(ThisPageIntentionallyLeftBlank)