Chapter 3: Electricity Demand Forecast · regional electricity demand, while new industries, such...
22
Sixth Northwest Conservation and Electric Power Plan Chapter 3: Electricity Demand Forecast Summary of Key Findings .............................................................................................................. 1 Introduction ..................................................................................................................................... 2 Historic Demand Growth ............................................................................................................ 2 Sixth Power Plan Demand Forecast ................................................................................................ 4 Demand Forecast Range ............................................................................................................. 4 Sectoral Demand ......................................................................................................................... 5 Load Forecast and Peak Load ......................................................................................................... 6 Peak Load.................................................................................................................................... 6 Load Forecast Range................................................................................................................... 7 Alternative Load Forecast Concepts ........................................................................................... 8 Portfolio Model Analysis of Non-DSI Load............................................................................. 10 Impact on Revenue Requirement .............................................................................................. 11 Demand From Plug-in Hybrid Electric Vehicles (PHEV) ........................................................ 12 Opportunities and Challenges ............................................................................................... 14 Environmental Impacts ......................................................................................................... 15 Assessment of Needs - Utility Perspective ................................................................................... 16 Annual Needs ............................................................................................................................ 16 Hourly Needs ............................................................................................................................ 18 Annual Load Forecast Tables ....................................................................................................... 21 SUMMARY OF KEY FINDINGS The Pacific Northwest consumed 19,000 average megawatts or 166 million megawatt-hours of electricity in 2007. That demand is expected to grow to 25,000 average megawatts by 2030 in the Council’s medium forecast. Between 2009 and 2030, load is expected to increase by a total of 7,000 average megawatts, growing on average by about 335 average megawatts, or 1.4 percent, per year. 1 This forecast has been influenced by expected higher electricity prices that reflect a rapid rise in fuel prices and emerging carbon-emission penalties. For example, residential consumer retail electricity prices are expected to increase by 1.0 percent per year in addition to general inflation. If achieved, cost-effective efficiency improvements identified in the Sixth Power Plan will help to meet a substantial portion of this projected demand growth. The electricity demand increase is driven primarily by significant growth in two areas: home electronics and elder-care facilities. Demand for home electronics--a new component to the Council’s residential sector--is expected to double in the next 20 years. In the commercial sector, the elder-care segment is increasing as the population ages. While the industrial sector is growing at a relatively slow pace, custom data centers (Google, etc.) are a relatively new end-use that has been seeing significant growth as well. The Northwest has always been a winter-peaking power system. However, due to growing summer load, mostly because of the increased use of air conditioning, the difference between winter- and summer-peak load is expected to shrink over time. Assuming normal weather conditions, winter-peak demand in the Sixth Power Plan is projected to grow from about 34,000 megawatts in 2010 to around 43,000 megawatts by 2030, an average annual growth rate of 1 percent. Summer-peak demand is forecast to grow from 29,000 megawatts in 2010 to 40,000 1 Demand for electricity, measured at consumer location, is projected to grow by about 6,000 average megawatts, growing on average by about 300 megawatts or 1.4 percent per year.
Transcript of Chapter 3: Electricity Demand Forecast · regional electricity demand, while new industries, such...
Sixth Northwest Conservation and Electric Power Plan
Chapter 3: Electricity Demand Forecast Summary of Key Findings .............................................................................................................. 1 Introduction..................................................................................................................................... 2
Historic Demand Growth............................................................................................................ 2 Sixth Power Plan Demand Forecast................................................................................................ 4
Demand Forecast Range ............................................................................................................. 4 Sectoral Demand......................................................................................................................... 5
Load Forecast and Peak Load ......................................................................................................... 6 Peak Load.................................................................................................................................... 6 Load Forecast Range................................................................................................................... 7 Alternative Load Forecast Concepts........................................................................................... 8 Portfolio Model Analysis of Non-DSI Load............................................................................. 10 Impact on Revenue Requirement.............................................................................................. 11 Demand From Plug-in Hybrid Electric Vehicles (PHEV)........................................................ 12
Opportunities and Challenges ............................................................................................... 14 Environmental Impacts ......................................................................................................... 15
Assessment of Needs - Utility Perspective ................................................................................... 16 Annual Needs............................................................................................................................ 16 Hourly Needs ............................................................................................................................ 18
Annual Load Forecast Tables ....................................................................................................... 21 SUMMARY OF KEY FINDINGS
The Pacific Northwest consumed 19,000 average megawatts or 166 million megawatt-hours of electricity in 2007. That demand is expected to grow to 25,000 average megawatts by 2030 in the Council’s medium forecast. Between 2009 and 2030, load is expected to increase by a total of 7,000 average megawatts, growing on average by about 335 average megawatts, or 1.4 percent, per year.1 This forecast has been influenced by expected higher electricity prices that reflect a rapid rise in fuel prices and emerging carbon-emission penalties. For example, residential consumer retail electricity prices are expected to increase by 1.0 percent per year in addition to general inflation. If achieved, cost-effective efficiency improvements identified in the Sixth Power Plan will help to meet a substantial portion of this projected demand growth.
The electricity demand increase is driven primarily by significant growth in two areas: home electronics and elder-care facilities. Demand for home electronics--a new component to the Council’s residential sector--is expected to double in the next 20 years. In the commercial sector, the elder-care segment is increasing as the population ages. While the industrial sector is growing at a relatively slow pace, custom data centers (Google, etc.) are a relatively new end-use that has been seeing significant growth as well.
The Northwest has always been a winter-peaking power system. However, due to growing summer load, mostly because of the increased use of air conditioning, the difference between winter- and summer-peak load is expected to shrink over time. Assuming normal weather conditions, winter-peak demand in the Sixth Power Plan is projected to grow from about 34,000 megawatts in 2010 to around 43,000 megawatts by 2030, an average annual growth rate of 1 percent. Summer-peak demand is forecast to grow from 29,000 megawatts in 2010 to 40,000
1 Demand for electricity, measured at consumer location, is projected to grow by about 6,000 average megawatts, growing on average by about 300 megawatts or 1.4 percent per year.

Chapter 3: Electricity Demand Forecast Sixth Power Plan
3-2
megawatts by 2030, an annual growth rate of 1.7 percent. By the end of the planning period, the gap between summer-peak load and winter-peak load has narrowed.
The projected growth of demand is comparable to the actual growth rate experienced during the 1990s. When new cost-effective conservation is subtracted, the need for additional generation will be quite small compared to past experience. However, summer supply needs will likely increase as summer-peak demand continues to grow. In addition, the growing share of variable wind generation may change the types of generation needed to meet demand. There is likely to be an increased need for resources that can provide reliable capacity to meet high load conditions and that can operate flexibly to accommodate variable, but non-CO2 emitting, wind energy.
INTRODUCTION
The 2001 energy crisis in the West refocused the region on long-term demand forecasting. There has been a renewed interest and concern about generating capacity and flexibility as well. To deal with these issues, the Council replaced its end-use forecasting models with a new end-use forecasting and policy analysis tool and, working with Bonneville, adapted it to the regional power system and the Council’s planning requirements. The new demand forecasting system is based on the Energy 2020 model and generates forecasts for electricity, natural gas, and other fuel.
The Energy 2020 model is an integrated end-use forecasting model. The Council will use the demand module of Energy 2020 to forecast annual energy and peak loads for electricity as well as other fuels. The model has been used extensively by several utilities, and within the region the Bonneville Power Administration uses a version of it.
Three electricity demand forecasts were developed in the Sixth Power Plan. Each scenario corresponds to an underlying set of economic drivers, discussed in Chapter 2 and Appendix B. The high and low ranges of the load forecasts are not explicitly used in the development of the Power Plan, but rather are used as loose guidelines for the regional portfolio model when creating the 750 alternative load forecasts. These demand scenarios reflect an estimate of the impact of the current recession.
Historic Demand Growth
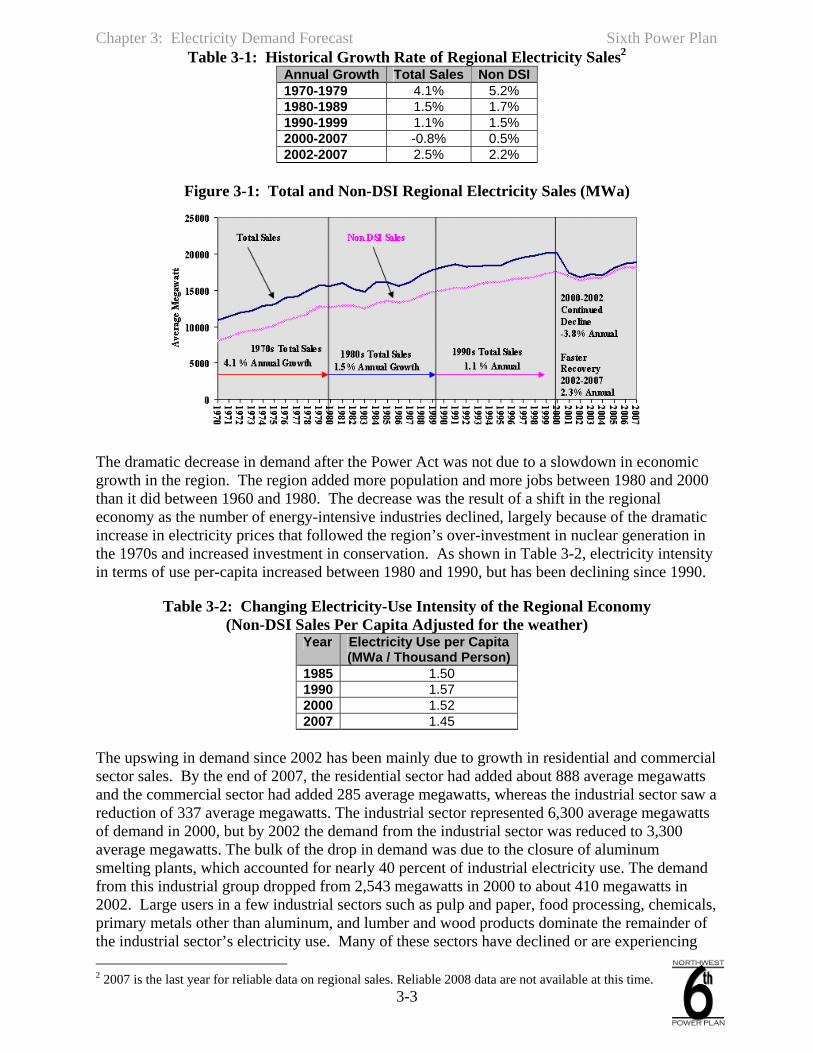
It has been 26 years since the Council’s first Power Plan in 1983. In the decade prior to the Northwest Power Act, regional demand was growing at 4.1 percent per year and the non-direct-service industry (DSI) load was growing at an annual rate of 5.2 percent. Back in 1970, regional demand was about 11,000 average megawatts. In the decade between 1970 and 1980, it grew by about 4,700 average megawatts. During the 1980s, demand growth slowed significantly, falling to about 1.5 percent per year and load increased by about 2,300 average megawatts. In the 1990s, another 2,000 average megawatts were added to regional demand, making growth in the last decade of the 20th century only about 1.1 percent per year. The energy crisis of 2000-2001 increased electricity prices dramatically. As a result, regional demand decreased by 3,700 average megawatts between 2000 and 2001, and eliminated much of the growth since 1980. The bulk of this decline was in the region’s aluminum industry and other energy-intensive industries. Since 2002, however, regional demand has begun to recover, growing at an annual rate of 2.5 percent. This growth has been driven by increases in commercial and residential sector demand. Nevertheless, demand remains well below levels of the late 1990s. Table 3-1 and Figure 3-1 illustrate regional electricity demand from 1970-2007.
Chapter 3: Electricity Demand Forecast Sixth Power Plan
3-3
Table 3-1: Historical Growth Rate of Regional Electricity Sales2 Annual Growth Total Sales Non DSI1970-1979 4.1% 5.2% 1980-1989 1.5% 1.7% 1990-1999 1.1% 1.5% 2000-2007 -0.8% 0.5% 2002-2007 2.5% 2.2%
Figure 3-1: Total and Non-DSI Regional Electricity Sales (MWa)
The dramatic decrease in demand after the Power Act was not due to a slowdown in economic growth in the region. The region added more population and more jobs between 1980 and 2000 than it did between 1960 and 1980. The decrease was the result of a shift in the regional economy as the number of energy-intensive industries declined, largely because of the dramatic increase in electricity prices that followed the region’s over-investment in nuclear generation in the 1970s and increased investment in conservation. As shown in Table 3-2, electricity intensity in terms of use per-capita increased between 1980 and 1990, but has been declining since 1990.
Table 3-2: Changing Electricity-Use Intensity of the Regional Economy (Non-DSI Sales Per Capita Adjusted for the weather)
Year Electricity Use per Capita (MWa / Thousand Person)
1985 1.50 1990 1.57 2000 1.52 2007 1.45
The upswing in demand since 2002 has been mainly due to growth in residential and commercial sector sales. By the end of 2007, the residential sector had added about 888 average megawatts and the commercial sector had added 285 average megawatts, whereas the industrial sector saw a reduction of 337 average megawatts. The industrial sector represented 6,300 average megawatts of demand in 2000, but by 2002 the demand from the industrial sector was reduced to 3,300 average megawatts. The bulk of the drop in demand was due to the closure of aluminum smelting plants, which accounted for nearly 40 percent of industrial electricity use. The demand from this industrial group dropped from 2,543 megawatts in 2000 to about 410 megawatts in 2002. Large users in a few industrial sectors such as pulp and paper, food processing, chemicals, primary metals other than aluminum, and lumber and wood products dominate the remainder of the industrial sector’s electricity use. Many of these sectors have declined or are experiencing 2 2007 is the last year for reliable data on regional sales. Reliable 2008 data are not available at this time.
Chapter 3: Electricity Demand Forecast Sixth Power Plan
3-4
slow growth. These traditional, resource-based industries are becoming less important to regional electricity demand, while new industries, such as semiconductor manufacturing, are growing faster.
SIXTH POWER PLAN DEMAND FORECAST
Demand is forecast to grow from about 19,000 average megawatts in 2007 to 25,000 average megawatts by 2030 in the medium-case forecast. The average annual rate of growth in this forecast is about 1.2 percent. This level of growth does not take into account reductions in energy from new conservation resources. To the extent conservation is used to meet demand growth, the forecast will decrease.
Assuming normal weather conditions, the winter-peak load for power is projected to grow from about 34,000 megawatts in 2010 to around 43,000 megawatts by 2030 at an average annual growth rate of 1 percent. Summer-peak load is projected to grow from 29,000 megawatts in 2010 to 40,000 megawatts by 2030, an annual growth rate of 1.6 percent.
The medium-case forecast means that the region’s electricity needs would grow by about 6,000 average megawatts by 2030, absent any conservation, an average annual increase of 267 average megawatts. Most of the growth is from increased electricity use by the residential and commercial sectors, with slower growth in the industrial sector, especially for energy-intensive industries. Higher electricity and natural gas prices have fundamentally shifted the energy intensity of industries in the region. As a result of the 2000-01 energy crisis and the mild recession of 2002, the region lost about 3,500 average megawatts of industrial demand, which it has not regained. The region is projected to surpass the 2000 level of demand by 2013. However, the depth of the 2008-09 recession may prolong this recovery.
Demand Forecast Range
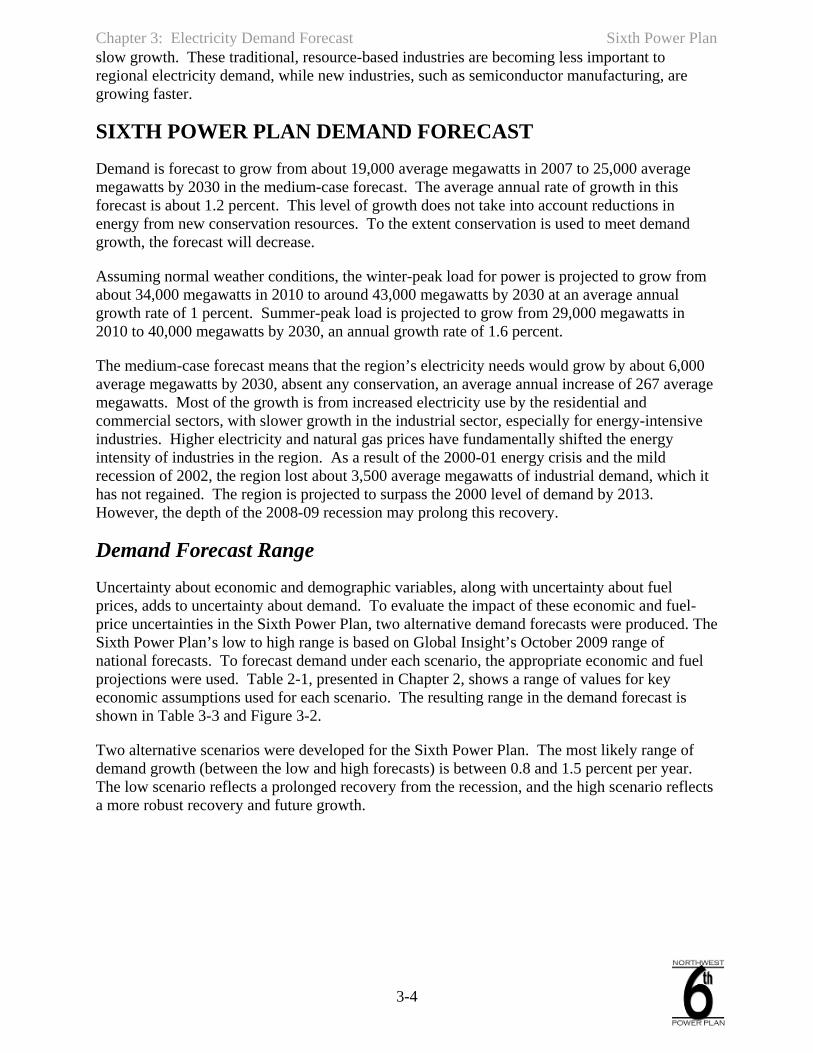
Uncertainty about economic and demographic variables, along with uncertainty about fuel prices, adds to uncertainty about demand. To evaluate the impact of these economic and fuel-price uncertainties in the Sixth Power Plan, two alternative demand forecasts were produced. The Sixth Power Plan’s low to high range is based on Global Insight’s October 2009 range of national forecasts. To forecast demand under each scenario, the appropriate economic and fuel projections were used. Table 2-1, presented in Chapter 2, shows a range of values for key economic assumptions used for each scenario. The resulting range in the demand forecast is shown in Table 3-3 and Figure 3-2.
Two alternative scenarios were developed for the Sixth Power Plan. The most likely range of demand growth (between the low and high forecasts) is between 0.8 and 1.5 percent per year. The low scenario reflects a prolonged recovery from the recession, and the high scenario reflects a more robust recovery and future growth.
Chapter 3: Electricity Demand Forecast Sixth Power Plan
3-5
Table 3-3: Sixth Northwest Power Plan Electricity Demand Forecast Range (MWa)3
Actual 2007 2010 2020 2030
Growth Rate
2010-2020
Growth Rate 2020-2030
Growth Rate
2010-2030 Low 19,140 18,860 20,463 22,010 0.8% 0.7% 0.8% Medium 19,140 19,292 21,820 25,275 1.2% 1.5% 1.4% High 19,140 19,591 22,651 27,761 1.5% 2.1% 1.8%
Figure 3-2: Historical Sixth Northwest Power Plan Sales Forecast (MWa)
-
5,000
10,000
15,000
20,000
25,000
30,000
1986
1988
1990
1992
1994
1996
1998
2000
2002
2004
2006
2008
2010
2012
2014
2016
2018
2020
2022
2024
2026
2028
2030
MW
A
Price-Effect High Case Low Case
1985-2007 Actual 2008-2030 Forecast with Normal Weather
Sectoral Demand
The Sixth Power Plan forecasts demand to grow at an average annual rate of 1.4 percent in the 2010 through 2030 period. The residential sector is expected to grow at 1.4 percent per year, which, on average, translates to about 125 megawatts each year. Increased growth in the residential sector reflects a substantial increase in demand for home electronics, categorized as information, communication, and entertainment (ICE) and the increased use of air conditioning.
Table 3-4 shows the actual 2007 demand for electricity and the forecast for selected years, as well as the corresponding annual growth rates. These demand forecasts do not include any new conservation initiatives.
3 Sales figures are electricity use by consumers and exclude transmission and distribution losses.
Chapter 3: Electricity Demand Forecast Sixth Power Plan
3-6
Table 3-4: Medium-Case Sector Forecast of Annual Energy Demand (MWa)
Actual 2007 2010 2020 2030
Growth Rate
2010-2020
Growth Rate
2020-2030
Growth Rate
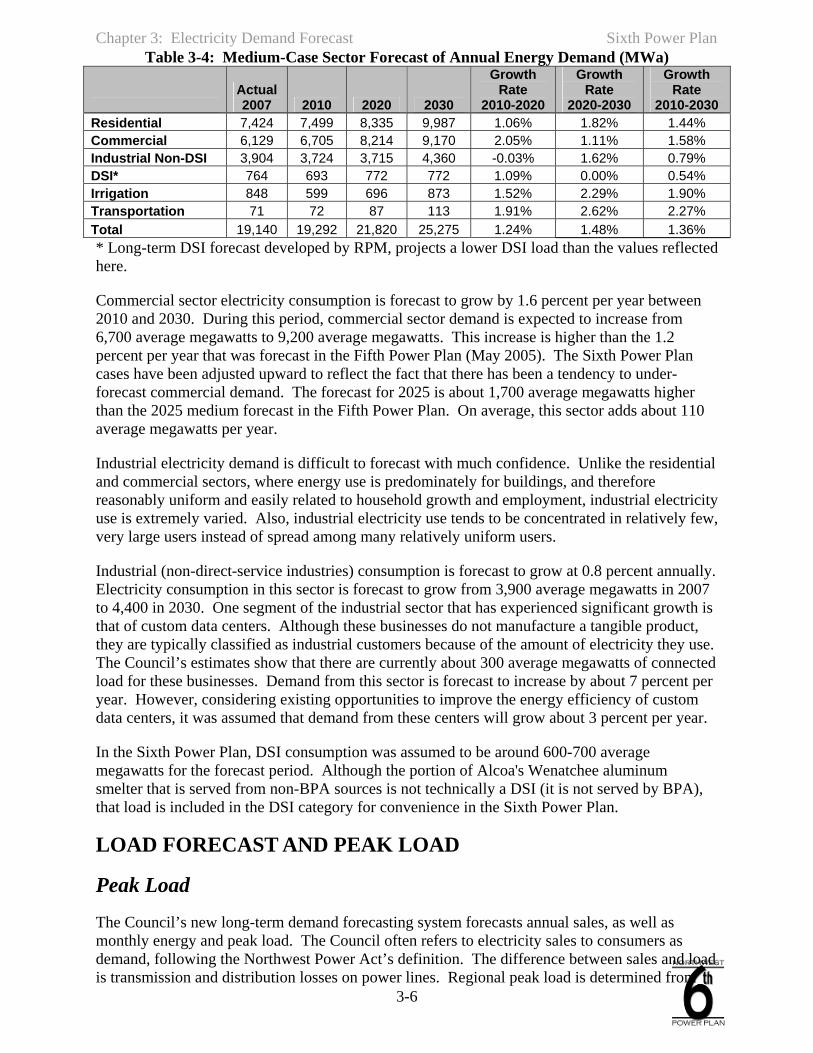
2010-2030 Residential 7,424 7,499 8,335 9,987 1.06% 1.82% 1.44% Commercial 6,129 6,705 8,214 9,170 2.05% 1.11% 1.58% Industrial Non-DSI 3,904 3,724 3,715 4,360 -0.03% 1.62% 0.79% DSI* 764 693 772 772 1.09% 0.00% 0.54% Irrigation 848 599 696 873 1.52% 2.29% 1.90% Transportation 71 72 87 113 1.91% 2.62% 2.27% Total 19,140 19,292 21,820 25,275 1.24% 1.48% 1.36% * Long-term DSI forecast developed by RPM, projects a lower DSI load than the values reflected here.
Commercial sector electricity consumption is forecast to grow by 1.6 percent per year between 2010 and 2030. During this period, commercial sector demand is expected to increase from 6,700 average megawatts to 9,200 average megawatts. This increase is higher than the 1.2 percent per year that was forecast in the Fifth Power Plan (May 2005). The Sixth Power Plan cases have been adjusted upward to reflect the fact that there has been a tendency to under-forecast commercial demand. The forecast for 2025 is about 1,700 average megawatts higher than the 2025 medium forecast in the Fifth Power Plan. On average, this sector adds about 110 average megawatts per year.
Industrial electricity demand is difficult to forecast with much confidence. Unlike the residential and commercial sectors, where energy use is predominately for buildings, and therefore reasonably uniform and easily related to household growth and employment, industrial electricity use is extremely varied. Also, industrial electricity use tends to be concentrated in relatively few, very large users instead of spread among many relatively uniform users.
Industrial (non-direct-service industries) consumption is forecast to grow at 0.8 percent annually. Electricity consumption in this sector is forecast to grow from 3,900 average megawatts in 2007 to 4,400 in 2030. One segment of the industrial sector that has experienced significant growth is that of custom data centers. Although these businesses do not manufacture a tangible product, they are typically classified as industrial customers because of the amount of electricity they use. The Council’s estimates show that there are currently about 300 average megawatts of connected load for these businesses. Demand from this sector is forecast to increase by about 7 percent per year. However, considering existing opportunities to improve the energy efficiency of custom data centers, it was assumed that demand from these centers will grow about 3 percent per year.
In the Sixth Power Plan, DSI consumption was assumed to be around 600-700 average megawatts for the forecast period. Although the portion of Alcoa's Wenatchee aluminum smelter that is served from non-BPA sources is not technically a DSI (it is not served by BPA), that load is included in the DSI category for convenience in the Sixth Power Plan.
LOAD FORECAST AND PEAK LOAD
Peak Load
The Council’s new long-term demand forecasting system forecasts annual sales, as well as monthly energy and peak load. The Council often refers to electricity sales to consumers as demand, following the Northwest Power Act’s definition. The difference between sales and load is transmission and distribution losses on power lines. Regional peak load is determined from
Chapter 3: Electricity Demand Forecast Sixth Power Plan
3-7
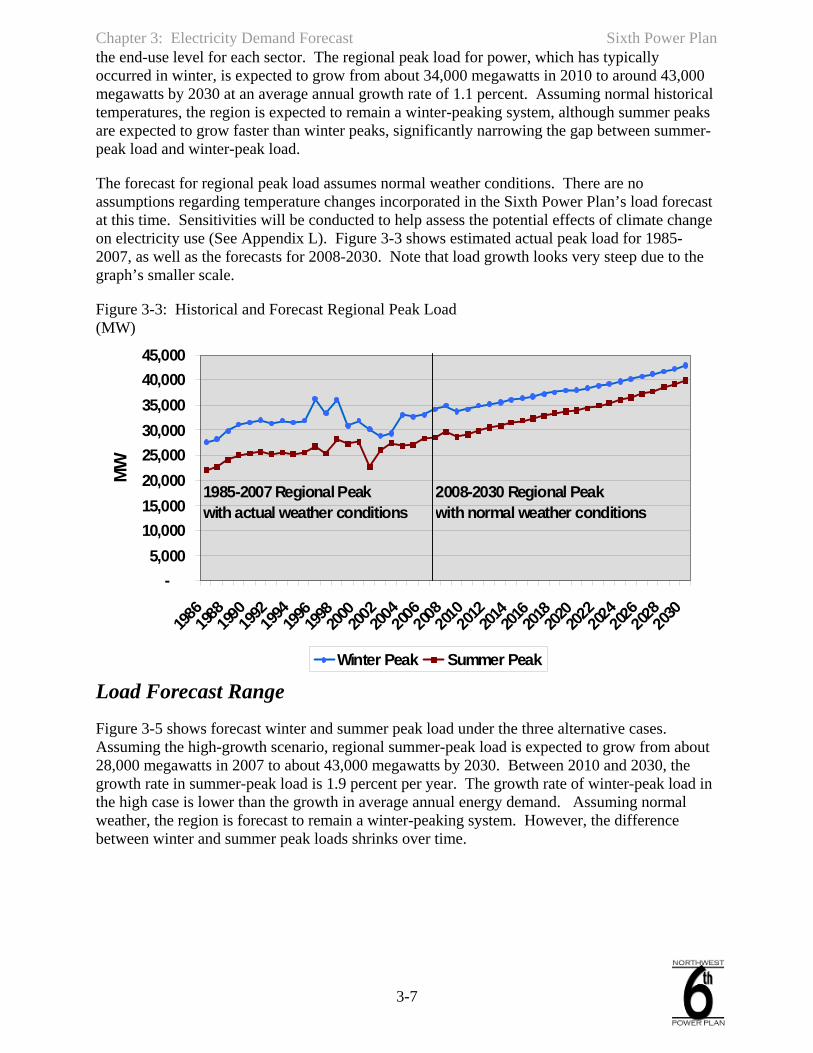
the end-use level for each sector. The regional peak load for power, which has typically occurred in winter, is expected to grow from about 34,000 megawatts in 2010 to around 43,000 megawatts by 2030 at an average annual growth rate of 1.1 percent. Assuming normal historical temperatures, the region is expected to remain a winter-peaking system, although summer peaks are expected to grow faster than winter peaks, significantly narrowing the gap between summer-peak load and winter-peak load.
The forecast for regional peak load assumes normal weather conditions. There are no assumptions regarding temperature changes incorporated in the Sixth Power Plan’s load forecast at this time. Sensitivities will be conducted to help assess the potential effects of climate change on electricity use (See Appendix L). Figure 3-3 shows estimated actual peak load for 1985-2007, as well as the forecasts for 2008-2030. Note that load growth looks very steep due to the graph’s smaller scale.
Figure 3-3: Historical and Forecast Regional Peak Load (MW)
-5,000
10,00015,00020,00025,00030,00035,00040,00045,000
1986198
8199
019
9219
94199
6199
8200
0200
2200
4200
6200
8201
020
12201
4201
6201
8202
0202
2202
4202
6202
820
30
MW
Winter Peak Summer Peak
1985-2007 Regional Peak with actual weather conditions
2008-2030 Regional Peakwith normal weather conditions
Load Forecast Range
Figure 3-5 shows forecast winter and summer peak load under the three alternative cases. Assuming the high-growth scenario, regional summer-peak load is expected to grow from about 28,000 megawatts in 2007 to about 43,000 megawatts by 2030. Between 2010 and 2030, the growth rate in summer-peak load is 1.9 percent per year. The growth rate of winter-peak load in the high case is lower than the growth in average annual energy demand. Assuming normal weather, the region is forecast to remain a winter-peaking system. However, the difference between winter and summer peak loads shrinks over time.
Chapter 3: Electricity Demand Forecast Sixth Power Plan
3-8
Table 3-5: Total Summer and Winter Peak Load Forecast Range (MW)
Actual 2007 2010 2020 2030
Growth Rate
2010-2020
Growth Rate
2020-2030
Growth Rate
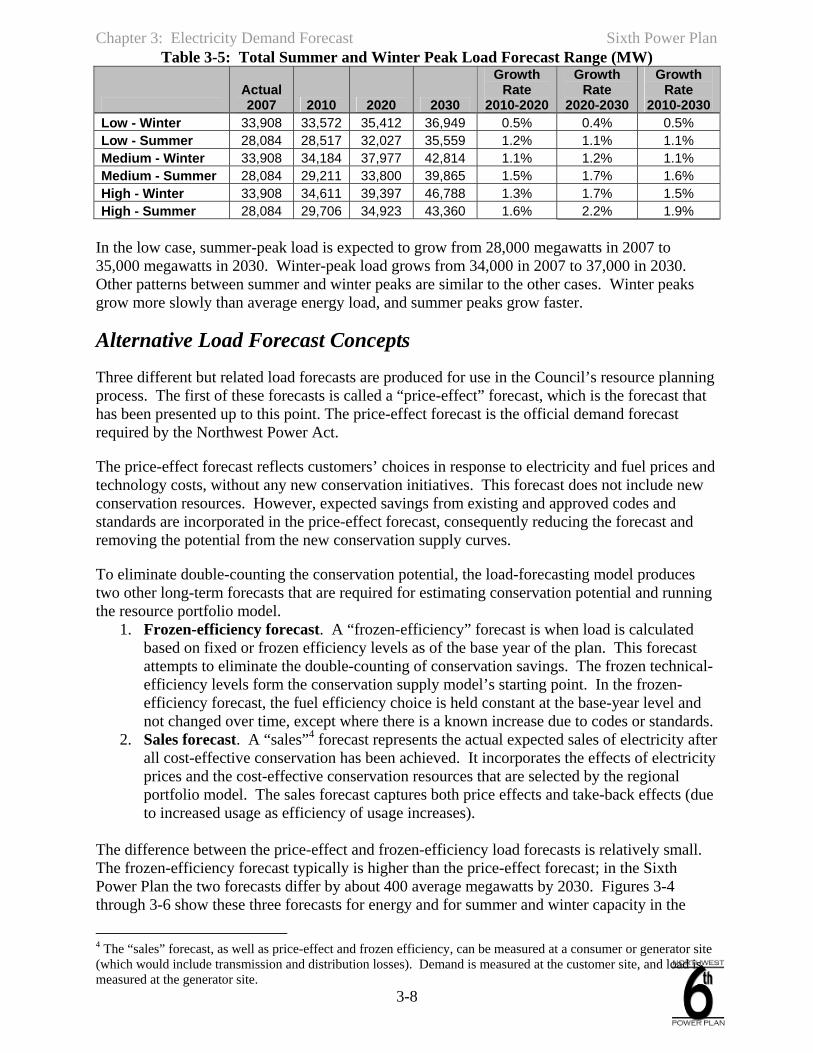
2010-2030 Low - Winter 33,908 33,572 35,412 36,949 0.5% 0.4% 0.5% Low - Summer 28,084 28,517 32,027 35,559 1.2% 1.1% 1.1% Medium - Winter 33,908 34,184 37,977 42,814 1.1% 1.2% 1.1% Medium - Summer 28,084 29,211 33,800 39,865 1.5% 1.7% 1.6% High - Winter 33,908 34,611 39,397 46,788 1.3% 1.7% 1.5% High - Summer 28,084 29,706 34,923 43,360 1.6% 2.2% 1.9%
In the low case, summer-peak load is expected to grow from 28,000 megawatts in 2007 to 35,000 megawatts in 2030. Winter-peak load grows from 34,000 in 2007 to 37,000 in 2030. Other patterns between summer and winter peaks are similar to the other cases. Winter peaks grow more slowly than average energy load, and summer peaks grow faster.
Alternative Load Forecast Concepts
Three different but related load forecasts are produced for use in the Council’s resource planning process. The first of these forecasts is called a “price-effect” forecast, which is the forecast that has been presented up to this point. The price-effect forecast is the official demand forecast required by the Northwest Power Act.
The price-effect forecast reflects customers’ choices in response to electricity and fuel prices and technology costs, without any new conservation initiatives. This forecast does not include new conservation resources. However, expected savings from existing and approved codes and standards are incorporated in the price-effect forecast, consequently reducing the forecast and removing the potential from the new conservation supply curves.
To eliminate double-counting the conservation potential, the load-forecasting model produces two other long-term forecasts that are required for estimating conservation potential and running the resource portfolio model.
1. Frozen-efficiency forecast. A “frozen-efficiency” forecast is when load is calculated based on fixed or frozen efficiency levels as of the base year of the plan. This forecast attempts to eliminate the double-counting of conservation savings. The frozen technical-efficiency levels form the conservation supply model’s starting point. In the frozen-efficiency forecast, the fuel efficiency choice is held constant at the base-year level and not changed over time, except where there is a known increase due to codes or standards.
2. Sales forecast. A “sales”4 forecast represents the actual expected sales of electricity after all cost-effective conservation has been achieved. It incorporates the effects of electricity prices and the cost-effective conservation resources that are selected by the regional portfolio model. The sales forecast captures both price effects and take-back effects (due to increased usage as efficiency of usage increases).
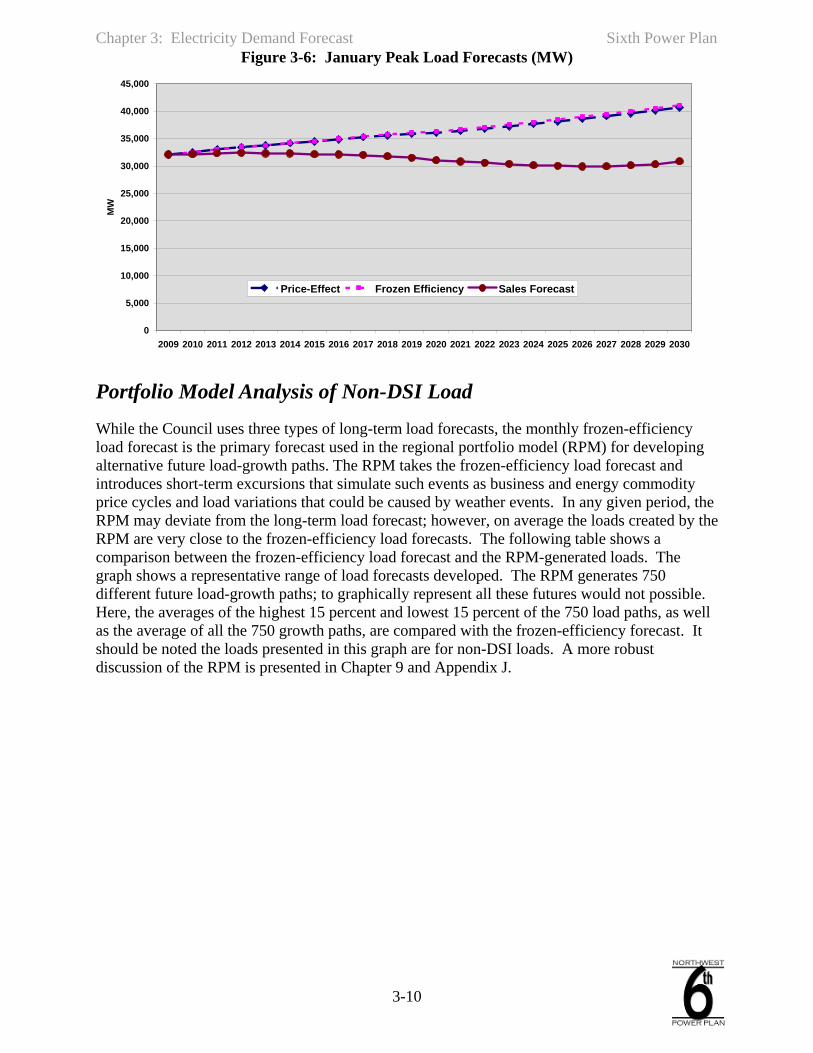
The difference between the price-effect and frozen-efficiency load forecasts is relatively small. The frozen-efficiency forecast typically is higher than the price-effect forecast; in the Sixth Power Plan the two forecasts differ by about 400 average megawatts by 2030. Figures 3-4 through 3-6 show these three forecasts for energy and for summer and winter capacity in the
4 The “sales” forecast, as well as price-effect and frozen efficiency, can be measured at a consumer or generator site (which would include transmission and distribution losses). Demand is measured at the customer site, and load is measured at the generator site.

Chapter 3: Electricity Demand Forecast Sixth Power Plan
3-9
Sixth Power Plan. Conservation resource program savings incorporated5 in the sales forecast reduce 2030 average annual load by about 5,900 megawatts and reduces summer peak load by about 6,000 megawatts, or roughly by 15 percent. Winter peak loads are reduced by about 11,000 megawatts or about 24 percent.
Figure 3-4: Average Annual Load Forecasts (MWa)
-
5,000
10,000
15,000
20,000
25,000
30,000
35,000
2009
2010
2011
2012
2013
2014
2015
2016
2017
2018
2019
2020
2021
2022
2023
2024
2025
2026
2027
2028
2029
2030
MW
a
Price-Effect Frozen-Efficiency Sales Forecast
Figure 3-5: July Peak Load Forecasts (MW)
0
5,000
10,000
15,000
20,000
25,000
30,000
35,000
40,000
45,000
2009
2010
2011
2012
2013
2014
2015
2016
2017
2018
2019
2020
2021
2022
2023
2024
2025
2026
2027
2028
2029
2030
MW
Price-Effect Frozen Efficiency Sales Forecast
5 Anticipated annual impacts of conservation programs, by sector and end-use, are netted out of the frozen-efficiency loads for that year, sector, and end-use.
Chapter 3: Electricity Demand Forecast Sixth Power Plan
3-10
Figure 3-6: January Peak Load Forecasts (MW)
0
5,000
10,000
15,000
20,000
25,000
30,000
35,000
40,000
45,000
2009 2010 2011 2012 2013 2014 2015 2016 2017 2018 2019 2020 2021 2022 2023 2024 2025 2026 2027 2028 2029 2030
MW
Price-Effect Frozen Efficiency Sales Forecast
Portfolio Model Analysis of Non-DSI Load
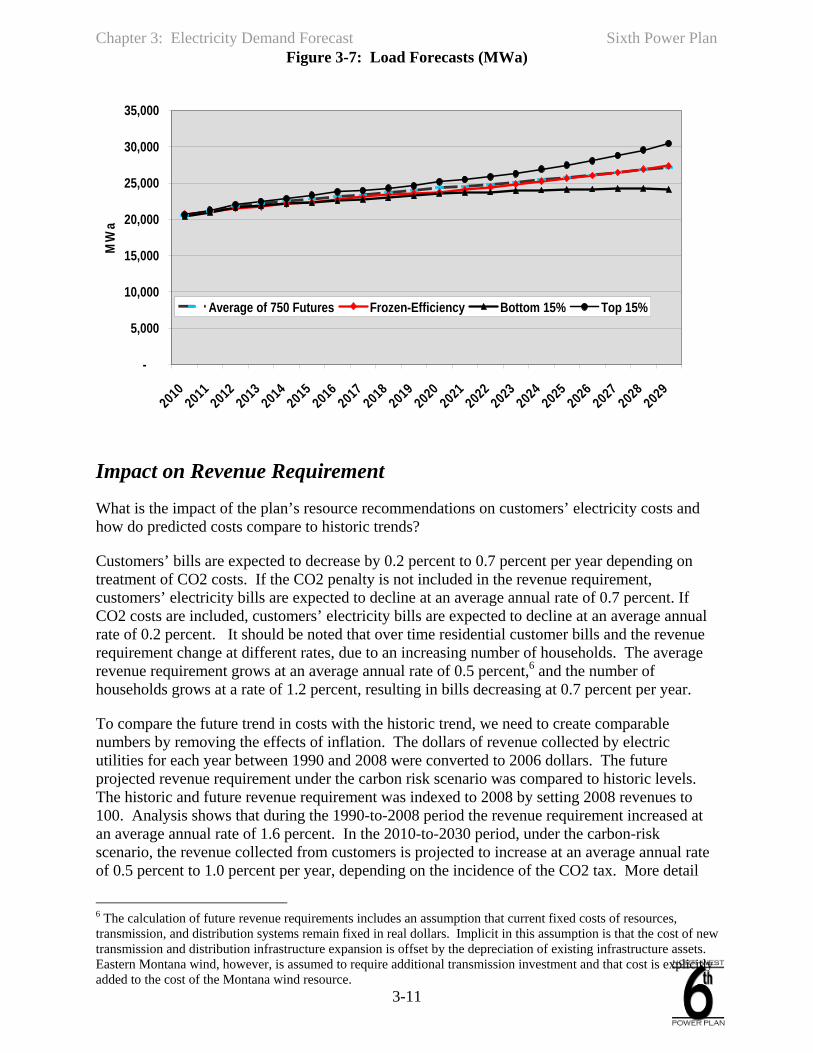
While the Council uses three types of long-term load forecasts, the monthly frozen-efficiency load forecast is the primary forecast used in the regional portfolio model (RPM) for developing alternative future load-growth paths. The RPM takes the frozen-efficiency load forecast and introduces short-term excursions that simulate such events as business and energy commodity price cycles and load variations that could be caused by weather events. In any given period, the RPM may deviate from the long-term load forecast; however, on average the loads created by the RPM are very close to the frozen-efficiency load forecasts. The following table shows a comparison between the frozen-efficiency load forecast and the RPM-generated loads. The graph shows a representative range of load forecasts developed. The RPM generates 750 different future load-growth paths; to graphically represent all these futures would not possible. Here, the averages of the highest 15 percent and lowest 15 percent of the 750 load paths, as well as the average of all the 750 growth paths, are compared with the frozen-efficiency forecast. It should be noted the loads presented in this graph are for non-DSI loads. A more robust discussion of the RPM is presented in Chapter 9 and Appendix J.
Chapter 3: Electricity Demand Forecast Sixth Power Plan
3-11
Figure 3-7: Load Forecasts (MWa)
-
5,000
10,000
15,000
20,000
25,000
30,000
35,000
20102011
20122013
20142015
20162017
20182019
20202021
20222023
20242025
20262027
20282029
MW
a
Average of 750 Futures Frozen-Efficiency Bottom 15% Top 15%
Impact on Revenue Requirement
What is the impact of the plan’s resource recommendations on customers’ electricity costs and how do predicted costs compare to historic trends?
Customers’ bills are expected to decrease by 0.2 percent to 0.7 percent per year depending on treatment of CO2 costs. If the CO2 penalty is not included in the revenue requirement, customers’ electricity bills are expected to decline at an average annual rate of 0.7 percent. If CO2 costs are included, customers’ electricity bills are expected to decline at an average annual rate of 0.2 percent. It should be noted that over time residential customer bills and the revenue requirement change at different rates, due to an increasing number of households. The average revenue requirement grows at an average annual rate of 0.5 percent,6 and the number of households grows at a rate of 1.2 percent, resulting in bills decreasing at 0.7 percent per year.
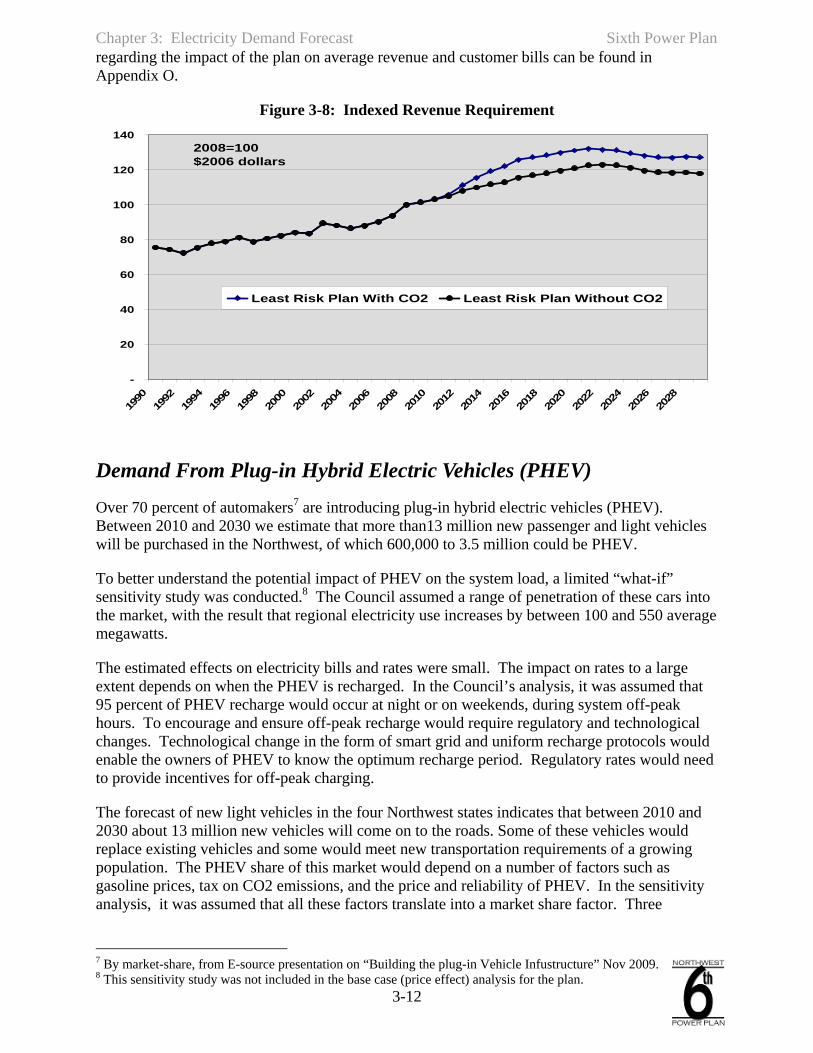
To compare the future trend in costs with the historic trend, we need to create comparable numbers by removing the effects of inflation. The dollars of revenue collected by electric utilities for each year between 1990 and 2008 were converted to 2006 dollars. The future projected revenue requirement under the carbon risk scenario was compared to historic levels. The historic and future revenue requirement was indexed to 2008 by setting 2008 revenues to 100. Analysis shows that during the 1990-to-2008 period the revenue requirement increased at an average annual rate of 1.6 percent. In the 2010-to-2030 period, under the carbon-risk scenario, the revenue collected from customers is projected to increase at an average annual rate of 0.5 percent to 1.0 percent per year, depending on the incidence of the CO2 tax. More detail
6 The calculation of future revenue requirements includes an assumption that current fixed costs of resources, transmission, and distribution systems remain fixed in real dollars. Implicit in this assumption is that the cost of new transmission and distribution infrastructure expansion is offset by the depreciation of existing infrastructure assets. Eastern Montana wind, however, is assumed to require additional transmission investment and that cost is explicitly added to the cost of the Montana wind resource.
Chapter 3: Electricity Demand Forecast Sixth Power Plan
3-12
regarding the impact of the plan on average revenue and customer bills can be found in Appendix O.
Figure 3-8: Indexed Revenue Requirement
-
20
40
60
80
100
120
140
1990
1992
1994
1996
1998
2000
2002
2004
2006
2008
2010
2012
2014
2016
2018
2020
2022
2024
2026
2028
Least Risk Plan With CO2 Least Risk Plan Without CO2
2008=100$2006 dollars
Demand From Plug-in Hybrid Electric Vehicles (PHEV)
Over 70 percent of automakers7 are introducing plug-in hybrid electric vehicles (PHEV). Between 2010 and 2030 we estimate that more than13 million new passenger and light vehicles will be purchased in the Northwest, of which 600,000 to 3.5 million could be PHEV.
To better understand the potential impact of PHEV on the system load, a limited “what-if” sensitivity study was conducted.8 The Council assumed a range of penetration of these cars into the market, with the result that regional electricity use increases by between 100 and 550 average megawatts.
The estimated effects on electricity bills and rates were small. The impact on rates to a large extent depends on when the PHEV is recharged. In the Council’s analysis, it was assumed that 95 percent of PHEV recharge would occur at night or on weekends, during system off-peak hours. To encourage and ensure off-peak recharge would require regulatory and technological changes. Technological change in the form of smart grid and uniform recharge protocols would enable the owners of PHEV to know the optimum recharge period. Regulatory rates would need to provide incentives for off-peak charging.
The forecast of new light vehicles in the four Northwest states indicates that between 2010 and 2030 about 13 million new vehicles will come on to the roads. Some of these vehicles would replace existing vehicles and some would meet new transportation requirements of a growing population. The PHEV share of this market would depend on a number of factors such as gasoline prices, tax on CO2 emissions, and the price and reliability of PHEV. In the sensitivity analysis, it was assumed that all these factors translate into a market share factor. Three
7 By market-share, from E-source presentation on “Building the plug-in Vehicle Infustructure” Nov 2009. 8 This sensitivity study was not included in the base case (price effect) analysis for the plan.
Chapter 3: Electricity Demand Forecast Sixth Power Plan
3-13
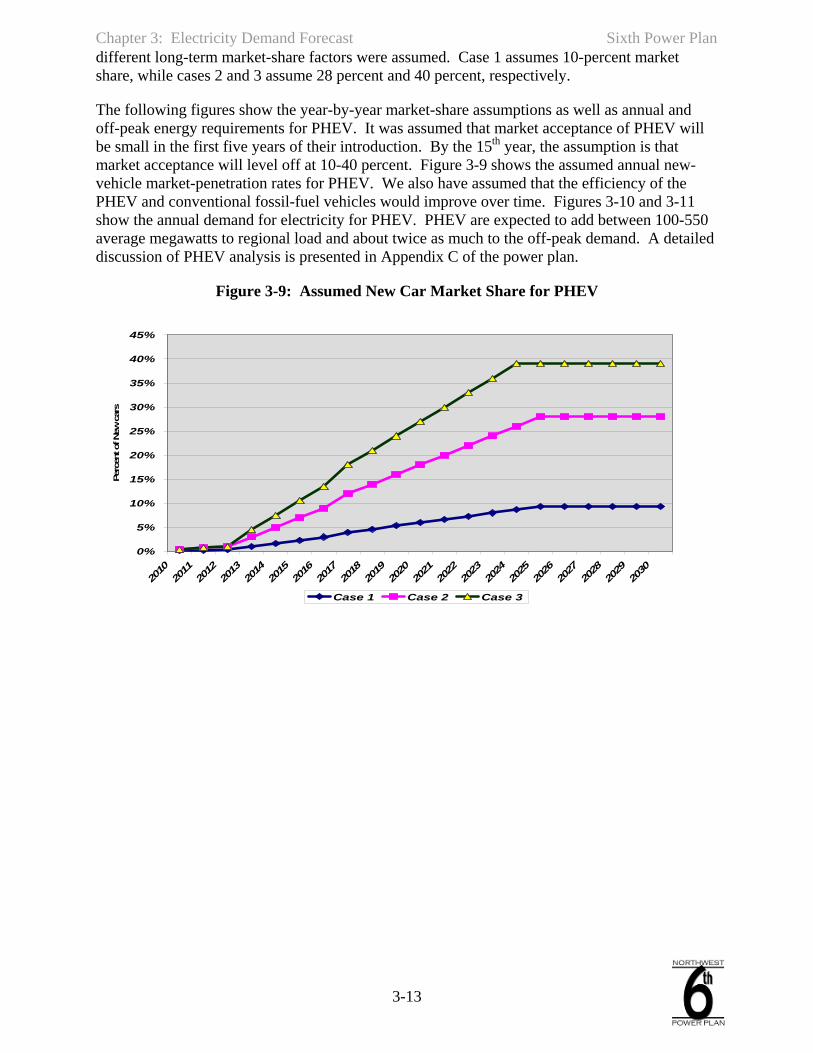
different long-term market-share factors were assumed. Case 1 assumes 10-percent market share, while cases 2 and 3 assume 28 percent and 40 percent, respectively.
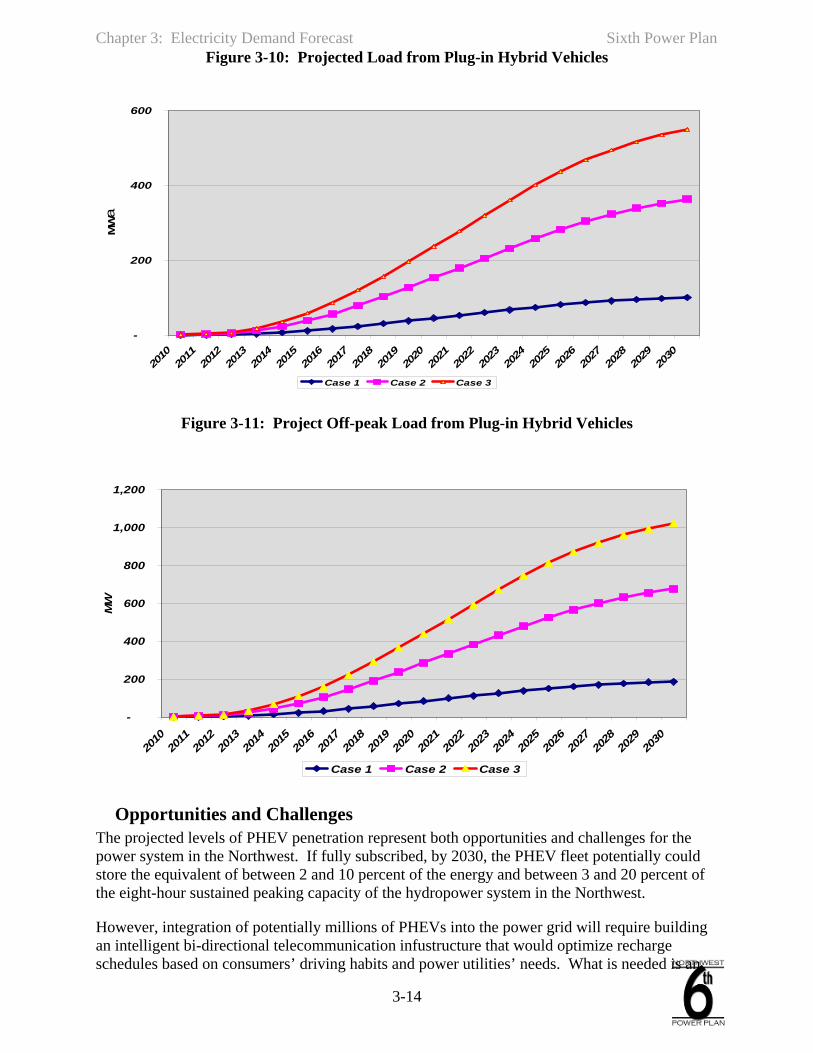
The following figures show the year-by-year market-share assumptions as well as annual and off-peak energy requirements for PHEV. It was assumed that market acceptance of PHEV will be small in the first five years of their introduction. By the 15th year, the assumption is that market acceptance will level off at 10-40 percent. Figure 3-9 shows the assumed annual new-vehicle market-penetration rates for PHEV. We also have assumed that the efficiency of the PHEV and conventional fossil-fuel vehicles would improve over time. Figures 3-10 and 3-11 show the annual demand for electricity for PHEV. PHEV are expected to add between 100-550 average megawatts to regional load and about twice as much to the off-peak demand. A detailed discussion of PHEV analysis is presented in Appendix C of the power plan.
Figure 3-9: Assumed New Car Market Share for PHEV
0%
5%
10%
15%
20%
25%
30%
35%
40%
45%
2010
2011
2012
2013
2014
2015
2016
2017
2018
2019
2020
2021
2022
2023
2024
2025
2026
2027
2028
2029
2030
Perc
ent o
f New
car
s
Case 1 Case 2 Case 3
Chapter 3: Electricity Demand Forecast Sixth Power Plan
3-14
Figure 3-10: Projected Load from Plug-in Hybrid Vehicles
-
200
400
600
2010
2011
2012
2013
2014
2015
2016
2017
2018
2019
2020
2021
2022
2023
2024
2025
2026
2027
2028
2029
2030
MW
a
Case 1 Case 2 Case 3
Figure 3-11: Project Off-peak Load from Plug-in Hybrid Vehicles
-
200
400
600
800
1,000
1,200
2010
2011
2012
2013
2014
2015
2016
2017
2018
2019
2020
2021
2022
2023
2024
2025
2026
2027
2028
2029
2030
MW
Case 1 Case 2 Case 3
Opportunities and Challenges
The projected levels of PHEV penetration represent both opportunities and challenges for the power system in the Northwest. If fully subscribed, by 2030, the PHEV fleet potentially could store the equivalent of between 2 and 10 percent of the energy and between 3 and 20 percent of the eight-hour sustained peaking capacity of the hydropower system in the Northwest.
However, integration of potentially millions of PHEVs into the power grid will require building an intelligent bi-directional telecommunication infustructure that would optimize recharge schedules based on consumers’ driving habits and power utilities’ needs. What is needed is an

Chapter 3: Electricity Demand Forecast Sixth Power Plan
3-15
integration of three sectors- transportation, information, and electric power. To make possible the communication between local utilities, millions of dispersed vehicles, and thousands of recharge stations, common national communication standards along with local utilities’ incentivized rates and a seamless recharge infrastructure are necessary. The utilities will need to provide incentives to PHEV drivers to subscribe to smart charging programs, where the utility could manage the timing and pace of the recharge.
Environmental Impacts The impact of PHEV on the emissions from electricity generation depends on the timing of recharge and future mix of generation. In the regional portfolio model, by 2030 the difference in CO2 emissions from the power system was 0.8 million metric tons higher9 due to PHEV loads. But the increase in CO2 emissions from power plants is more than offset by the decrease in emissions by vehicles. The US Department of Energy estimates that in the four states of Oregon, Washington, Idaho, and Montana, tail-pipe emissions in 2007 were about 90 million metric tons. The Council’s estimates show that, depending on market acceptance of PHEV and response from conventional-fuel vehicles,10 by 2030 tail-pipe emissions could be lower by 2 to 9 million metric tons.
Figure 3-12: Potential Reduction in Tail-pipe CO2 due to Plug-in Hybrid Vehicles
-
1,000,000
2,000,000
3,000,000
4,000,000
5,000,000
6,000,000
7,000,000
8,000,000
9,000,000
10,000,000
2010
2011
2012
2013
2014
2015
2016
2017
2018
2019
2020
2021
2022
2023
2024
2025
2026
2027
2028
2029
2030
Met
ric T
ons
Case 1 Case 2 Case 3
Meeting the energy requirement of PHEV may not require new resources.. Council analysis shows that if the plan’s conservation targets are met, by 2030 the off-peak demand for energy could be reduced by about 3,800 megawatts. This amount of off-peak demand reduction would be sufficient to power an all-PHEV new vehicles fleet in the region.
9 37.8 million metric tons compared to 37 million in the least-risk scenario. 10 This assumes that as a result of national standards, higher fuel prices and availability of PHEV, conventional fuel vehicles would improve their fuel efficiency from 21.7 miles per gallon in 2010 to 35 miles per gallon by 2030.
Chapter 3: Electricity Demand Forecast Sixth Power Plan
3-16
ASSESSMENT OF NEEDS - UTILITY PERSPECTIVE
Regional utilities have consistently used the annual average load/resource balance as a quick and simple metric to get an indication of their resource needs. For the region, the load/resource balance reported in PNUCC’s Northwest Regional Forecast (NRF) provides an aggregate look at utility-resource needs. That calculation assumes firm loads and resources,11 which include critical-water hydropower generation but no market resources. A general conclusion that can be made from this metric is that when the average annual load is greater than the firm supply, additional resources likely are needed.
However, this utility-perspective metric is very limited and requires assessment. The Council and utilities must use more sophisticated analyses, which take other uncertainties into account, in order to develop a more comprehensive needs assessment and, more importantly, a robust resource-acquisition strategy (more commonly referred to as an integrated resource plan). The Council’s methodologies for assessing the region’s needs and for developing a resource strategy are described in Chapter 9 (Developing a Resource Strategy) and in Chapter 10 (Recommended Resource Strategy), respectively.
The Council’s assessment of power supply adequacy, developed by the Resource Adequacy Forum, uses a more sophisticated methodology than simply comparing firm loads and resources. Adopted by the Council in 2008, it uses probabilistic tools to assess the likelihood of potential problems given firm, non-firm, and market resources. A more detailed description and a summary of results are provided in Chapter 14 (Resource Adequacy Standards).
Yet, in spite of the limitations of the simple firm-load/resource-balance metric for assessing resource needs, this perspective is beneficial in that it is readily available to all utilities and provides a starting point for further discussion. Also, by reconfiguring Council assessments to fit this perspective, results can be compared with other utility-published reports. The following section illustrates the Council’s assumptions for loads and resources portrayed in a utility perspective.
Annual Needs
As a starting point for assessing regional resource needs based on a utility perspective, it is necessary to identify long-term load uncertainty and existing firm-resource capability. Existing resources include those that are owned or operated by regional utilities to serve regional loads, regardless of their physical location. The generating capability of existing resources is adjusted for maintenance and for the likelihood of forced outages. It is also adjusted to reflect utility operating assumptions. For example, a utility may own a 100-megawatt capacity simple-cycle combustion turbine, which it intends to use for hourly peaking needs only. Because of the way in which the utility expects to operate this resource, it may only use 5 percent (or 5 average megawatts) to count toward the annual average firm-resource generating capability. The existing resource capability shown in the following charts has been adjusted for this effect.
The range of uncertainty in long-term loads (through the year 2030), was derived from the regional portfolio model, which takes into account a wide variation in potential future economic growth. The high end of the load uncertainty range represents the average load for
11 Firm loads are net of firm exports and imports. Firm resources consist of firm non-hydropower and critical-water hydropower resources.
Chapter 3: Electricity Demand Forecast Sixth Power Plan
3-17
approximately the highest 15 percent12 of the load paths from the model. The low end of the range represents the average load for approximately the lowest 15 percent of the load paths from the model. This load range includes the net effect of firm contractual imports and exports.
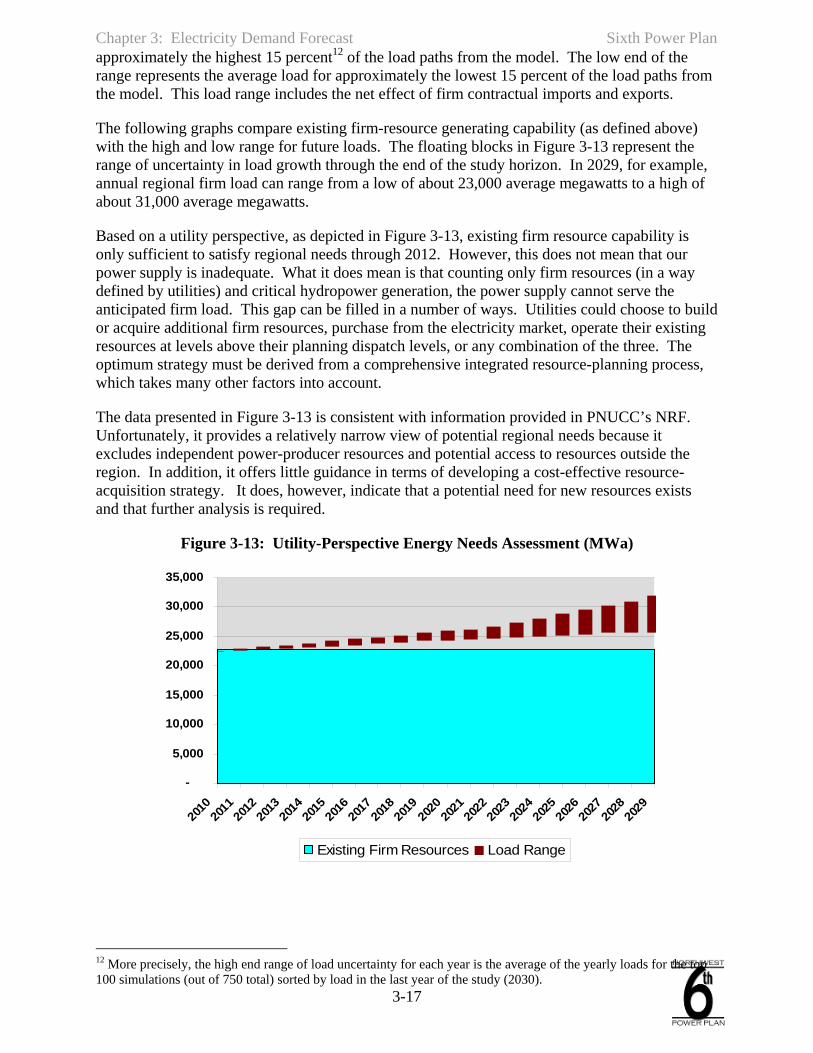
The following graphs compare existing firm-resource generating capability (as defined above) with the high and low range for future loads. The floating blocks in Figure 3-13 represent the range of uncertainty in load growth through the end of the study horizon. In 2029, for example, annual regional firm load can range from a low of about 23,000 average megawatts to a high of about 31,000 average megawatts.
Based on a utility perspective, as depicted in Figure 3-13, existing firm resource capability is only sufficient to satisfy regional needs through 2012. However, this does not mean that our power supply is inadequate. What it does mean is that counting only firm resources (in a way defined by utilities) and critical hydropower generation, the power supply cannot serve the anticipated firm load. This gap can be filled in a number of ways. Utilities could choose to build or acquire additional firm resources, purchase from the electricity market, operate their existing resources at levels above their planning dispatch levels, or any combination of the three. The optimum strategy must be derived from a comprehensive integrated resource-planning process, which takes many other factors into account.
The data presented in Figure 3-13 is consistent with information provided in PNUCC’s NRF. Unfortunately, it provides a relatively narrow view of potential regional needs because it excludes independent power-producer resources and potential access to resources outside the region. In addition, it offers little guidance in terms of developing a cost-effective resource-acquisition strategy. It does, however, indicate that a potential need for new resources exists and that further analysis is required.
Figure 3-13: Utility-Perspective Energy Needs Assessment (MWa)
-
5,000
10,000
15,000
20,000
25,000
30,000
35,000
2010
2011
2012
2013
2014
2015
2016
2017
2018
2019
2020
2021
2022
2023
2024
2025
2026
2027
2028
2029
Existing Firm Resources Load Range
12 More precisely, the high end range of load uncertainty for each year is the average of the yearly loads for the top 100 simulations (out of 750 total) sorted by load in the last year of the study (2030).

Chapter 3: Electricity Demand Forecast Sixth Power Plan
3-18
Hourly Needs
Although not used as often in the past, capacity load/resource balances are becoming more important for assessing the need for new resources. The combination of rapidly growing summer loads and decreasing summer hydroelectric capability is pushing the region to consider more carefully its peaking needs in summer months. Traditionally, capacity load/resource balances have been measured as surplus reserve margins, in units of percent. To calculate a capacity reserve margin, surplus firm-generating capability for the peak-load hour of the day is divided by the load during that hour. This surplus capacity must be sufficient to cover operating- and planning-reserve requirements, fluctuations in load due to temperature, and the potential loss of a generating resource. In regions that are dominated by thermal resources, the desired reserve margin typically is in the range of 15 to 17 percent.
The Northwest, however, is a hydroelectric-dominated system that has limited storage capability. The aggregate storage capacity of all reservoirs is only about 30 percent of the annual average runoff volume in the Columbia River. Because of this storage limitation and other factors, the Northwest power system cannot sustain its single-hour generating capability over long periods. A more appropriate measure of hourly capability is the generation that the system can sustain over a three-day period, which approximates the duration for cold snaps or heat waves in the Northwest. This sustained-peak capability then can be compared to the sustained-peak load. However, to date, no standard has been established for a utility-perspective (firm only) sustained-peak reserve-margin requirement.13
Using the same methodology as for the energy-needs assessment above, the utility-perspective January and July sustained-peak capacity needs assessments are illustrated in Figures 3-14 and 3-15. These results cannot be compared directly to PNUCC’s Northwest Regional Forecast because it currently does not report capacity data. For January, existing firm resources fall below the high end of the sustained-peak load range by the year 2028; for July, resources fall short of the high end of the load range by the year 2026. However, the loads shown in these figures do not include any reserve-margin requirements. Adding those requirements to the load range will result in an earlier need for resource acquisition. But, as discussed above, utility-perspective, sustained-peak reserve requirements are not clear.
Figure 3-14: Utility-Perspective January Capacity Needs Assessment (MW)
13 The Resource Adequacy Forum has developed minimum sustained-peak reserve-margin thresholds using a loss-of-load probability analysis (as defined in the Council-adopted adequacy standard). But these thresholds were developed under the assumption that some non-firm resources would be available for dispatch during emergency periods. Because of that, the Forum’s thresholds cannot be compared to reserve margins calculated using firm resources only.

Chapter 3: Electricity Demand Forecast Sixth Power Plan
3-19
-
5,00010,000
15,000
20,000
25,00030,000
35,000
40,00045,000
50,000
2010
2011
2012
2013
2014
2015
2016
2017
2018
2019
2020
2021
2022
2023
2024
2025
2026
2027
2028
2029
Existing Firm Capacity SPP Peak Load Range
Figure 3-15: Utility Perspective July Capacity Needs Assessment (MW)
-
5,000
10,000
15,000
20,000
25,000
30,000
35,000
40,000
45,000
2010
2011
2012
2013
2014
2015
2016
2017
2018
2019
2020
2021
2022
2023
2024
2025
2026
2027
2028
2029
Existing Firm Capacity SPP Peak Load Range
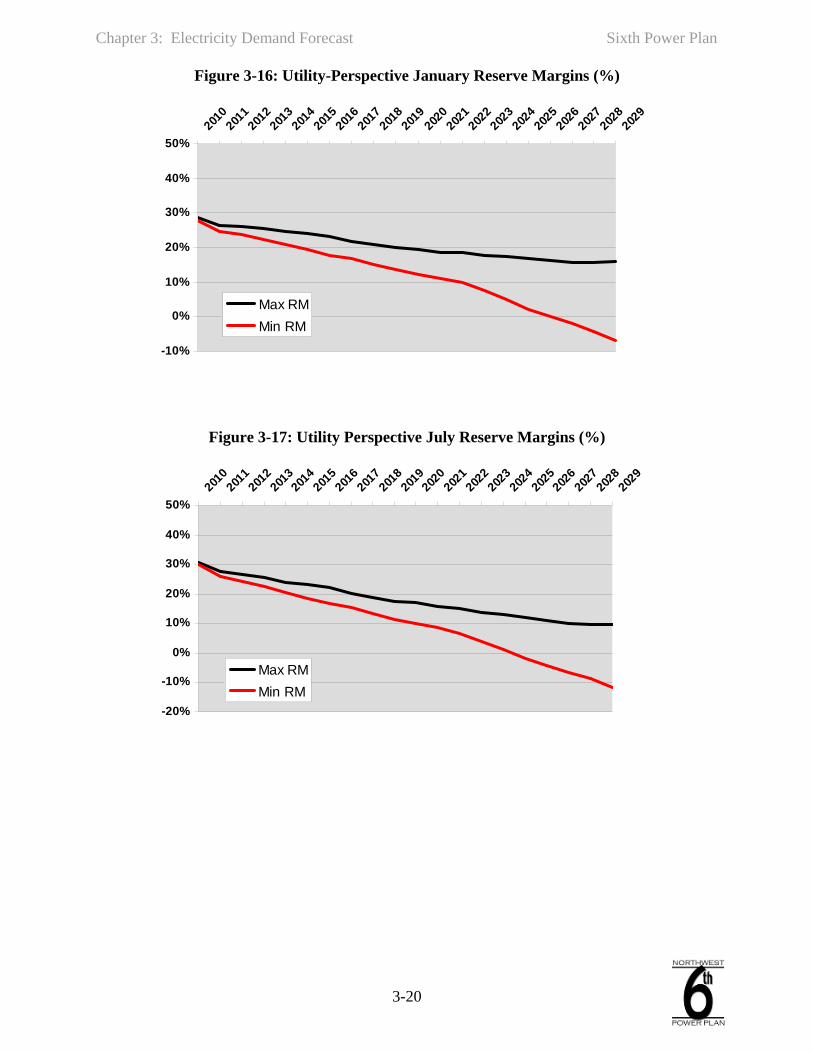
An alternative way to display the utility-perspective hourly needs assessment is to graph the sustained-peak reserve margins calculated from data shown in Figures 3-14 and 3-15. Figures 3-16 and 3-17 show the resulting sustained-peak reserve margin ranges for January and July, respectively, using existing firm resources only. If the minimum required reserve margins for January and July were known, these figures would indicate the years in which new resources would be needed. Using 17 percent14 as a surrogate for the utility-perspective sustained-peak reserve-margin threshold, the need for new resources occurs in 2016 for January and in 2015 for July (when the reserve margins drop below 17 percent). However, these results do not provide an accurate assessment of hourly needs. 14 California utilities historically have used a 15-to-17-percent reserve-margin requirement for long-term resource planning. However, that requirement is only appropriate for a thermal-based power system, which focuses on single-hour needs as opposed to sustained-peak needs.
Chapter 3: Electricity Demand Forecast Sixth Power Plan
3-20
Figure 3-16: Utility-Perspective January Reserve Margins (%)
-10%
0%
10%
20%
30%
40%
50%20
1020
1120
1220
1320
1420
1520
1620
1720
1820
1920
2020
2120
2220
2320
2420
2520
2620
2720
2820
29
Max RMMin RM
Figure 3-17: Utility Perspective July Reserve Margins (%)
-20%
-10%
0%
10%
20%
30%
40%
50%20
1020
1120
1220
1320
1420
1520
1620
1720
1820
1920
2020
2120
2220
2320
2420
2520
2620
2720
2820
29
Max RMMin RM
Chapter 3: Electricity Demand Forecast Sixth Power Plan
3-21
ANNUAL LOAD FORECAST TABLES
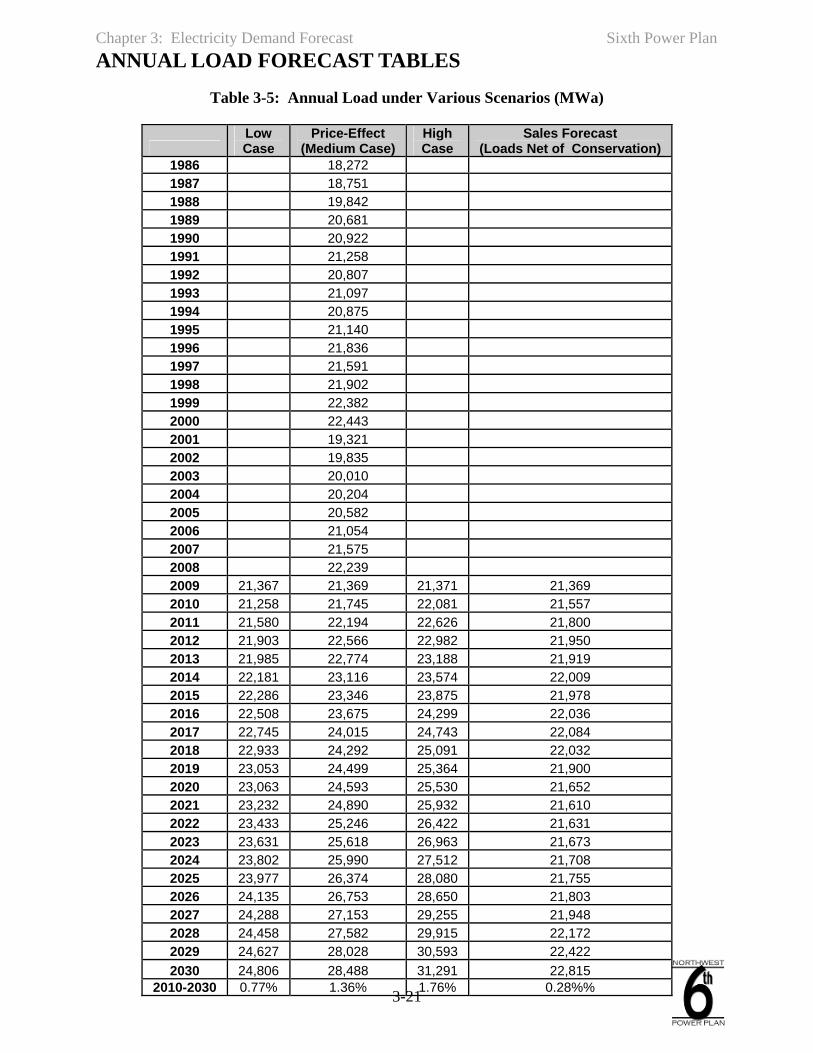
Table 3-5: Annual Load under Various Scenarios (MWa)
Low Case
Price-Effect (Medium Case)
High Case
Sales Forecast (Loads Net of Conservation)
1986 18,272 1987 18,751 1988 19,842 1989 20,681 1990 20,922 1991 21,258 1992 20,807 1993 21,097 1994 20,875 1995 21,140 1996 21,836 1997 21,591 1998 21,902 1999 22,382 2000 22,443 2001 19,321 2002 19,835 2003 20,010 2004 20,204 2005 20,582 2006 21,054 2007 21,575 2008 22,239 2009 21,367 21,369 21,371 21,369 2010 21,258 21,745 22,081 21,557 2011 21,580 22,194 22,626 21,800 2012 21,903 22,566 22,982 21,950 2013 21,985 22,774 23,188 21,919 2014 22,181 23,116 23,574 22,009 2015 22,286 23,346 23,875 21,978 2016 22,508 23,675 24,299 22,036 2017 22,745 24,015 24,743 22,084 2018 22,933 24,292 25,091 22,032 2019 23,053 24,499 25,364 21,900 2020 23,063 24,593 25,530 21,652 2021 23,232 24,890 25,932 21,610 2022 23,433 25,246 26,422 21,631 2023 23,631 25,618 26,963 21,673 2024 23,802 25,990 27,512 21,708 2025 23,977 26,374 28,080 21,755 2026 24,135 26,753 28,650 21,803 2027 24,288 27,153 29,255 21,948 2028 24,458 27,582 29,915 22,172 2029 24,627 28,028 30,593 22,422 2030 24,806 28,488 31,291 22,815
2010-2030 0.77% 1.36% 1.76% 0.28%%
Chapter 3: Electricity Demand Forecast Sixth Power Plan
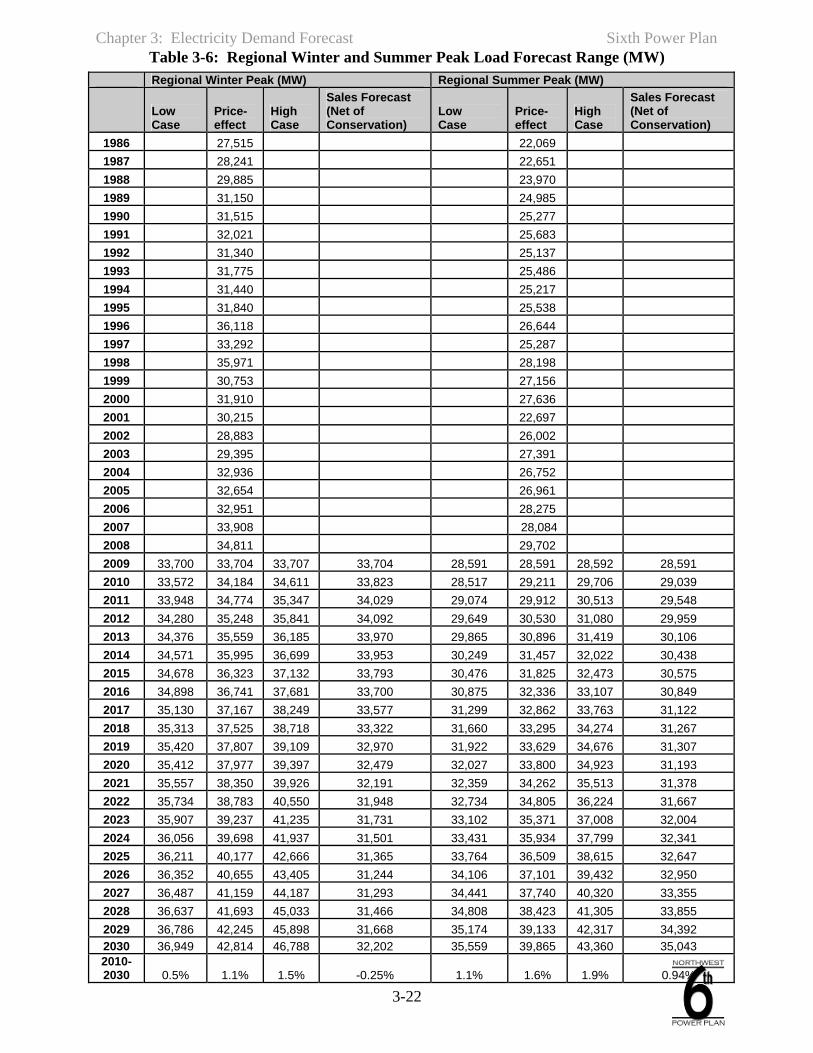
3-22
Table 3-6: Regional Winter and Summer Peak Load Forecast Range (MW) Regional Winter Peak (MW) Regional Summer Peak (MW)
Low Case
Price-effect
High Case
Sales Forecast (Net of Conservation)
Low Case
Price-effect
High Case
Sales Forecast (Net of Conservation)
1986 27,515 22,069 1987 28,241 22,651 1988 29,885 23,970 1989 31,150 24,985 1990 31,515 25,277 1991 32,021 25,683 1992 31,340 25,137 1993 31,775 25,486 1994 31,440 25,217 1995 31,840 25,538 1996 36,118 26,644 1997 33,292 25,287 1998 35,971 28,198 1999 30,753 27,156 2000 31,910 27,636 2001 30,215 22,697 2002 28,883 26,002 2003 29,395 27,391 2004 32,936 26,752 2005 32,654 26,961 2006 32,951 28,275 2007 33,908 28,084 2008 34,811 29,702 2009 33,700 33,704 33,707 33,704 28,591 28,591 28,592 28,591 2010 33,572 34,184 34,611 33,823 28,517 29,211 29,706 29,039 2011 33,948 34,774 35,347 34,029 29,074 29,912 30,513 29,548 2012 34,280 35,248 35,841 34,092 29,649 30,530 31,080 29,959 2013 34,376 35,559 36,185 33,970 29,865 30,896 31,419 30,106 2014 34,571 35,995 36,699 33,953 30,249 31,457 32,022 30,438 2015 34,678 36,323 37,132 33,793 30,476 31,825 32,473 30,575 2016 34,898 36,741 37,681 33,700 30,875 32,336 33,107 30,849 2017 35,130 37,167 38,249 33,577 31,299 32,862 33,763 31,122 2018 35,313 37,525 38,718 33,322 31,660 33,295 34,274 31,267 2019 35,420 37,807 39,109 32,970 31,922 33,629 34,676 31,307 2020 35,412 37,977 39,397 32,479 32,027 33,800 34,923 31,193 2021 35,557 38,350 39,926 32,191 32,359 34,262 35,513 31,378 2022 35,734 38,783 40,550 31,948 32,734 34,805 36,224 31,667 2023 35,907 39,237 41,235 31,731 33,102 35,371 37,008 32,004 2024 36,056 39,698 41,937 31,501 33,431 35,934 37,799 32,341 2025 36,211 40,177 42,666 31,365 33,764 36,509 38,615 32,647 2026 36,352 40,655 43,405 31,244 34,106 37,101 39,432 32,950 2027 36,487 41,159 44,187 31,293 34,441 37,740 40,320 33,355 2028 36,637 41,693 45,033 31,466 34,808 38,423 41,305 33,855 2029 36,786 42,245 45,898 31,668 35,174 39,133 42,317 34,392 2030 36,949 42,814 46,788 32,202 35,559 39,865 43,360 35,043 2010- 2030 0.5% 1.1% 1.5% -0.25% 1.1% 1.6% 1.9% 0.94%