Chapter 3 EARLY STAGE ESTIMATIONshodhganga.inflibnet.ac.in/bitstream/10603/9090/7/07_chapter...
30
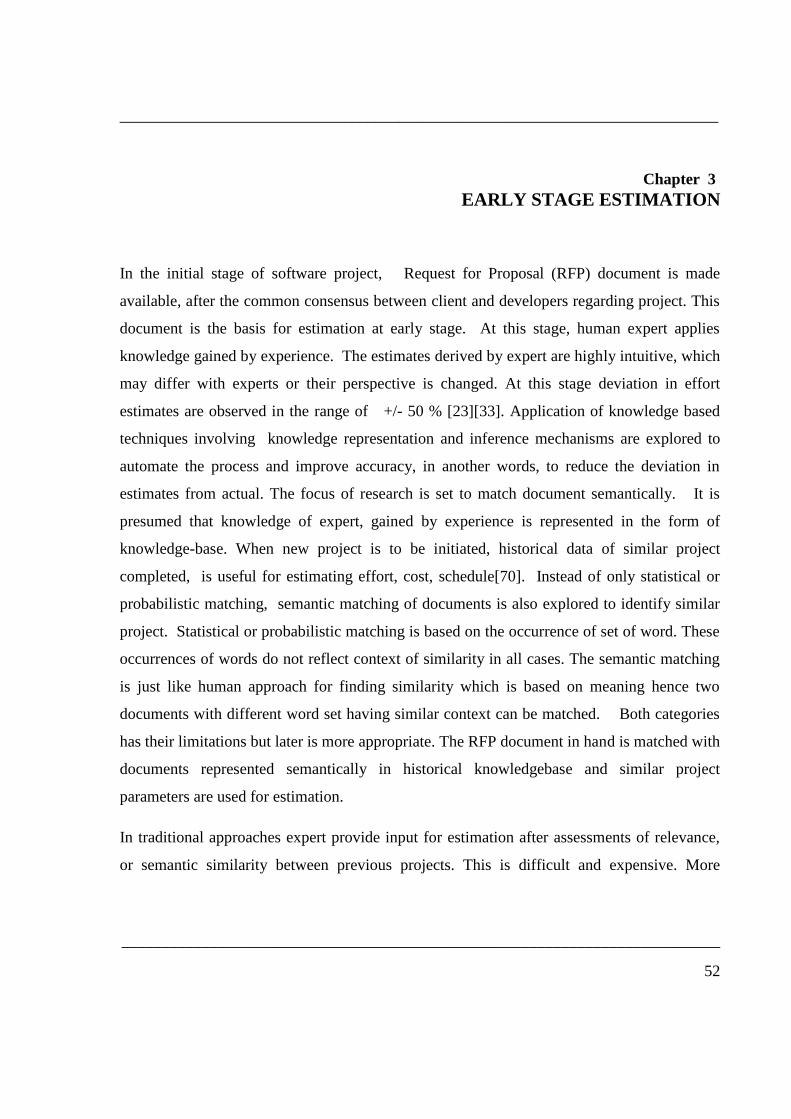
___________________________________________________________________________ ___________________________________________________________________________ 52 Chapter 3 EARLY STAGE ESTIMATION In the initial stage of software project, Request for Proposal (RFP) document is made available, after the common consensus between client and developers regarding project. This document is the basis for estimation at early stage. At this stage, human expert applies knowledge gained by experience. The estimates derived by expert are highly intuitive, which may differ with experts or their perspective is changed. At this stage deviation in effort estimates are observed in the range of +/- 50 % [23][33]. Application of knowledge based techniques involving knowledge representation and inference mechanisms are explored to automate the process and improve accuracy, in another words, to reduce the deviation in estimates from actual. The focus of research is set to match document semantically. It is presumed that knowledge of expert, gained by experience is represented in the form of knowledge-base. When new project is to be initiated, historical data of similar project completed, is useful for estimating effort, cost, schedule[70]. Instead of only statistical or probabilistic matching, semantic matching of documents is also explored to identify similar project. Statistical or probabilistic matching is based on the occurrence of set of word. These occurrences of words do not reflect context of similarity in all cases. The semantic matching is just like human approach for finding similarity which is based on meaning hence two documents with different word set having similar context can be matched. Both categories has their limitations but later is more appropriate. The RFP document in hand is matched with documents represented semantically in historical knowledgebase and similar project parameters are used for estimation. In traditional approaches expert provide input for estimation after assessments of relevance, or semantic similarity between previous projects. This is difficult and expensive. More
Transcript of Chapter 3 EARLY STAGE ESTIMATIONshodhganga.inflibnet.ac.in/bitstream/10603/9090/7/07_chapter...
___________________________________________________________________________
___________________________________________________________________________
52
Chapter 3
EARLY STAGE ESTIMATION
In the initial stage of software project, Request for Proposal (RFP) document is made
available, after the common consensus between client and developers regarding project. This
document is the basis for estimation at early stage. At this stage, human expert applies
knowledge gained by experience. The estimates derived by expert are highly intuitive, which
may differ with experts or their perspective is changed. At this stage deviation in effort
estimates are observed in the range of +/- 50 % [23][33]. Application of knowledge based
techniques involving knowledge representation and inference mechanisms are explored to
automate the process and improve accuracy, in another words, to reduce the deviation in
estimates from actual. The focus of research is set to match document semantically. It is
presumed that knowledge of expert, gained by experience is represented in the form of
knowledge-base. When new project is to be initiated, historical data of similar project
completed, is useful for estimating effort, cost, schedule[70]. Instead of only statistical or
probabilistic matching, semantic matching of documents is also explored to identify similar
project. Statistical or probabilistic matching is based on the occurrence of set of word. These
occurrences of words do not reflect context of similarity in all cases. The semantic matching
is just like human approach for finding similarity which is based on meaning hence two
documents with different word set having similar context can be matched. Both categories
has their limitations but later is more appropriate. The RFP document in hand is matched with
documents represented semantically in historical knowledgebase and similar project
parameters are used for estimation.
In traditional approaches expert provide input for estimation after assessments of relevance,
or semantic similarity between previous projects. This is difficult and expensive. More

___________________________________________________________________________
___________________________________________________________________________
53
importantly, it does not scale with the size, heterogeneity, and growth of the data. Hence,
finding similarity between project documents by AI approach has been proposed which
involves knowledge processing as indicated in Figure 3.1.
Figure 3.1 Software Estimation Model involving semantic matching of
RFP / SRS documents and historical knowledgebase
Two approaches of semantic matching of project documents are combined, which are shown
in Figure 3.2. First Latent Semantic Analysis is applied and second is an extension to LSA
where LSA is used to develop the ontology and heuristic is applied to match new document
with documents in the repository. Final result is presented as a list of project identifiers
with similarity percentage values. This list is stored in XML file, which may be used by any
other application to display actual project document.
Effort
Estimate
Semantic Matching of
New Software Project
RFP document with RFP
documents in historical
Knowledgebase
Historical Knowledgebase
along with
FP / SRS documents
RFP / SRS documents
for new Software Project
under estimation

___________________________________________________________________________
___________________________________________________________________________
54
Figure 3.2 Semantic Matching of project document
3.1 LSA APPLICATION FOR SEMANTIC MATCHING OF SOFTWARE
PROJECT DOCUMENT
LSA method is a recent theory of knowledge induction and representation. Figure 3.3
depicts how it determines the similarity of meaning of words and passages by analysis of
large text corpora. LSA produces measures of word-word, word-passage and passage-passage
relations[47]. The similarity estimates derived by LSA depend on a powerful mathematical
analysis that is capable of correctly inferring much deeper relations (thus the phrase “Latent
Semantic”). LSA differs from some statistical approaches in two significant respects. First,
LSA does not use just the summed contiguous pair-wise or tupple-wise co-occurrences of
words as its initial data. LSA represents the meaning of a word as a kind of average of the
HTML to Text Conversion
Historical Project
Documents in the form of Web
Pages
HTML Parser
Data Extractor
Generate Flat
Text Files
Latent Semantic Analysis
Ontology Development and Matching
Set of Similar Documents
List of project identifiers / URL and similarity
percentage Similar to
new project document
Set of Similar Documents
New Project Documents in
the form of Web Page

___________________________________________________________________________
___________________________________________________________________________
55
meaning of all the passages in which it appears, and the meaning of a passage as a kind of
average of the meaning of all the words it contains. Second, LSA is based on singular value
decomposition, a mathematical matrix decomposition technique. Along with this SVD
approach it applies dimension reduction step. Reducing the dimensionality (the number of
parameters by which a word or passage is described) of the observed data from the number
of initial contexts to a much smaller - but still large - number will often produce much better
approximations to human cognitive relations [46].
Figure 3.3 LSA Methodology Applied to match Software Project Document
The first step is to represent the text as a matrix in which each row stands for a unique word
and each column stands for a text passage or other context. Each cell contains the frequency
with which the word of its row appears in the passage denoted by its column. Also, each cell
frequency is weighted by a function that expresses both the word‟s importance in the
Project
Documents
Dimension reduction
& Matrix
reconstruction
Singular Value
Decomposition
Word-by-document
Matrix
Find relevant words
Similarity
Index
Text
Preprocessing
___________________________________________________________________________
___________________________________________________________________________
56
particular passage and the degree to which the word type carries information in the domain of
discourse in general.
Next, LSA applies singular value decomposition (SVD) to the matrix. This is a form of factor
analysis. In SVD, a rectangular matrix is decomposed into the product of three other
matrices. One component matrix describes the original row entities as vectors of derived
orthogonal factor values, another describes the original column entities in the same way, and
the third is a diagonal matrix containing scaling values. Along with this SVD applies
dimension reduction step. Reducing the dimensionality (the number of parameters by which a
word or passage is described) of the observed data from the number of initial contexts to a
much smaller - but still large - number will often produce much better approximations to
human cognitive relations. This dimensionality reduction step is combining of surface
information into a deeper abstraction that captures the mutual implications of words and
passages [48].
3.2 SEMANTIC GRAPH GENERATION FOR MATCHING PROJECT
DOCUMENTS
This method is based on Natural Language Understanding, which includes Morphological
Analysis, Syntactic Analysis and Semantic Analysis [36]. So the basic architectural
component is Semantic Text Parser [38]. The Text Parser is responsible for reading input
texts and converting them to canonical and symbolic knowledge representations. The
representation is a graph-based data structure where entities, such as agents, objects, states,
actions, events, and locations are represented as vertices, and relations between them are
represented as arcs. Each node holds information about the entity it represents that could
include its original text, syntactic information, semantic meaning, and relations with other
nodes [65].
These generated graphs are then given as input to the Similarity Estimator. The similarity
estimator component is responsible for searching the abstract representations of two graphs,
___________________________________________________________________________
___________________________________________________________________________
57
finding elements that are sufficiently similar, and yielding an overall similarity index [65].
The similarity index reflect the degree of commonality found between these structures. The
Similarity Estimator uses Inexact Graph Matching Technique to match directed, acyclic, and
connected node – attributed graphs.
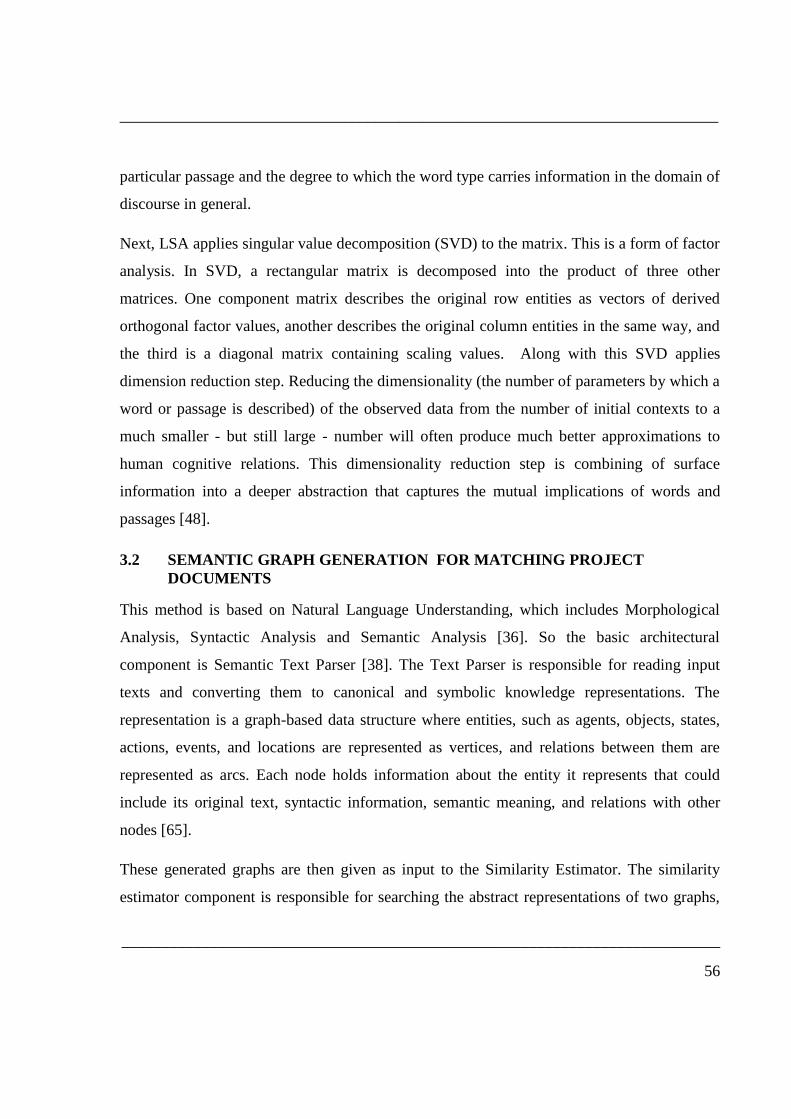
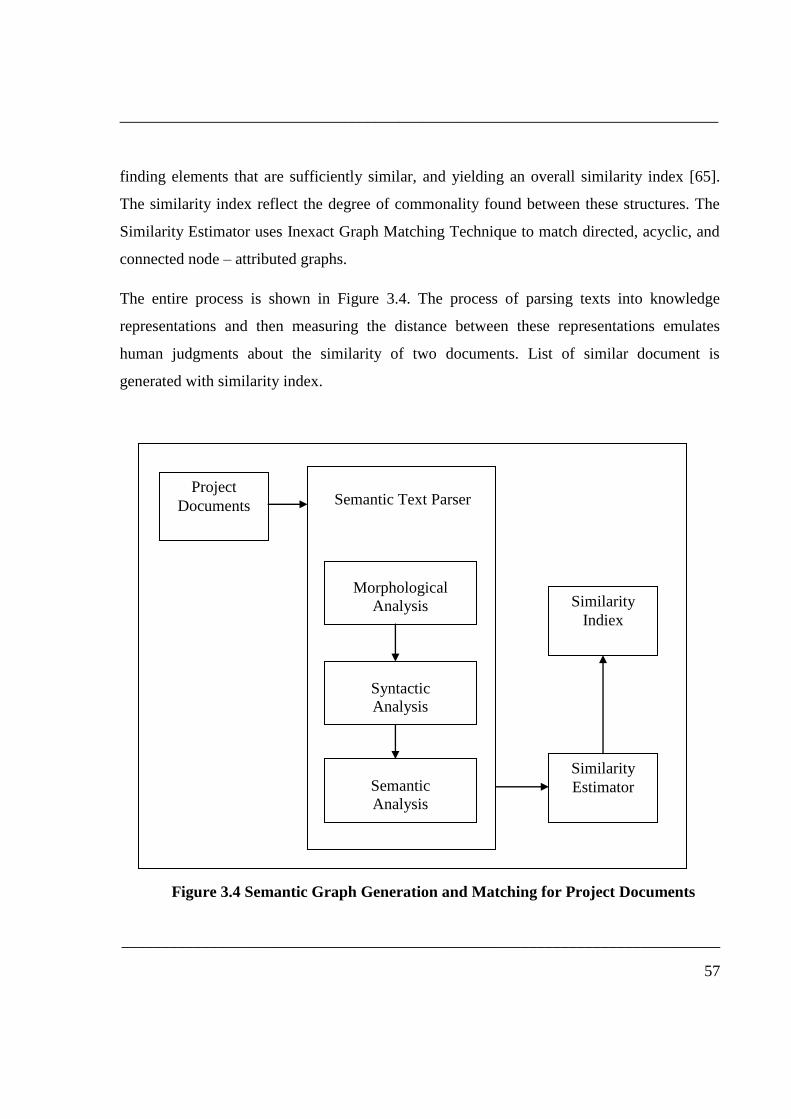
The entire process is shown in Figure 3.4. The process of parsing texts into knowledge
representations and then measuring the distance between these representations emulates
human judgments about the similarity of two documents. List of similar document is
generated with similarity index.
Figure 3.4 Semantic Graph Generation and Matching for Project Documents
Project
Documents
Morphological
Analysis
Syntactic
Analysis
Semantic
Analysis
Similarity
Estimator
Similarity
Indiex
Semantic Text Parser

___________________________________________________________________________
___________________________________________________________________________
58
3.3 ONTOLOGY DEVELOPMENT AND MATCHING FOR SOFTWARE
PROJECT DOCUMENTS
Ontology typically provides a vocabulary that describes a domain of interest and a
specification of the meaning of terms used in the vocabulary [50][57][63]. They, indeed, are a
practical means to conceptualize what is expressed in a computer format. Depending on the
precision of this specification, the notion of ontology encompasses several data/conceptual
models. There are many different ontology representation schemes [61]. Ontology Matching
finds correspondences between semantically related entities [60]. In this Ontology, there are
two types of nodes: Concept nodes and term nodes. The ontology representation used here is
the Bipartite Graph. Bipartite graph is used to show the relationship between different terms
and concepts. In graph construction, concept nodes are taken on one side and term nodes
are taken on the other side. Concept nodes are connected to term nodes, but are not directly
connected to other concept nodes. Term nodes are connected to other term nodes, only by
being connected to a common concept node. To generate Bipartite Graph Representation
from text documents, the LSA method is used to find terms and concepts after normalization
and SVD approach [ADMI]. Once the graphs are generated, graph-matching algorithm [58] is
used to find similarity index. Figure 3.4 shows the entire process
3.3.1 Heuristic for Ontology Matching
After creating domain ontology following heuristics is applied to categorize the new
document
1. A density heuristic that measures the percent of the document that appears to apply to
the application ontology
2. An expected-value heuristic that compares the number and kind of values found in the
document to the number and kind expected by the application ontology

___________________________________________________________________________
___________________________________________________________________________
59
3. A grouping heuristic that considers whether the values of the document appear to be
grouped as application-ontology records
Then, based on machine-learned rules over these heuristic measurements, we determine
whether a new document contains objects of interest with respect to application ontology.
These heuristics evaluate the relevancy of the text component to the application ontology. For
this Heuristics Processor is used. Each individual heuristic processor evaluates the relevancy
of a document to the application ontology. Then a measure for each individual heuristic is
normalized as a confidence measure in the range from 0 to 1. The higher the confidence
value, the more confidently the text component is considered to be appropriate for the
application ontology for the particular heuristic.
Figure 3.5 Ontology Development and Matching for Project Documents
Text Preprocessing Project
documents Normalization
LSA using SVD
Approach
Ontology
Development
Ontology Matching
Similarity Index

___________________________________________________________________________
___________________________________________________________________________
60
3.3.2 Process of Applying Heuristic to Ontology
Application ontology is defined as a conceptual-model instance that describes a real-world
application in a narrow, data-rich domain of interest.
Now, given the application ontology O and a new text document d = [td], m heuristic rules
will be used to compute m confidence measures Htd = (h1, h2, ..., hm) for text component and
form a heuristic vector dH =<Htd>. Then the document is categorized either in a concept class
cP, which represents positive (relevant to the application), or in cN, which represents
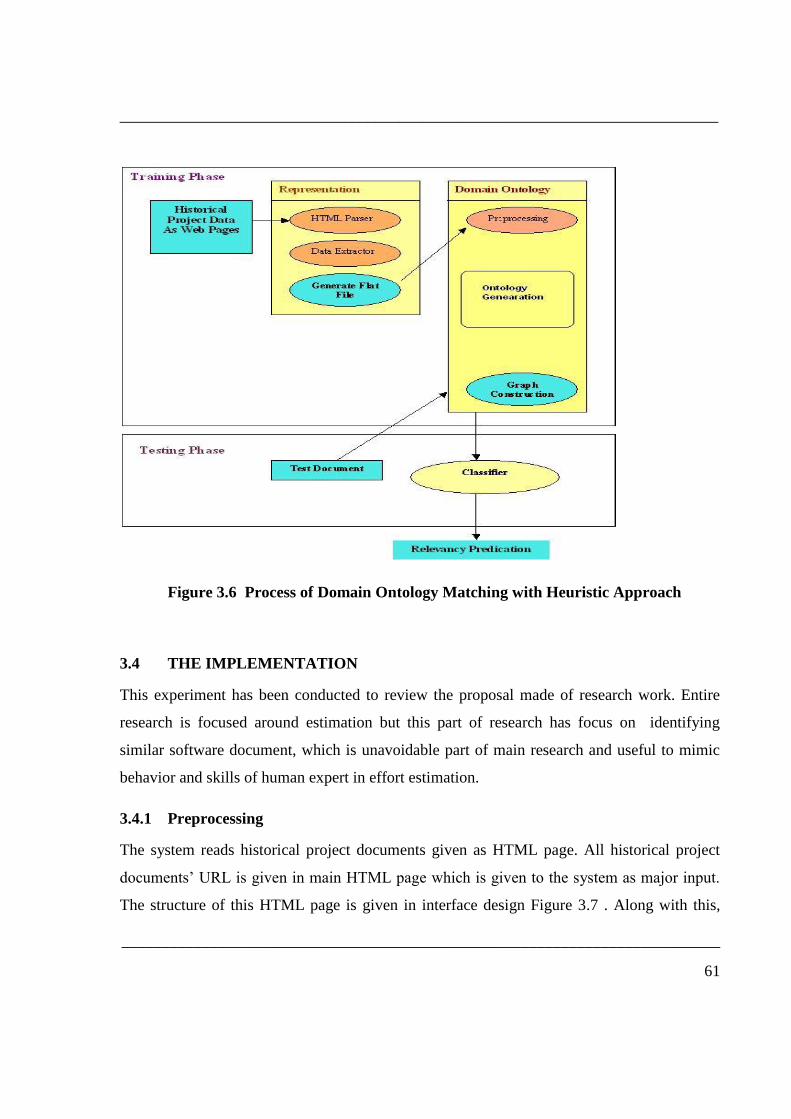
negative (irrelevant to the application). The two phases of process are shown in Fig. 3.6.
3.3.2.1 Training phase
In the training phase, the learner is trained using a Training Classifier. Here supervised
learning is used to train the learner. For each application, a human expert selects a set of
HTML documents for the application ontology as Training Documents. The human expert
provides the learner with Training Data as follows. For each training document d, the expert
creates a training example either for the document text component in d. A training example,
e = (Hx, cy), is a list of values Hx, one for each heuristic rule, plus a concept class cy, which
is either cP for a positive training example or cN for a negative training example.
3.3.2.2 Test phase
In the test phase, a set of text documents are used to evaluate the performance of the learner
trained in the training phase for the application ontology O. The output is a prediction about
the relevancy of d to O.
___________________________________________________________________________
___________________________________________________________________________
61
Figure 3.6 Process of Domain Ontology Matching with Heuristic Approach
3.4 THE IMPLEMENTATION
This experiment has been conducted to review the proposal made of research work. Entire
research is focused around estimation but this part of research has focus on identifying
similar software document, which is unavoidable part of main research and useful to mimic
behavior and skills of human expert in effort estimation.
3.4.1 Preprocessing
The system reads historical project documents given as HTML page. All historical project
documents‟ URL is given in main HTML page which is given to the system as major input.
The structure of this HTML page is given in interface design Figure 3.7 . Along with this,

___________________________________________________________________________
___________________________________________________________________________
62
system also reads new project proposal again in HTML format as shown in Figure 3.8 . When
user clicks on Browse button, file chooser appears to select the file.
Figure 3.7 Interface to list of software project documents
These inputs are converted to text documents as both the algorithms work with text
documents. Validate method checks whether historical documents‟ URL path and name is
correct or not. Historical project documents and retrieves all hyperlinks from the HTML
document and prepares a text file, which stores these URLs, which are read one by one and
written to the text file by previous method. The corresponding HTML file pointed by URL is
converted to individual project HTML document to text file. The project definition part is
stored in text file.
As per the scheme presented Latent Semantic Analysis as well as Ontology is developed and
heuristics for matching are applied.

___________________________________________________________________________
___________________________________________________________________________
63
Figure 3.8 Semantically matched document by methods involving
LSA & Ontology
3.4.2 LSA Application
After preprocessing, relevant words are found from all documents, word-by-document
matrix is formed for all documents. Application of SVD on this matrix resulted into three
different matrices, U, V and S. Further dimension reduction and reconstruction steps has
been applied. The resultant matrix has been used to analyze terms and documents. Also term
matrix and document matrix has been formed. The correlation between terms or between
documents is found. The entire view of the method is given in Figure 3.9. New software
project document also gets added as last row of the matrix and we get the correlation of new
document with all the other documents. This vector is sorted in decreasing order and first

___________________________________________________________________________
___________________________________________________________________________
64
three or four projects along with project ID, project name and correlation values are displayed
as indicated in Figure 3.8.
3.4.3 Similar Document Identifying by using Ontology with Heuristics
Another experiment is carried to represent ontology by means of bi-partite graph and using
heuristic to identify software project document from historical knowledgebase similar to the
new software project document. Once similar projects are identified, their historical data is
used for estimation for current project in hand for estimation.
Initial steps viz. preprocessing, stemming, normalization, document-word matrix creation
and dimension reduction are identical to the LSA method.
Figure 3.9 Intermediate Ontology Generated for Experiment

___________________________________________________________________________
___________________________________________________________________________
65
3.4.3.1 Ontology Construction & Graph Generation
Constructing document ontology is essentially building concept nodes from term matrix (U)
and document matrix (V), which are obtained from SVD. Concept node contains information
about its name and their weights. Each column in document matrix corresponds to concept
node and row to term node. Ontology graph is generated from term matrix U and term
names. From vector Ui, low correlation terms are eliminated. The concept node is connected
to all terms in Ui and term nodes are connected to concept nodes. Sample ontology is shown
as indicated in Figure 3.10.
Figure 3.10 Sample Ontology with descending order correlation
values of document
___________________________________________________________________________
___________________________________________________________________________
66
3.4.3.2 Applying heuristics for Similarity
The GUI is developed to examine and manipulate ontology. Bipartite graph, concept list,
term list, and category list is displayed. This can be modified easily to correct automatically
generated relationship. The density heuristics helps user to categorize the document
manually. The document and category relationship is displayed in Figure 3.10. The category
of new RFP / SRS proposal is assigned. The list of documents having higher correlation in
same category is generated as similar documents with similarity index shown in Fig 3.8.
3.5 ONTOLOGY DEVELOPMENT AND MATCHING FOR SRS DOCUMENTS
USING WORDNET
Another approach is evaluated for Software project document such as SRS is prepared at the
initial stages of software development. The proposal is made here to match SRS document to
confine the search of similar project narrowed down to small set of project documents.
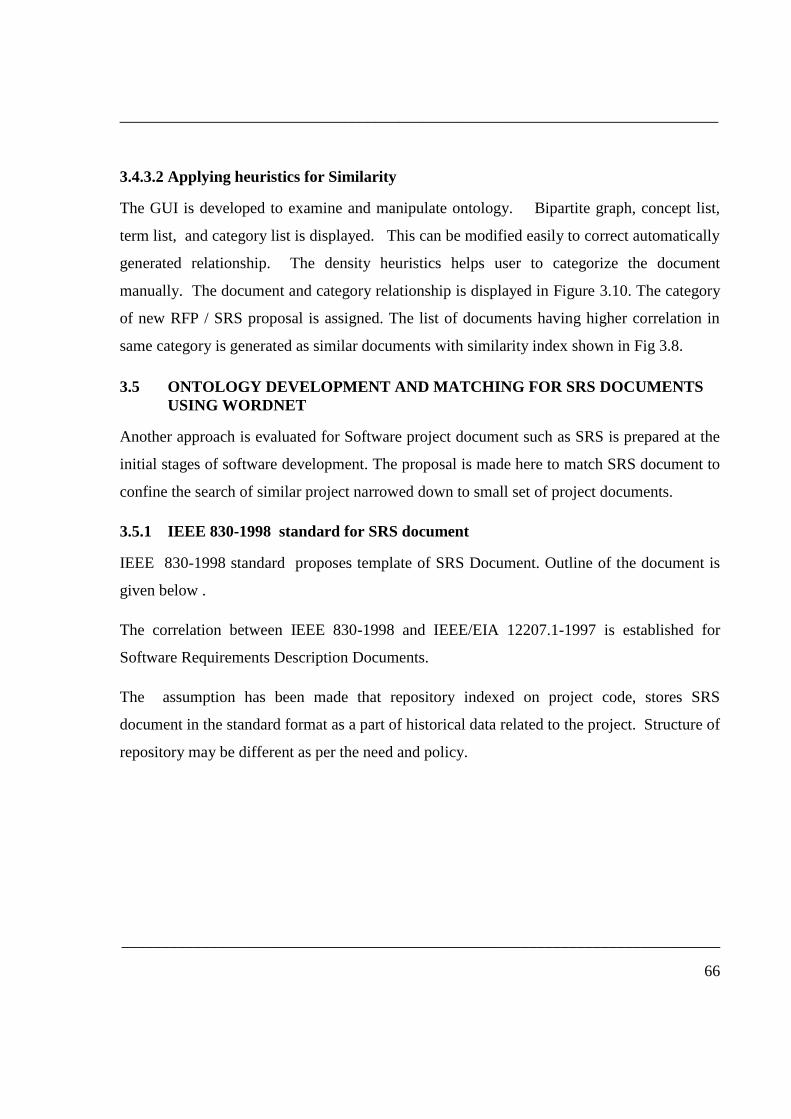
3.5.1 IEEE 830-1998 standard for SRS document
IEEE 830-1998 standard proposes template of SRS Document. Outline of the document is
given below .
The correlation between IEEE 830-1998 and IEEE/EIA 12207.1-1997 is established for
Software Requirements Description Documents.
The assumption has been made that repository indexed on project code, stores SRS
document in the standard format as a part of historical data related to the project. Structure of
repository may be different as per the need and policy.
___________________________________________________________________________
___________________________________________________________________________
67
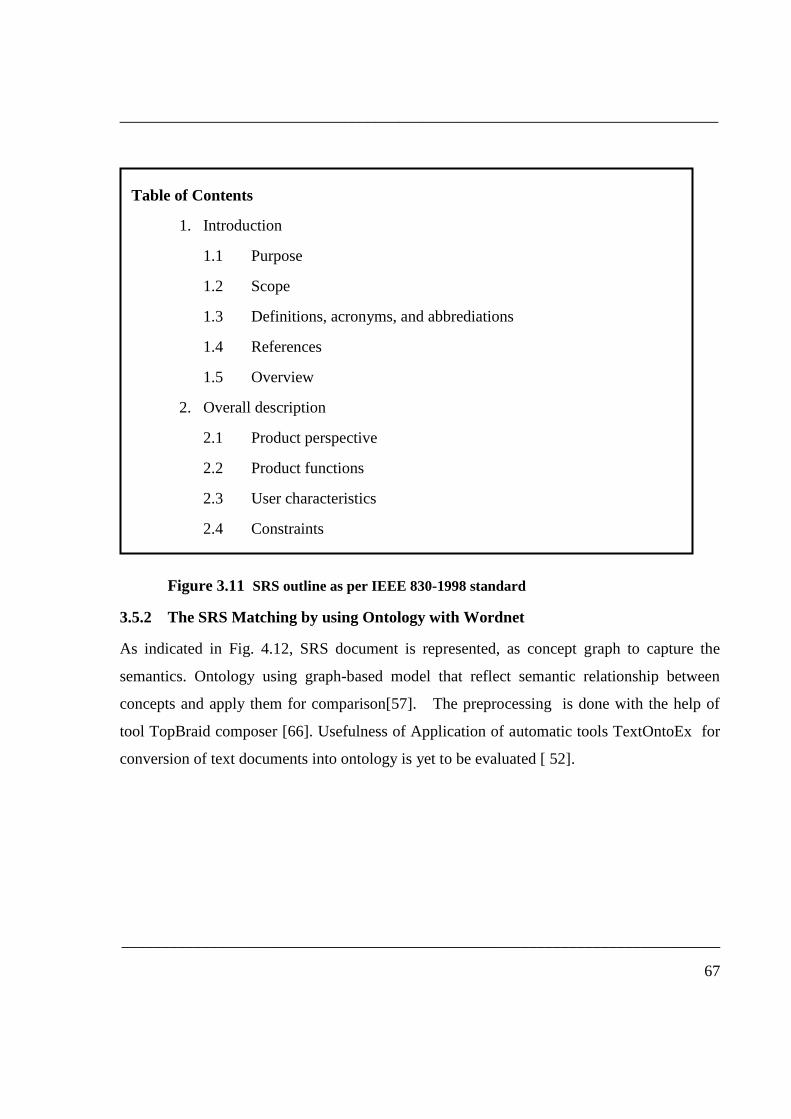
Figure 3.11 SRS outline as per IEEE 830-1998 standard
3.5.2 The SRS Matching by using Ontology with Wordnet
As indicated in Fig. 4.12, SRS document is represented, as concept graph to capture the
semantics. Ontology using graph-based model that reflect semantic relationship between
concepts and apply them for comparison[57]. The preprocessing is done with the help of
tool TopBraid composer [66]. Usefulness of Application of automatic tools TextOntoEx for
conversion of text documents into ontology is yet to be evaluated [ 52].
Table of Contents
1. Introduction
1.1 Purpose
1.2 Scope
1.3 Definitions, acronyms, and abbrediations
1.4 References
1.5 Overview
2. Overall description
2.1 Product perspective
2.2 Product functions
2.3 User characteristics
2.4 Constraints
2.5 Assumptions and dependencies
3. Specific Requirements
3.1 External interface requirements
3.2 Functional requirements
3.3 Performance requirements
3.4 Design constraints
3.5 Software system attributes
3.6 Other requirements

___________________________________________________________________________
___________________________________________________________________________
68
Figure 3.12 Finding similar SRS Documents from repository using Wordnet.
In order to achieve semantic similarity as indicated in Fig. 3.12, the project documents are
first represented in ontological form. This method provides the list of documents by
identifying similarity between the terms of two ontologies. The method is based on the use of
the lexical database defined by WordNet[55] and the application of semantic similarity
algorithm [57]. This concept has been applied specifically to obtain a list of software project
documents i.e. SRS in the repository similar to the SRS document at hand. The similar
project‟s historical data can be used for the estimation of current project in hand. The attempt
has been made to mimic the process of applying knowledge by human expert estimator.
Input SRS
Document
Tag-By-Tag
Comparison
Extract XML tags
Similarity Measure
Computation
WordNet API
List of matched
documents
Repository
Relationship Depth
Construction
Comparison with
Threshold Value

___________________________________________________________________________
___________________________________________________________________________
69
The given subsystem accepts software projects represented in standard IEEE 830-1998 SRS
format as input given below :
The contents under the sections Scope, Purpose, Overview, Product Perspective and Product
functions are compared. These sections of SRS document are sufficient to get an idea of
what the overall project is doing. The objective is to compare the current project‟s SRS
document with all the project‟s SRS documents in the repository and display a measure of the
similarity with each. Matched SRS documents are listed in descending order of matching
percentage.
SRS document is presented in the form of an XML document such that it is feasible to extract
knowledge from it. Each section heading in the SRS document is represented as an XML tag.
The content under each section is further divided into XML sub-tags to obtain in depth
knowledge representation for ease of syntax and semantic analysis. This is the first step
called ontology creation.
The tag-by-tag semantic comparison of the two documents is carried. This is accomplished
with the help of WordNet lexicon. The meanings of the tags has been compared rather than
just a simple letter-by-letter word comparison. WordNet also helps to determine the
relationship between the tags-whether they are synonyms, hyponyms etc. This comparison
returns the depth of the relationship between the two words by constructing a relationship
tree. This depth is used by algorithm to compute the measure of similarity between the two
documents.
To determine whether the two words are similar or not, threshold measure for the depth
returned by WordNet has been set. If the value of the depth is below this threshold, the two
words are considered to have some degree of similarity. If this threshold is exceeded the two
words are considered to be dissimilar. The value of depth is computed in a manner in which a

___________________________________________________________________________
___________________________________________________________________________
70
lower absolute value of depth implies a higher degree of similarity. Conversely, a higher
absolute value of depth implies a very low degree of similarity or even dissimilarity.
This procedure is repeated for all the XML tags. A count is maintained of the number of tags
for which the value of depth falls below the preset threshold. The form of weighted average is
used to compute the final similarity measure. The tags which are higher in the hierarchy are
assigned higher values for the weight as compared to the tags which are lower in the
hierarchy. The similarity measure is in percentage form and is the final output of the system.
This procedure is repeated for each document pair. The matching process is elaborated in
algorithm as below
1. The SRS of the current project is represented as an ontology using XML as the
representation language.
2. The repository contains the historical documents against which the current document
is to be compared. The SRS of these documents has already been converted to an
ontological form using XML.
3. Tag extraction forms the next part of the process. The ontologies are scanned line by
line and the tags are extracted. These tags represent the various subheadings of the
SRS document such as Scope, Purpose, Product Overview, Product Perspective and
Product Functions.
4. The content of these tags is then compared. WordNet is used to discover the
relationship between the tags-it checks whether they are synonyms, hypernyms,
hyponyms, etc. We also generate the depth of the relationship between the words.
This depth provides an indication of the similarity-the lower the depth, greater the
similarity and the higher the depth, the lower the similarity.

___________________________________________________________________________
___________________________________________________________________________
71
5. Threshold value is set as 7. If the depth exceeds this threshold, the two documents are
considered dissimilar and are not compared further. However, if the depth is less than
seven, the documents are further processed to obtain a more detailed similarity
measure.
6. The relationship trees of the documents are compared. Here we compare each node
and maintain a count of the number of nodes for which the depth is less than 7.
7. Next, weights are assigned to each node depending on the level of that node in the
tree. The lower the level of the node, higher is the weight assigned to it. Next, a
weighted average of all the counts is computed.
8. This weighted average is called the similarity measure. This similarity measure is then
mapped to a range of percentages. The corresponding range is then output as the final
similarity measure of the two documents.
9. This procedure is repeated for each pair of documents.
3.6 RESULT AND DISCUSSION
Experiments have been conducted for evaluation of each model. AI models have been
categorized below as per stages in software developmeny Models. This section provides
results for the same.
Table 3.1 : Software estimation involving AI technologies at stages
Initial Stage Intermediate Stage
RFP document matching :
LSA & Ontology with SGM ANFIS with COCOMO II
SRS document matching using
Ontology with Wordnet
Combined Estimation : Function point,
Usecase point and Class point sizing
based

___________________________________________________________________________
___________________________________________________________________________
72
3.6.1 Software Project Document Matching
The proposed model use results from two methods LSA & Ontology extraction from text
documents using bi-partite graph to find similar project from a collection of RFP documents.
3.6.1.1 Experiment No.1 : Semantic Matching of Test Document by only LSA Method.
The LSA method is tested with following six documents. Here instead of RFP documents,
gist of abstracts of projects completed in computer engineering departments are selected. Out
of these first three project documents are in security area (S Group) and remaining are in
distributed computing area (D group).
(S1) Motion Detection in security systems
The project takes help of Image Processing Techniques for detecting objects that intrude a
prohibited area. A camera interfaced with the computer takes pictures of intruding objects
and detects their motion. It then warns the people for security.
(S2) Email Security using Fingerprint Recognition
The project aims to provide security for email by combining fingerprint recognition and
cryptography. The information to be sent via email is encrypted and then only the intended
recipient can decrypt it after verifying his fingerprint.
(S3) Automated Printing System for Voter ID card
The project aims at building integrated equipment by putting together components which will
have facilities for image capture, photo identification and authenticate the voter at the time
through finger – print recognition.

___________________________________________________________________________
___________________________________________________________________________
73
(D1) Helios: Cluster Development and Deployment Solution
Helios is proposed project that can effectively deploy clusters with the minimum possible
hassle for installing and configuring systems, at the same time it proposes developing a
distributed file system that can allow us faster deployment and better performance in terms of
amount of data storage, availability.
(D2) The Distributed Database
It deals with data storage and retrieval. When scaling of data is to large extent, it deals with
distributing the data on various machines, and hence distributing the computational as well as
storage burden on the various machines.
(D3) Load Balancing in Computational Grid
The project deals with efficient assignment of tasks and utilization of resources, commonly
referred to as load balancing problem. It tries to balance a total system load by transparently
transferring the workload from heavily loaded nodes to lightly loaded nodes in an attempt to
ensure good overall performance.
Table 3.2 Correlation array using reconstructed word by Context Matrix after
applying SVD in LSA Method
S1 S2 S3 D1 D2 D3
S1 0.99 0.89 0.81 -0.33 -0.68 -0.43
S2 0.89 0.99 0.83 -0.29 -0.65 -0.39
S3 0.81 0.83 0.99 0.28 -0.12 0.18
D1 -0.33 -0.29 0.28 0.99 0.92 0.99
D2 -0.68 -0.65 -0.12 0.92 0.99 0.95
D3 -0.43 -0.39 0.18 0.99 0.95 0.99

___________________________________________________________________________
___________________________________________________________________________
74
The result in Table 3.2 indicate that the projects of similar domain show higher correlation
values whereas different domains it gives negative value for correlation. By applying LSA
most similar documents with document in hand can be identified by observing correlation
value. This is based on context, instead of word-word matching, hence semantically similar
documents indicated higher correlation.
3.6.1.2 Experiment No. 2 : Semantic Matching of test documents using Ontology with
LSA
The experiment has been conducted with the document set, representing repository. Thirty
Five project documents of different domains such as robotics, face recognition, distributed
computing, stegenography and stock market are selected. These documents are abstracts of
students projects completed. With the help of application five categories are generated. One
document may belong to various categories. For example, face recognition could be part of
security as well as image processing. Each document has been assigned ID which is
combination of year and name separated by underscore. The GUI provides facility to assign
category manually.
The result is depicted in Table 3.3. First column represent the list of document to be
matched. Second column indicates list of documents (at the most three), which are found
similar from repository. Third column indicates percentage matching found by human
expert. Faculties were requested to read the documents and find similar documents along with
percentage of similarity. Fourth column indicates matching percentage of documents in
second column with the document listed in first column, by LSA method only. Fifth column
indicates matching percentage of documents in second column with the document listed in
first column, by ontology matching method. Sixth column indicates resultant percentage by
heuristic to combined method.
The result generated by two method, is compared with the percentage of matching, suggested
by human expert, which is listed in third column. MSE of LSA is 383.99 where MSE of

___________________________________________________________________________
___________________________________________________________________________
75
Ontology is 13.24. MSE of averaged values of both methods is 70.41, not looking
promising. MSE of values of combined methods by applying heuristic is 13.14, looked more
promising compared to only ontology. The heuristic derived empirically, by observing result
is as follows
If the difference in relevance of two methods is less than ten, then higher value is
reflected as combined result; otherwise smaller value is reflected as combined result.
This heuristic is neutral to the human expert values. It has been observed that, similarity
percentage derived by ontology method are close to percentage of matching suggested by
human but further combination of both method by applying heuristic are more close to the
percentage of matching suggested by human expert. This is supported by mean squared error
values.
In the first test case one of the historical documents is compared with repository documents,
which is giving 90-100 percent matching. In second test case same document‟s meaning is
conveyed in different words, and then matched with repository documents, which is also
giving 90-100 percent matching.
The output is set of project identifiers, which match with the new proposal. The project
identifiers are stored along with the percentage match in XML file. Now estimation model
can use this data available from these past projects for estimation.

___________________________________________________________________________
___________________________________________________________________________
76
Table 3.3 Comparison of Two Semantic Matching Methods with human expert
Project Human
Expert LSA Ontology Applying
Heuristics
P2005003_ Steganography4
P2005003_Steganography4 100 100 100 100
P2005001_Steganography2 30 45.75 28.1 28.1
P2005002_Stegnography6 20 31.5 19.8 19.8
P2008001_ Stegano
P2005003_Steganography4 100 100 100 100 P2005001_Steganography2 30 46.35 29.59 29.59 P2005002_Stegnography6 20 35.00 21.09 21.09
P2005004_ Steganography5
P2005001_Steganography2 86 95.89 84.7 84.7 P2005002_Stegnography6 25 27.85 21.9 27.85 P2005003_Steganography4 15 50.0 6.7 6.7
P2001001_ ImageFusion
P2002003_Facereco 35 50.00 31.2 31.2 P2006003_Waveletfacerecog 25 46.25 19.8 19.8 P2002004_Fastfacerecog 12 41.1 8.7 8.7
P2003004_ stockmgmt
P2003001_stock 35 47.85 31.2 31.2 P2003002_stockportfolio 37 49.4 31.2 31.2 p2003003_stockanalysis 8 49.4 4.39 4.39
MSE 383.98 13.24 13.14
3.6.1.3 Experiment No.3 : Semantic Matching of another document by two methods
The experiment is conducted to demonstrates testing of new test document dtest1.html. The
title of the software project is “Distributed shared memory project”. Figure 3.13 indicates
how new document is categorized by ontology matching. Figure 3.14 indicated relevancy
prediction of test document with relevancy indicator values, which in turn is used to identify
most relevant, i.e. similar documents.

___________________________________________________________________________
___________________________________________________________________________
77
Figure 3.13 Categorization of Project Document “Dtest1.html”

___________________________________________________________________________
___________________________________________________________________________
78
Figure 3.14 Relevancy prediction of Test Document “Dtest1.html” by Ontology
matching
As indicated in Figure 3.15, the output of LSA methods listed three documents namely,
P2004004_DSM.html, P2003002_GridComputing.html, and P2004004_SDSM.html with
relevancy values 0.99, 0.982 and 0.975 respectively. Ontology method gives

___________________________________________________________________________
___________________________________________________________________________
79
P2004004_SDSM.html, P2003002_GridComputing.html and P2003003_gridengine.html
with values 0.999, 0.972 and 0.75 respectively. Now the final result set will consider SDSM
and Grid Computing documents as they are common and will find average 0.987 and 0.977
respectively.
Figure 3.15 Combined result of semantically matched documents with
Project document “Dtest1.html”

___________________________________________________________________________
___________________________________________________________________________
80
Figure 3.16 indicates the semantic matching of yet another project document “rtest3.html”
which is related to Robotics.
Figure 3.16 Combined result of semantically matched documents with
Project document “rtest3.html”

___________________________________________________________________________
___________________________________________________________________________
81
3.6.2 Semantic Matching of documents by integrating Wordnet
An attempt has been made to measure similarity between documents. Tests has been
conducted on smaller tree sections. It has been observed that combination of methods such as
LSA, Ontology with Wordnet gives satisfactory results but not worth to mention. It has
been also observed that success depends on the representation of documents and requires
manual intervention for further improvement. Intermediate results obtained enabled to
develop a concept and carry research further in this direction.
3.7 SUMMARY
In this chapter two AI Models for semantic similarity of documents are evaluated by
performing separate experiments. The focus of experiment is to identify similar software
project by semantic matching of project documents. Once these similar past projects are
identified, the data of past project can be used for effort estimation of new software project at
hand.
In the first approach, RFP document in hand is matched with RFP documents in the
repository. Instead of relying on one method two recent methods viz. LSA and Ontology
matching are used. Both of these method involves AI technology such as knowledge
processing. In second approach, Semantic Similarity of document is derived by matching
semantic graph using Wordnet. SRS document has standard structure, hence this approach is
more suitable. RFP document is more generic without any standard format. These AI models
are surely useful while developing comprehensive software effort estimation tool.
LSA method results are found encouraging. Though this method is generic, it is applied with
RFP documents. Ontology generation and matching is still challenging today. LSA result
helped to identify the concept hence categories could be defined. Matching of documents get
simplified if the category or categories of document can be identified. The search of
matching document gets confined to those categories only.