Chapter 3 Central Tendency - iMadhatter · Chapter 3 Central Tendency PowerPoint Lecture Slides...
40
Chapter 3 Central Tendency PowerPoint Lecture Slides Essentials of Statistics for the Behavioral Sciences Seventh Edition by Frederick J Gravetter and Larry B. Wallnau
Transcript of Chapter 3 Central Tendency - iMadhatter · Chapter 3 Central Tendency PowerPoint Lecture Slides...
Chapter 3
Central Tendency
PowerPoint Lecture Slides
Essentials of Statistics for the Behavioral Sciences Seventh Edition by Frederick J Gravetter and Larry B. Wallnau
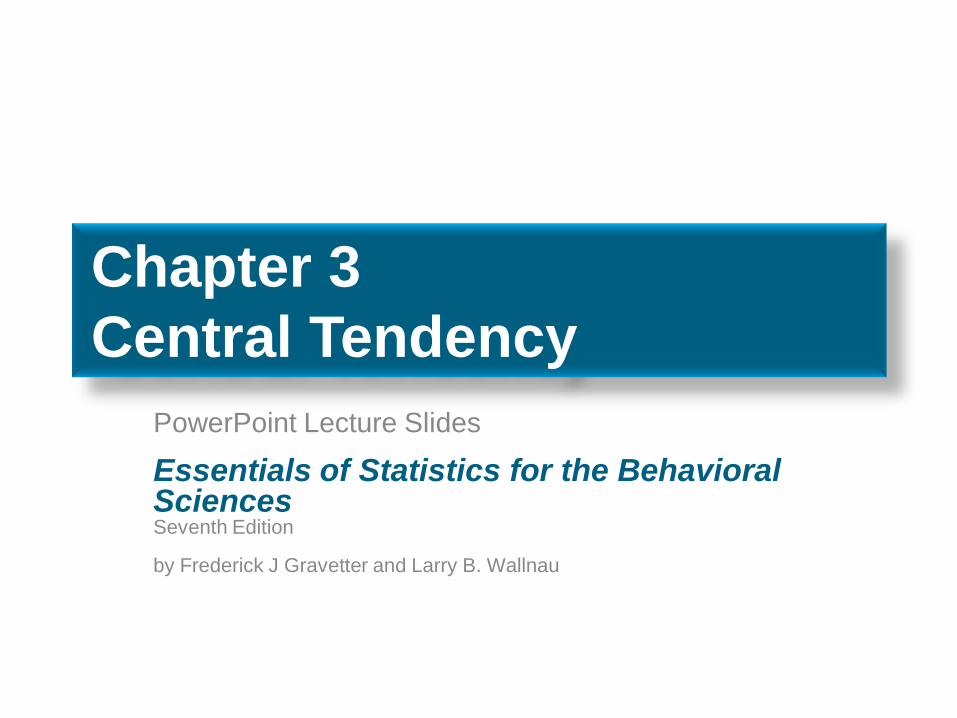
Learning Outcomes
• Understand the purpose of measuring central tendency. 1
• Define and compute the three measures of central tendency. 2
• Describe how the mean is affected when a set of scores is modified. 3
• Describe the circumstances in which each of the three measures of central tendency is appropriate to use. 4
• Explain how the three measures of central tendency are related to each other in symmetrical and skewed distributions. 5
• Draw and interpret graphs displaying several means or medians representing different treatment conditions or groups. 6
Concepts to review
• Summation notation
• Frequency distributions

3.1 Overview of central tendency
• Central tendency
– A statistical measure
– A single score to define the center of a
distribution
• Purpose: find the single score that is most
typical or best represents the entire group

Figure 3.1 What is the “center” of each distribution?
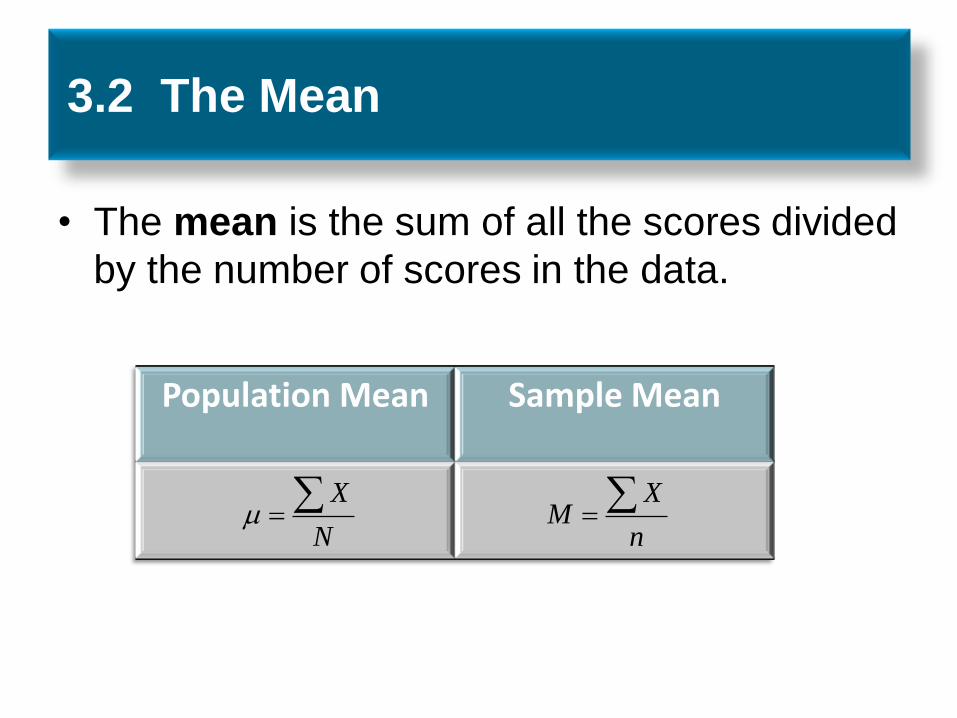
3.2 The Mean
• The mean is the sum of all the scores divided
by the number of scores in the data.
Population Mean Sample Mean
N
X
n
XM
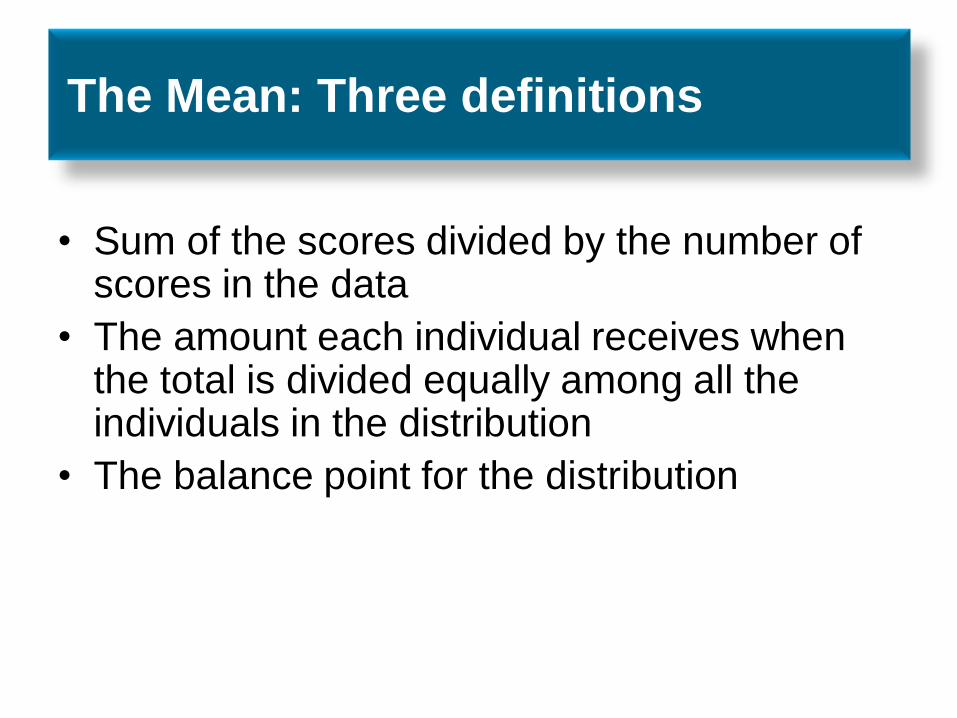
The Mean: Three definitions
• Sum of the scores divided by the number of scores in the data
• The amount each individual receives when the total is divided equally among all the individuals in the distribution
• The balance point for the distribution
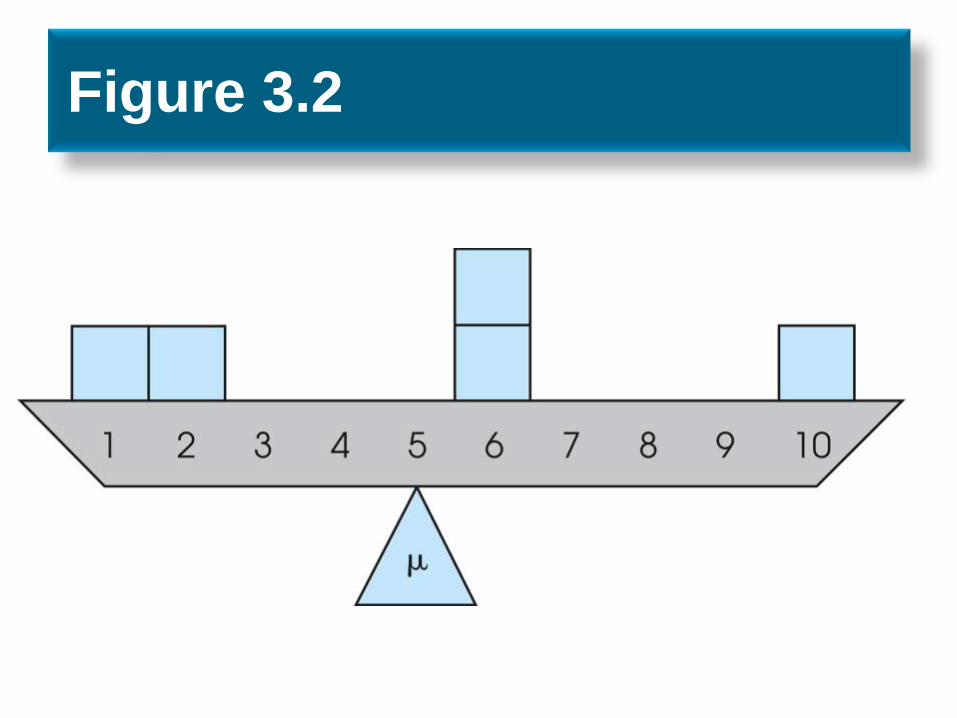
Figure 3.2
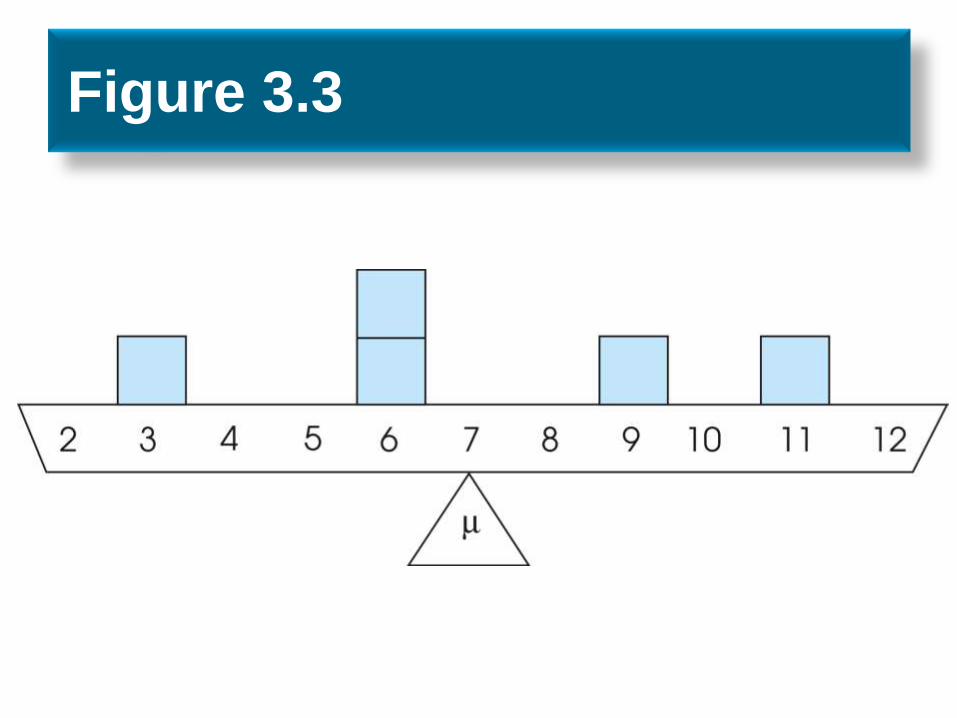
Figure 3.3
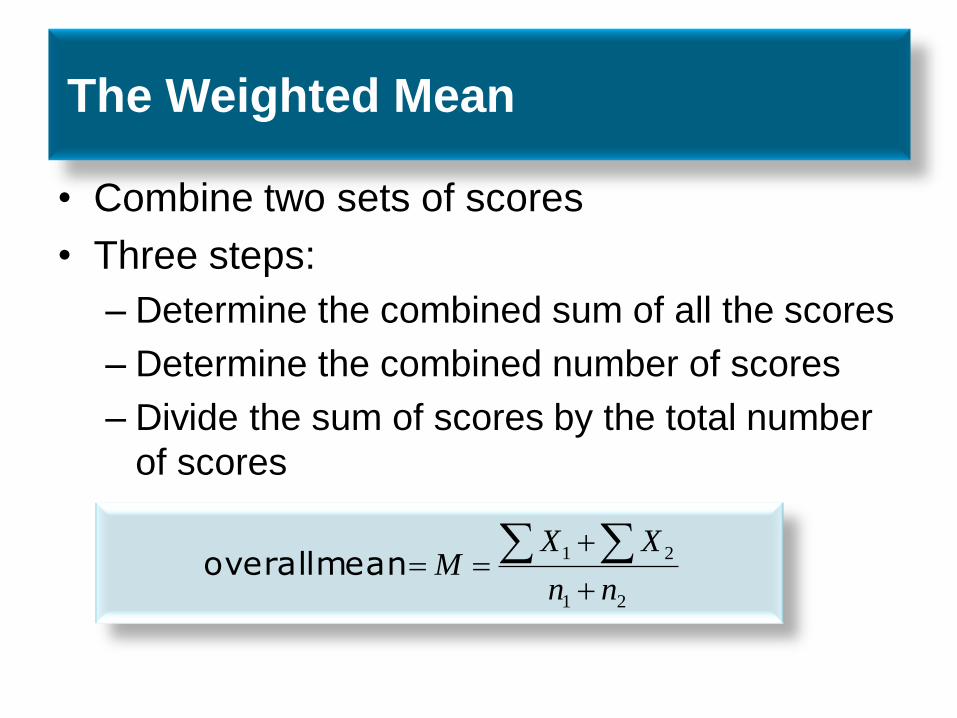
The Weighted Mean
• Combine two sets of scores
• Three steps:
– Determine the combined sum of all the scores
– Determine the combined number of scores
– Divide the sum of scores by the total number
of scores
21
21
nn
XXM
mean overall
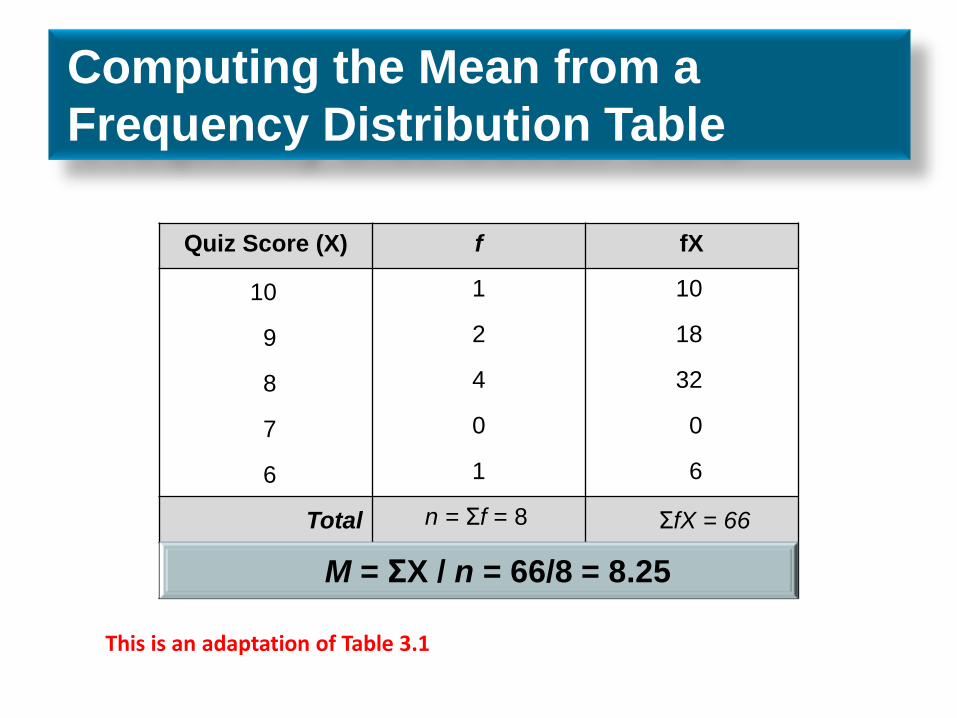
Computing the Mean from a
Frequency Distribution Table
Quiz Score (X) f fX
10 1 10
9 2 18
8 4 32
7 0 0
6 1 6
Total n = Σf = 8 ΣfX = 66
M = ΣX / n = 66/8 = 8.25
This is an adaptation of Table 3.1
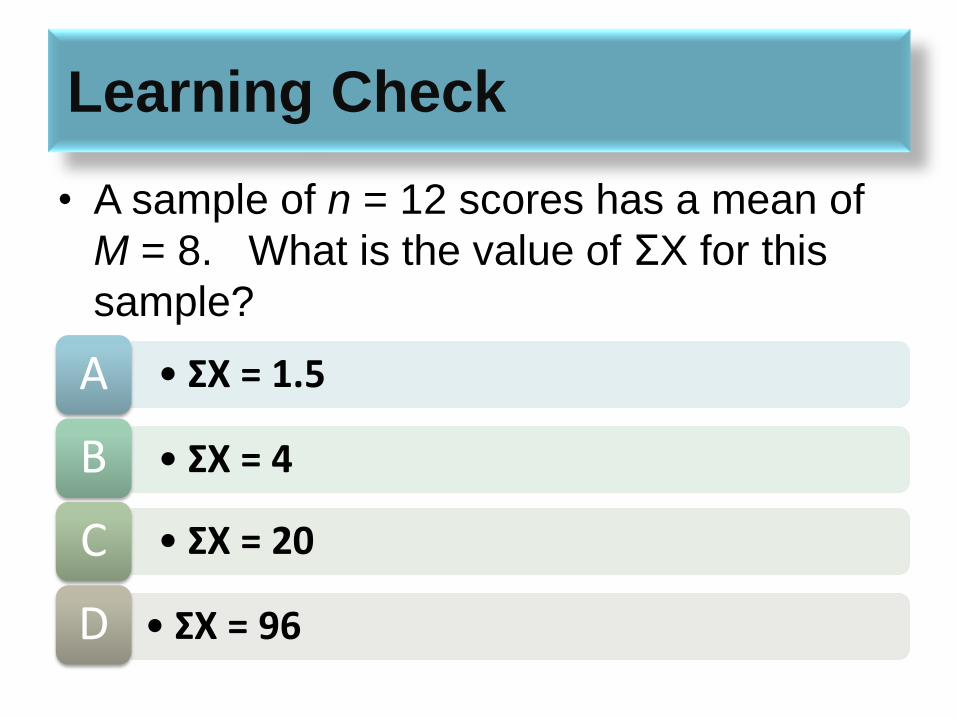
Learning Check
• A sample of n = 12 scores has a mean of
M = 8. What is the value of ΣX for this
sample?
• ΣX = 1.5 A
• ΣX = 4 B
• ΣX = 20 C
• ΣX = 96 D
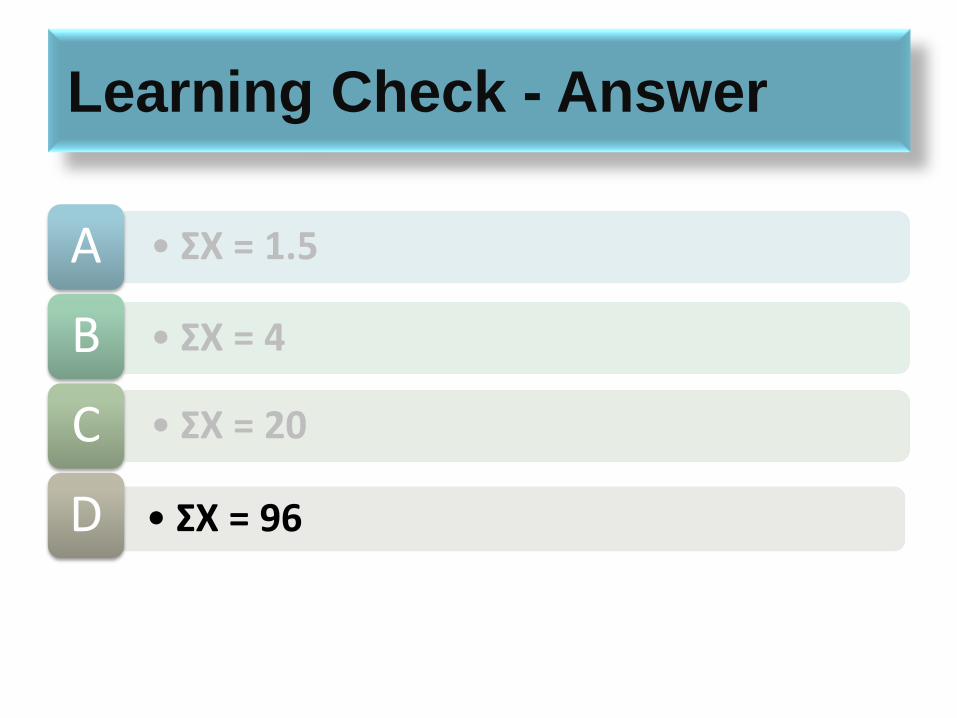
Learning Check - Answer
• ΣX = 1.5 A
• ΣX = 4 B
• ΣX = 20 C
• ΣX = 96 D

Characteristics of the Mean
• Changing the value of a score changes the
mean.
• Introducing a new score or removing a score
usually changes the mean (unless the score
added or removed is exactly equal to the mean).
• Adding or subtracting a constant from each
score changes the mean by the same constant.
• Multiplying or dividing each score by a
constant multiplies or divides the mean by
that constant.

Learning Check
• A sample of n = 7 scores has M = 5.
All of the scores are doubled.
What is the new mean?
• M = 5 A
• M = 10 B
• M = 25 C
• More information is needed to compute M. D
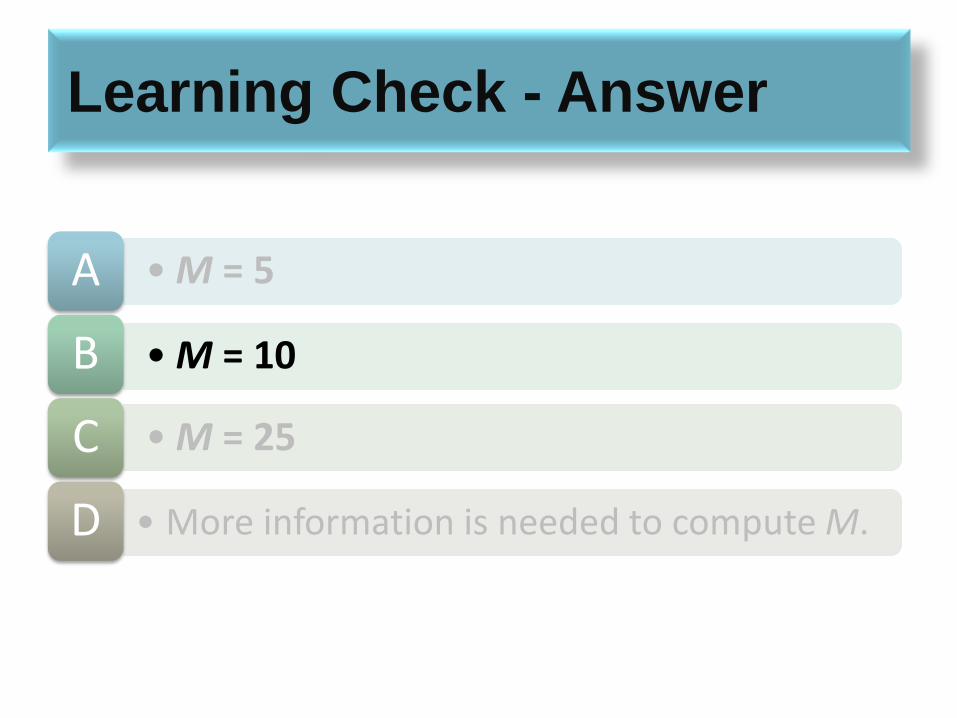
Learning Check - Answer
• M = 5 A
• M = 10 B
• M = 25 C
• More information is needed to compute M. D

3.3 The Median
• The median is the midpoint of the scores in a
distribution when they are listed in order from
smallest to largest.
• The median divides the scores into two
groups of equal size.
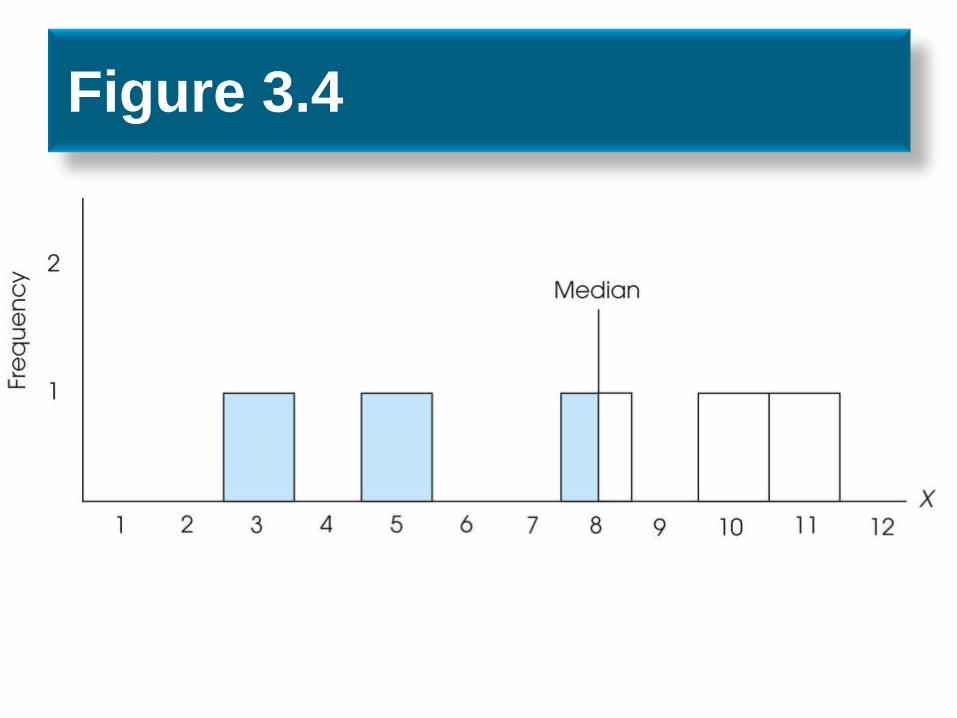
Figure 3.4
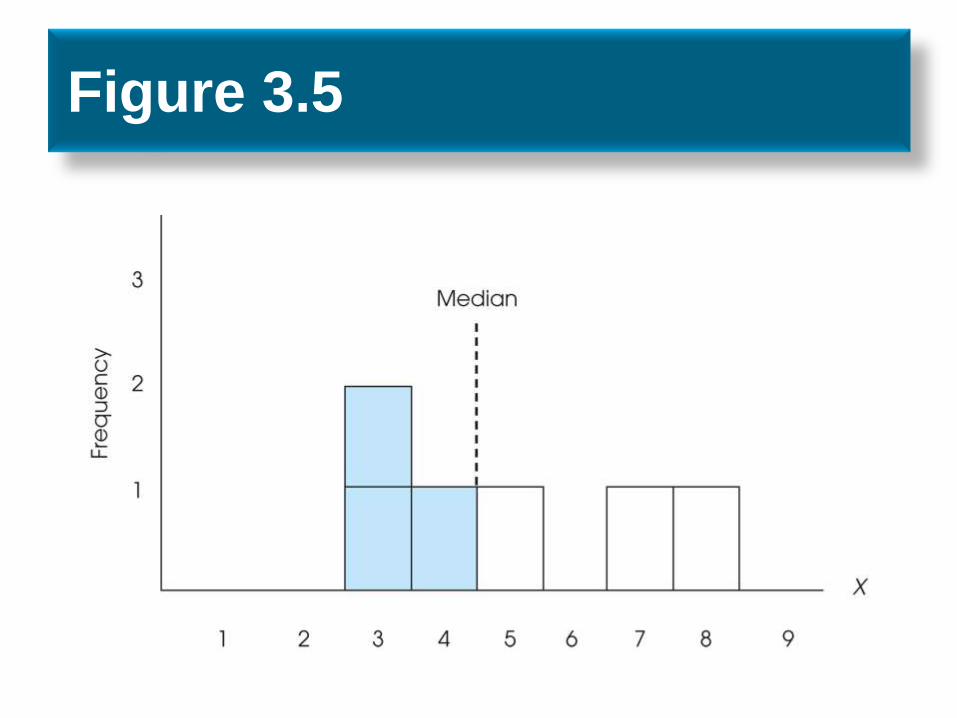
Figure 3.5

The Precise Median for a
Continuous Variable
• A continuous variable can be infinitely divided
• The precise median is located in the interval
defined by the real limits of the value.
• It is necessary to determine the fraction of the
interval needed to divide the distribution
exactly in half.
• interval in thenumber
50%reach toneedednumber fraction
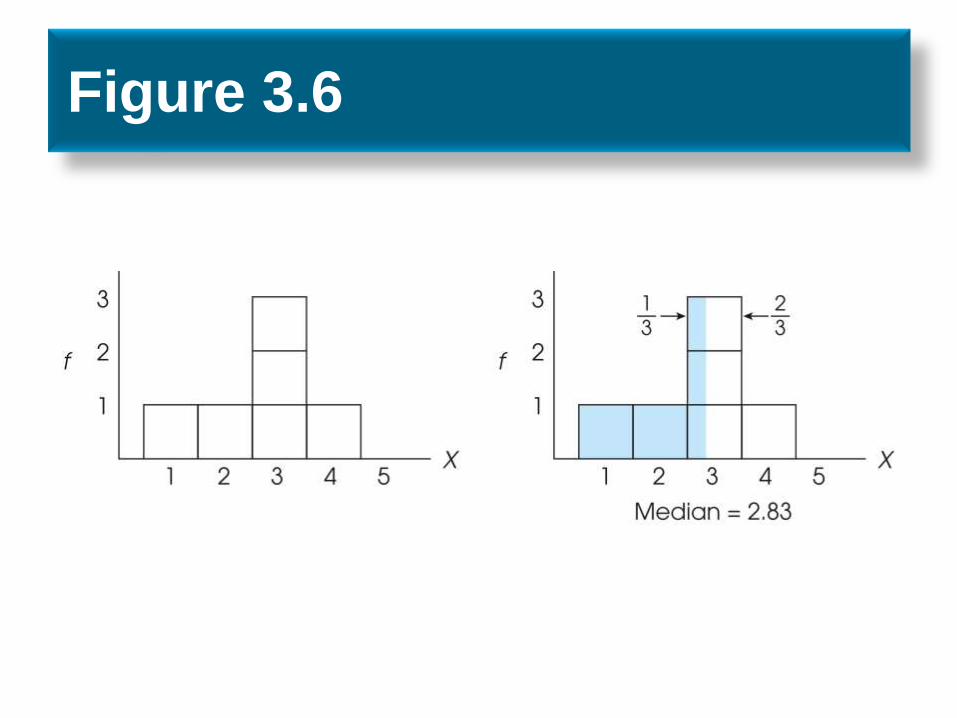
Figure 3.6
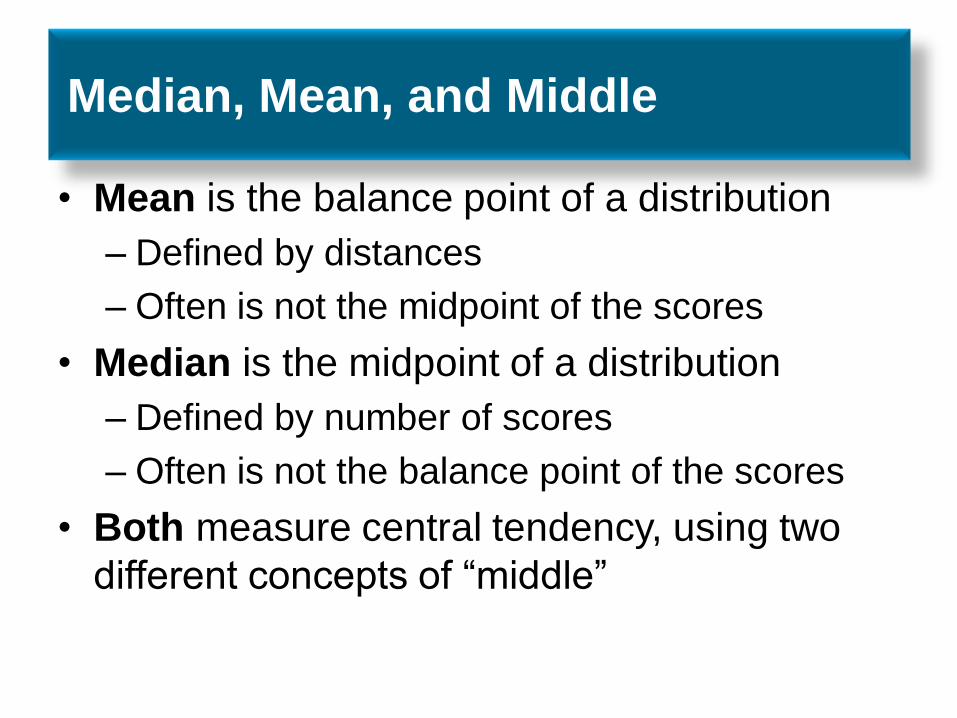
Median, Mean, and Middle
• Mean is the balance point of a distribution
– Defined by distances
– Often is not the midpoint of the scores
• Median is the midpoint of a distribution
– Defined by number of scores
– Often is not the balance point of the scores
• Both measure central tendency, using two
different concepts of “middle”

Figure 3.7

Learning Check
• Decide if each of the following statements
is True or False.
• It is possible for more than 50% of the scores in a distribution to have values above the mean.
T/F
• It is possible for more than 50% of the scores in a distribution to have values above the median.
T/F
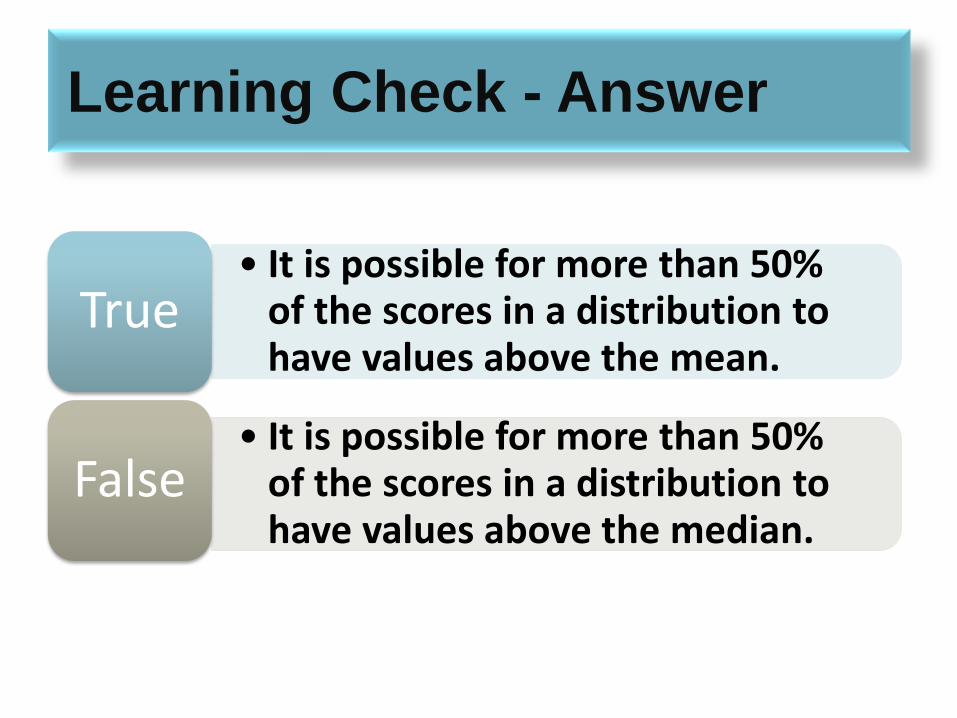
Learning Check - Answer
• It is possible for more than 50% of the scores in a distribution to have values above the mean.
True
• It is possible for more than 50% of the scores in a distribution to have values above the median.
False

3.4 The Mode
• The mode is the score or category that has
the greatest frequency of any in the
frequency distribution
– Can be used with any scale of measurement
– Corresponds to an actual score in the data
• It is possible to have more than one mode
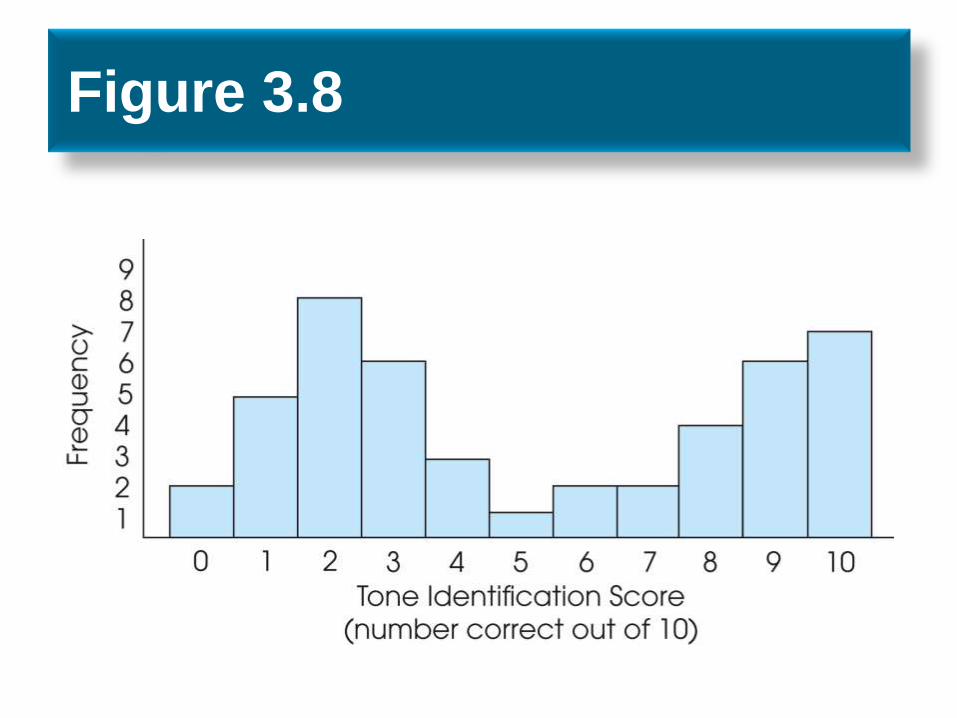
Figure 3.8
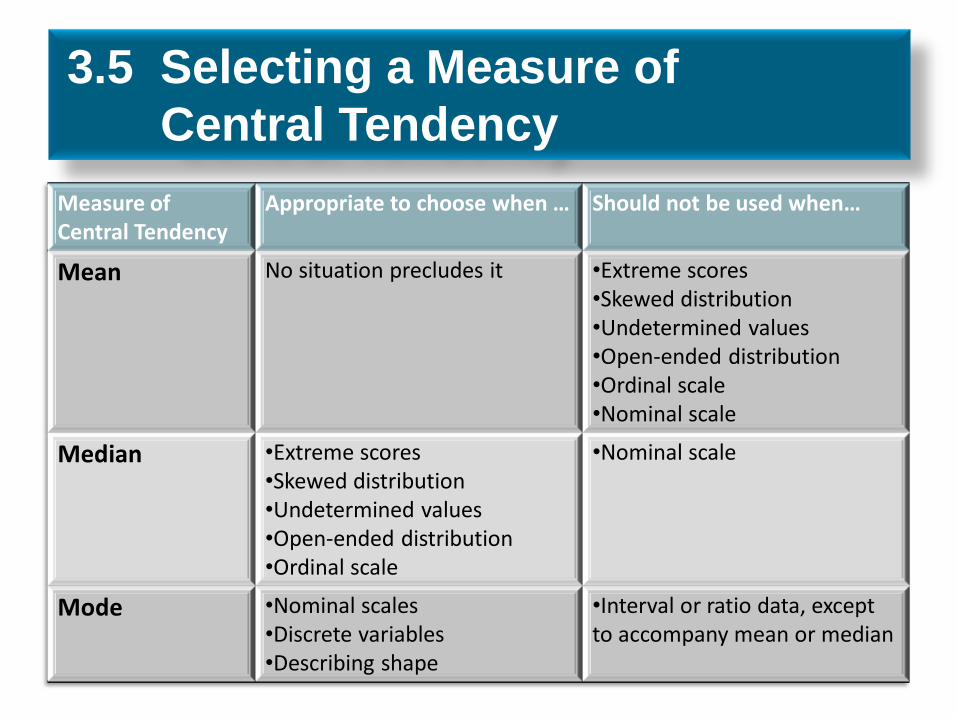
3.5 Selecting a Measure of
Central Tendency
Measure of Central Tendency
Appropriate to choose when … Should not be used when…
Mean No situation precludes it •Extreme scores •Skewed distribution •Undetermined values •Open-ended distribution •Ordinal scale •Nominal scale
Median •Extreme scores •Skewed distribution •Undetermined values •Open-ended distribution •Ordinal scale
•Nominal scale
Mode •Nominal scales •Discrete variables •Describing shape
•Interval or ratio data, except to accompany mean or median

Figure 3.9
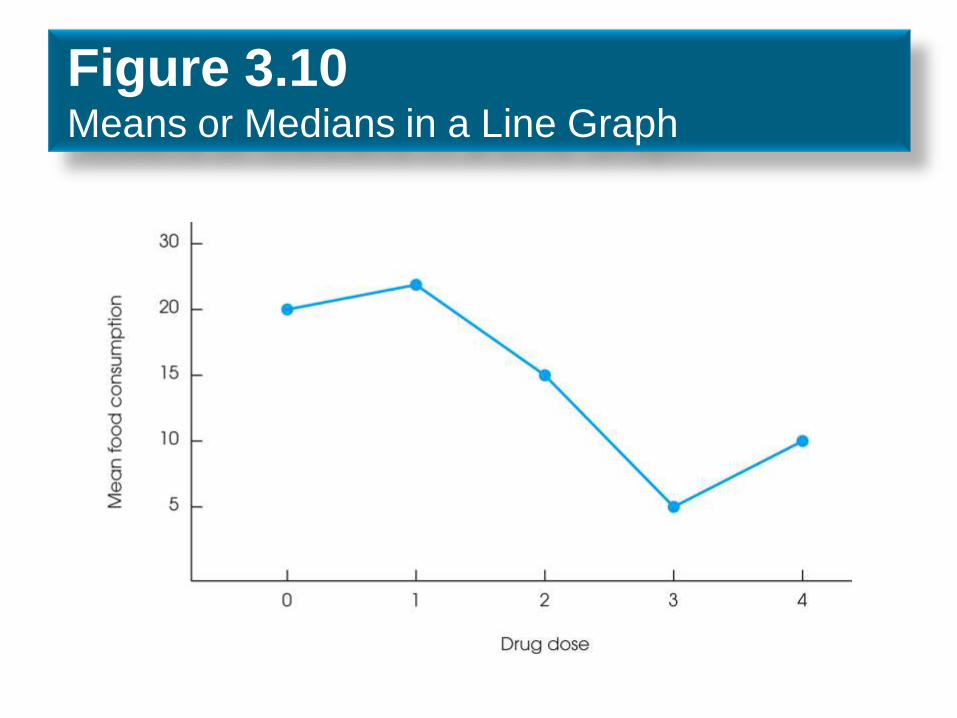
Figure 3.10 Means or Medians in a Line Graph
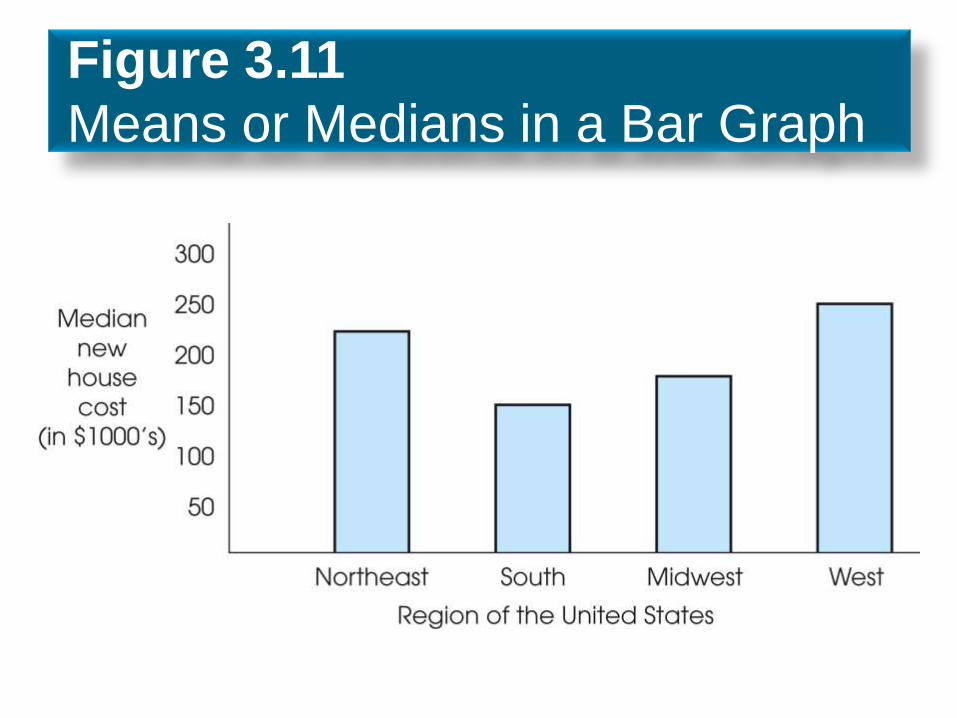
Figure 3.11
Means or Medians in a Bar Graph
3.6 Central Tendency and the Shape
of the Distribution
• Symmetrical distributions
– Mean and median have same value
– If exactly one mode, it has same value as the
mean and the median
– Distribution may have more than one mode,
or no mode at all
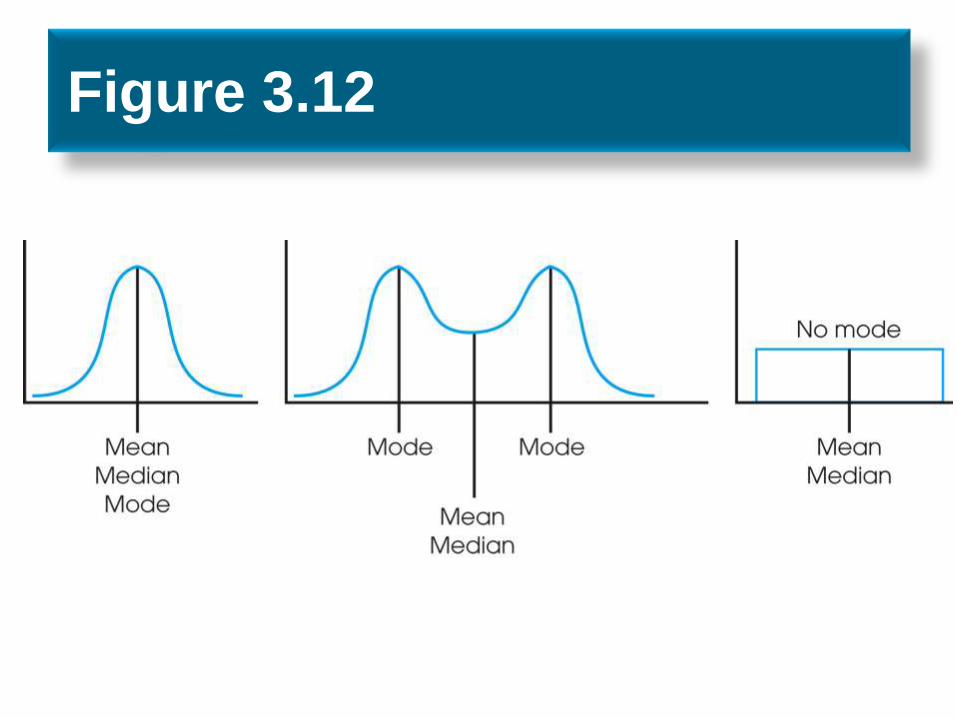
Figure 3.12
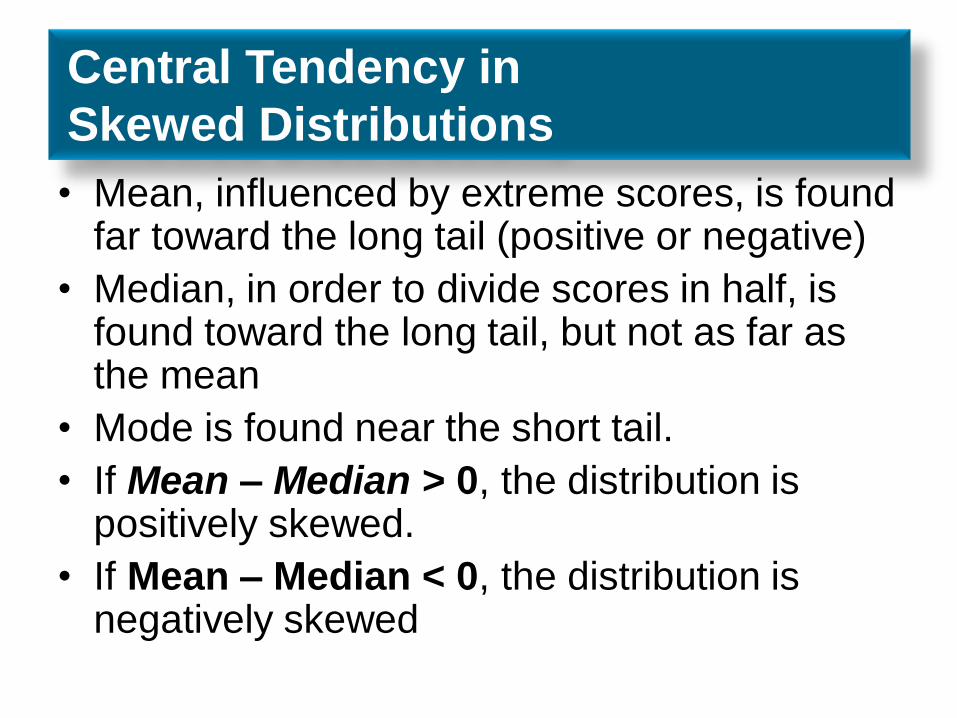
Central Tendency in
Skewed Distributions
• Mean, influenced by extreme scores, is found far toward the long tail (positive or negative)
• Median, in order to divide scores in half, is found toward the long tail, but not as far as the mean
• Mode is found near the short tail.
• If Mean – Median > 0, the distribution is positively skewed.
• If Mean – Median < 0, the distribution is negatively skewed
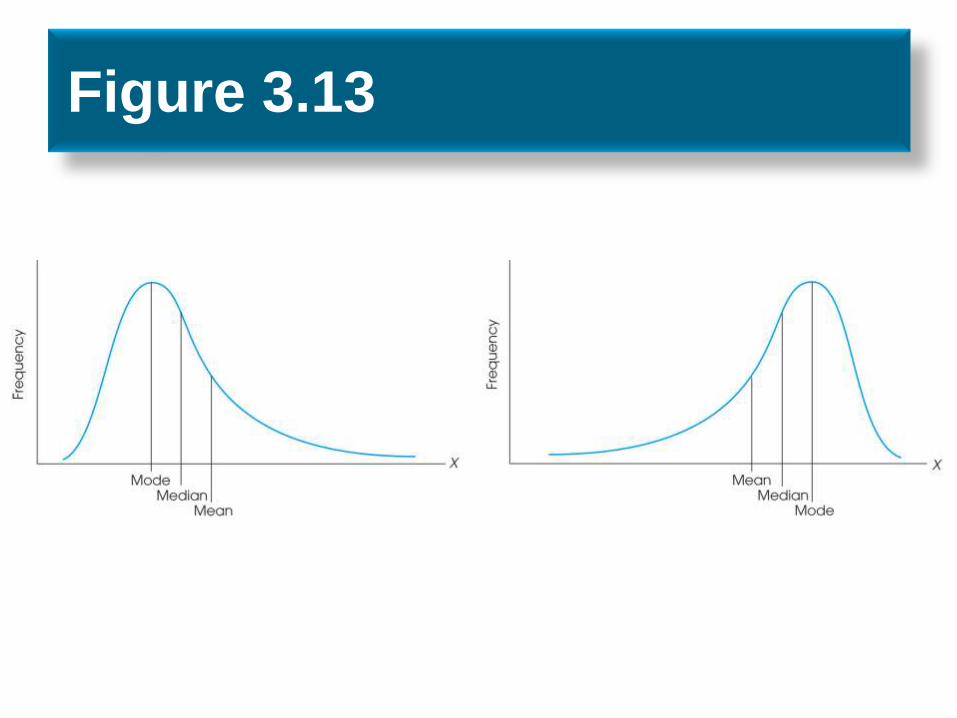
Figure 3.13
Learning Check
• A distribution of scores shows Mean = 31
and Median = 43. This distribution is
probably
• Positively skewed A
• Negatively skewed B
• Bimodal C
• Open-ended D
Learning Check - Answer
• Positively skewed A
• Negatively skewed B
• Bimodal C
• Open-ended D
Learning Check
• Decide if each of the following statements
is True or False.
• The mean uses all the scores in the data, so it is the best measure of central tendency for skewed data..
T/F
• The mean and median have the same values, so the distribution is probably symmetrical.
T/F
Learning Check - Answer
• The mean uses all the scores in the data, so it is the best measure of central tendency for skewed data.
F
• The mean and median have the same values, so the distribution is probably symmetrical.
T
Any Questions
?
Concepts?
Equations?