Chapter 3 Budgeting for health - Home - SECTION27
24
70 Health & Democracy Chapter 3 Budgeting for health
Transcript of Chapter 3 Budgeting for health - Home - SECTION27

70 Health & Democracy
Chapter 3
Budgeting for health

Budgeting for health 71
CONTENTS 3.1 Introducing budgets 72 3.2 Quick overview of the South African budget 74 Some key terms 74
Responsibilities of each sphere of government 75
How revenue is raised 75
How revenue is shared among spheres of government 76
3.3 The budget process 80 The Medium Term Expenditure Framework 80
Players in the budget process 81
Outline of stages of the budget process 83
Tabling the budget 83
Amending the budget 84
3.4 Understanding health budgets 85 Who pays for and delivers health services? 85
Overall trends in provincial health budgets 86
Sources of funding for provincial health budgets 87
Reading provincial health budgets 88
Comparing budgeted and actual expenditure 90
Health spending overall 91
3.5 Conclusion 92

72 Health & Democracy
3.1 Introducing budgets
The budget is government’s plan for how it will raise funds and spend money.
The national budget, for example, outlines how income generated by the
national government will be divided between national, provincial, and
local government; how the national share will be divided between national
departments; and the amount each province and local authority will receive
from the national government.
Through the budget process, national, provincial and local governments
plan, collaborate, negotiate, and decide together on a comprehensive plan for
spending government funds in the upcoming year. The national budget takes
the form of a package of bills considered and passed by Parliament before
being signed into law by the President. Comparable processes take place at
provincial and local government spheres.
But why is it important to pay attention to budgets? Simply put, the
budget tells us how government plans to use its resources and about its
real policy priorities. Adequate policies and legislation are crucial, but
unless government also makes sure that enough money is available for its
stated commitments, policy objectives will not be achieved. It is therefore
important to establish whether stated priorities match the actual priorities
refl ected in the budget.
The budget can also be an important tool for advocacy. We can fi nd out
how government plans to spend its money and see whether it in fact spends
funds on the programmes it said it would. By getting informed and involved
in the budget process, we can promote and ensure government accountability.
One way of doing this is by ensuring that government complies with the
Public Finance Management Act, 1 of 1999 (PFMA), which has considerably
strengthened the budget process and expenditures procedures.
Systems have been made more rigorous because the PMFA makes it possible
to establish generally recognised accounting practices, introduce uniform
treasury norms and standards and create measures to ensure transparency
and accountability. The PFMA also lays down operational procedures for
borrowing, guarantees, procurement and monitoring of government funds.
See Chapter 2 for more on the constitutional principle of accountability.

Budgeting for health 73
Chapter 2 discusses government’s
constitutional obligations regar-
ding the provision of health care
services. The budget can tell us
whether government is actually
spending enough to ensure that
the rights are realised. If people
are not enjoying their rights, or if
government does not have enough
money to pay for the services
that they need now, we can use
the budget to see if government
has at least been increasing the
amount of money it spends to
provide that service – if the right
is being realised progressively, as
the Constitution demands.
After fi rst explaining some key budget terms, the chapter then gives
a quick overview of how government’s budget is organised. This is then
followed by a description of the steps that government goes through every
year to come up with the budget. Finally, the chapter deals specifi cally with
the health budget: how much is allocated for health; how these funds fl ow
through the government system; and how they get spent, with a particular
focus on provincial spending, as this constitutes the bulk of direct public
health spending.
WHY HEALTH BUDGETS REQUIRE CONSTANT ATTENTION
Our health needs as a country do not remain static. We see changes in the population, both in terms of absolute numbers in the country as a whole and in terms of the distribution of people. People are born, they migrate within and between provinces, some emigrate and eventually everyone dies. We have also seen signifi cant changes in mortality (sickness) and morbidity (dying) patterns – a shifting burden of disease caused primarily by a massive HIV/AIDS epidemic.
What does this mean for health budgets? Simply put, they require constant attention. What may be adequate for treating AIDS in 2006, for example, may be wholly inadequate in fi ve years when the numbers of people with HIV needing treatment have increased. What is needed is the constant feeding of accurate data into the budgeting process, so that suffi cient resources can be allocated to dealing with the country’s health needs, as required by the Constitution.
KEY BUDGETARY INDICATORS
❚ AdequacyHow much is government planning to spend? Is it enough to pay for the programme? Has infl ation been taken into account?
❚ PriorityHow does the budget for this purpose compare to resources spent in other areas? Is government keeping its promises and policy commitments?
❚ ProgressIf funds aren’t enough, is the state’s response nevertheless improving?
❚ EquityAre resources being allocated fairly? Are some provinces getting more than others? Is more spent for a particular group of people?

74 Health & Democracy
3.2 Quick overview of the South African budget
Some key terms
Gross domestic product
The growth of the overall economy is usually measured by looking at the gross
domestic product (GDP), which is the total monetary value of the goods and
services produced in the country during any calendar year.
Revenue and expenditureThe funds that government collects, such as taxes and levies, are called revenue
or income. Funds which government spends are called expenditure.
Surplus and defi citA surplus occurs when government collects more money than it spends –
when revenue is greater than expenditure. If government expenditure is larger
than its income, this is called a defi cit. This difference must be borrowed from
fi nancial institutions, such as the World Bank, with interest having to be paid
on these loans. The defi cit is commonly measured as a share of GDP.
In order to keep economies stable, governments must balance the need
for small defi cits with the need to spend money on important priorities and
programmes. In South Africa, government is now slightly increasing the
defi cit to GDP ratio. This is to allow for more spending on social services and
investment in economic infrastructure, housing and municipal services.
Expansionary budgetWhen overall government expenditure increases, we call it an expansionary
budget. The extra expenditure must be covered either by increasing revenue
(through better tax collection and/or increasing taxes) or by borrowing money.
Although an expansionary budget allows us to spend more on social services
and other priorities, it also carry risks as government may have to spend more
to pay for its increased debt.

Budgeting for health 75
Distributing resources and revenueOnce government has decided on the amount it will borrow and the amount it
has available from taxes, it must decide how to divide the total pie into slices.
This process is often referred to as resource allocation. To allocate resources
means to assign or designate funds for a particular purpose. We also call this
process the division of revenue (DoR).
Responsibilities of each sphere of governmentChapter 2 discusses one of the basic principles in the Constitution – the
co-operative relationship between the three spheres of government (national,
provincial and local government). The principle of co-operative government
is also meant to shape the fi nancial relationship between the three spheres.
The division of revenue, and how revenue is shared between the spheres, is
directly linked to the responsibilities of each sphere of government.
See Chapter 2, which deals with the structure of government, for more detail on the three spheres
of government and the principle of co-operative government
The three most expensive items in the country’s whole budget are education,
health and social assistance (social grants). Although national and the nine provincial
governments share responsibilities for these three areas, the bulk of social service
delivery happens at the provincial level. In fact, social spending generally makes up
82% of a province’s total expenditure, with the single largest chunk of those funds
going to education. For this reason, we focus on provincial budgets in this chapter.
How revenue is raised
National government
In South Africa, most revenue is raised by the national government through
taxes – including company tax, personal income tax and value-added tax (VAT).
This national revenue is then distributed to provinces and local governments
to assist them in delivering the services for which they have responsibility.
Provincial governmentIn contrast, the provinces collect a small amount in taxes and various fees,
mainly from motor vehicle licences and gambling levies from horse racing
76 Health & Democracy
and casinos. Only 3% of the provinces’ budgets come from revenue they
have collected themselves. They therefore rely almost entirely on national
government for their revenue.
Local governmentLocal government budgets are very different from the provinces. On
average, local governments raise nearly 90% of their revenue themselves
– largely through property rates, utility fees (mainly electricity) and levies.
Municipalities, however, vary signifi cantly. Those with smaller budgets rely
on national government for a larger share of their revenue, while larger
municipalities raise more of their own revenue.
Local government fi nancing is currently going through a restructuring
process. The aim of this is to consolidate the fi nancial transfers that national
government provides to municipalities.
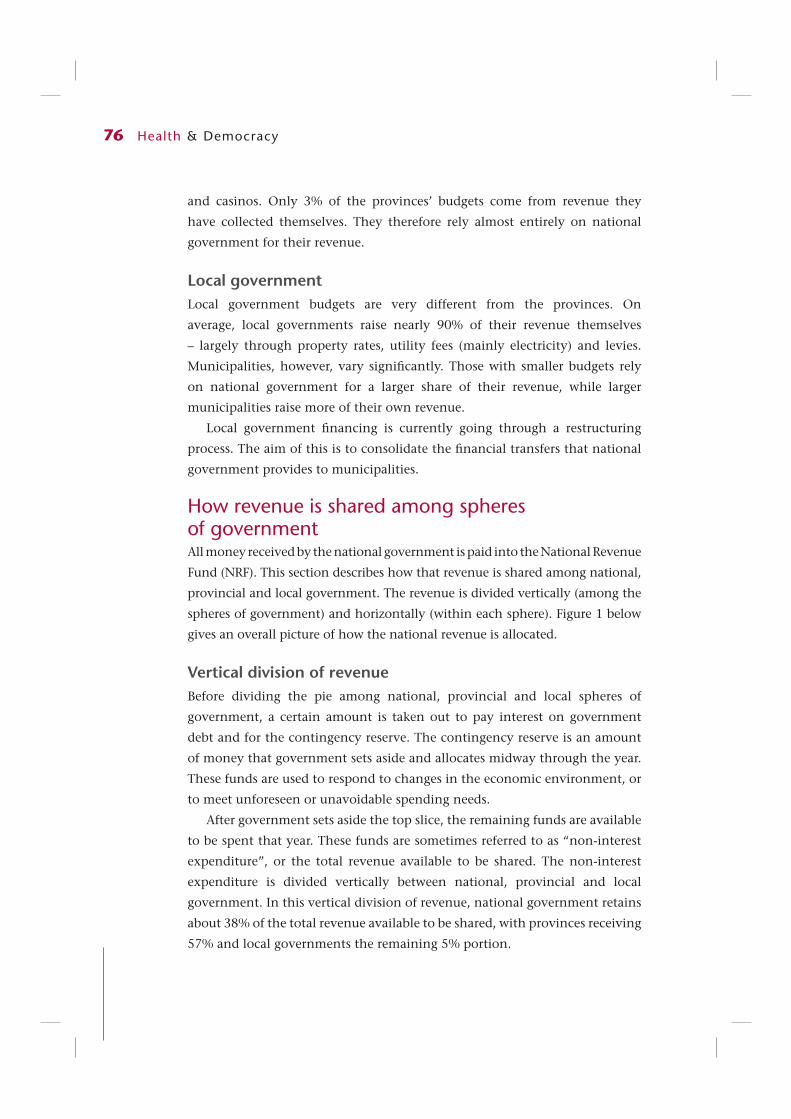
How revenue is shared among spheres of governmentAll money received by the national government is paid into the National Revenue
Fund (NRF). This section describes how that revenue is shared among national,
provincial and local government. The revenue is divided vertically (among the
spheres of government) and horizontally (within each sphere). Figure 1 below
gives an overall picture of how the national revenue is allocated.
Vertical division of revenueBefore dividing the pie among national, provincial and local spheres of
government, a certain amount is taken out to pay interest on government
debt and for the contingency reserve. The contingency reserve is an amount
of money that government sets aside and allocates midway through the year.
These funds are used to respond to changes in the economic environment, or
to meet unforeseen or unavoidable spending needs.
After government sets aside the top slice, the remaining funds are available
to be spent that year. These funds are sometimes referred to as “non-interest
expenditure”, or the total revenue available to be shared. The non-interest
expenditure is divided vertically between national, provincial and local
government. In this vertical division of revenue, national government retains
about 38% of the total revenue available to be shared, with provinces receiving
57% and local governments the remaining 5% portion.

Budgeting for health 77
Horizontal division of revenue between provincesAfter government has decided how much goes to the provinces overall, it
must divide that amount among the nine provinces. This split is called the
horizontal division, with the slice that each province receives being called its
equitable share grant.
RESPONSIBILITY FOR THE VERTICAL DIVISION
While Parliament debates and votes on how the non-interest expenditure will be spent, the actual vertical division is an executive decision made by Cabinet and National Treasury in consultation with other bodies involved in the budget process. The decision is based on the programmatic responsibilities of each sphere of government, the capacity of each sphere to raise its own revenue and the national policy priorities decided by government.
Top slice:Interest payments for debt, contingency reserves,
skills development grant/levy scheme
National Equitable Share:Includes conditional grants to provinces and local government
& funds retained for national departments
Provincial Equitable Share:Divided horizontally between the provinces by formula
Local Government Equitable ShareDivided horizontally by formula
Figure 3.1: Division of all revenue raised nationally

78 Health & Democracy
The term “equitable share” comes from sections 214 and 227 of the
Constitution, which say that each province is entitled to an “equitable share
of the revenue raised nationally”. The purpose of the equitable share is to
enable the provinces to discharge their constitutional obligations – to provide
social services and perform the functions allocated and delegated to them.
Subject to national policy, provinces have the power to set their own budgets
and determine how their equitable share grants are spent.
How does national government decide on the size of each province’s
equitable share grant? The size of the equitable share going to each province
is determined by a technical formula that aims to divide the funds among the
provinces on the basis of relative need and the different demographic and
economic profi les of each province. It uses data from the census, the income
and expenditure survey, and education and health statistics, and is meant to
be redistributive so that the poorer provinces benefi t more.
The provincial equitable share formula has six components, each of
which is given a percentage weighting. The health component is given a 26%
weighting, being based on the estimated numbers of people with and without
medical scheme coverage. This roughly approximates the public/private split
in the health sector. The other components are:
❚ education (51%);
❚ basic component (14%), based on provincial population share;
❚ institutional component (5%);
❚ poverty component (3%); and
❚ economic component (1%).
The weighting does not indicate the
amount of money these sectors are
allocated in provincial budgets. For
example, a province is not required
to spend 26% of its equitable share
on health. Whilst based on past
expenditure trends, the weightings
do not necessarily determine future
expenditure. This is problematic, given
that provinces may not have spent
appropriately in the past. Government
is working on reforming and updating
the provincial equitable share formula.
MORE INFORMATION ON THE EQUITABLE SHARE FORMULA
The Budget Review, a document tabled by the Minister of Finance in Parliament, explains the formula in more detail. Annexure E of the Budget Review is a section that has an important explanatory memorandum on the division of revenue that, amongst other things, describes the formula used for the horizontal division between provinces and the formula used to determine local government share.

Budgeting for health 79
National transfers to provincesProvinces depend on national government for 97% of their budgets. The
national government uses two types of transfers to send money to the
provinces: the equitable share and conditional grants. A transfer is a sum of
money given by one part of government to another.
We have seen that the equitable share funds are unconditional, meaning
that the provinces are generally free to distribute their equitable share funds to
particular departments and programmes as they wish, provided they operate
within the broad policy framework set by national government.
Conditional grants are the second type of transfer from national
to provincial governments. Conditional grants are given to provincial
departments for spending on a particular objective or programme. Most of
them are administered by the Departments of Health, Social Development,
Education, Housing, Agriculture and the National Treasury, with 11%
of all conditional grants being in the health sector. Because conditional
grant funds are marked for a particular purpose, they are sometimes called
“earmarked” funds.
Conditional grants are national government’s chief tool for making sure
provinces spend funds on key national priorities. They may be used to fi nance
new programmes, or to compensate provinces for delivery of services that
benefi t more than one province. Conditional grants are particularly important
in the health sector for fi nancing hospitals and HIV/AIDS interventions.
Some conditional grants are very strict, requiring provincial departments
to submit business plans to national government and with funding
transferred in instalments throughout the year. Other conditional grants
have fewer conditions and allow provincial departments more discretion to
use the money as they choose, within certain boundaries.The Department
of Health (DoH), for example, administers a conditional grant to its
provincial departments.
While the DoH sets out the conditions for how the funds should be spent,
keeping responsibility for monitoring compliance and assessment of whether
goals are achieved, this does not always happen in practice.
The best place to fi nd out more information on the conditional grants
is the Division of Revenue Act (DORA), passed annually with the national
budget. DORA sets out the amounts each province receives in equitable
share, the amounts each province gets in conditional grant funds and the
conditions and information related to each conditional grant.

80 Health & Democracy
3.3 The budget process
Being familiar with how the division of revenue works helps us to understand
the sources of funding for South Africa’s health budget. But it is also important
to understand the process used to allocate resources. This section describes the
steps government goes through to produce the budget for each fi nancial year,
which begins on 1 April each year and ends on 31 March of the following year.
The fi nancial year beginning on 1 April 2005 and ending on 31 March 2006,
for example, is referred to as fi nancial or fi scal year 2005/6.
The Medium Term Expenditure FrameworkIn a similar way to some other Southern African countries, South Africa
operates on a three year “rolling budget”. The system is called the Medium
Term Expenditure Framework (MTEF) and was adopted in 1998 as part of a
larger package of budget reforms. As part of the MTEF, the Minister of Finance
presents estimates for the following two years at the same time as he presents
a particular year’s budget to Parliament. Therefore, when budget documents
refer to the MTEF or the “medium-term”, they are referring to the expenditures
for the relevant fi nancial year and the two following years.
Although Parliament votes only on the immediate fi nancial year, the
presentation of projections for the extra two years allows the government to
plan better and increases openness and transparency regarding government
priorities.
It is important to note that national government and the provincial
governments each have their own budgets and budget processes. But they
are closely linked in a number of ways, some of which have already been set
out (such as the equitable share allocations). At the level of policy, the MTEF
provides the context for integrating and co-ordinating these parallel processes.
Its purpose is to make sure that funding proposals and allocations are in line
with government’s policy priorities and strategic objectives.
The Medium Term Budget Policy Statement (MTBPS) is the written document
used as the policy basis for this MTEF. The Minister of Finance tables the
MTBPS in Parliament every year in October or November. Sometimes referred
to as a “pre-budget” or “mini-budget” (because it shows government’s tax,
fi scal and budget plans some fi ve months before the actual budget is tabled),
the MTBPS is useful in that it gives the equitable division of revenue between the
three spheres of government, it presents the thinking behind the division, and it

Budgeting for health 81
provides spending estimates for the next three years. These spending projections
then serve as a starting point for planning the next year’s detailed budget.
Players in the budget processThere are a number of different structures or bodies involved in the budget
process. Their purpose is to co-ordinate decision-making between different
spheres of government and across departments. Some of the main actors in
the budget process include the following:
❚ The Financial and Fiscal Commission (FFC) is an independent body
originally established by the interim Constitution in 1994 (and
which now gets its authority from the 1996 Constitution). It is an
expert, advisory body that makes recommendations on the budget
and intergovernmental fi nancial issues to Parliament, the provincial
legislatures and the Budget Council.
❚ The Budget Council is a body made up of the Minister of Finance and the
nine provincial members of the executive councils (MECs) in charge of
fi nance. This forum, effectively the fi nance MinMEC, is where fi scal and
budget issues related to the provinces are discussed and debated.
❚ The Budget Forum is made up of the Budget Council plus local
government representatives. It is the main consultative forum for local
government budgeting and spending issues.
❚ The Ministers’ Committee on the Budget (MinComBud) is a
subcommittee of Cabinet that makes recommendations on funding
options. It is mostly involved in the monitoring of the developing budget
and its compliance with government goals.
❚ A MinMEC is a body comprised of the national Minister and all nine
provincial MECs in a sector that has shared functions between national
and provincial government, such as health, education, social security
and housing. MinMECs meet throughout the year to identify trends in
the sector, set priorities, and discuss budgetary implications of national
policies for provincial service delivery.
After the National Health Act, 61 of 2003 became law in 2005, a new
statutory body was created, known as the National Health Council (NHC).
This replaced the Health MinMEC. It is effectively an expanded MinMEC,
including other key persons such as the Director-General of Health and the
heads of the nine provincial health departments. The NHC has taken over
the functions of the health MinMEC.

82 Health & Democracy
❚ Medium-Term Expenditure Committees (MTECs) are technical
committees responsible for evaluating the MTEF budget submissions
of national and provincial departments. The MTECs hold hearings on
proposed changes to the MTEF allocations by departments and then
submit their recommendations to the Minister of Finance.
❚ The Treasury Committee is the body that evaluates requests from
provincial and national departments for additional funds to address
unforeseen or unavoidable needs. It is chaired by the Minister of Finance
and includes some Cabinet ministers.
❚ The Technical Committee on Finance and the Joint Sectoral Technical
Committees (referred to as “4x4s”) support the Budget Council. They
are teams of offi cials who discuss policy options for the relevant sector,
problems with service delivery and budget diffi culties. The 4x4s bring
together treasury and relevant departments at both national and
provincial levels. There are also the “10x10s” – larger intergovernmental
sectoral forums that discuss spending pressures and policy priorities.
❚ The Parliamentary Budget Committee, which was formed in November
2001, holds hearings on the MTBPS released every November and tables a
report in Parliament. The committee is meant to encourage Parliament’s
active engagement in the budget process.
❚ In addition to all of the above the national and provincial legislatures
are also supposed to play a role in fi nancial management through
their portfolio committees on fi nance, as well as through a multi-party
committee known as the Standing Committee on Public Accounts
or SCOPA.
ADJUSTED ESTIMATES (AE) OF NATIONAL EXPENDITURE
In November, over halfway through the fi nancial year, a short piece of appropriations legislation is tabled in Parliament. It lists funds allocated for unforeseen or unavoidable expenditures, rollovers, virements (transfers of money from one department to another according to budgets) and other adjustments to the original allocations. Additional funds allocated in the Adjusted Estimates are sourced primarily from the contingency reserve and surplus revenue.

Budgeting for health 83
Outline of stages of the budget process
Tabling the budgetOn Budget Day, the National Treasury releases two key documents: the
Estimates of National Expenditure (ENE) and the Budget Review.
The ENE is the main document for the national budget. It is organised
by national department, with each departmental budget being divided into
programmes and then into sub-programmes. Each department must include
information on its measurable objectives for each programme, and medium-
term outputs, measures or indicators, and targets for each sub-programme.
The Budget Review is the companion document tabled with the ENE on Budget
Day. It is an explanatory note to the budget or a review of the national budget.
It also gives information on developments in the economy and public fi nance.
The national budget itself is offi cially presented to Parliament as two pieces
of legislation: the Appropriations Bill and the Division of Revenue (DoR) Bill:
❚ The Appropriations Bill gives government departments the legal authority
Apr May Jun Jul Aug Sept Oct Nov Feb
Executive identifi es the broad medium-term spending priorities linked to the government’s social, economic and developmental policy priorities
Treasury Committee consider requests by departments for additional funds for current fi nancial year.Funds from contingency reserve or revenue surplus allocated in Adjusted Estimates to original budget.With Cabinet approval, Minister tables Adjusted Estimates and MTBPS in Parliament.
Minister also presents Budget Council and Budget Forum with fi nal allocations to provincial and local governmentMinister also presents Budget Council and Budget Forum with fi nal allocations to provincial and local government
National Budget tabled in Parliament on Budget Day.Provincial budgets tabled in provincial legislatures within next two weeks.
National departments prepare MTEF budget proposals MTECs hold hearings on MTEF budget proposals. Reports to MinComBud and Cabinet. Cabinet then informs departments and provincial treasuries of its decision in allocation letters. Spending plans revised
The Budget Council debates macro-economic and fi scal framework and DoR between spheres
MinComBud reviews macro-economic and fi scal framework and DoR. Makes proposals to extended Cabinet

84 Health & Democracy
to spend the money allotted to them. The budget is divided into “votes”,
referring to the individual budgets of each department.
❚ The DoR Bill sets out how revenue will be divided vertically (between
spheres of government) and horizontally (between provinces and between
municipalities), and also gives information on conditional grants.
Accompanying the DoR Bill is a memorandum that explains the reasons
for the proposed divisions and why the FFC’s recommendations were
adopted or rejected.
Amending the budgetWhile section 77 of the Constitution gives Parliament the power to amend
money bills (such as the Appropriation Bill), it also states that an Act of
Parliament must provide for the relevant procedure in terms of which this
happens. Similarly, section 120 states that a provincial statute must provide for
a procedure for provincial legislatures to amend money bills. To date, however,
such legislation has yet to be passed. The issue of proposed parliamentary
amendment powers for money bills is still under debate.
What this means is that while the relevant committees in the National Assembly
and the National Council of Provinces have the power to hold public hearings
on money bills, they can only recommend a vote in favour of or against such
bills. They cannot recommend specifi c changes. Rejecting the bills in total would
seriously disturb the process. For this reason, it is highly unlikely to happen.
CIVIL SOCIETY SUBMISSIONS ON THE BUDGET
Budget Day begins a review process in national and provincial legislatures, mainly through hearings of the Finance and Budget Committees. Some other portfolio committees also hold budget hearings on individual votes. Thus civil society organisations have the opportunity to make written or oral submissions on the national budget. This also happens at provincial level, where provincial legislature committees hold hearings on their provincial budgets.
If amendment powers legislation were passed, it would increase the importance of Parliament in the budget cycle and potentially also increase civil society organisations’ willingness and interest in making submissions on the budget. At present, without strong amendment powers for Parliament, civil society input at this stage is not able to have any infl uence on the immediate fi nancial year’s allocations.
There are other (perhaps better) times in the budget cycle that offer some opportunity for civil society organisations to provide input. Parliament also holds hearings following the tabling of the MTBPS in October. Although Parliament does not vote on the MTBPS, these hearings discuss the spending priorities for the medium-term. The allocations for the two extra years are not yet set, and thus input at this stage may still have an infl uence on future allocations.

Budgeting for health 85
3.4 Understanding health budgets
Who pays for and delivers health services?Apart from the government budget, which covers the vast majority of people
through the public health system, there are three other (private) sources of
health funding in South Africa:
❚ Employers who pay for health care for their employees, either directly
(by providing services at the workplace) or indirectly (by making
contributions to monthly medical scheme contributions on behalf of
their employees).
❚ Individuals who make monthly medical scheme contributions or pay
directly (“out-of pocket” expenditure) when they visit a doctor or buy
medicines at a pharmacy.
❚ Donor and non-profi t fi nancing and/or provision of services.
In practice, however, the various sources of funding overlap. For example,
many people who make use of the public health system sometimes use their
own resources to buy medicines from dispensing doctors or private pharmacies.
In some public sector facilities, such as various clinics in Khayelitsha, HIV/
AIDS treatment is co-funded by the non-profi t organisation Médecins Sans
Frontières and the Western Cape provincial department of health.
Together, public and private health care spending accounts for approximately
8% of South Africa’s GDP. While this falls short of the 15% target agreed to
by African leaders in the Abuja Declaration of 2001, it is nevertheless a
signifi cant amount of money that – if spent well – should go far in ensuring
the provision of necessary health care services. But two factors prevent this
from happening: the inequitable allocation of resources, and the ineffi cient
use of available resources.
Provincial health departments are primarily responsible for the provision of
publicly funded health services. This is why the bulk of government spending
on health care appears on provincial budgets, and why provincial budgets are
so important from the perspective of health and HIV/AIDS activists.
INEQUITABLE ALLOCATION OF RESOURCES
In 2004/5, expenditure by provincial health departments was approximately R40 billion. During the same period, medical scheme contributions came to approximately the same amount.

86 Health & Democracy
Overall trends in provincial health budgetsWhat has been the general trend in provincial health budgets? We look at
two indicators: growth of provincial health expenditure and the relationship
between health budgets and the rest of provincial budgets.
Growth of provincial health expenditureOverall, the budgets of provincial health departments have grown by about
10% a year. But in 2005/6, provinces together spent over R47 billion on health,
up from R40,6 billion the previous year.
R million 2000/1 2001/2 2002/3 2003/4 2004/5 2005/6
Nominal provincial expenditure
25 953 29 352 32 860 36 987 40 599 47 116
Nominal growth rate
13.1% 11.95% 12.56% 9.77% 16.05%
Source: National Treasury, 2004 Intergovernmental Fiscal Review (at page 54)
and 2006 Intergovernmental Fiscal Review (at page 34)
The nominal growth rate is a measure of the increase in allocation from one
fi nancial year to the next. The real growth rate, however, takes infl ation into
account.
By converting the fi gures from nominal to real terms, we can adjust for the
impact of infl ation and see what the real value of the funds will be. More than
in other sectors, infl ation is a particular issue in the health sector because the
cost of key inputs for health care, such as equipment, often grows faster than
the price of other items. This is often referred to as medical infl ation.
Once we know about the real growth rate, we need to consider whether
this exceeds (or at minimum matches) population growth. For example, in the
late 1990s after the government adopted a new economic policy, commonly
known as GEAR, there was a decline in per capita health expenditure (spending
per person) even though the overall health budget increased slightly. However,
by 2005 per capita spending on health was increasing – partly because of AIDS
and partly because government was increasing overall health funding.
Budgeting for health 87
Health as part of provincial budgetsHow does health compare to the rest of the provincial budget? In the early
2000s, health took up 22% of total provincial budgets, compared to 35%
spent on education and 25% on social development. If we look instead at all
the national and provincial budgets together, the health sector was 11% of
consolidated national and provincial expenditure (including interest payments
and the contingency reserve).
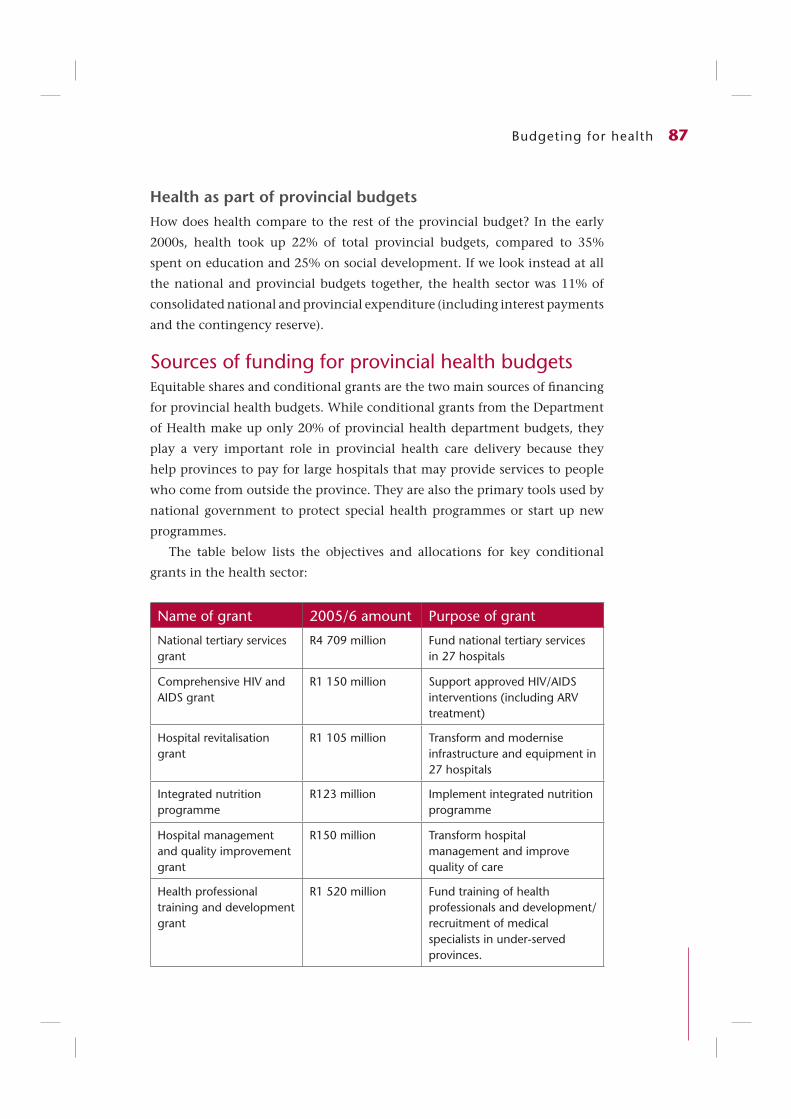
Sources of funding for provincial health budgetsEquitable shares and conditional grants are the two main sources of fi nancing
for provincial health budgets. While conditional grants from the Department
of Health make up only 20% of provincial health department budgets, they
play a very important role in provincial health care delivery because they
help provinces to pay for large hospitals that may provide services to people
who come from outside the province. They are also the primary tools used by
national government to protect special health programmes or start up new
programmes.
The table below lists the objectives and allocations for key conditional
grants in the health sector:
Name of grant 2005/6 amount Purpose of grant
National tertiary services grant
R4 709 million Fund national tertiary services in 27 hospitals
Comprehensive HIV and AIDS grant
R1 150 million Support approved HIV/AIDS interventions (including ARV treatment)
Hospital revitalisation grant
R1 105 million Transform and modernise infrastructure and equipment in 27 hospitals
Integrated nutrition programme
R123 million Implement integrated nutrition programme
Hospital management and quality improvement grant
R150 million Transform hospital management and improve quality of care
Health professional training and development grant
R1 520 million Fund training of health professionals and development/recruitment of medical specialists in under-served provinces.

88 Health & Democracy
Reading provincial health budgets
Programme budget classifi cation
The main classifi cation system used is a programme budget that classifi es
expenditure on the basis of the functions for which the funds have been
allocated. Provincial health departments have standardised their budget
formats so that all nine provinces have these same eight programmes:
❚ Administration.
❚ District health services.
❚ Emergency health services.
❚ Provincial hospital services.
❚ Central hospital services.
❚ Health sciences and training.
❚ Health care support services.
❚ Health facilities management.
The biggest programme is district health services, accounting for nearly 40%
of the budget and including primary health care and district hospitals. The
second sub-programme under district health services is the HIV and AIDS
sub-programme. As a result, the district health services programme has been
growing rapidly in recent budgets. The second largest programme is provincial
hospital services, followed by central hospital services.
COMPREHENSIVE HIV AND AIDS GRANT
The HIV/AIDS grant is meant to fund eight different types of interventions:❚ Voluntary counselling and testing (VCT).❚ Prevention of mother-to-child transmission of HIV (PMTCT) programmes.❚ Strengthening of provincial management.❚ Establishment of Regional Training Centres.❚ Post-exposure prophylaxis (PEP).❚ Home-based care.❚ Step-down care.❚ Implementation of the Operational Plan for Comprehensive HIV and AIDS Care,
Management and Treatment for South Africa.While provinces have to submit business plans to the national department for approval
before funds are transferred, they have been allowed some discretion to divide their total conditional grant amount between these different interventions. The advantage of this is that provinces may be better placed to allocate funds to where they are actually needed.

Budgeting for health 89
Economic classifi cationThe second format used in budget documents is called the economic
classifi cation. The economic classifi cation categorises expenditure by its nature
or content. Under the economic classifi cation, all spending is divided between
current and capital expenditure. Current expenditure is regular operational
spending (such as medicines and salaries), whereas capital expenditure (such
as buildings, equipment or other durable items) is irregular.
Insofar as health advocacy is concerned, the economic classifi cation is
particularly useful in providing detail on state priorities:
❚ Salaries
Economic classifi cation enables us to see how much is budgeted and spent
on salaries – there is a specifi c item on compensation of employees. A major
trend in provincial health budgets is that provinces are budgeting more to
pay health sector employees.
❚ Medicines
Although provincial health budgets do not have a specifi c item on
medicines, we know that they are included in the goods and services item in
the economic classifi cation. Increased expenditure on medical equipment
and consumables is also refl ected in this part of the budget.
❚ Capital
Economic classifi cation allows us to identify trends in capital spending on
buildings and equipment for clinics and hospitals.
Intergovernmental Fiscal Review
The Intergovernmental Fiscal Review (IGFR), normally published by the National
Treasury in April each year, is a very useful document for health and HIV/AIDS
activists wanting to examine provincial and local government budgets. It is
the only budget document that pulls together – in one place – the fi gures from
all nine provincial budgets and multiple local government budgets.
COMPARING PROVINCIAL AND NATIONAL BUDGETS
Similar to provincial budgets, the national health budget is also presented as a programme budget and economic classifi cation. Thus the budget of the Chief Directorate: HIV/AIDS and TB, for example, is found under the sub-programme on HIV/AIDS and TB which itself falls under strategic health programmes.
Since 2005, all national departments have been required to submit fi ve-year strategic plans, list their measurable objectives, recent outputs and expenditure trends, and, for each subprogramme, provide information on medium-term outputs, measures or indicators, and targets.

90 Health & Democracy
In addition, the IGFR presents and analyses this data sector by sector. Its
health chapter, for example, analyses critical areas such as primary health
care, hospital expenditure, emergency medical services and HIV/AIDS. This
information is also presented provincially, such as primary health care
expenditure per person in Limpopo, or the amount budgeted for emergency
medical services for every 1000 uninsured people in the Free State.
Comparing budgeted and actual expenditureSo far, this chapter has covered the drafting and legislative phases of the
budget. The fi nal two phases of the budget cycle are the implementation
and audit phases. In the implementation phase, departments put plans into
operation and spend the funds allocated to them. In the audit phase, the
Auditor-General (AG) conducts independent, objective audits of the fi nancial
statements, fi nancial management, and accounts of all national and provincial
departments and municipalities. Understandably, this process takes time – the
results of the audits are only released up to two years later.
The AG gives a rating to each government department to indicate its quality
of fi nancial management. There are fi ve ratings, rating from “disclaimer”
(worst) to “unqualifi ed” (best). This information is all summarised in the IGFR.
Audit Reports are also available at the AG’s website (www.agsa.gov.za) and are
included in the annual reports of national and provincial departments.
In addition to ratings of the general quality of fi nancial management,
fi gures on actual spending are also available. Actual expenditure fi gures are
very important to watch because they show how well government followed
through on its budget plans. While the analysis of budgetary allocations can
tell us to what degree something is prioritised in the budget, actual expenditure
fi gures tell us about the effi ciency and effectiveness of spending.
However, there are limited sources of data on actual expenditure. While
government publishes data on general departmental spending, it does not
publish actual expenditure data divided up into programmes or sub-programmes.
This makes it diffi cult to track spending on particular interventions.
In the remaining part of this chapter, we will look at examples of the data
on health department spending by the national department and the provincial
departments, the data on specifi c programmes and interventions, and rollovers
(or what happens when funds go unspent).

Budgeting for health 91
Health spending overallThe table below shows actual spending by each provincial health department
in 2005/6. This information was compiled and presented for the fi rst time
in Annexure A of the 2004 MTBPS. Together, provinces underspent slightly
on their health budgets, with Limpopo underspending by over 6%. Some
provinces, however, overspent – the Northern Cape by as much as 5,6%. The
national department underspent its budget by 1%.
Table 3.1 Actual provincial health expenditure 2005/6
R millionAdjusted budget 2005/6
Preliminary out-come 2005/6
Percent spent
Eastern Cape 6 243 6 137 98,3%
Free State 3 127 3 130 100,1%
Gauteng 9 856 9 990 101,4%
KwaZulu-Natal 10 451 10 582 101,3%
Limpopo 5 106 4 796 93,9%
Mpumalanga 2 661 2 672 100,4%
Northern Cape 1 043 1 101 105,6%
North West 2 993 2 974 99,4%
Western Cape 5 791 5 733 99%
National Department of Health
10 039 9 938 99%
Source: National Treasury, 2006 MTBPS (at page 77)
Another key source of information on actual expenditure is the National
Treasury’s website (www.treasury.gov.za), where regular statements of national
and provincial revenue and expenditure are published. In addition, the National
Treasury releases expenditure and revenue reports for provincial budgets each
quarter, which give spending fi gures for each provincial health department
and preliminary fi gures that will be subsequently corrected and reconciled as
the provinces close their books for the fi nancial year. These reports are released
one month after the end of the quarter.

92 Health & Democracy
Spending on individual programmesUnfortunately, the National Treasury reports do not subdivide by programmes
within each department. So, for example, it is not possible to look at expenditure
on primary health care specifi cally, or on the HIV/AIDS sub-programmes.
But the National Treasury quarterly statements do report on spending for
each conditional grant, thus assisting civil society and advocacy groups in
monitoring and tracking the conditional grant programmes.
Actual expenditure on HIV/AIDS conditional grants (2005/6)
R million Transferred Spent Percent spent
Eastern Cape 159 005 162 361 102,1%
Free State 115 874 100 479 86,7%
Gauteng 185 048 185 151 100,1%
KwaZulu-Natal 251 468 251 468 100,0%
Limpopo 125 899 94 142 74,8%
Mpumalanga 81 392 87 402 107,4%
Northern Cape 48 050 48 559 101,1%
North West 100 921 100 921 100,0%
Western Cape 82 451 92 733 112,5%
Total 1 150 108 1 123 256 97,67%
Source: DoH 2004/5 Annual Report (at page 205)
Rollovers
When funds are unspent in any given fi nancial year, they may be reallocated
in the next fi nancial year. These funds are called rollovers and are recorded in
the Adjusted Estimates published midway through each fi nancial year. But not
all unspent funds are rolled over into the next fi nancial year.
3.5 ConclusionBudget analysis can be a very powerful advocacy tool for public health and
HIV/AIDS activists because it allows them to engage government in pragmatic
fi nancial terms. In the budget process, government must allocate scarce

Budgeting for health 93
resources between competing priorities. Understanding the budget process
and being familiar and comfortable with the offi cial budget documents allows
activists to monitor these decisions in an informed manner.
In addition, activists can strengthen their efforts to monitor implementation
of key health programmes, such as the Operational Plan for Comprehensive HIV
and AIDS Care, Management and Treatment for South Africa, by tracking actual
expenditure. Only with a working knowledge of the budget and budgetary
processes can they ensure that political promises are actually translated into
properly implemented programmes.