Chapter 3 Bacteria - oregon.gov · CHAPTER 3: BACTERIA Prepared by ... Figure 3.24. Evans Creek...
87
ROGUE RIVER BASIN TMDL CHAPTER 3: BACTERIA Prepared by Oregon Department of Environmental Quality
Transcript of Chapter 3 Bacteria - oregon.gov · CHAPTER 3: BACTERIA Prepared by ... Figure 3.24. Evans Creek...

ROGUE RIVER BASIN TMDL
CHAPTER 3: BACTERIA
Prepared by Oregon Department of Environmental Quality

Rogue River Basin TMDL: Bacteria December 2008
OREGON DEPARTMENT OF ENVIRONMENTAL QUALITY ii
This Page Intentionally Left Blank

Rogue River Basin TMDL: Bacteria December 2008
OREGON DEPARTMENT OF ENVIRONMENTAL QUALITY 3-III
Table of Contents 3.1 Overview and scope ............................................................................................................ 1
3.1.1 Pollutant Identification ................................................................................................................. 2 3.1.2 Beneficial Use Identification ........................................................................................................ 2 3.1.3 Target Criteria Identification ........................................................................................................ 3 3.1.4 Deviation from Water Quality Standards and 303(d) Listings for Bacteria ...................................... 4 3.1.5 Existing Pollution Sources ............................................................................................................... 8 3.1.6 Analytical Methods Overview ........................................................................................................ 10 3.1.7 Margin of Safety ............................................................................................................................ 15
3.2 Rogue Mainstem Watersheds ........................................................................................... 16 3.2.1 Watershed Description .................................................................................................................. 16 3.2.2 Waterbodies Listed for Bacteria .................................................................................................... 16 3.2.3 Current Conditions: Rogue Mainstem Bacteria Analysis ............................................................. 17 3.2.4 Seasonal Variation ........................................................................................................................ 20 3.2.5 Critical Period - Seasonal Variation ............................................................................................... 24 3.2.6 Existing Pollution Sources ............................................................................................................. 24
Point Sources ....................................................................................................................................... 24 Nonpoint Sources ................................................................................................................................ 25
3.2.7 TMDL - Loading Capacities ........................................................................................................... 30 3.2.8 TMDL Allocations .......................................................................................................................... 31 3.2.9 Wasteload Allocations: Point Sources........................................................................................... 37 3.2.10 Load Allocations: Nonpoint Sources ........................................................................................... 38 3.2.11 Future Sources ............................................................................................................................ 40
3.3 Middle Rogue River Subbasin .......................................................................................... 41 3.3.1 Watershed Description .................................................................................................................. 41 3.3.2 Waterbodies Listed for Bacteria .................................................................................................... 42 3.3.3 Current Conditions: Evans Creek Bacteria Analysis ..................................................................... 42 3.3.4 Seasonal Variation ........................................................................................................................ 44 3.3.5 Critical Period - Seasonal Variation ............................................................................................... 49 3.3.6 Existing Pollution Sources ............................................................................................................. 49
Point Sources ....................................................................................................................................... 49 Nonpoint Sources ................................................................................................................................ 50
3.3.7 TMDL - Loading Capacities ........................................................................................................... 52 3.3.8 TMDL Allocations .......................................................................................................................... 54 3.3.9 Wasteload Allocations: Point Sources........................................................................................... 57 3.3.10 Load Allocations: Nonpoint Sources ........................................................................................... 58 3.3.11 Future Sources ............................................................................................................................ 59
3.4 Upper Rogue River Subbasin ........................................................................................... 60 3.4.1 Watershed Description .................................................................................................................. 60 3.4.2 Waterbodies Listed for Bacteria .................................................................................................... 60 3.4.3 Current Conditions: Upper Rogue River Subbasin Bacteria Analysis ........................................... 61 3.4.4 Seasonal Variation ........................................................................................................................ 65 3.4.5 Critical Period - Seasonal Variation ............................................................................................... 68 3.4.6 Existing Pollution Sources ............................................................................................................. 69
Point Sources ....................................................................................................................................... 69 Nonpoint Sources ................................................................................................................................ 69
3.4.7 TMDL Loading Capacities ............................................................................................................. 72 3.4.8 TMDL Allocations .......................................................................................................................... 74
Wasteload Allocations: Point Sources ................................................................................................. 78 Load Allocations: Nonpoint Sources .................................................................................................... 78
3.4.9 Future Sources .............................................................................................................................. 80 3.5 References .......................................................................................................................... 81

Rogue River Basin TMDL: Bacteria December 2008
OREGON DEPARTMENT OF ENVIRONMENTAL QUALITY 3-IV
Tables
Table 3.1. Bacterial TMDL Component Summary as per OAR 304-042-0040 ............................................ 1 Table 3.2. Water Quality Criteria for Bacteria in the Rogue River Basin. .................................................... 3 Table 3.3. 2004/2006 303(d) Bacteria listings for water contact recreation within the Rogue River Basin . 5 Table 3.4. 2004/2006 303(d) Listings in error .............................................................................................. 6 Table 3.5. Approaches for Incorporating a Margin of Safety into a TMDL ................................................ 15 Table 3.6. E. coli data for the Rogue Mainstem Watersheds .................................................................... 19 Table 3.7. Estimated Potential Contributions of NPDES sources to the Loading Capacity of the Rogue
River ................................................................................................................................................... 25 Table 3.8. E. coli Loading Capacity for the Rogue River at River Mile 102.1 ............................................ 31 Table 3.9. Allocations and Percent E. coli Reduction Targets. Rogue River at River Mile 102.1 ............ 32 Table 3.10. Percent Reduction Targets by Season, Rogue Mainstem Watersheds RM 86.4-138 ........... 36 Table 3.11. Percent reduction targets – Reese Creek at Mouth ................................................................ 37 Table 3.12. Wasteload Allocations for Wastewater Treatment Plants (WWTP) in the Rogue River Basin 37 Table 3.13. E. coli data for the Evans Creek Watershed – all seasons combined .................................... 44 Table 3.14. Seasonal E. coli Samples on Evans Creek ............................................................................ 44 Table 3.15. E. coli Loading Capacity Evans Creek at River Mile 16.0 ...................................................... 54 Table 3.16. Evans Creek Load Allocations and Percent E. coli Reduction Targets .................................. 54 Table 3.17. Evans Creek percent reduction targets to reach 126 E. coli /100ml ....................................... 56 Table 3.18. Evans Creek percent reduction targets to reach 406 E. coli /100ml ....................................... 57 Table 3.19. E. coli data for the Little Butte Creek Watershed .................................................................... 63 Table 3.20. E. coli data Trail Creek ............................................................................................................ 65 Table 3.21. E. coli Loading Capacity for Little Butte Creek at Mouth ........................................................ 73 Table 3.22. Little Butte Creek Flow Based Load Allocations and Percent E. coli Reduction Targets ....... 74 Table 3.23. Upper Rogue River percent reduction targets to reach 126 E. coli /100ml ............................ 77 Table 3.24. Upper Rogue River percent reduction targets to reach 406 E. coli org/100ml ....................... 77
Figures
Figure 3.1. Rogue River Basin. 303(d) bacteria listings for water contact recreation shown in Red .......... 7 Figure 3.2. Box and Whisker Plot examples .............................................................................................. 11 Figure 3.3. Example Load Duration Curve showing the loading capacity and calculated event loads ..... 13 Figure 3.4. Example Load Duration Curve showing the loading capacity and percent reductions ........... 14 Figure 3.5. Rogue Mainstem Watersheds ................................................................................................. 16 Figure 3.6. E. coli Sampling Sites and Maximum Concentrations: Rogue Mainstem Watersheds .......... 18 Figure 3.7. Rogue Mainstem Watersheds E. coli concentrations: Spring Season .................................... 21 Figure 3.8. Rogue Mainstem Watersheds E. coli concentrations: Summer Season ................................. 22 Figure 3.9. Rogue Mainstem Watersheds E. coli concentrations: Fall Season ......................................... 23 Figure 3.10. Rogue Mainstem: E. coli Concentrations vs. Rainfall in the Vicinity of Grants Pass (RM
102.1) ................................................................................................................................................. 24 Figure 3.11. Primary Land Use with Bacteria Concentration Data ............................................................ 27 Figure 3.12. Primary Land Use with Bacteria Concentration Data Zoomed out ........................................ 28 Figure 3.13. Rogue River E. coli Concentrations and Upstream Land Use .............................................. 29 Figure 3.14. E. coli Loading Capacity for Rogue River at River Mile 102.1 (USGS Gage 14361500) ...... 30 Figure 3.15. Loading Capacity and Loading Data for the Rogue River RM 102.1 .................................... 33 Figure 3.16. Percent reductions needed to meet the water quality standard at RM 102.1 ....................... 34 Figure 3.17. Load Duration Curves for the Rogue River ........................................................................... 35 Figure 3.18. Middle Rogue River Subbasin .............................................................................................. 41 Figure 3.19. Sampling Sites and Maximum E. coli Concentrations ........................................................... 43 Figure 3.20. Spring Evans Creek E. coli data ............................................................................................ 45 Figure 3.21. Summer Evans Creek E. coli data ......................................................................................... 46
Rogue River Basin TMDL: Bacteria December 2008
OREGON DEPARTMENT OF ENVIRONMENTAL QUALITY 3-V
Figure 3.22. Fall Evans Creek E. coli data ................................................................................................. 47 Figure 3.23. Evans Creek Seasonal Bacterial Concentrations and Average Rainfall at Grants Pass ...... 48 Figure 3.24. Evans Creek Seasonal Bacterial Concentrations and Estimated Evans Creek Flow 2004 .. 49 Figure 3.25. Evans Creek Primary Land Cover with Median Bacteria Concentration Data ...................... 51 Figure 3.26. Evans Creek E. coli concentrations and upstream land use ................................................. 52 Figure 3.27. E. coli Loading Capacity for Evans Creek at RM 16.0 .......................................................... 53 Figure 3.28. Loading Capacity and Loading Data for Evans Creek at RM 16.0 ........................................ 55 Figure 3.29. Percent Reductions needed to meet water quality standards in Evans Creek at mouth ...... 56 Figure 3.30. Upper Rogue River Subbasin ................................................................................................ 60 Figure 3.31. E. coli Sampling Sites and Concentrations on Little Butte Creek .......................................... 62 Figure 3.32. E. coli Sampling Sites and Concentrations on Trail Creek .................................................... 63 Figure 3.33. Summer Little Butte Creek E. coli Data ................................................................................. 66 Figure 3.34. Fall/winter/spring Little Butte Creek E. coli Data ................................................................... 67 Figure 3.35. Monthly E. coli Concentrations at Mouth of Little Butte Creek (Combines data RM 0.0-1.2)
and Average Rainfall at Medford ........................................................................................................ 68 Figure 3.36. Upper Rogue River Subbasin Land Use ............................................................................... 70 Figure 3.37. Little Butte Creek Land Use with Maximum E. coli Concentration Data................................ 71 Figure 3.38. Trail Creek Land Use with Maximum E. coli Concentration Data .......................................... 71 Figure 3.39. Little Butte Creek E. coli Concentrations and Upstream Land Use ....................................... 72 Figure 3.40. E. coli Loading Capacity for Little Butte Creek Near the Mouth ............................................ 73 Figure 3.41. Load Duration Curves for Little Butte Creek .......................................................................... 75 Figure 3.42. Percent reductions needed to meet the water quality standard at the mouth of Little Butte
Creek. ................................................................................................................................................. 76

Rogue River Basin TMDL: Bacteria December 2008
OREGON DEPARTMENT OF ENVIRONMENTAL QUALITY 3-1
3.1 OVERVIEW AND SCOPE Fecal bacteria sources in the Rogue River Basin may include wildlife, livestock waste, failing septic systems, wastewater treatment plant malfunctions, rural residential runoff and urban runoff. As required by OAR 340-042-0040, this TMDL includes descriptions of the Basin or Subbasins, the pollutants responsible for impairments, standards being applied, an analysis of the sources of the pollutants, a description of data collected, loading capacity and allocations of loads for various direct loads on a watershed scale, and a margin of safety (Table 3.1). For the purposes of this bacterial TMDL, the Rogue River Basin is split into 3 sections: 1) Rogue Mainstem Watersheds, 2) Middle Rogue River subbasin, 3) Upper Rogue River subbasin. The Rogue River Basin Bacteria TMDL applies to all perennial and intermittent streams, rivers, and lakes within the Rogue River Basin in Oregon, with the exception of those within the Lobster Creek watershed, Sucker Creek watershed, Bear Creek watershed and Applegate River Subbasin where TMDLs were completed and approved by the U.S. Environmental Protection Agency (EPA) (see Chapter 1). This TMDL does not replace the existing TMDLs in the Rogue River Basin. The methods used in the Rogue River Basin Bacteria TMDL are consistent with those used in other TMDLs within the Basin (Bear Creek 2007). Note that within the Rogue River Basin TMDL there are references to Bear Creek and the application of load duration curve intervals due to the influence of irrigation delivery/use/return. Table 3.1. Bacterial TMDL Component Summary as per OAR1 304-042-0040
Waterbodies OAR 340-042-0040(4)(a)
All perennial and intermittent streams within the Rogue River Basin that are not already addressed by an existing TMDL. Specifically, this TMDL includes areas within the Lower Rogue River Subbasin (Hydrologic Unit Code [HUC] 17100310), Middle Rogue River Subbasin (HUC 17100308), Upper Rogue River Subbasin (HUC 17100307), and Illinois River Subbasin (HUC 17100311). Areas with an existing TMDL that are not addressed by this TMDL include Lobster Creek watershed (HUC 1710031007), Sucker Creek watershed (HUC 1710031103), Bear Creek watershed (HUC 1710030801), and Applegate Subbasin (HUC 17100309).
Pollutant Identification OAR 340-042-0040(4)(b) Human pathogens associated with fecal bacteria contamination. Beneficial Uses OAR 340–041–0027(1) Table 271A
The most sensitive beneficial use addressed in this Bacterial TMDL is water contact recreation.
Target Criteria Identification OAR 340-042-0040(4)(c) OAR 340-041-0009(4) OAR 340-041-0009(1)(a) CWA2 §303(d)(1)
E. coli is used as an indicator of human pathogens for water recreational contact. (A) A 30-day log mean of 126 E. coli organisms per 100 milliliters, based on a minimum of five samples; (B) No single sample may exceed 406 E. coli organisms per 100 milliliters.
Existing Sources OAR 340-042-0040(4)(f) CWA §303(d)(1)
Fecal bacteria sources may include wildlife, livestock waste, failing septic systems, wastewater treatment plant malfunctions, rural residential runoff, and urban runoff.
Seasonal Variation OAR 340-041-0040(4)(j) CWA §303(d)(1)
Seasonal variation is addressed using load duration curves which incorporate all observed flows from all seasons. Allocations apply year-round and are based on stream flow.
TMDL Loading Capacity OAR 340-042-0040(4)(d) CWA §303(d)(1)
The TMDL loading capacity was determined using load duration curves that account for the range of observed flows and the applicable water quality criteria (126 E. coli / 100 mL and 406 E. coli / 100 mL for water contact recreation).
Allocations OAR 340-042-0040(4)(e) OAR 340-042-0040(4)(g) OAR 340-042-0040(4)(h) 40 CFR3 130.2(f) 40 CFR 130.2(g) 40 CFR 130.2(h)
Loading Capacity: The loading capacity is expressed as a loading rate that will achieve the water quality criteria (30-day log mean of 126 E. coli organisms per 100 ml or no single sample greater than 406 E. coli organisms per 100 ml) under all flow conditions, thereby protecting beneficial uses. Waste Load Allocations (Point Sources): The waste load allocation for NPDES permitted point sources addressed in this TMDL is expressed as a load derived from the numeric criterion (126 or 406 E. coli organisms/100 ml) and the applicable flow.
1 OAR – Oregon Administrative Rule 2 CWA – Federal Clean Water Act 3 CFR – Code of Federal Regulations

Rogue River Basin TMDL: Bacteria December 2008
OREGON DEPARTMENT OF ENVIRONMENTAL QUALITY 3-2
Load Allocations (Nonpoint Sources): The load allocation includes all nonpoint sources that result in the attainment of the numeric criterion (126 or 406 E. coli organisms/100 ml) and is expressed as a percent reduction target or flow based load where possible on potentially impacted surface waters. Excess Load: The difference between the actual pollutant load and the loading capacity of a waterbody. DEQ did not calculate excess load, but rather used percent reduction as a surrogate for load reduction needed to meet water quality criteria.
Surrogate Measures OAR 340-041-0040(5)(b) 40 CFR 130.2(i)
Where appropriate, percent reduction in bacterial loading was used as a surrogate measure for loading.
Margins of Safety OAR 340-042-0040(4)(i) CWA §303(d)(1)
Margins of Safety: An implicit margin of safety was used and implemented through the use of conservative assumptions in the development and interpretation of the load duration curve. No explicit numeric margin of safety was used.
Reserve Capacity OAR 340-042-0040(4)(k)
Future point sources will be required to meet water quality criteria prior to discharge. Additional non point source contribution, such as from land development, may not cause total loading to exceed the loading capacity
Water Quality Standard Attainment Analysis CWA §303(d)(1)
Load duration curves were used to establish bacterial loads in the Rogue River and in tributaries where possible to examine bacterial input at all observed flows. The implementation of flow-based reductions will result in water quality standard attainment.
Water Quality Management Plan OAR 340-041-0040(4)(l) CWA §303(d)(1)
The Water Quality Management Plan provides the framework of management strategies to attain and maintain water quality standards. The framework is designed to work in conjunction with detailed plans and analyses provided in sector-specific or source-specific implementation plans.
3.1.1 Pollutant Identification OAR 340-042-0040(4)(b) The pollutant of concern is fecal-related microorganisms. Fecal coliform bacteria are found in the feces of humans and other warm blooded animals. E. coli is a subset of fecal coliform bacteria. These bacteria can enter waterways via wildlife, livestock waste, failing septic systems, wastewater treatment plant malfunctions, rural residential runoff, and urban runoff. Fecal coliform bacteria by themselves are not pathogenic but are an indicator species. Pathogenic organisms include bacteria, viruses, and parasites that cause diseases and illnesses. Fecal coliform bacteria naturally occur in the human digestive tract and aid in the digestion of food. In infected individuals, pathogenic organisms are found along with fecal coliform bacteria. If coliform bacteria values are high in a waterway, there is a greater chance that pathogenic organisms are also present. A person swimming or in contact with waters with high values of fecal bacteria has a greater risk of getting sick from disease causing organisms or pathogens. Fecal coliform and E. coli bacteria have been measured in water bodies within the Rogue River Basin.
3.1.2 Beneficial Use Identification OAR 340-042-0040(4)(c) Beneficial uses in the Rogue River Basin are defined in the Oregon Administrative Rules (OAR 340–041–0271, Table 271A, November 2003), and are shown in Chapter 1. The beneficial uses present in the Rogue River Basin affected by elevated bacteria levels include water contact recreation (e.g. swimming) (DEQ 2005). As discussed in Chapter 1, there were insufficient data to address the beneficial use of shellfish harvesting.

Rogue River Basin TMDL: Bacteria December 2008
OREGON DEPARTMENT OF ENVIRONMENTAL QUALITY 3-3
3.1.3 Target Criteria Identification OAR 340-042-0040(4)(c), OAR 340-041-0009(1)(a)(A), OAR 340-041-0009(1)(a)(B), CWA 303(d)(1) A change was made in 1996 from monitoring fecal coliform to monitoring E. coli, because E. coli is correlated more closely with human disease. Fecal coliform bacteria are still used in the standard as the indicator for protection of human health in assessing water quality in commercial and recreational shellfish harvesting areas. The current recreational contact criteria as stated in OAR 340-041-0009(1)(a) is expressed as a 30-day log mean of 126 E. coli organisms per 100 ml, based on a minimum of five samples, with no single sample exceeding 406 E. coli organisms per 100 ml. Until 1996, DEQ assessed bacterial contamination using fecal coliform bacteria, since then E. coli has been used. Bacterial criteria for the waters of the Rogue River Basin are contained in the Oregon Administrative Rules (OAR 340-041-0009) (Table 3.2). In order to use the best, most robust data sets available, the Rogue River Basin Bacteria TMDL used a combination of fecal coliform and E. coli data. The combination of these bacterial indicators is used to set the Load and Waste Load Allocations and to determine percent reduction targets at specific points or areas within watersheds. Percent reduction targets provide a realistic measure of how much improvement is needed in order to meet the bacteria criteria. The current recreational contact criteria are a 30-day log mean of 126 E. coli organisms per 100 ml, based on a minimum of five samples, with no single sample exceeding 406 E. coli organisms per 100 ml4. A water body is considered water quality limited if the 30-day log mean is greater than 126 organisms per 100 ml or more than 10% of the samples exceed 406 organisms per 100 ml with a minimum of at least two occurrences5. The criteria is based on 1986 EPA recommendations that correlate a log mean concentration of 126 E. coli per 100 milliliters (mL) of water with a gastrointestinal illness rate of about 8 individuals per 1,000 swimmers. In both the E. coli and the fecal coliform criteria that preceded it, there is a 30-day log mean concentration target and an extreme concentration target. The TMDL is written to address both criteria of the standard. Best management practices (BMP) that control fecal bacteria need to be implemented to target both criteria of the standard. Table 3.2. Water Quality Criteria for Bacteria in the Rogue River Basin.
Area Affected and Beneficial Use Criteria and Description
Freshwaters and Estuarine Waters Other than Shellfish Growing Waters (Water Contact Recreation)
OAR 340-041-0009(1)(a) (A) A 30-day log mean of 126 E. coli organisms per 100 milliliters, based on a minimum of five samples; (B) No single sample may exceed 406 E. coli organisms per 100 milliliters.
Freshwaters and Estuarine Waters (Water Contact Recreation) prior to 1996
(A) A 30-day log mean of 200 fecal coliform organisms per 100 milliliters, based on a minimum of five samples; (B) No more than 10% of samples greater than 400 fecal coliform organisms per 100 milliliters.
4 Bacterial data are often summarized as the log mean (a type of average) of all the test results obtained during a reporting period. A log mean, which is the same as a geometric mean, tends to dampen the effect of very high or low values, which might bias the mean if a straight average (arithmetic mean) were calculated. This is helpful when analyzing bacteria concentrations, because levels may vary anywhere from 10 to 10,000 fold over a given period. 5 Water quality limited refers to Category 5 - Water is water quality limited and a TMDL is needed, Section 303(d) list. If less than 2 samples or less than 10% of samples collected exceed the 406 organisms/100mL and the 30-day log mean of 126 organisms/100mL based on 5 samples is not exceeded the status is either Category 2: Attaining – (some of the pollutant standards are met) or Category 3: Insufficient data to determine whether a standard is met. Source DEQ website: <http://www.deq.state.or.us/wq/assessment/assessment.htm>

Rogue River Basin TMDL: Bacteria December 2008
OREGON DEPARTMENT OF ENVIRONMENTAL QUALITY 3-4
Bacterial Die-off Fecal coliforms, of which E. coli is a subset, are found in the intestines of warm blooded animals. This environment provides warm constant temperatures and nutrients which are conducive to bacterial growth. Once excreted from their host, fecal bacteria typically have a limited ability to survive in the water column, as the organisms encounter limited nutrient availability, osmotic stress, large variations in temperature and pH, and predation (EPA 2001; Winfield and Groisman 2003). Death rates can be influenced by temperature, salinity, predation and sunlight. However, it is usually considered sufficient to approximate the die-off rate with an exponential decay which is dependent on concentration and temperature. Low survival rates of E. coli in waterbodies have been well documented with an approximate half life of 1 day (Winfield and Groisman 2003). Anecdotal evidence suggests that coliform exposed to polluted waters may survive for long periods of time and reproduce. In addition, bottom sediments can serve as a reservoir for fecal indicator bacteria, complicating the link between sources and bacteria concentrations in the water column. The fate of E. coli in sediment, though, is not clear and has been the topic of many studies. Bacterial Re-suspension Fecal indicator bacteria can adhere to suspended particles in water which then settle causing an accumulation of bacteria in the bottom sediment (Davies et al. 1995). Numerous studies have found fecal indicator bacteria at greater concentrations in the sediment than in the overlying water in rivers, estuaries and beaches (Stephenson and Rychert 1982; Struck 1988; Obiri-Danso and Jones 2000; Byappanahalli et al. 2003; Whitman and Nevers 2003). Concentrations in the sediment can range from 10 to 100 times greater than in the overlying water. Re-suspension of bottom sediment has been shown to increase fecal indicator bacteria concentrations in the water column. (Sherer et al. 1988; Le Fever and Lewis 2003). The higher concentrations of fecal indicator bacteria in sediment are attributed to much slower die-off rates when compared to overlying water (Gerba and MeLeod 1976; LaLiberte and Grimes 1982; Burton et al. 1987; Sherer et al. 1992; Davies et al. 1995). Davies et al. (1995) found that the usual exponential decay model is not appropriate for fecal coliforms in sediment. Particle size distribution, nutrients and predation were hypothesized to influence survival rates; however, no quantitative correlation of survival rates with environmental factors was presented. Two recent field studies have indicated the possibility that fecal indicator bacteria can form a stable, dividing population in sediment in a temperate environment (Whitman and Nevers 2003; Byappanahalli et al. 2003). Whitman and Nevers (2003) concluded that “more research into the environmental requirements and potential for in situ growth is necessary before E. coli multiplication in temperate environments can be confirmed, but this study provides initial data supporting that hypothesis.”
3.1.4 Deviation from Water Quality Standards and 303(d) Listings for Bacteria OAR 340-042-0040(4)(a) Concentrations of fecal bacteria within the Rogue River Basin exceeded the water quality standard criteria for bacteria during certain times of the year. Those segments that do not meet the water quality criteria are placed on the DEQ 303(d) list as required by the Federal Clean Water Act. The impaired beneficial use leading to the following listings is water contact recreation. All 303(d) listed streams for coliform bacteria in the Rogue River Basin, with the exception of those in the Bear Creek watershed (TMDL approved 2007), are shown in Tables 3.3 and 3.4 and Figure 3.1.

Rogue River Basin TMDL: Bacteria December 2008
OREGON DEPARTMENT OF ENVIRONMENTAL QUALITY 3-5
Table 3.3. 2004/2006 303(d) Bacteria listings for water contact recreation within the Rogue River Basin
River Segment River Mile Parameter Season** Watershed
Rogue River 94.9 to 110.7 Fecal Coliform Summer Grants Pass-Rogue
River
Reese Creek 0 to 3.0 E. coli Summer Shady Cove-Rogue River
Trail Creek 0 to 10.8 E. coli Summer Trail Cr
Evans Creek 0 to 19.1 Fecal Coliform Summer Evans Cr
Evans Creek 0 to 19.1 Fecal Coliform Fall/Winter/Spring Evans Cr
Antelope Creek 0 to 19.7 E. coli Summer Little Butte Cr
Antelope Creek 0 to 19.7 E. coli Fall/Winter/Spring Little Butte Cr
Lake Creek 0 to 7.8 E. coli Summer Little Butte Cr Lake Creek 0 to 7.8 E. coli Fall/Winter/Spring Little Butte Cr Lick Creek 0 to 6.8 E. coli Summer Little Butte Cr Little Butte Creek
0 to 16.7 E. coli Summer Little Butte Cr
Little Butte Creek
0 to 16.7 E. coli Fall/Winter/Spring Little Butte Cr
Little Butte Creek
0 to 16.7 Fecal Coliform Summer Little Butte Cr
Little Butte Creek
0 to 16.7 Fecal Coliform Fall/Winter/Spring Little Butte Cr
Nichols Branch 0 to 2.7 E. coli Summer Little Butte Cr Nichols Branch 0 to 2.7 E. coli Fall/Winter/Spring Little Butte Cr North Fork Little Butte Creek
0 to 6.5 E. coli Fall/Winter/Spring Little Butte Cr
Salt Creek 0 to 9 E. coli Summer Little Butte Cr Salt Creek 0 to 9 E. coli Fall/Winter/Spring Little Butte Cr South Fork Little Butte Creek
0 to 16.4 E. coli Summer Little Butte Cr
TOTAL miles 242.7 Total number of miles listed for summer fecal coliform (n=3) 51.6
Total miles listed fecal coliform fall/winter/spring (n=2) 35.8 Total number of miles listed for summer E. coli (n=9) 92.9 Total miles listed E. coli fall/winter/spring (n=6) 62.4
** Water quality limitations are separated into two seasons: summer (June 1 through September 30) and fall/winter/spring (October 1 through May 31).

Rogue River Basin TMDL: Bacteria December 2008
OREGON DEPARTMENT OF ENVIRONMENTAL QUALITY 3-6
Table 3.4 shows the segments on the 2004/2006 303(d) list that contain errors. Although the segment listings contain errors, the reaches fall within the geographic scope of this document; therefore this TMDL applies to these listed reaches. In the future, if there is evidence to support a bacterial impairment of these areas, this TMDL will apply to these reaches as well as currently unlisted reaches that lie within the geographic scope. Table 3.4. 2004/2006 303(d) Listings in error
River Segment River Mile Parameter Season Watershed
Antelope Creek* 19.7 to 19.7 E. coli Summer Little Butte CreekNichols Branch* 0 to 0.5 E. coli Summer Little Butte CreekNorth Fork Little Butte Creek** 0 to 6.5 E. coli Summer Little Butte Creek
Big Butte Creek*** 0 to 11.6 E. coli Summer Big Butte Creek Elk Creek*** 0 to 20.7 E. coli Summer Elk Creek
* incorrect digitization of river miles led to these duplicate listings ** segment incorrectly categorized as “TMDL approved” but should be “TMDL needed” ***incorrect data were used to assess these segments as “TMDL needed” but should be “Attaining”

Rogue River Basin TMDL: Bacteria December 2008
OREGON DEPARTMENT OF ENVIRONMENTAL QUALITY 3-7
Figure 3.1. Rogue River Basin. 303(d) bacteria listings for water contact recreation shown in Red
California
Oregon
Upper Rogue subbasin
Bear Creek watershed(TMDL completed 2007)
Rogue mainstem watersheds(crosses 3 subbasins)
Evans Creek watershedAntelope Creek
Salt Creek
Lake Creek
Lick Creek
South Fork Little Butte Creek
North Fork Little Butte Creek
Nichols B
ranch
Medford
Grants Pass
Ashland
Central Point
Eagle Point
TalentPhoenix
Shady Cove
Jacksonville
Cave Junction
Gold HillRogue River
Butte Falls
Gold Beach
Rogue River
Evans Creek
Trai
l Cre
ek
Reese Creek
303(d) listed as bacteria "TMDL needed"
cities
rivers and creeks
0 10 205 Miles ±

Rogue River Basin TMDL: Bacteria December 2008
OREGON DEPARTMENT OF ENVIRONMENTAL QUALITY 3-8
3.1.5 Existing Pollution Sources OAR 340-042-004(4)(f), CWA §303(d)(1)
Natural background Sources Natural background sources of fecal bacteria include those sources associated with wildlife (non-domestic animals). This includes animals such as deer, rats, raccoons, ducks, geese and others that live or graze near or in surface waters. For the purposes of this plan, these bacterial sources are considered natural and are part of the natural background of bacteria in the Rogue River Basin. Point Sources As discussed in Chapter 1, there are 216 general NPDES permits within the scope of this TMDL. All 10 types of general permits require pollution prevention strategies and/or plans. The site controls and monitoring requirements minimize the impact of permitted facilities to receiving streams. NPDES general permitted point sources are not expected to be a significant source of fecal bacteria and are allocated a load which is equivalent to the fecal bacteria concentrations at or below the water quality standard. Individual NPDES permitted point sources are required by Oregon law to meet the numeric water quality criteria for fecal bacteria prior to discharge to surface waters. If an exceedance of the criteria is observed, the standard allows the permitted to take a series of consecutive samples following the violative sample to demonstrate compliance overall (see OAR 340-041-0009(5) for details of the re-sampling protocol). Note that as part of the development of this TMDL, required Discharge Monitoring Reports (DMRs) were reviewed from all NPDES individual permit sources within the Rogue River Basin to ensure that discharges are in compliance. The NPDES permits for these facilities require that the effluent not exceed 126 E. coli organisms per 100 ml based on a 30-day log mean and no single sample shall exceed 406 E. coli organisms per 100 ml prior to discharge, with no allowance for mixing. In addition, by rule, overflows of untreated sewage are prohibited in the summer months except during the 1-in-10 year 24 hour storm and in the winter months. The plant is expected to convey and treat all sewage up to the 1-in-5 year 24 hour storm. Monthly DMRs are required from all sources and are reviewed by DEQ on a regular basis. If permit limits are exceeded, DEQ may take an enforcement action. Enforcement actions related to bacterial releases have been the result of exceeding the 406 E. coli/100 mL daily maximum criterion for a very short period of time. These releases are not anticipated to impact the log mean bacteria concentrations in the Rogue River as represented by the 126 E. coli/100mL 30-day log mean criterion. In addition, the permits prohibit the discharge of untreated sewage except during certain storm events. Raw sewage discharges are prohibited to waters of the state from November 1- May 21, except during a storm event greater than a 1-in-5 year, 24 hour duration storm and from May 22-October 31, except during a storm event greater than the 1-in-10 year, 24 hour duration storm event. Stormwater NPDES Permits There are no Phase II communities operating under stormwater permits that fall within the geographic scope of this TMDL. Confined Animal Feeding Operation Confined Animal Feeding Operations (CAFOs) registered to the Oregon CAFO general (NPDES) permit are managed to ensure no discharge of fecal bacteria or nutrients under normal conditions. Discharge is allowed under conditions of an extreme rainfall event, defined in the permit as greater than the 25-year/24-hour rainfall amount. To qualify for this exemption, CAFOs operate and maintain their system as designed to contain all waste and the precipitation from one 25-year/24-hour rainfall event. The general permit also stipulates that during such a discharge, effluent cannot cause or contribute to a violation of state water quality standards. All land application of manure and process wastewater must be done in accordance with Oregon Department of Agriculture (ODA) approved Animal Waste Management Plan (AWMP). The AWMP is required for each CAFO. The general permit refers to each site-specific AWMP. Each permitted CAFO receives a routine inspection from the area Livestock Water Quality Inspector once a year, on average. During this inspection, the operator and inspector discuss the operation and review required plans and records. The inspector views the entire operation to assure compliance with permit

Rogue River Basin TMDL: Bacteria December 2008
OREGON DEPARTMENT OF ENVIRONMENTAL QUALITY 3-9
terms and water quality rules and laws. The inspection reports detail permit compliance in the following areas: permitted number of animals, animal confinement requirements, manure and silage containment requirements, manure application requirements, AWMP, and record keeping. Problems in any of these areas, including incomplete record keeping, can result in the issuance of a water quality advisory or a notice of noncompliance (NON). When a discharge occurs or where there is a potential for a discharge to occur, the Oregon Department of Agriculture may take samples of the effluent to determine bacterial concentrations. Surface water quality samples are taken when visual or anecdotal evidence of discharge is present. NONs have been issued to CAFOs in the Rogue River Basin. Some of these NONs have detailed potential releases of bacteria and the potential for CAFOs to impact bacteria levels in the Rogue River. In the event a violation is found, the inspector works with the operator to develop a solution to the problem and a schedule to complete the corrective actions. ODA can also issue civil penalties for violations listed in NONs. Nonpoint Sources Nonpoint source pollution comes from diffuse sources as opposed to point source pollution which is discharged by an individual facility through a pipe into a waterbody. Potential nonpoint fecal bacteria sources include wildlife, livestock waste, pets, and illegal discharges. Fecal bacteria can be deposited directly into a water body or transported into water bodies by runoff or subsurface flow. The behavior of typical nonpoint source bacterial pollution follows certain well-established patterns. Fecal material accumulates on ground surfaces within the watershed and is carried into streams and rivers during rainfall events. This pattern of low bacterial numbers in the summer and high values in the rainy season with the highest values during the first fall freshets has been seen in other watersheds west of Oregon’s Cascade Mountains (DEQ 2001; DEQ 2003). However, much of the high summer bacterial concentrations seen in Bear Creek are the result of extensive irrigation water use and transfer (DEQ 2007). Within the Bear Creek watershed irrigation water passes through a complex system of over 250 miles of canals, laterals and ditches picking up bacteria as excess water runs over fields, animal pastures, along roadside ditches or urban storm drains and culverts. The highest bacterial loads in Bear Creek occur during peak irrigation season in July through October when there is little to no rainfall – over 70% of samples exceeded the criteria compared to 28% during the wet season (DEQ 2007). The sources of the fecal bacteria are not always obvious. Many of these sources overlap in space and time; for instance, a rural residential area may have a failing septic system, livestock, pets, and wildlife. The following is a discussion of potential bacteria sources by land use. Onsite Systems Failing and/or poorly situated on-site sewage systems can produce significant loads of E. coli. An on-site system may not be visibly failing but located too close to streams to properly treat sewage. If failing or poorly situated on-site systems were the dominant source of bacteria loading, bacteria concentrations would likely remain constant in the winter between rainfall events when soil is saturated due to constant loading. This pattern has not been observed in the Rogue River Basin with current data. Thus, while there may be some contribution from failing on-site sewage systems, this does not appear to be the dominant source of bacteria in Rogue River Basin. There are regulatory programs in place at DEQ to ensure on-site systems do not cause or contribute to water quality violations. In the Rogue River Basin, DEQ manages the onsite program within Josephine County, while Jackson and Curry Counties manage their own programs. Forest Managed Lands Approximately 84% of the Rogue River Basin is classified as forested (NLCD 2001). Bacterial contamination in forested areas can result from a variety of sources including dispersed and developed recreation, wild and domestic animal populations, and human settlements (MacDonald et al. 1991). In forested areas, high levels of fecal bacteria usually will be associated with inadequate waste disposal by recreational users, the presence of livestock or other animals in the stream channel or riparian zone, and poorly maintained septic systems (MacDonald et al. 1991). There is little data locally that indicate the potential input of bacteria from forest areas, usually located in the headwaters of tributaries in the Rogue River Basin. Bacterial TMDL studies in the Willamette and North Coast Basins have indicated that background levels coming from forested areas are well below standards.

Rogue River Basin TMDL: Bacteria December 2008
OREGON DEPARTMENT OF ENVIRONMENTAL QUALITY 3-10
Agricultural Lands Approximately 8% of the Rogue River Basin is considered agricultural land use (NLCD 2001). Bacteria from livestock waste can be transported to the stream during rainfall/runoff events and bacteria in livestock waste can be directly deposited to streams while livestock are watering. Septic systems, pets, and wildlife are also commonly associated with agricultural land. Differing management practices especially those that may result in irrigation return flows may impact the delivery of fecal bacteria to water bodies from agricultural lands. Irrigation Districts There are several large irrigation districts and numerous smaller ditch associations operating within the Rogue River Basin. While irrigation district operations themselves are not a source of fecal bacteria, the laterals and canals that are used to convey water can play a major role in transporting bacterial contamination across the landscape and into surface waters. The distribution of bacteria throughout the Rogue River Basin as well as the timing of those levels may be impacted by the movement of irrigation water throughout the region by the irrigation practices. It has been shown elsewhere in the Rogue River Basin that the distribution of bacteria as well as the timing of the levels found in surface water can be greatly impacted by the movement of irrigation water (DEQ 2007). It should be emphasized that irrigation systems do not create bacteria but they can transport it. Rural Residential and Urban Lands The potential inputs from the cities of Shady Cove, Eagle Point, Gold Hill, Rogue River, Grants Pass, Cave Junction, Gold Beach, and other communities within Jackson, Josephine, and Curry Counties are similar in nature to the inputs from NPDES Phase II communities in the Rogue River Basin and may include bacteria, pesticides, fertilizers, oils, heavy metals, salt, litter, pet waste and other debris, and sediment. In addition to stormwater runoff, another concern in urbanized areas is possible illicit or cross connections of storm drains and sanitary sewers resulting in untreated discharge.
3.1.6 Analytical Methods Overview DEQ developed the Rogue River Basin Bacteria TMDL using data collected by DEQ, the Little Butte Creek Watershed Council, City of Eagle Point, Medford Water Commission, the South Coast and Lower Rogue River Watershed Councils. All data used in this TMDL have passed DEQ approved QA/QC procedures and unless otherwise noted have achieved a data quality level of A or better. DEQ used box-and whisker-plots (box plots) to assess the longitudinal and temporal distribution of sampled bacteria values. Box plots illustrate several characteristics of the bacteria data at a site, including extreme values (outliers). Box plots use the median as a measure of central tendency and the interquartile range (the 25th percentile to 75th percentile) as a measure of spread. Figure 3.2 shows two examples of box plots and how to interpret their data distribution. Where sufficient data were available, box plot data were plotted longitudinally to highlight potential differences that may be associated with land use, tributaries, or point sources along a stream.

Rogue River Basin TMDL: Bacteria December 2008
OREGON DEPARTMENT OF ENVIRONMENTAL QUALITY 3-11
Figure 3.2. Box and Whisker Plot examples
0
5
10
15
20
Box and Whisker Plot Example 1
In the Box Plot at left, the numbers 0 through 20 are plotted based on their distribution as a percent of the total.
The median = 1075th Percentile = 1525th Percentile = 5
Ends of the “whiskers” are the extreme values in the data excluding “outliers”
Median
75 th Percentile
25 th Percentile
0
5
10
15
20
25
30
35
40 Box and Whisker Plot Example 2
In the Box Plot at left, the numbers 0 through 20 are plotted based on their distribution as a percent of the total. An additional number,35, is plotted as an “outlier”
Outliers are greater than 1.5 times the range between the 25th and 75th Percentiles
Median
75 th Percentile
25 th Percentile
DEQ used another analytical approach, a load duration curve, to examine data from sites where daily flow data were available or could be calculated based on a relationship with flow measured at another site. DEQ chose the load duration curve approach because it illustrates bacteria loading under various flow conditions and can be used to help target appropriate water quality restoration efforts (Cleland 2002). Load duration curves are a method of determining a flow based loading capacity, assessing current conditions, and calculating the necessary reductions to comply with water quality criteria. Figure 3.3 illustrates a load duration curve. Each bacterial load is based on a measured E. coli concentration. Bacterial loads are calculated by multiplying the concentration of a sample by the flow volume and standardizing to a 24-hour day. Bacterial loads are plotted in relation to the likelihood that a given flow rate will occur (exceedance probability on the x-axis) based on historical flow data. Low flows have a high exceedance probability, while high flows have a low exceedance probability. The range of observed flows was separated into five categories based on flow percentiles: high (<10%), transitional (10-40%), typical (40-60%), dry (60-90%), and low (>90%). These flow regimes were determined internally at DEQ. In other bacterial TMDLs (DEQ 2003; DEQ 2006a; DEQ 2006b), load duration curves were used to make flow-based source assessments. The assumptions made in these systems are that high fecal bacteria values during low flow periods (60-90% flow, called dry flow) indicate that point sources, not associated with runoff, are the primary impact to the systems. High fecal values during high flow periods (10-40% flow, called wet weather) are indicative of nonpoint source inputs from across the landscape, generally associated with rainfall and runoff events. The expected relationships do not apply to the entire Rogue River Basin. Irrigation water delivery and return, especially during the summer, can

Rogue River Basin TMDL: Bacteria December 2008
OREGON DEPARTMENT OF ENVIRONMENTAL QUALITY 3-12
have a significant impact on flows within the Rogue River and its tributaries (DEQ 2007). In some systems within the Rogue River Basin, such as Bear Creek, some of the highest creek flows occur during the summer dry period when irrigation demands are the highest (DEQ 2007). EPA’s current regulation defines loading capacity as “the greatest amount of loading that a waterbody can receive without violating water quality standards.” (40 CFR §130.2(f)). It provides a reference for calculating the amount of pollutant reduction needed to bring water into compliance with standards. Seasonal load allocations and load allocations based on the load duration curve method were determined in each of the geographic sections. The loading capacities are determined by multiplying the applicable criteria (126 E. coli /100 ml or 406 E. coli /100 ml) by the flow and converting the units into organisms per day. In all load duration curves in this document, the thin green line represents loading capacity based on 126 E. coli /100mL per day, and the thick red line represents the loading capacity based on 406 E. coli/100mL per day as a function of flow (see Figure 3.4). Percent reduction targets were calculated based on the difference between the applicable criteria and measured E. coli concentrations and can be used as a guide to determine degree of improvement needed to reach the criteria. In order to determine the percent reduction targets for each of the defined flow ranges, data were plotted on the load duration curve and the differences between the sampled loads and the criteria were determined. Percent reduction targets needed to meet the loading capacity were determined by comparing the actual measured loads to the loading capacity within each of the 5 flow ranges. The log mean and maximum values of the measured loads within the flow intervals were compared with the 126 and 406 E. coli / 100mL criteria, respectively, and then used to calculate the loads and percent reductions. Figure 3.4 demonstrates the graphical representation of the calculated bacteria load as compared to the loading capacity. The green lines represent the geometric means of sampled E. coli values and the red diamonds represent the maximum sampled E. coli value expressed as a load within the flow interval. In Figure 3.4, where a reduction of bacteria is required to meet the WQS, an arrow was added, as well as the percent reduction value.

Rogue River Basin TMDL: Bacteria December 2008
OREGON DEPARTMENT OF ENVIRONMENTAL QUALITY 3-13
Figure 3.3. Example Load Duration Curve showing the loading capacity and calculated event loads
8.4
cfs
28 c
fs
450
cfs
93 c
fs
1.0E+07
1.0E+08
1.0E+09
1.0E+10
1.0E+11
1.0E+12
1.0E+13
1.0E+14
1.0E+15
0 10 20 30 40 50 60 70 80 90 100
Flow duration interval (%)
E. c
oli d
aily
in s
tream
load
(org
s/da
y)
126 E. coli/100mL per day 406 E. coli/100mL per day Load (E. coli/100mL per day)
High Transitional Flow Typical Flow Dry Flow Low Flow Flow

Rogue River Basin TMDL: Bacteria December 2008
OREGON DEPARTMENT OF ENVIRONMENTAL QUALITY 3-14
Figure 3.4. Example Load Duration Curve showing the loading capacity and percent reductions
8.4
cfs
28 c
fs
450
cfs
93 c
fs
1.0E+07
1.0E+08
1.0E+09
1.0E+10
1.0E+11
1.0E+12
1.0E+13
1.0E+14
1.0E+15
0 10 20 30 40 50 60 70 80 90 100
Flow duration interval (%)
E. c
oli d
aily
in s
tream
load
(org
s/da
y)
geometric mean of sampled E. coli daily loads within flow regimemaximum of sampled E. coli daily loads within flow regime
High Transitional Flow Typical Flow Dry Flow Low Flow Flow
74%84%
54%
In addition to flow based load allocations, seasonal load allocations were calculated for several mainstem sites used in load duration curves, as well as several tributary sites where no flow data were available. The seasons were summer (June 1 – September 30) and fall/winter/spring (October 1 – May 31). Percent reductions will serve as a surrogate measure for allocations. A percent reduction in the log mean of E. coli concentrations collected during the season required to meet the water quality standard of 126 E. coli/100 mL at a site was calculated as:
100* ml) 100 / org (E.coliMean Log
ml) 100 / org (E.coli 1261reduction % ⎟⎟⎠
⎞⎜⎜⎝
⎛−=
A percent reduction in the maximum E. coli concentration collected during the season required to meet the water quality standard of 406 E. coli/100 mL at a site was calculated as:
100* ml) 100 / org (E.coli Maximum
ml) 100 / org (E.coli 4061reduction % ⎟⎟⎠
⎞⎜⎜⎝
⎛−=
Note that in this TMDL, the distinction between sources, such as wildlife, livestock, failing septic systems, urban runoff, and agricultural runoff, was not possible because of the complex movement of water around the watershed as well as the complexity of spatially overlapping sources. Therefore, all percent reduction targets generally apply to all upstream land within the specified basin or tributary watershed.
Rogue River Basin TMDL: Bacteria December 2008
OREGON DEPARTMENT OF ENVIRONMENTAL QUALITY 3-15
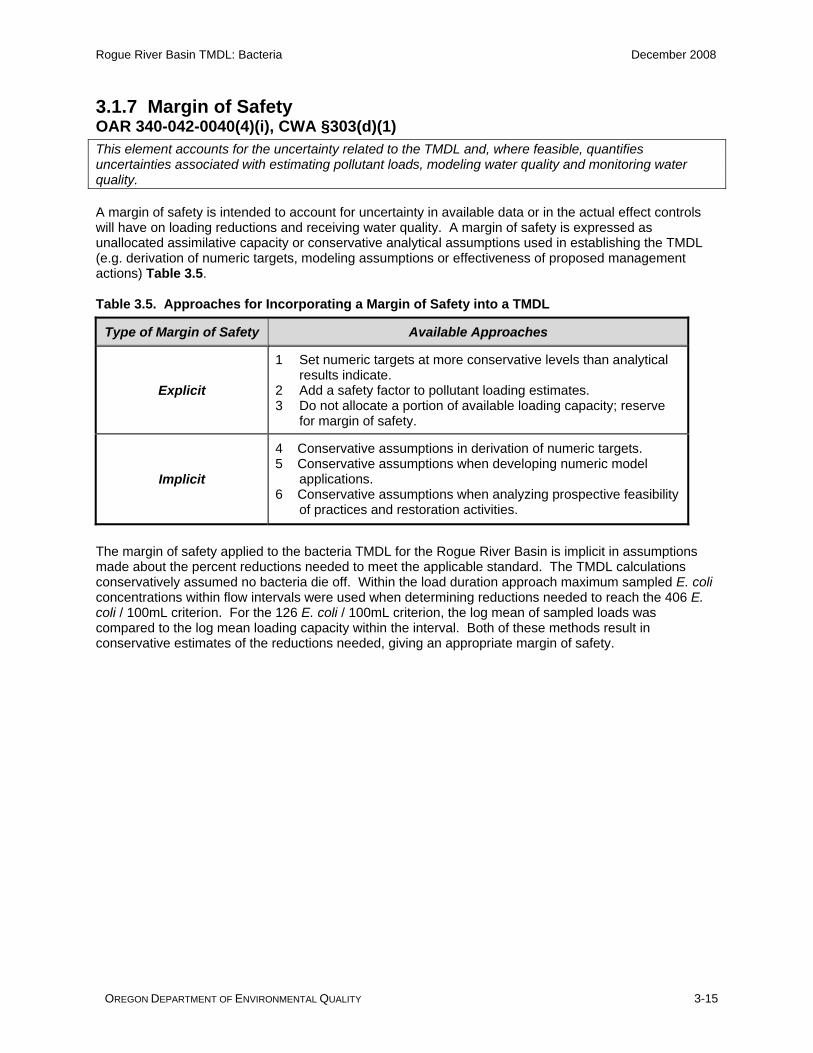
3.1.7 Margin of Safety OAR 340-042-0040(4)(i), CWA §303(d)(1) This element accounts for the uncertainty related to the TMDL and, where feasible, quantifies uncertainties associated with estimating pollutant loads, modeling water quality and monitoring water quality. A margin of safety is intended to account for uncertainty in available data or in the actual effect controls will have on loading reductions and receiving water quality. A margin of safety is expressed as unallocated assimilative capacity or conservative analytical assumptions used in establishing the TMDL (e.g. derivation of numeric targets, modeling assumptions or effectiveness of proposed management actions) Table 3.5. Table 3.5. Approaches for Incorporating a Margin of Safety into a TMDL
Type of Margin of Safety Available Approaches
Explicit
1 Set numeric targets at more conservative levels than analytical results indicate.
2 Add a safety factor to pollutant loading estimates. 3 Do not allocate a portion of available loading capacity; reserve
for margin of safety.
Implicit
4 Conservative assumptions in derivation of numeric targets. 5 Conservative assumptions when developing numeric model
applications. 6 Conservative assumptions when analyzing prospective feasibility
of practices and restoration activities.
The margin of safety applied to the bacteria TMDL for the Rogue River Basin is implicit in assumptions made about the percent reductions needed to meet the applicable standard. The TMDL calculations conservatively assumed no bacteria die off. Within the load duration approach maximum sampled E. coli concentrations within flow intervals were used when determining reductions needed to reach the 406 E. coli / 100mL criterion. For the 126 E. coli / 100mL criterion, the log mean of sampled loads was compared to the log mean loading capacity within the interval. Both of these methods result in conservative estimates of the reductions needed, giving an appropriate margin of safety.

Rogue River Basin TMDL: Bacteria December 2008
OREGON DEPARTMENT OF ENVIRONMENTAL QUALITY 3-16
3.2 ROGUE MAINSTEM WATERSHEDS
3.2.1 Watershed Description This section addresses the Rogue Mainstem Watersheds, an analysis area that consists of the following 5th field watersheds; Shady Cove-Rogue River, Gold Hill-Rogue River, Grants Pass-Rogue River, Hellgate Canyon-Rogue River, Horseshoe Bend-Rogue River, Stair Creek-Rogue River, Shasta Costa Creek-Rogue River, & Rogue River (Figure 3.5). Together these watersheds comprise an area of 626,361 acres and cover the area from the base of the Lost Creek Dam, river mile 157, to the mouth of the Rogue River in the Pacific Ocean. Figure 3.5. Rogue Mainstem Watersheds
Rogue River upstream of Pass Creek (at Whitehorse Park)
Reese Creek at Hwy 62 bridge
Rogue River at Hwy 234 (Dodge Park)
Rogue River at Hwy 99 (Grants Pass)
Rogue River downstream of Galice Creek
Rogue River at Robertson Bridge (Merlin)
Rogue River at Hwy 234 (north of Gold Hill)
Rogue River at Table Rock Road, Tou Velle Boat Launch
70
90
100
157.6
80
110120 130
140
150
68.8
Medford
Grants Pass
Eagle Point
Phoenix
Shady Cove
Gold HillRogue River
303(d) listed as "TMDL needed"
streams and rivers
Rogue mainstem watersheds
highways ± 0 8 164 Miles
303(d) listings shown in Red
3.2.2 Waterbodies Listed for Bacteria OAR 340-042-0040(4)(a) 303(d) listed streams are also shown on Figure 3.6.

Rogue River Basin TMDL: Bacteria December 2008
OREGON DEPARTMENT OF ENVIRONMENTAL QUALITY 3-17
3.2.3 Current Conditions: Rogue Mainstem Bacteria Analysis Sampling Sites E. coli data for 23 sites within the Rogue Mainstem Watersheds were examined from the period of 1/10/1996 to 6/4/2007 (number of data points: n=537). Figure 3.6 and Table 3.6 shows the bacteria sample sites as well as log mean and maximum concentrations of bacteria at each site for the data set. There were five Rogue River mainstem sites from Robertson Bridge (river mile 86.4) to just upstream of Gold Hill (river mile 117.0) where E. coli concentrations exceeded the criteria. Mainstem Rogue River samples taken at stations above Gold Hill (n= 210) did not exceed the water contact recreation standard. Within the Rogue Mainstem Watersheds, there were 4 sampled tributaries with E. coli concentrations that exceeded the criteria; Reese Creek (303(d) listed), Jones Creek (n=8), Sardine Creek (n=1), and Whetstone Creek (n=4). Note that in Table 3.6, tan shading indicates tributary inflows to the mainstem Rogue River and green shading indicates exceedance of the E. coli criteria.

Rogue River Basin TMDL: Bacteria December 2008
OREGON DEPARTMENT OF ENVIRONMENTAL QUALITY 3-18
Figure 3.6. E. coli Sampling Sites and Maximum Concentrations: Rogue Mainstem Watersheds
Jones Creek at mouth
Taylor Creek at mouth
Galice Creek at mouth
Sardine Creek at mouth
Rogue River at Hwy 199Reese Creek at Hwy 62 bridge
Whetstone Creek at Kirtland Road
Rogue River at Hwy 62 (Shady Cove)
Rogue River at Hwy 234 (Dodge Park)
Rogue River at Hwy 99 (Grants Pass)Rogue River 2.5 miles w of Grants Pass
Rogue River downstream of Galice Creek
Rogue River at Robertson Bridge (Merlin)
Rogue River at Hwy 234 (north of Gold Hill)
Rogue River upstream of Hog Creek Boat Launch
Rogue River upstream of Pass Creek (at Whitehorse Park)
Rogue River at Blackwell Road, just east of Gold Hill, OR
Rogue River at city of Rogue River (upstream of Evans Creek)
Rogue River at Table Rock Road, Tou Velle Boat Launch
Rogue River at Chinook Park Boat Ramp (upstream of Grants Pass, Oregon)
Rogue River at Lobster Creek Bridge
0
10
30
4050
6070
80
90
100
130
140
150157.6
20
110 120
Medford
Grants Pass
Eagle Point
Talent
Shady Cove
Butte F
Gold Beach
E. Coli values at site
maximum E. Coli org.s/100mL0.0 - 126.0
126.1 - 406.0
406.1 - 700.0
700.1 - 1000.0
1000.1 - 3500.0
303(d) listed as bacteria "TMDL needed"
streams and rivers
cities
highways± 0 9 184.5 Miles

Rogue River Basin TMDL: Bacteria December 2008
OREGON DEPARTMENT OF ENVIRONMENTAL QUALITY 3-19
Table 3.6. E. coli data for the Rogue Mainstem Watersheds
Tributary Mile
River Mile Station Description
DEQ station
ID
log mean E. coli
Maximum E. coli
Number Samples
75.8 Rogue River downstream of Galice Creek 30211 27.1 135.0 14
0 76.0 Galice Creek at mouth 30210 4.0 34.0 14
82.7 Rogue River upstream of Hog Creek Boat Launch 30519 37.0 325.0 14
5 86.2 Taylor Creek at mouth 30720 3.6 43.0 14
86.4 Rogue River at Robertson Bridge (Merlin) 10418 31.6 1203.0 82
94.3 Rogue River upstream of Pass Creek (at Whitehorse Park) 30206 61.9 601.0 16
97.5 Rogue River 2.5 miles w of Grants Pass 10419 121.1 1120.0 16
100.0 Rogue River at Hwy 99 (Grants Pass) 10420 75.0 488.0 16
102.0 Rogue River at Hwy 199 30518 54.4 58.0 20 104.0 Jones Creek at mouth 30207 198.8 1120.0 8
106.0
Rogue River at Chinook Park Boat Ramp (upstream of Grants Pass, Oregon) 30714 42.7 147.0 7
111.0 Rogue River at city of Rogue River (upstream of Evans Creek) 30721 42.0 173.0 16
117.0 Rogue River at Hwy 234 (north of Gold Hill) 10421 37.5 921.0 91
0 117.7 Sardine Creek at mouth 30209 2902.8 2902.8 1
120.0 Rogue River at Blackwell Road, just east of Gold Hill, OR 30718 33.2 105.0 8
1.1 128.1 Whetstone Creek at Kirtland Road 11135 308.0 308.0 1
131.2 Rogue River at Table Rock Road (Medford) Tou Velle Boat Launch 10031 26.4 249.0 83
138.4 Rogue River at Hwy 234 (Dodge Park) 10423 7.9 160.0 81
0.5 139.0 Reese Creek at Hwy 62 bridge 23765 941.7 3280.0 25
145.7 Rogue River at Hwy 62 (Shady Cove) 11815 4.4 73.0 8
XX Rogue River@ MacGregor Park NA 1.0 1.0 1 XX Rogue River@ Takelma Park NA 11.0 12.0 2 XX Rogue River@ Trail Cr. NA 10.0 20.0 2
Notes: Tan shading indicates tributary inflows to the mainstem Rogue River. Green shading indicates exceedance of the E. coli criteria. NA = DEQ site number (from the LASAR database) not assigned

Rogue River Basin TMDL: Bacteria December 2008
OREGON DEPARTMENT OF ENVIRONMENTAL QUALITY 3-20
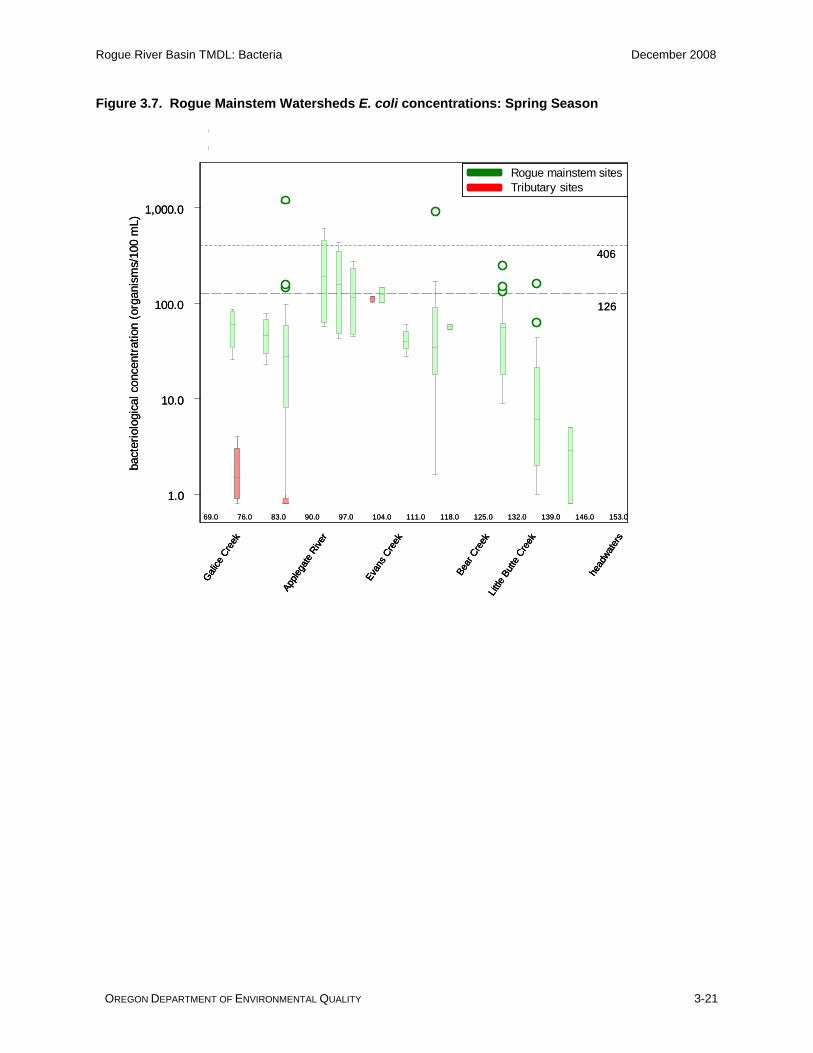
3.2.4 Seasonal Variation OAR 340-041-0040(4)(j), CWA §303(d)(1) The seasonality of bacterial concentrations was examined in the Rogue Mainstem Watersheds. The 303(d) list defines the seasons as summer from June 1 – September 30 and fall/winter/spring from October 1 – May 31. For purposes of this TMDL analysis, seasons were defined every three months. Spring was March 1 – May 31, summer was June 1 – August 31, fall was September 1 – November 30, and winter was December 1 – February 28. Spring: During the spring season (Figure 3.7), defined by the analysis of available data between March 27 through May 17 for the period of 1996-2004 (n = 149) median E. coli concentrations generally increased at the Rogue River mainstem sites from RM 145 to RM 93 indicating that additional bacteria is added in this reach. Downstream of RM 93 dilution occurs as bacterial levels drop. The tributary at RM 104.0, Jones Creek, exceeded the 126 E. coli / 100 mL criteria with a log mean of 198.8 orgs/100mL. Summer: During the Summer season (Figure 3.8), defined by the analysis of available data between July 24 through Sept 18 for the period of 1996-2004 (n = 133), median E. coli concentrations generally increased at the Rogue River mainstem sites from RM 145 to RM 93 indicating that additional bacteria is being added in this reach. At RM 93 and below, dilution occurred as bacterial levels drop to below the criteria. Available tributary data at Reese Creek (RM 139.0), and Jones Creek (RM 104.0) show high concentrations well above the 406 E. coli /100 mL criterion. Note that during the Summer and Fall, all samples in Reese Creek exceeded the 126 E. coli /100 mL criterion and 14 of 16 exceeded the 406 E. coli /100 mL criterion (1998-1999). Fall: During the fall seasons (Figure 3.9) of 1996-2004 (n = 142), median E. coli concentrations increase from RM 145 to RM 93. At RM 93 and below, dilution occurred although bacterial levels approach the criteria just downstream of Galice Creek (RM 75.8). Available tributary data at Reese Creek (RM 139.0), Sardine Creek (RM 117.7), and Jones Creek (RM 104.0) all have high concentrations with medians in exceedance of the 406 E. coli /100 mL criterion. Winter: During the winter seasons (Figure not shown) of 1996-2007 (n = 108), median E. coli concentrations were fairly low, and there were no recorded exceedances in either the mainstem or the tributaries.
Rogue River Basin TMDL: Bacteria December 2008
OREGON DEPARTMENT OF ENVIRONMENTAL QUALITY 3-21
Figure 3.7. Rogue Mainstem Watersheds E. coli concentrations: Spring Season
69.0 76.0 83.0 90.0 97.0 104.0 111.0 118.0 125.0 132.0 139.0 146.0 153.0
1.0
10.0
100.0
1,000.0
bact
erio
logi
cal c
once
ntra
tion
(org
anis
ms/
100
mL)
E. Coli concentrations by river mile on Rogue River and tribuary sites during spring seasons (3/27/96 - 05/17/07)
126
406
Rogue mainstem sitesTributary sites
Evan
s Cre
ek
Apple
gate
Rive
r
head
wate
rs
Bear
Cre
ekLit
tle B
utte
Cre
ek
Galice
Creek
Evan
s Cre
ek
Apple
gate
Rive
r
head
wate
rs
Bear
Cre
ekLit
tle B
utte
Cre
ek
Galice
Creek

Rogue River Basin TMDL: Bacteria December 2008
OREGON DEPARTMENT OF ENVIRONMENTAL QUALITY 3-22
Figure 3.8. Rogue Mainstem Watersheds E. coli concentrations: Summer Season
69.0 75.0 81.0 87.0 93.0 99.0 105.0 111.0 117.0 123.0 129.0 135.0 141.0 147.0 153.0
1.0
10.0
100.0
1,000.0
bact
erio
logi
cal c
once
ntra
tion
(org
anis
ms/
100
mL)
E. Coli concentrations by river mile on Rogue River and tribuary sites during summer seasons (7/24/96 - 06/04/2007)
126
406
Rogue mainstem sitesTributary sites
Evan
s Cre
ek
Apple
gate
Rive
r
head
wate
rs
Bear
Cre
ekLit
tle B
utte
Cre
ek
Galice
Creek
Evan
s Cre
ek
Apple
gate
Rive
r
head
wate
rs
Bear
Cre
ekLit
tle B
utte
Cre
ek
Galice
Creek

Rogue River Basin TMDL: Bacteria December 2008
OREGON DEPARTMENT OF ENVIRONMENTAL QUALITY 3-23
Figure 3.9. Rogue Mainstem Watersheds E. coli concentrations: Fall Season Figure 3.3. Rogue Mainstem Watersheds E. coli concentrations: Fall Season
69.0 75.0 81.0 87.0 93.0 99.0 105.0 111.0 117.0 123.0 129.0 135.0 141.0 147.0 153.01.0
10.0
100.0
1,000.0
bact
erio
logi
cal c
once
ntra
tion
(org
anis
ms/
100
mL)
E. Coli concentrations by river mile on Rogue River and tribuary sites during fall seasons (9/18/96 - 11/08/06)
126
406
Rogue mainstem sitesTributary sites
Evan
s Cre
ek
Apple
gate
Rive
r
head
wate
rs
Bear
Cre
ekLit
tle B
utte
Cre
ek
Galice
Creek
Evan
s Cre
ek
Apple
gate
Rive
r
head
wate
rs
Bear
Cre
ekLit
tle B
utte
Cre
ek
Galice
Creek
Numerous tributaries in the Rogue Mainstem Watersheds deliver high concentrations of bacteria to the Rogue River during the summer and fall dry season. Figures 3.8 and 3.9 show high summer and fall bacteria concentrations originating in Reese Creek (RM 139.0), and Jones Creek (RM 104.0). Other tributaries to the Rogue River with measured high summer bacteria concentrations include Little Butte Creek (RM 132.2), Evans Creeks (RM 110.7) and Bear Creek (RM 126.5). Similar conditions may exist in Little Butte, Evans Creek, Indian Creek, Reese Creek and Jones Creek and will be discussed further in this chapter. The bacteria loads entering the Rogue Mainstem do not follow the expected nonpoint source pattern as described in Section 3.1.5. Figure 3.10 shows E. coli concentrations sampled on the Rogue River at Robertson Bridge (#10418) and at Hwy 234 (#10421) from 1996-2004 by month and average monthly rainfall. E. coli concentrations are slightly elevated during the period of May-November independent of average monthly precipitation which reaches its low in September.

Rogue River Basin TMDL: Bacteria December 2008
OREGON DEPARTMENT OF ENVIRONMENTAL QUALITY 3-24
Figure 3.10. Rogue Mainstem: E. coli Concentrations vs. Rainfall in the Vicinity of Grants Pass (RM 102.1)
Jan Feb Mar Apr May Jun Jul Aug Sep Oct Nov Dec
1
10
100
1,000
bact
erio
logi
cal c
once
ntra
tion
(org
anis
ms/
100m
L)
E. Coliprecipitation
and average monthly precipitation at Grants Pass
0
5
10
15
20
aver
age
mon
thly
pre
cipi
tatio
n (h
undr
edth
s of
inch
es)
126
Jan Feb Mar Apr May Jun Jul Aug Sep Oct Nov Dec
1
10
100
1,000
bact
erio
logi
cal c
once
ntra
tion
(org
anis
ms/
100m
L)
E. Coliprecipitation
and average monthly precipitation at Grants Pass
0
5
10
15
20
aver
age
mon
thly
pre
cipi
tatio
n (h
undr
edth
s of
inch
es)
126
3.2.5 Critical Period - Seasonal Variation Rogue Mainstem Watersheds: Section 303(d)(1) requires a TMDL to be “established at a level necessary to implement the applicable water quality standard with seasonal variations.” The critical period for the Rogue Mainstem Watersheds is that period of time when bacterial concentrations exceed the State of Oregon criteria for water contact recreation. Based on the 2004/2006 303(d) list (Table 3.1) and TMDL analysis, the Rogue River from river mile 86.4-110.7 and Reese Creek river mile 0-3.0 exceeded the applicable bacteria criteria during both defined seasons (summer and fall/winter/spring). The load duration curve method employed in this TMDL determines loads and percent reduction targets that apply year-round for all waters upstream of the point of analysis. Specific load and wasteload allocations apply to sources across the Rogue River Basin with the exception of those areas with previously developed TMDLs (See Chapter 1).
3.2.6 Existing Pollution Sources OAR 340-042-004(4)(f), CWA §303(d)(1) Point Sources There are 12 NPDES permits for wastewater treatment facilities in the Rogue Mainstem Watersheds. There have been 11 recorded exceedances of the 406 E. coli/100mL criterion and no recorded exceedances of the 126 E. coli/100mL criterion in the last 5 years. Relative Contribution of NPDES Individual Permits to Rogue River The percent of bacteria loading capacity that could be coming from NPDES individual permit point sources under extreme conditions was estimated. Only the 7 of 12 permitted sources that are likely to discharge effluent during the summer were quantified in Table 3.7. The estimates assume that all NPDES permitted facilities are in compliance with their permits and are discharging at the monthly log
406

Rogue River Basin TMDL: Bacteria December 2008
OREGON DEPARTMENT OF ENVIRONMENTAL QUALITY 3-25
mean concentration of 126 E. coli organisms per 100 ml and their maximum summer design flow. The estimates also take the conservative assumption that every bacterium that is discharged is transported alive, i.e. there is no die-off of bacteria in the river. The receiving waters flow was restricted to the low flow duration interval (exceedance probability > 90th percentile flow) on the Rogue River at mile 102.1 (gage 14361500). Based on the 126 orgs/100mL criterion, the Loading Capacity is 3.5x10¹² or less. Therefore, the combined point sources will contribute less than 3.5% of the total loading capacity under low flow conditions. The remainder of this load, or 96.5% or greater of the bacteria loading capacity can be assigned to nonpoint sources within the basin. Table 3.7. Estimated Potential Contributions of NPDES sources to the Loading Capacity of the Rogue River
Name of Facility Rogue River Mile
Summer: Dry Weather Flow
in MGD2
Estimated E. coli Load –
organisms per day
Percent of Rogue River Loading Capacity
Butte Falls 155.51 0.07 0.0 0.00%4 Shady Cove 143.1 0.45 2.15E+09 0.06% City of Medford 130.5 20 9.54E+10 2.71% Gold Hill 118.5 0.35 1.67E+09 0.05% Rogue River 110.0 0.43 2.05E+09 0.06% Grants Pass 100.9 4 1.91E+10 0.54% Cave Junction 27.53 0.52 0.0 0.00%4
Percent of Loading Capacity at 90th Percentile Flow 3.42% Notes: 1The City of Butte Falls discharges into South Fork Big Butte Creek at River Mile 1.0. Big Butte Creek enters the Rogue River at River Mile 155.5 2Summer season is defined as June 1-September 30. Dry weather flow is the average dry weather design capacity 3The City of Cave Junction discharges into the Illinois River at River Mile 54.6 Illinois River enters the Rogue at River Mile 27.5. 4These facilities do not discharge during the summer months
Confined Animal Feeding Operation (CAFO) At the time of this writing there are 13 permitted CAFOs within the Rogue Mainstem Watersheds with two of these facilities addressed previously in the Bear Creek Watershed TMDL (DEQ 2007) (See Chapter 1 for map). CAFO inspection reports in the Rogue Mainstem Watersheds were reviewed for the period from 1999 to 2007. Within the Rogue Mainstem Watersheds for the period of record (1999-2007), 7 of 11 CAFOs have been issued at least one notice of noncompliance (NON). Some of the NONs were issued for record keeping violations while other violations had the potential to, or resulted in, the release of bacteria to waters of the state. Exceedances were not quantified, and the actual impact of CAFOs is unknown. Nonpoint Sources Potential Contribution of Evans Creek to the loading capacity of the Rogue River What is the impact of Evans Creek on Rogue River bacteria levels? To determine this, the Loading Capacity of the Rogue River at the mouth of Evans Creek in July (>90th percentile flow) was calculated (5.3x10¹² organisms per day). In order to estimate how much of the bacteria loading capacity in the Rogue River at this point comes from current Evans Creek inputs, DEQ looked at average Evans Creek flows in July and bacteria concentrations at the mouth of the creek. Based on these calculations, under current conditions, Evans Creek contributes approximately 1% of the 126 E. coli organisms/100ml loading capacity or 5.3x10¹⁰ E. coli organisms per day. DEQ E. coli data from 1996 to 2007 show that there were no exceedances of the bacteria water quality standard at the mouths of the Illinois (n=65) or Applegate Rivers (n=90).

Rogue River Basin TMDL: Bacteria December 2008
OREGON DEPARTMENT OF ENVIRONMENTAL QUALITY 3-26
Irrigation Districts There are several irrigation districts operating in the Rogue Mainstem Watersheds including Gold Hill, Eagle Point, Grants Pass Irrigation District and numerous other small ditch associations. One of the larger districts in the area, Grants Pass Irrigation District (GPID), currently serves approximately 8,000 patrons owning a total of 7,700 acres in Jackson and Josephine Counties. Savage Rapids Dam provides GPID with its primary water supply via canals in the greater Grants Pass area. The water provided by GPID is not treated and thus is not used for human consumption. Of the 8,000 patrons, about 300 own more than five acres and the remaining 7,700 own less than 5 acres. The patrons with more than five acres represent a variety of agricultural interests (e.g. wine grapes, sugar beets, fruit orchards), but some industrial interests are also included in this group (e.g. lumber mills, a golf course). Of the 7,700 patrons owning less than five acres, most use GPID water for small hayfields and/or personal vegetable gardens. Many of these patrons own less than 1/4 of an acre and use GPID water on their lawns (US Bureau of Reclamation 1995). Many GPID patrons have an alternative water source because they are served by municipal water from the city of Grants Pass, but this water is more expensive than GPID water. However, most GPID patrons, especially those with more than five acres, are outside the city of Grants Pass and do not have an alternative irrigation water source. Irrigation districts are considered nonpoint sources that influence the quantity and timing of bacteria delivery to downstream river reaches. While irrigation district operations themselves do not create fecal bacteria, the laterals and canals that are used to convey water can play a major role in transporting bacterial contamination across the landscape and into surface waters. Land Use and Land Cover Land use and land cover were examined in the Rogue Mainstem Watersheds. The watersheds are dominated by forested areas (50.5%), followed by agricultural areas (21.0%). Figures 3.11 and 3.12 show the primary land cover with maximum bacteria concentration data.

Rogue River Basin TMDL: Bacteria December 2008
OREGON DEPARTMENT OF ENVIRONMENTAL QUALITY 3-27
Figure 3.11. Primary Land Use with Bacteria Concentration Data
Jones Creek at mouth
Taylor Creek at mouth
Galice Creek at mouth
Sardine Creek at mouth
Rogue River at Hwy 199Reese Creek at Hwy 62 bridge
Whetstone Creek at Kirtland Road
Rogue River at Hwy 62 (Shady Cove)
Rogue River at Hwy 234 (Dodge Park)
Rogue River at Hwy 99 (Grants Pass)Rogue River 2.5 miles w of Grants Pass
Rogue River downstream of Galice Creek
Rogue River at Robertson Bridge (Merlin)
Rogue River at Hwy 234 (north of Gold Hill)
Rogue River upstream of Hog Creek Boat Launch
Rogue River upstream of Pass Creek (at Whitehorse Park)
Rogue River at Blackwell Road, just east of Gold Hill, OR
Rogue River at city of Rogue River (upstream of Evans Creek)
Rogue River at Table Rock Road, Tou Velle Boat Launch
Rogue River at Chinook Park Boat Ramp (upstream of Grants Pass, Oregon)
k Bridge30
4050
6070
80
90
100
130
140
150157.6
110 120
Medford
Grants Pass
Eagle Point
Shady Cove
Butte Falls
E. Coli values at site
maximum E. Coli org.s/100mL0.0 - 126.0
126.1 - 406.0
406.1 - 700.0
700.1 - 1000.0
1000.1 - 3500.0
303(d) listed as bacteria "TMDL needed"
streams and rivers
Land Cover/Land UseOpen Water
Developed, Open Space
Developed, Low Intensity
Developed, Medium Intensity
Developed, High Intensity
Barren Land
Deciduous Forest
Evergreen Forest
Mixed Forest
Shrub/Scrub
Grassland
Pasture
Cultivated Crops
Woody Wetlands
Emergent Herbaceous Wetlands
cities
highways
± 0 8 164 Miles

Rogue River Basin TMDL: Bacteria December 2008
OREGON DEPARTMENT OF ENVIRONMENTAL QUALITY 3-28
Figure 3.12. Primary Land Use with Bacteria Concentration Data Zoomed out
Jones Creek at mouth
Taylor Creek at mouth
Galice Creek at mouth
Sardine Creek at mouth
Rogue River at Hwy 199Reese Creek at Hwy 62 bridge
Whetstone Creek at Kirtland Road
Rogue River at Hwy 62 (Shady Cove)
Rogue River at Hwy 234 (Dodge Park)
Rogue River at Hwy 99 (Grants Pass)Rogue River 2.5 miles w of Grants Pass
Rogue River downstream of Galice Creek
Rogue River at Robertson Bridge (Merlin)
Rogue River at Hwy 234 (north of Gold Hill)
Rogue River upstream of Hog Creek Boat Launch
Rogue River upstream of Pass Creek (at Whitehorse Park)
Rogue River at Blackwell Road, just east of Gold Hill, OR
Rogue River at city of Rogue River (upstream of Evans Creek)
Rogue River at Table Rock Road, Tou Velle Boat Launch
Rogue River at Chinook Park Boat Ramp (upstream of Grants Pass, Oregon)
Rogue River at Lobster Creek Bridge
0
10
30
4050
6070
80
90
100
130
140
150157.6
20
110 120
Medford
Grants Pass
Eagle Point
Shady Cove
Butte F
Gold Beach
± 0 9 184.5 Miles

Rogue River Basin TMDL: Bacteria December 2008
OREGON DEPARTMENT OF ENVIRONMENTAL QUALITY 3-29
Land Use and E. coli Concentrations The four DEQ ambient sites along the Rogue River were examined to determine if there is a relationship between upstream land use and observed E. coli concentrations (Figure 3.13). The land use was determined for the entire watershed area that drains to each ambient site. The four sites are: Dodge Bridge (RM 138.4, n=81), Tou Velle Boat Launch (RM 131.2, n=83), Gold Hill at HWY 234 (RM 117.0, n=91), and Robertson Bridge (RM 86.4, n=82). The percent of forested lands out of total land use decreases in the downstream direction as bacteria concentrations generally increase. Land areas classified as agriculture and E. coli median concentrations both show a general increase in a downstream direction from RM 138.4 to RM 117.0 (Gold Hill at HWY 234) and then decrease slightly between RM 117.0 and RM 86.4 (Robertson Bridge). Areas classified as urban land use remain relatively constant at about 6.9% at RM 138.4 and 7.1% at RM 131.2 and increase to about 15.8% at RM 117.0 and 16.9% at RM 86.4. The largest change in E. coli median concentration occurs between RM 131.2 and 138.4. Within this short reach of 7.2 miles, median bacteria concentrations increase from 8.0 to 25.0 while the forested land use decreases from 72% to 65% and agricultural land use increases from 15% to 22%. Within this reach Little Butte Creek enters the Rogue River at RM 132.2 and is a significant contributor of bacteria to the Rogue River. Little Butte Creek will be discussed at length in Section 3.4. There are no NPDES individual permit discharges of bacteria in this reach between RM 131.2 and 138.4. Figure 3.13. Rogue River E. coli Concentrations and Upstream Land Use
Rogue River a
t Robertso
n Bridge
Rogue River a
t Hwy 2
34 (north
o
Rogue River a
t Table Rock
Road
Rogue River a
t Hwy 2
34 (Dodge P
1
10
100
1,000
bact
erio
logi
cal c
once
ntra
tion
(org
anis
ms/
100m
L)
0
20
40
60
land
use
type
(per
cent
)
126
406
E. ColiOpen WaterUrbanForestedAgriculture

Rogue River Basin TMDL: Bacteria December 2008
OREGON DEPARTMENT OF ENVIRONMENTAL QUALITY 3-30
3.2.7 TMDL - Loading Capacities OAR 340-042-0040(4)(d), CWA §303(d)(1), 40 CFR 130.2(f) Loading Capacity: This element specifies the amount or load of a fecal bacteria expressed as E. coli organisms per day that Rogue River can receive and still meet water quality standards. Loading capacity for the Middle Watersheds Area was determined for the bacteria listed segment of the Rogue River at River Mile 102.1 at a gage station (14361500) operated by the US Geological Survey (USGS). A load duration curve was developed as described in Section 3.1.6. River Mile 102.1 was chosen for the determination of loading capacity because a USGS gage station (14361500) provides accurate flow information and the availability of a robust data set associated with this gage. In addition, this reach is considered water quality limited for bacteria – i.e. 303(d) listed. If the bacteria water quality standard is attained at this critical location, then the water quality standard will likely be attained at all other points on the mainstem Rogue River, as most sources are upstream and dilution occurs downstream. A generalized loading capacity for each of the five flow ranges was calculated based on meeting the E. coli criteria at Rogue River at RM 102.1 (Figure 3.14, Table 3.8). Figure 3.14. E. coli Loading Capacity for Rogue River at River Mile 102.1 (USGS Gage 14361500)
6360
cfs
2790
cfs
1910
cfs
1140
cfs
1.E+10
1.E+11
1.E+12
1.E+13
1.E+14
1.E+15
0 20 40 60 80 100
Flow duration interval (%)
E. c
oli l
oad
in s
tream
(org
s/da
y)
High Transitional Flow Typical Flow Dry Flow Low Flow Flow
Daily loads based on 406 org.s/100mL
Daily loads based on 126 org.s/100mL

Rogue River Basin TMDL: Bacteria December 2008
OREGON DEPARTMENT OF ENVIRONMENTAL QUALITY 3-31
Table 3.8. E. coli Loading Capacity for the Rogue River at River Mile 102.1
River Mile 102.1
High Flow (Above 6360
cfs)
Transitional (6360 to 2790 cfs)
Typical (2790 to 1910 cfs)
Dry Flow (1910 to 1140 cfs)
Low Flow (Below 1140
cfs) E. coli Organisms per Day
Loading Capacity (based on 126 E. coli organisms per 100 ml
criterion)
Greater than
2.0x10¹³
2.0x10¹³ to 8.6x10¹²
8.6x10¹² to 5.9x10¹²
5.9x10¹² to 3.5x10¹²
Less than 3.5x10¹²
Loading Capacity (based on 406 E. coli organisms per 100 ml
criterion)
Greater than
6.3x10¹³
6.3x10¹³ to 2.8 x10¹³
2.8 x10¹³ to 1.9x10¹³
1.9x10¹³ to 1.1x10¹³
Less than 1.1x10¹³
3.2.8 TMDL Allocations OAR 340-042-0040(4)(G) and (H), 40 CFR 130.2(G) and (H) This element divides the bacterial loading capacity between individual point and nonpoint sources and sets the load reduction targets and margins of safety that when reached will result in achieving the TMDL loading capacity. The flow based loading capacity curves were previously shown in Figure 3.14. To determine the percent reductions needed on the Rogue River, E. coli concentration data were analyzed from 12 mainstem sites from RM 75.8 to 131.2 from January 10, 1996 to June 04, 2007 . These data were combined with flows from RM 102.1 (Grants Pass #14361500) to create a load duration curve robust data set (n=365) (Figure 3.15, Figure 3.16, and Table 3.9).

Rogue River Basin TMDL: Bacteria December 2008
OREGON DEPARTMENT OF ENVIRONMENTAL QUALITY 3-32
Table 3.9. Allocations and Percent E. coli Reduction Targets. Rogue River at River Mile 102.1
Allocations
High Flow (Above 6360
cfs)
Transitional (6360 to 2790 cfs)
Typical (2790 to 1910 cfs)
Dry Flow (1910 to 1140 cfs)
Low Flow (Below 1140
cfs)
E. coli Organisms per Day Allowable Loading
Capacity organisms per day
(based on 126 E. coli per 100 ml criterion)
2.0x10¹³ 1.4x10¹³ 7.2x10¹² 4.7x10¹² 3.5x10¹²
Current Loading organisms per day
(log mean of E. coli loads) 1.7x10¹³ 3.5x10¹² 1.4x10¹² 1.5x10¹² 4.1x10¹¹
Percent Reduction to meet 126 E. coli per 100
ml criterion 0% 0% 0% 0% 0%
Allowable Loading
Capacity organisms per day
(based on 406 E. coli per 100 ml criterion)
6.3 x10¹³ 4.5 x10¹³ 2.3 x10¹³ 1.5 x10¹³ 1.1 x10¹³
Current Loading organisms per day (maximum of E. coli
loads)
2.2 x10¹⁴ 5.2 x10¹³ 5.3 x10¹³ 4.5 x10¹³ 2.8 x10¹²
Percent Reduction to meet 406 E. coli per 100
ml 71% 13% 57% 67% 0%

Rogue River Basin TMDL: Bacteria December 2008
OREGON DEPARTMENT OF ENVIRONMENTAL QUALITY 3-33
Figure 3.15. Loading Capacity and Loading Data for the Rogue River RM 102.1
1140
cfs
1910
cfs
2790
cfs
6360
cfs
1.E+10
1.E+11
1.E+12
1.E+13
1.E+14
1.E+15
0 20 40 60 80 100
Flow duration interval (%)
E. c
oli l
oad
in s
tream
(org
.s/d
ay)
High Transitional Flow Typical Flow Dry Flow Low Flow Flow
Note: The thin green line represents the E. coli loading capacity of 126 E. coli /100 mL. The wide red line represents
the E. coli loading capacity of 406 E. coli /100 mL.
Daily loads based on 406 org.s/100mL
Daily loads based on 126 org.s/100mL
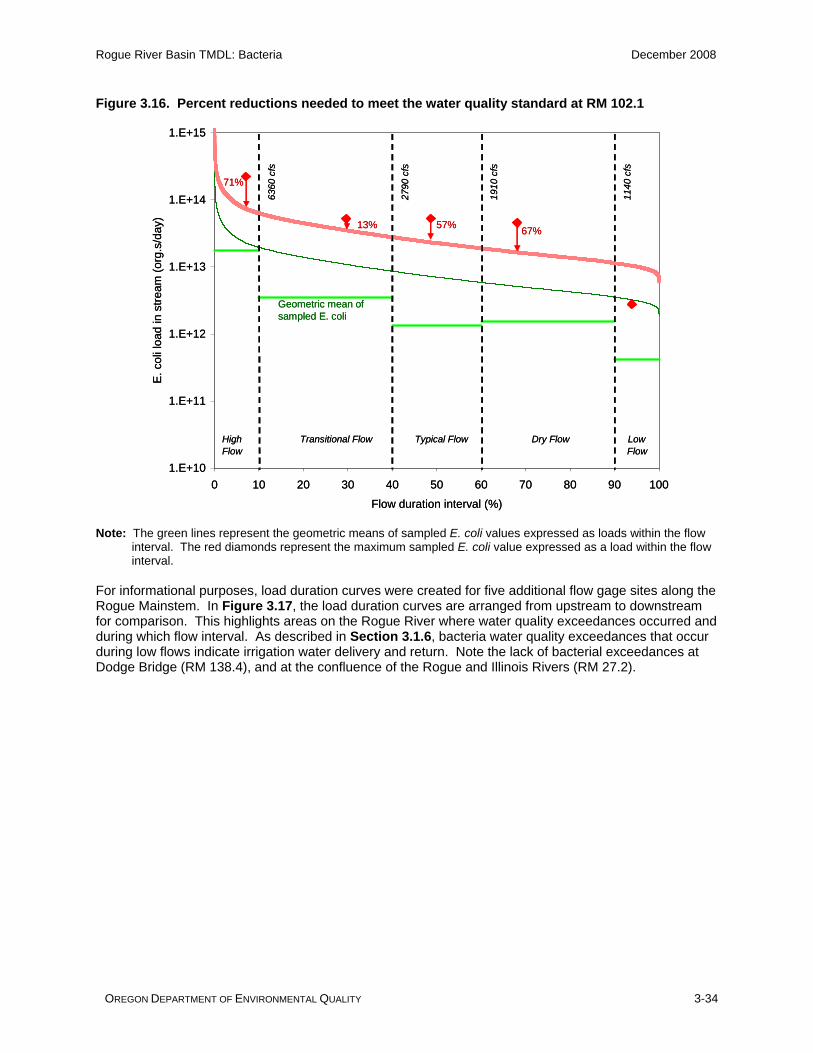
Rogue River Basin TMDL: Bacteria December 2008
OREGON DEPARTMENT OF ENVIRONMENTAL QUALITY 3-34
Figure 3.16. Percent reductions needed to meet the water quality standard at RM 102.1
6360
cfs
2790
cfs
1910
cfs
1140
cfs
1.E+10
1.E+11
1.E+12
1.E+13
1.E+14
1.E+15
0 10 20 30 40 50 60 70 80 90 100
Flow duration interval (%)
E. c
oli l
oad
in s
tream
(org
.s/d
ay)
High Transitional Flow Typical Flow Dry Flow Low Flow Flow
Geometric mean of sampled E. coli
71%
13% 57% 67%
6360
cfs
2790
cfs
1910
cfs
1140
cfs
1.E+10
1.E+11
1.E+12
1.E+13
1.E+14
1.E+15
0 10 20 30 40 50 60 70 80 90 100
Flow duration interval (%)
E. c
oli l
oad
in s
tream
(org
.s/d
ay)
High Transitional Flow Typical Flow Dry Flow Low Flow Flow
Geometric mean of sampled E. coli
71%
13% 57% 67%
Note: The green lines represent the geometric means of sampled E. coli values expressed as loads within the flow
interval. The red diamonds represent the maximum sampled E. coli value expressed as a load within the flow interval.
For informational purposes, load duration curves were created for five additional flow gage sites along the Rogue Mainstem. In Figure 3.17, the load duration curves are arranged from upstream to downstream for comparison. This highlights areas on the Rogue River where water quality exceedances occurred and during which flow interval. As described in Section 3.1.6, bacteria water quality exceedances that occur during low flows indicate irrigation water delivery and return. Note the lack of bacterial exceedances at Dodge Bridge (RM 138.4), and at the confluence of the Rogue and Illinois Rivers (RM 27.2).

Rogue River Basin TMDL: Bacteria December 2008
OREGON DEPARTMENT OF ENVIRONMENTAL QUALITY 3-35
Figure 3.17. Load Duration Curves for the Rogue River
Dodge Bridge River Mile: 138.4 (USGS #14339000) n=89
4380
cfs
2310
cfs
1700
cfs
1090
cfs
1.0E+10
1.0E+11
1.0E+12
1.0E+13
1.0E+14
1.0E+15
0 10 20 30 40 50 60 70 80 90 100Flow duration interval (%)
E. c
oli l
oad
in s
tream
(org
s/da
y)
High Transitional Flow Typical Flow Dry Flow Low Flow Flow
Raygold River Mile: 125.3 (USGS #14359000) n=198 11
40 c
fs
1780
cfs
2580
cfs
5370
cfs
1.0E+10
1.0E+11
1.0E+12
1.0E+13
1.0E+14
1.0E+15
0 10 20 30 40 50 60 70 80 90 100
Flow duration interval (%)
E. C
oli &
feca
l col
iform
dai
ly in
stre
am lo
ad
High Transitional Flow Typical Flow Dry Flow Low Flow Flow
Grants Pass River Mile: 102.0 (USGS #14361500) n=41 63
60 c
fs
2790
cfs
1910
cfs
1140
cfs
1.E+10
1.E+11
1.E+12
1.E+13
1.E+14
1.E+15
0 20 40 60 80 100
Flow duration interval (%)
E. c
oli l
oad
in s
tream
(org
.s/d
ay)
High Transitional Flow Typical Flow Dry Flow Low Flow Flow

Rogue River Basin TMDL: Bacteria December 2008
OREGON DEPARTMENT OF ENVIRONMENTAL QUALITY 3-36
Hellgate River Mile: 94.9 (USGS: Grants Pass 14361500 Applegate 14369500) n=126
7610
cfs
3158
cfs
2202
cfs
1320
cfs
1.0E+10
1.0E+11
1.0E+12
1.0E+13
1.0E+14
1.0E+15
0 10 20 30 40 50 60 70 80 90 100
Flow duration interval (%)
E. C
oli d
aily
in s
tream
load
High Transitional Flow Typical Flow Dry Flow Low Flow Flow
Lobster Creek Bridge Lower Rogue River Mile: 27.2 (USGS: Agness 14372300 Illinois 14378200) n=69
1717
cfs
3581
cfs
6958
cfs
2077
5 cf
s
1.0E+10
1.0E+11
1.0E+12
1.0E+13
1.0E+14
1.0E+15
0 10 20 30 40 50 60 70 80 90 100
Flow duration interval (%)
E. C
oli loa
d in
stre
am (o
rgs/
day)
High Transitional Flow Typical Flow Dry Flow Low Flow Flow
In the Rogue Mainstem Watersheds, seasonal load allocations were calculated, as described in Section 3.1, at several sampling stations along the Rogue River mainstem and at the tributary Reese Creek, where no flow data were available (Tables 3.10 and 3.11). Table 3.10. Percent Reduction Targets by Season, Rogue Mainstem Watersheds RM 86.4-138
Station name Season and Station IDPercent reduction
to meet 126 criterion
Percent reduction to meet 406
criterion Robertson Bridge (RM 86.4) Summer* 10418 0 0 Gold Hill at HWY 234 (RM 117.0) Summer* 10421 0 0
Tou Velle Boat Launch (RM 131.2) Summer* 10031 0 0
Dodge Bridge (RM 138) Summer* 10423 0 0
Robertson Bridge (RM 86.4) Fall/Winter/Spring** 10418 0 66
Gold Hill at HWY 234 (RM 117.0)
Fall/Winter/Spring ** 10421 0 56
Tou Velle Boat Launch (RM 131.2)
Fall/Winter/Spring ** 10031 0 0
Dodge Bridge (RM 138) Fall/Winter/Spring ** 10423 0 0
*Summer season = June 1 – Sept 30 ** Fall/Winter/Spring season = Oct 1 – May 31

Rogue River Basin TMDL: Bacteria December 2008
OREGON DEPARTMENT OF ENVIRONMENTAL QUALITY 3-37
Table 3.11. Percent reduction targets – Reese Creek at Mouth
Station name Season and Station ID Percent reduction to meet 126 criterion
Percent reduction to meet 406
criterion Reese Creek at HWY 62 bridge (RM 0.5) Summer* 23765 88 88
*Summer season = June 1 – Sept 30
3.2.9 Wasteload Allocations: Point Sources OAR 340-042-0040(4)(g), 40 CFR 130.2(g) This element sets the waste load allocations for all point source discharges regulated under the NPDES permit program. The following is a discussion of all permitted point sources in the Rogue Mainstem Watersheds with the potential to discharge bacteria to waters of the state and their associated waste load allocations (WLA). Individual NPDES Discharge Permits Agency with oversight: DEQ Wasteload allocations are in terms of concentration limits for discharges. In general the allocations require effluent limits equal to the water quality criteria at the end of the discharge pipe (Table 3.12). Table 3.12. Wasteload Allocations for Wastewater Treatment Plants (WWTP) in the Rogue River Basin
Wasteload Allocations
Name of Facility Rogue River Mile
Summer: Dry Weather Flow
in MGD2
30-day Log Mean Limit
E. coli/100ml Instantaneous Limit
E. coli/100ml
Butte Falls4 155.51 0.07 126 406 Shady Cove 143.1 0.45 126 406 City of Medford 130.5 20 126 406 Gold Hill 118.5 0.35 126 406 Rogue River 110.0 0.43 126 406 Grants Pass 100.9 4 126 406 Cave Junction4 27.53 0.52 126 406 Notes: 1The City of Butte Falls discharges into South Fork Big Butte Creek at River Mile 1.0. Big Butte Creek enters the Rogue at River Mile 155.5 2Summer season is defined as June 1-September 30. Dry weather flow is the average dry weather design capacity 3The City of Cave Junction discharges into the Illinois River at River Mile 54.6. Illinois River enters the Rogue at River Mile 27.5. 4These facilities do not discharge during the summer months The 5 additional individual NPDES discharge permitted sites that are not likely to discharge effluent during the summer are listed below:
• Riviera Mobile Home Park - Discharges to Rogue River at river mile 95.0 from November 1 – April 30. Privately owned sewage treatment plant with an average design flow of 0.03 MGD. No summer discharge allowed. Required to meet a log mean of 126 E. coli / 100 ml in 30 days, 406 E. coli / 100 ml daily maximum standards.
• Country View Mobile Home Park - Discharges to Cusik Creek, a tributary of Rogue River at
river mile 147.7 from November 1- April 30. Private Sewage Treatment Plant with an average

Rogue River Basin TMDL: Bacteria December 2008
OREGON DEPARTMENT OF ENVIRONMENTAL QUALITY 3-38
design flow of 0.009 MGD. No summer discharge allowed. Required to meet a log mean of 126 E. coli / 100 ml in 30 days, 406 E. coli / 100 ml daily maximum standards.
• Flemming Middle School – Discharges to Harris Creek at river mile 2.8 from November 1- April
30. Small sewage treatment plant with an average design flow of 0.02 MGD. No summer discharge allowed. Required to meet a log mean of 126 E. coli / 100 ml in 30 days, 406 E. coli / 100 ml daily maximum standards.
• All Weather Wood – Stormwater discharges to Rogue River at river mile 130.5. Bacteria not
required to be monitored but unlikely present in stormwater.
• Cascade Wood Products – Stormwater discharges into Military Slough at river mile 1.6. Military Slough discharges into Rogue River at river mile 133. Bacteria not required to be monitored but unlikely present in stormwater.
Onsite Systems Management Agency: DEQ In the Rogue River Basin within Jackson and Curry Counties the on-site program is managed by the respective County, and within Josephine County the program is managed by DEQ. Failing and/or poorly situated on-site sewage systems can produce significant loads of E. coli. There are regulatory programs in place at DEQ to insure on-site systems do not cause or contribute to water quality violationsOn-site systems are designed to produce a zero loads. The waste load allocation for all on-site systems is 0.0 E. coli organisms per 100 ml. Confined Animal Feeding Operations Management Agency: Oregon Department of Agriculture CAFOs are managed in the State of Oregon to ensure no discharge of fecal bacteria under normal conditions. Discharge is allowed under conditions of an extreme rainfall event, defined in the permit as greater than the 25-year, 24-hour rainfall. Because the TMDL does not address extreme rainfall event (i.e. the 25-year, 24-hour rainfall), the CAFOs in the Rogue River Basin are each allocated zero load.
3.2.10 Load Allocations: Nonpoint Sources OAR 340-042-0040(4)(h), 40 CFR 130.2(h) This element determines the portion of the receiving water’s loading capacity that is allocated to existing nonpoint sources of pollution. The criteria that apply to these areas are a log mean of 126 E. coli / 100 ml in 30 days and 406 E. coli / 100 ml as a daily maximum. The surrogate measure is the percent reduction target. Because management agencies are generally designated by land use, the following is a discussion of bacteria sources by land use also naming the management agency with land use authority. See the Water Quality Management Plan (Chapter 4) for more information and details.
Forest Managed Lands Management Agency: ODF, BLM, USFS The Oregon Department of Forestry (ODF) is the Designated Management Agency (DMA), by statute, for water quality protection from nonpoint source discharges or pollutants resulting from forest operations on non-federal forestlands in the Rogue River Basin, as well as statewide. Water protection rules are applied per OAR 629-635-0000 through 629-660-0060. Forest operators conducting operations in accordance with the Forest Practices Act (FPA) are considered to be in compliance with water quality standards. In July 2003, the Bureau of Land Management (BLM) signed a memorandum of agreement (MOA) with DEQ establishing a process by which the BLM and DEQ will help ensure compliance with State and

Rogue River Basin TMDL: Bacteria December 2008
OREGON DEPARTMENT OF ENVIRONMENTAL QUALITY 3-39
Federal point and non-point source rules and regulations requirements on BLM lands. This agreement recognizes the BLM as the DMA on BLM-administered lands in Oregon. The agreement, which expired in 2007, was extended by mutual consent of the agencies until December 31, 2008. Pursuant to the MOA, as resources allow, BLM will coordinate with DEQ to develop Water Quality Restoration Plans (WQRPs) for BLM-administered lands and will revise or adapt WQRPs to be consistent with and applicable to the final TMDL and associated Water Quality Management Plan (WQMP) (the TMDL subbasin implementation strategy). The WQRP will be the TMDL implementation plan for BLM-administered lands. BLM will conduct management activities on BLM administered lands consistent with WQRPs and provide updates and reports on restoration progress according to DEQ's implementation schedule. Where necessary and appropriate, WQRPs propose a set of actions and timeline for achieving nonpoint source load allocations and meeting water quality standards. In the case of E. coli, research in other Oregon watersheds indicates that the management of federal forest lands does not typically contribute to elevated levels of E. coli that are the basis for the listings. Agricultural Lands Management Agency: Oregon Department of Agriculture The Rogue River Basin is managed under two Agricultural Water Quality Management Plans. Areas within Josephine and Jackson Counties are managed under the Inland Rogue Agricultural Water Quality Management Area Plan. Those areas downstream of the Josephine County border will operate under the conditions of the Curry County Agricultural Water Quality Management6. The Inland Rogue Agricultural Water Quality Management Area Plan was revised in 2008 to include management actions to address sources of fecal bacteria. The purpose of this Area Plan is to identify strategies to reduce water pollution from agricultural lands through a combination of educational programs, suggested land treatments, management activities, and monitoring. ODA has enforcement authority for the prevention and control of water pollution from agricultural activities under administrative rules for Rogue River Basin and Oregon Administrative Rules (OAR) 603-090-0120 through 603-090-0180. Irrigation Districts Management Agency: Eagle Point Irrigation District, Rogue River Valley Irrigation District, Medford Irrigation District, Gold Hill Irrigation District, Grants Pass Irrigation District, other Irrigation Districts, and Ditch Ditch Associations where appropriate in the Rogue River Basin. The irrigation districts will be required to develop implementation plans that include a description of operations and maintenance practices to limit bacterial inputs into the canals. Districts may contact users directly or in conjunction with Soil and Water Conservation Districts (SWCDs) to inform irrigation users on manure management and practices to keep fecal organisms out of the irrigation system and out of surface waters. Rural Residential and Urban Lands Management Agency: Curry, Jackson, and Josephine Counties and the Cities of Shady Cove, Butte Falls, Eagle Point, Gold Hill, Rogue River, Cave Junction, Grants Pass, and Gold Beach The identified Cities and Counties will be required to submit a TMDL implementation plan within 18 months of the issuance of the TMDL as per OAR 340-042-0083(3) with detailed plans of how the jurisdictions will meet the TMDL. State Lands Management Agency: Oregon Department of State Lands (DSL) and Oregon Parks and Recreation Department (PRD). DSL holds public owned lands in trust and manages these lands in the public's best interests. DSL administers the state’s removal-fill permits and is responsible for leasing range and agricultural land and waterways for a variety of business activities. PRD is responsible for land stewardship, overseeing 6 Agricultural Water Quality Management Area Plan are located here: http://oregon.gov/ODA/NRD/water_agplans.shtml

Rogue River Basin TMDL: Bacteria December 2008
OREGON DEPARTMENT OF ENVIRONMENTAL QUALITY 3-40
Oregon scenic waterways and several permit programs. As with other state agencies that have been identified as DMAs, DSL and PRD is required to submit an implementation plan but may work with DEQ to develop a statewide implementation plan. Plans must be submitted to DEQ within 18 months of the issuance of the TMDLs.
3.2.11 Future Sources OAR 340-042-0040(4)(k) Future permitted sources may discharge effluent containing fecal bacteria at concentrations in compliance with water quality criteria (log mean of 126 E. coli / 100 ml in 30 days and 406 E. coli / 100 ml daily maximum).

Rogue River Basin TMDL: Bacteria December 2008
OREGON DEPARTMENT OF ENVIRONMENTAL QUALITY 3-41
3.3 MIDDLE ROGUE RIVER SUBBASIN
3.3.1 Watershed Description The Middle Rogue River Subbasin (HUC 17100308) was examined in this analysis and consists of the following 5th field watersheds; Evans Creek, Grants Pass-Rogue River, Gold Hill-Rogue River, and Bear Creek (Figure 3.18). Within this area, Grants Pass-Rogue River and Gold Hill-Rogue River are addressed in Section 1 under Rogue Mainstem Watersheds, and Bear Creek has a TMDL in place to address bacteria (DEQ 2007). Evans Creek is the 5th field watershed in the Middle Rogue River Subbasin with 303(d) exceedances for bacteria that is the focus of this section. Figure 3.18. Middle Rogue River Subbasin
Evans Creek
Gold Hill‐Rogue RiverGrants Pass‐Rogue River
Bear Creek
Medford
Grants Pass
Ashland
Central Point
Eagle Point
Talent
Phoenix
Shady Cove
Jacksonville
Gold HillRogue River
Butte Falls
303(d) listed as bacteria "TMDL needed"
rivers & creeks
highways
±0 9 184.5 Miles

Rogue River Basin TMDL: Bacteria December 2008
OREGON DEPARTMENT OF ENVIRONMENTAL QUALITY 3-42
3.3.2 Waterbodies Listed for Bacteria 303(d) listed streams are shown on Figure 3.19. Note: Figures 3.18 & 3.19 and Table 3.3 do not include bacteria listed waters in the Bear Creek Watershed.
3.3.3 Current Conditions: Evans Creek Bacteria Analysis Sampling Sites E. coli data for 9 sites within the Evans Creek Watershed were examined from the period of 1998-2004 (number of data points: n=97). There were 6 sites on the Evans Creek mainstem, and one site each were sampled on the East and West Forks of Evans Creek (Figure 3.19 andTable 3.1). There was 1 site sampled for E. coli at the mouth of Sykes Creek, and two other tributaries were sampled for fecal coliforms (Pleasant and Fielder Creeks). Figure 3.19 shows the bacteria sample sites as well as maximum concentration of bacteria at each site for the data set. There were two stations at the mouth of Evans Creek that exceeded the maximum E. coli concentration standard (highlighted in pink). Further upstream, one tributary station exceeded the log mean E. coli concentration standard. The upstream portion of the watershed is heavily forested, although urban (road) and agricultural impacts may accumulate downstream of Wimer.

Rogue River Basin TMDL: Bacteria December 2008
OREGON DEPARTMENT OF ENVIRONMENTAL QUALITY 3-43
Figure 3.19. Sampling Sites and Maximum E. coli Concentrations
Fielder Creek at mouth
Evans Creek at Bridge #341
Evans Creek at foot bridge
Evans Creek downstream of WimerPleasant Creek at mouth (Wimer)
Evans Creek at mouth (Rogue River)
Sykes Creek at East Evans Creek Road
Evans Creek at Sand Bar (Rogue River)
W Fork Evans Creek downstream of Battle Creek
Evans Creek approximately 1000 feet above mouthEvans Creek at Palmerton Park (upstream of Pond-Rogue River)
East Fork Evans Creek downstream of Spikenard (2.3 miles downstream of Mystery Creek)
Evans Creek upstream of Wimer (at private bridge)
30
20
10
38.1
Grants Pass
Central Point
Eagle Point
Shady Cove
Gold HillRogue River
maximum E. coli valuehistoric fecal coliform site
0.1 - 75.0
75.1 - 126.0
126.1 - 406.0
406.1 - 2419.0
303(d) listed as bacteria "TMDL needed"
rivers and creeks
cities
highways
± 0 6 123 Miles

Rogue River Basin TMDL: Bacteria December 2008
OREGON DEPARTMENT OF ENVIRONMENTAL QUALITY 3-44
Table 3.13. E. coli data for the Evans Creek Watershed – all seasons combined
Station ID River Mile Station Description Log mean E. coli
Maximum E. coli
Number of samples
11372 0 Evans Creek at mouth (Rogue River) 127.9 1553.0 16
11461 0.5 Evans Creek at Palmerton Park (upstream of Pond-Rogue River) 85.8 2419.0 16
31977 0.6 Evans Creek approximately 1000 feet above mouth 75.0 75.0 1
31714 0.65 Evans Creek at Palmerton Park (upstream of pond-rushing ditch) 64.0 64.0 1
11373 8.2 Evans Creek downstream of Wimer 46.5 275.0 16
17034 10.5 Sykes Creek at East Evans Creek Road 220.0 220.0 1
11466 18 Evans Creek at Bridge #341 13.4 93.0 15
30190 19.1 W Fork Evans Creek downstream of Battle Creek 4.1 109.0 15
30191 22 East Fork Evans Creek downstream of Spikenard (2.3 miles downstream of Mystery Creek)
17.9 96.0 15
Notes: Tan indicates tributary inflows to Evans Creek mainstem. Green shading indicates exceedance of the E. coli criteria.
3.3.4 Seasonal Variation An intensive E. coli survey was conducted in 2004. Five stations were sampled at least 4 times during each season that year (Table 3.14). This 2004 data is used for the assessment of seasonal variability presented here. The 303(d) list defines the seasons as summer from June 1 – September 30 and fall/winter/spring from October 1 – May 31. For this analysis, seasons were defined every three months. Spring was March 1 – May 31, summer was June 1 – August 31, fall was September 1 – November 30, and winter was December 1 – February 28. The sample results were plotted by river mile for each season (Figures 3.20-3.22). Table 3.14. Seasonal E. coli Samples on Evans Creek
Station ID
River Mile Station Name
Number of
sampleswinter spring summer fall
11372 0 Evans Creek at mouth (Rogue River) 16 1 5 5 5
11461 0.5 Evans Creek at Palmerton Park (upstream of Pond-Rogue River) 16 1 5 6 4
11373 8.2 Evans Creek downstream of Wimer 16 1 5 6 4
11466 18 Evans Creek at Bridge #341 15 1 5 5 4
30191 22 East Fork Evans Creek downstream of Spikenard (2.3 miles downstream of Mystery Creek)
15 1 5 5 4
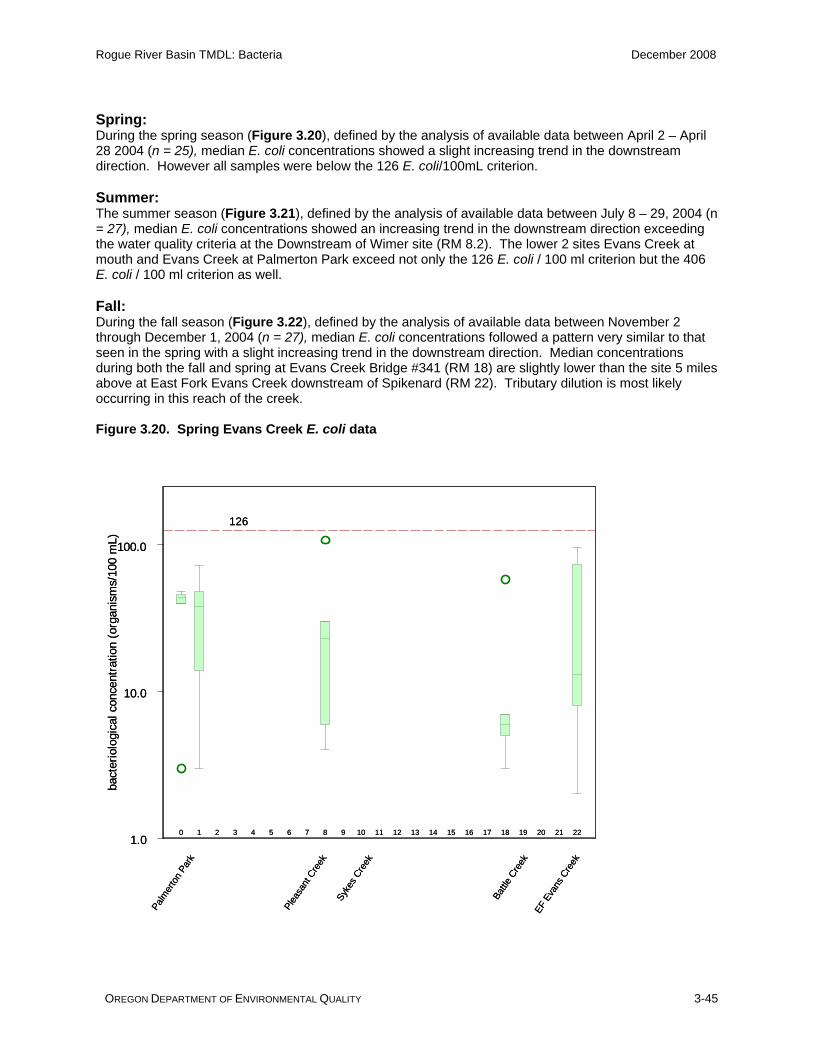
Rogue River Basin TMDL: Bacteria December 2008
OREGON DEPARTMENT OF ENVIRONMENTAL QUALITY 3-45
Spring: During the spring season (Figure 3.20), defined by the analysis of available data between April 2 – April 28 2004 (n = 25), median E. coli concentrations showed a slight increasing trend in the downstream direction. However all samples were below the 126 E. coli/100mL criterion. Summer: The summer season (Figure 3.21), defined by the analysis of available data between July 8 – 29, 2004 (n = 27), median E. coli concentrations showed an increasing trend in the downstream direction exceeding the water quality criteria at the Downstream of Wimer site (RM 8.2). The lower 2 sites Evans Creek at mouth and Evans Creek at Palmerton Park exceed not only the 126 E. coli / 100 ml criterion but the 406 E. coli / 100 ml criterion as well. Fall: During the fall season (Figure 3.22), defined by the analysis of available data between November 2 through December 1, 2004 (n = 27), median E. coli concentrations followed a pattern very similar to that seen in the spring with a slight increasing trend in the downstream direction. Median concentrations during both the fall and spring at Evans Creek Bridge #341 (RM 18) are slightly lower than the site 5 miles above at East Fork Evans Creek downstream of Spikenard (RM 22). Tributary dilution is most likely occurring in this reach of the creek. Figure 3.20. Spring Evans Creek E. coli data
Plea
sant
Cre
ek
EF E
vans
Cre
ek
Battle
Cre
ek
Syke
s Cre
ek
Palm
erto
n Pa
rk
0 1 2 3 4 5 6 7 8 9 10 11 12 13 14 15 16 17 18 19 20 21 221.0
10.0
100.0
bact
erio
logi
cal c
once
ntra
tion
(org
anis
ms/
100
mL)
E. Coli concentrations by river mile at mainstem Evans Creek sitesSpring (4/2, 4/8, 4/14, 4/22, 4/28) 2004
126

Rogue River Basin TMDL: Bacteria December 2008
OREGON DEPARTMENT OF ENVIRONMENTAL QUALITY 3-46
Figure 3.21. Summer Evans Creek E. coli data
Plea
sant
Cre
ek
EF E
vans
Cre
ek
Battle
Cre
ek
Syke
s Cre
ek
Palm
erto
n Pa
rk
0 1 2 3 4 5 6 7 8 9 10 11 12 13 14 15 16 17 18 19 20 21 22
1.0
10.0
100.0
1,000.0
bact
erio
logi
cal c
once
ntra
tion
(org
anis
ms/
100
mL)
E. Coli concentrations by river mile at mainstem Evans Creek sitesSummer (7/8, 7/12, 7/15, 7/22, 7/29) 2004
126
406

Rogue River Basin TMDL: Bacteria December 2008
OREGON DEPARTMENT OF ENVIRONMENTAL QUALITY 3-47
Figure 3.22. Fall Evans Creek E. coli data
Plea
sant
Cre
ek
EF E
vans
Cre
ek
Battle
Cre
ek
Syke
s Cre
ek
Palm
erto
n Pa
rk
0 1 2 3 4 5 6 7 8 9 10 11 12 13 14 15 16 17 18 19 20 21 22
10.0
100.0
1,000.0
bact
erio
logi
cal c
once
ntra
tion
(org
anis
ms/
100
mL)
E. Coli concentrations by river mile at mainstem Evans Creek sitesFall (11/2, 11/9, 11/16, 11/23, 12/1) 2004
126
406

Rogue River Basin TMDL: Bacteria December 2008
OREGON DEPARTMENT OF ENVIRONMENTAL QUALITY 3-48
Figure 3.23 examines the seasonal behavior of data associated with the sites at the Mouth of Evans Creek and at Palmerton Park (RM 0 – 0.5). Seasonal median concentrations are below the 126 E. coli/100mL criterion in both April and November but greatly exceed both the 126 and 406 E. coli/100mL criteria during the July period in 2004. An analysis of precipitation records taken from Grants Pass indicate that the high summer bacterial concentrations are not linked to rainfall, as was also observed in the data from the Rogue Mainstem Watershed section. Rather, the high bacteria concentrations observed in Evans Creek during the summer indicate that some other source besides rainfall is the driver. There are no individual NPDES permitted sites in the Evans Creek watershed. Other potential sources include septic systems and bacteria loads transported into the watershed or off the landscape via irrigation water use and conveyance. Figure 3.23. Evans Creek Seasonal Bacterial Concentrations and Average Rainfall at Grants Pass
Jan Feb Mar Apr May Jun Jul Aug Sep Oct Nov Dec
10
100
1,000
bact
erio
logi
cal c
once
ntra
tion
(org
anis
ms/
100m
L)
E. Coliprecipitation
0
5
10
15
20
aver
age
mon
thly
pre
cipi
tatio
n (h
undr
edth
s of
inch
es)
126
406
Seasonal bacteria concentrations were further compared to generalized annual flow (Figure 3.24). In the summer, flow in Evans Creek is minimal and intermittent, due to water removal for irrigation. Irrigation water is generally pumped directly from Evans Creek and tributaries and may be reserved for downstream irrigation as per water rights seniority. Grants Pass Irrigation District delivers water into the Evans Creek watershed and upwards into the lower Evans Creek valley. Return irrigation flow from cattle and mixed use ranches may be carrying coliforms into small instream pools, while failed onsite septic systems may also contribute coliform bacteria to Evans Creek through illegal discharge or into a high summer time groundwater table created through irrigation use resulting in summer discharges from failing systems.

Rogue River Basin TMDL: Bacteria December 2008
OREGON DEPARTMENT OF ENVIRONMENTAL QUALITY 3-49
Figure 3.24. Evans Creek Seasonal Bacterial Concentrations and Estimated Evans Creek Flow 2004
Jan Feb Mar Apr May Jun Jul Aug Sep Oct Nov Dec
10
100
1,000
bact
erio
logi
cal c
once
ntra
tion
(org
anis
ms/
100m
L)E. Colivolumetric flow
0
100
200
300
400
500
aver
age
mon
thly
vol
umet
ric fl
ow (c
fs)
406
126
3.3.5 Critical Period - Seasonal Variation Middle Rogue River Subbasin – Evans Creek: Section 303(d)(1) requires a TMDL to be “established at a level necessary to implement the applicable water quality criteria with seasonal variations.” The critical period for Evans Creek is that period of time when bacterial concentrations exceed the State of Oregon criteria for water contact recreation. Based on the 2004/2006 303(d) list (Table 3.13) and TMDL analysis, Evans Creek from river mile 0 – 19.1 exceeded the applicable bacteria criteria during both defined seasons (summer and fall/winter/spring). The load duration curve method employed in this TMDL determines loads and percent reduction targets that apply year-round for all waters upstream of the point of analysis. Specific load and wasteload allocations apply to sources across the Evans Creek watershed.
3.3.6 Existing Pollution Sources OAR 340-042-004(4)(f), CWA §303(d)(1)
Point Sources NPDES Individual Permits The City of Rogue River located on Evans Creek owns and operates a wastewater treatment facility that discharges treated effluent into the Rogue River at river mile 110.0. Since the plant does not discharge into Evans Creek, it is not discussed here, but rather in the Rogue Mainstem Watersheds Section 3.2.

Rogue River Basin TMDL: Bacteria December 2008
OREGON DEPARTMENT OF ENVIRONMENTAL QUALITY 3-50
Stormwater NPDES Permits The City of Rogue River and Jackson County within the Middle Rogue River Subbasin are not considered NPDES Phase II communities requiring a permit. As such city/county stormwater is considered a nonpoint source discussed below. Confined Animal Feeding Operation (CAFO) There are no permitted CAFOs located within the Evans Creek watershed.
Nonpoint Sources Land use and land cover were examined in the Evans Creek Watershed area (Figure 3.25). The Evans Creek watershed is dominated by forested areas (69.2%), which are dominated by shrub/scrub. Agricultural (13.7%) and urban (developed) areas (12.4%) are also significant land uses in the Evans Creek watershed.

Rogue River Basin TMDL: Bacteria December 2008
OREGON DEPARTMENT OF ENVIRONMENTAL QUALITY 3-51
Figure 3.25. Evans Creek Primary Land Cover with Median Bacteria Concentration Data
Fielder Creek at mouth
Evans Creek at Bridge #341
Evans Creek at foot bridge
Evans Creek downstream of WimerPleasant Creek at mouth (Wimer)
Evans Creek at mouth (Rogue River)
Sykes Creek at East Evans Creek Road
Evans Creek at Sand Bar (Rogue River)
W Fork Evans Creek downstream of Battle Creek
Evans Creek approximately 1000 feet above mouthEvans Creek at Palmerton Park (upstream of Pond-Rogue River)
East Fork Evans Creek downstream of Spikenard
Evans Creek upstream of Wimer (at private bridge)
30
20
10
38.1
Grants Pass
Central Point
Eagle Point
Shady Cove
Gold HillRogue River
maximum E. coli valuehistoric fecal coliform site
0.0 - 75.0
75.1 - 126.0
126.1 - 406.0
406.1 - 2419.0
303(d) listed as bacteria "TMDL needed"
rivers and creeks
Land UseOpen Water
Developed
Developed
Developed
Bare Ground
Forested
Forested
Forested
Forested
Agricultural
Agricultural
Agricultural
Wetlands
Wetlands
cities
highways ± 0 8 164 Miles

Rogue River Basin TMDL: Bacteria December 2008
OREGON DEPARTMENT OF ENVIRONMENTAL QUALITY 3-52
Land Use and E. Coli Concentrations The 6th field subwatershed was determined for each of LASAR stations in the Evans Creek watershed. The 1998-2004, (n=175) E. coli concentration data were assigned to each of the six 6th field watersheds by station and plotted against the land use classifications (Figure 3.26). In general, the median bacteria concentrations increased from the headwaters to the mouth of Evans Creek. The percentages of urban and agricultural areas also generally increase from headwaters to mouth. Figure 3.26. Evans Creek E. coli concentrations and upstream land use
1
10
100
1,000
bact
erio
logi
cal c
once
ntra
tion
(org
anis
ms/
100m
L)
0
20
40
60
80
100
land
use
type
(per
cent
)
126
406
E. ColiOpenUrbanForestAgWetlands
LOW
ER E
VAN
S C
REE
K
MID
DLE
EVA
NS
CR
EEK
PLEA
SAN
T C
REE
K
UPP
ER E
VAN
S C
REE
K
LOW
ER W
EST
FOR
K EV
ANS
CR
EEK
UPP
ER W
EST
FOR
K EV
ANS
CR
EEK
3.3.7 TMDL - Loading Capacities OAR 340-042-0040(4)(d), CWA §303(d)(1), 40 CFR 130.2(f) Loading Capacity: This element specifies the amount of a fecal bacteria expressed as E. coli organisms per day at that Evans Creek can receive and still meet water quality standards. The load duration curve for Evans Creek was determined using flow data that was reconstructed from a historic USGS gage (14359500) and a similar currently gaged watershed (Elk Creek near Trail 14338000). The only continuous gage operated in the Evans Creek watershed was the historic Evans Creek flow gage. The site was a mile downstream (river mile 18.1) of the East and West Forks confluence (Figure 3.27). This approach may under-represent the true flow at the mouth and does not account for water diverstions but does provide the best estimate of flow along Evans Creek. DEQ also measured instantaneous flow four times at sites in the watershed in 2004. The instantaneous measurements were added to the continuous data set. A generalized loading capacity for each of the five flow ranges was calculated based on meeting the E. coli criteria (Table 3.15).

Rogue River Basin TMDL: Bacteria December 2008
OREGON DEPARTMENT OF ENVIRONMENTAL QUALITY 3-53
Figure 3.27. E. coli Loading Capacity for Evans Creek at RM 16.0
8.4
cfs
28 c
fs
450
cfs
93 c
fs
1.0E+07
1.0E+08
1.0E+09
1.0E+10
1.0E+11
1.0E+12
1.0E+13
1.0E+14
1.0E+15
0 10 20 30 40 50 60 70 80 90 100
Flow duration interval (%)
E. c
oli d
aily
in s
tream
load
High Transitional Flow Typical Flow Dry Flow Low Flow Flow
Daily loads based on 406 org.s/100mL
Daily loads based on 126 org.s/100mL

Rogue River Basin TMDL: Bacteria December 2008
OREGON DEPARTMENT OF ENVIRONMENTAL QUALITY 3-54
Table 3.15. E. coli Loading Capacity Evans Creek at River Mile 16.0
Evans Creek at Mouth
High Flow (Above 450 cfs)
Transitional (93 to 450cfs)
Typical (93 to 28 cfs)
Dry Flow (28 to 8.4
cfs)
Low Flow (Below 8.4
cfs) E. coli Organisms per Day
Loading Capacity (based on 126 E. coli organisms per 100 ml criterion)
Greater than
1.4x10¹²
2.9x10¹¹ to 1.4x10¹²
8.6x10¹⁰ to 2.9x10¹¹
2.6x10¹⁰ to 8.6x10¹⁰
Less than 2.6x10¹⁰
Loading Capacity (based on 406 E. coli organisms per 100 ml criterion)
Greater than
4.5x10¹²
9.2x10¹¹ to 4.5 x10¹²
2.8x10¹¹ to 9.2x10¹¹
8.3x10¹⁰ to 2.8x10¹¹
Less than 8.3x10¹⁰
3.3.8 TMDL Allocations 40 CFR 130.2(G) and (H) This element divides the bacterial loading capacity between individual point and nonpoint sources and sets the load reduction targets and margins of safety that when reached will result in achieving the TMDL loading capacity. The flow based load allocations were determined using the load duration curve previously discussed and developed for the determination of loading capacity for Evans Creek (Figure 3.27). The E. coli data included in Figure 3.28 were all previously collected mainstem Evans Creek E. coli data (1998-2004) (Table 3.13). Loads associated with the bacteria samples were determined by using the flows reconstructed from the historic gage as previously described. Percent reduction targets needed to meet the loading capacity were determined for flow interval by comparing the log mean or the maximum value E. coli concentration to the average loading capacity within each of the 5 flow intervals (Figure 3.29, Table 3.16). Table 3.16. Evans Creek Load Allocations and Percent E. coli Reduction Targets
Allocations High Flow (Above 450 cfs)
Transitional(93 to
450cfs)
Typical (93 to 28
cfs)
Dry Flow (28 to 8.4
cfs)
Low Flow (Below 8.4
cfs) E. coli Organisms per Day
Allowable Loading Capacity organisms per
day (based on 126 E. coli per
100 ml criterion)
1.4x10¹² 8.4x10¹¹ 1.9x10¹¹ 5.6x10¹⁰ 2.6x10¹⁰
Current Loading organisms per day
(log mean of E. coli loads) 6.1x10¹¹ 8.9x10⁹ 3.1x10¹⁰ 3.2x10¹⁰ 2.4x10¹⁰
Percent Reduction to meet 126 E. coli per 100
ml criterion 0 0 0 0 0

Rogue River Basin TMDL: Bacteria December 2008
OREGON DEPARTMENT OF ENVIRONMENTAL QUALITY 3-55
Table 3.16 (continued).
Allocations High Flow (Above 450 cfs)
Transitional(93 to
450cfs)
Typical (93 to 28
cfs)
Dry Flow (28 to 8.4
cfs)
Low Flow (Below 8.4
cfs) E. coli Organisms per Day
Allowable Loading Capacity organisms per
day (based on 406 E. coli per
100 ml criterion)
4.5x10¹² 2.7x10¹² 6.0x10¹¹ 1.8x10¹¹ 8.3x10¹⁰
Current Loading organisms per day (maximum of E. coli
loads)
1.1x10¹² 1.8x10¹⁰ 1.3x10¹² 1.1x10¹² 3.2x10¹¹
Percent Reduction to meet 406 E. coli per 100
ml 0% 0% 54% 84% 74%
Figure 3.28. Loading Capacity and Loading Data for Evans Creek at RM 16.0
8.4
cfs
28 c
fs
450
cfs
93 c
fs
1.0E+07
1.0E+08
1.0E+09
1.0E+10
1.0E+11
1.0E+12
1.0E+13
1.0E+14
1.0E+15
0 10 20 30 40 50 60 70 80 90 100
Flow duration interval (%)
E. c
oli d
aily
in s
tream
load
High Transitional Flow Typical Flow Dry Flow Low Flow Flow
Note: The thick red line represents the E. coli loading capacity of 406 E. coli /100 mL. The thin green line represents
the E. coli loading capacity of 126 E. coli /100 mL.
Daily loads based on 406 org.s/100mL
Daily loads based on 126 org.s/100mL

Rogue River Basin TMDL: Bacteria December 2008
OREGON DEPARTMENT OF ENVIRONMENTAL QUALITY 3-56
Figure 3.29. Percent Reductions needed to meet water quality standards in Evans Creek at mouth
8.4
cfs
28 c
fs
450
cfs
93 c
fs
1.0E+07
1.0E+08
1.0E+09
1.0E+10
1.0E+11
1.0E+12
1.0E+13
1.0E+14
1.0E+15
0 10 20 30 40 50 60 70 80 90 100
Flow duration interval (%)
E. c
oli d
aily
in s
tream
load
High Transitional Flow Typical Flow Dry Flow Low Flow Flow
74%84%
54%
8.4
cfs
28 c
fs
450
cfs
93 c
fs
1.0E+07
1.0E+08
1.0E+09
1.0E+10
1.0E+11
1.0E+12
1.0E+13
1.0E+14
1.0E+15
0 10 20 30 40 50 60 70 80 90 100
Flow duration interval (%)
E. c
oli d
aily
in s
tream
load
High Transitional Flow Typical Flow Dry Flow Low Flow Flow
74%84%
54%
Note: The green lines represent the geometric means of sampled E. coli values expressed as loads within the flow
interval. The red diamonds represent the maximum sampled E. coli value expressed as a load within the flow interval.
In the Evans Creek Watershed, seasonal load allocations were calculated, as described in Section 3.1, at several sampling stations along Evans Creek, independent of flow data (Table 3.17 and Table 3.18). Table 3.17. Evans Creek percent reduction targets to reach 126 E. coli /100ml
Applicable Criterion: 126 E. coli /100mL
Station name Station Summer Loading*
Total % reduction
F/W/S Loading**
Total % reduction
Evans Creek at mouth (RM 0.0) 11372 608.9 79 (n=5) 61.9 0
Evans Creek at Palmerton Park (upstream of Pond-Rogue River) (RM 0.5) 11461 538.3 77 (n=6) 28.5 0
Evans Creek downstream of Wimer (RM 8.2) 11373 148 15 (n=6) 23.2 0
Evans Creek at Bridge #341 (RM 18) 11466 34.5 0 8.3 0 East Fork Evans Creek downstream of Spikenard (2.3 miles downstream of Mystery Creek) (RM 22)
30191 6.9 0 28.9 0
*Summer season = June 1 – Sept 30 ** F/W/S = Fall/Winter/Spring = Oct 1 – May 31
Daily loads based on 406 org.s/100mL
Daily loads based on 126 org.s/100mL
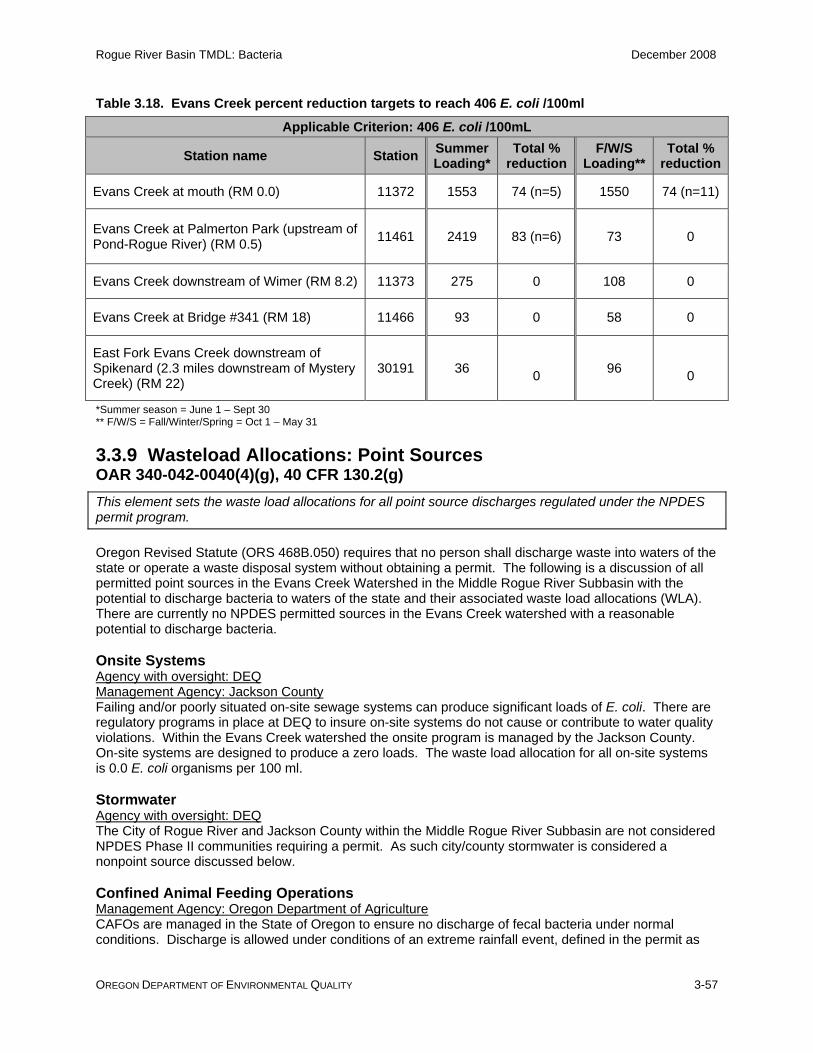
Rogue River Basin TMDL: Bacteria December 2008
OREGON DEPARTMENT OF ENVIRONMENTAL QUALITY 3-57
Table 3.18. Evans Creek percent reduction targets to reach 406 E. coli /100ml Applicable Criterion: 406 E. coli /100mL
Station name Station Summer Loading*
Total % reduction
F/W/S Loading**
Total % reduction
Evans Creek at mouth (RM 0.0) 11372 1553 74 (n=5) 1550 74 (n=11)
Evans Creek at Palmerton Park (upstream of Pond-Rogue River) (RM 0.5) 11461 2419 83 (n=6) 73 0
Evans Creek downstream of Wimer (RM 8.2) 11373 275 0 108 0
Evans Creek at Bridge #341 (RM 18) 11466 93 0 58 0
East Fork Evans Creek downstream of Spikenard (2.3 miles downstream of Mystery Creek) (RM 22)
30191 36 0 96
0
*Summer season = June 1 – Sept 30 ** F/W/S = Fall/Winter/Spring = Oct 1 – May 31
3.3.9 Wasteload Allocations: Point Sources OAR 340-042-0040(4)(g), 40 CFR 130.2(g) This element sets the waste load allocations for all point source discharges regulated under the NPDES permit program. Oregon Revised Statute (ORS 468B.050) requires that no person shall discharge waste into waters of the state or operate a waste disposal system without obtaining a permit. The following is a discussion of all permitted point sources in the Evans Creek Watershed in the Middle Rogue River Subbasin with the potential to discharge bacteria to waters of the state and their associated waste load allocations (WLA). There are currently no NPDES permitted sources in the Evans Creek watershed with a reasonable potential to discharge bacteria. Onsite Systems Agency with oversight: DEQ Management Agency: Jackson County Failing and/or poorly situated on-site sewage systems can produce significant loads of E. coli. There are regulatory programs in place at DEQ to insure on-site systems do not cause or contribute to water quality violations. Within the Evans Creek watershed the onsite program is managed by the Jackson County. On-site systems are designed to produce a zero loads. The waste load allocation for all on-site systems is 0.0 E. coli organisms per 100 ml. Stormwater Agency with oversight: DEQ The City of Rogue River and Jackson County within the Middle Rogue River Subbasin are not considered NPDES Phase II communities requiring a permit. As such city/county stormwater is considered a nonpoint source discussed below. Confined Animal Feeding Operations Management Agency: Oregon Department of Agriculture CAFOs are managed in the State of Oregon to ensure no discharge of fecal bacteria under normal conditions. Discharge is allowed under conditions of an extreme rainfall event, defined in the permit as

Rogue River Basin TMDL: Bacteria December 2008
OREGON DEPARTMENT OF ENVIRONMENTAL QUALITY 3-58
greater than the 25-year, 24-hour rainfall. Because the TMDL does not address extreme rainfall event (i.e. the 25-year, 24-hour rainfall), the CAFOs in the Middle Rogue River Subbasin are each allocated zero load.
3.3.10 Load Allocations: Nonpoint Sources OAR 340-042-0040(4)(h), 40 CFR 130.2(h) This element determines the portion of the receiving water’s loading capacity that is allocated to existing nonpoint sources of pollution. The criteria that apply to these areas are a log mean of 126 E. coli / 100 ml in 30 days and 406 E. coli / 100 ml as a daily maximum. The surrogate measure is the percent reduction target. Because management agencies are generally designated by land use, the following is a discussion of bacteria sources by land use also naming the management agency with land use authority. See the Water Quality Management Plan (Chapter 4) for more information and details.
Forest Managed Lands Management Agency: ODF, BLM, USFS The Oregon Department of Forestry (ODF) is the DMA, by statute, for water quality protection from nonpoint source discharges or pollutants resulting from forest operations on non-federal forestlands in the Rogue River Basin, as well as statewide. Water protection rules are applied per OAR 629-635-0000 through 629-660-0060. Forest operators conducting operations in accordance with the Forest Practices Act (FPA) are considered to be in compliance with water quality standards. In July 2003, the Bureau of Land Management (BLM) signed a memorandum of agreement (MOA) with DEQ establishing a process by which the BLM and DEQ will help ensure compliance with State and Federal point and non-point source rules and regulations requirements on BLM lands. This agreement recognizes the BLM as the DMA on BLM-administered lands in Oregon. The agreement, which expired in 2007, was extended by mutual consent of the agencies until December 31, 2008. Pursuant to the MOA, as resources allow, BLM will coordinate with DEQ to develop WQRPs for BLM-administered lands and will revise or adapt WQRPs to be consistent with and applicable to the final TMDL and associated Water Quality Management Plan (WQMP) (the TMDL subbasin implementation strategy). The WQRP will be the TMDL implementation plan for BLM-administered lands. BLM will conduct management activities on BLM administered lands consistent with WQRPs and provide updates and reports on restoration progress according to DEQ's implementation schedule. Where necessary and appropriate, WQRPs propose a set of actions and timeline for achieving nonpoint source load allocations and meeting water quality standards. In the case of E. coli, research in other Oregon watersheds indicates that the management of federal forest lands does not typically contribute to elevated levels of E. coli that are the basis for the listings. Agricultural Lands Management Agency: Oregon Department of Agriculture The Rogue River Basin is managed under two Agricultural Water Quality Management Plans. Areas within Josephine and Jackson Counties are managed under the Inland Rogue Agricultural Water Quality Management Area Plan. Those areas downstream of the Josephine County border will operate under the conditions of the Curry Agricultural Water Quality Management7. The Inland Rogue Agricultural Water Quality Management Area Plan which applies to Evans Creek has been revised in 2008 and includes management actions to address sources of fecal bacteria. The purpose of this Area Plan is to identify strategies to reduce water pollution from agricultural lands through a combination of educational programs, suggested land treatments, management activities, and monitoring. ODA has enforcement authority for the prevention and control of water pollution from agricultural activities under administrative 7 Agricultural Water Quality Management Area Plan are located here: http://oregon.gov/ODA/NRD/water_agplans.shtml

Rogue River Basin TMDL: Bacteria December 2008
OREGON DEPARTMENT OF ENVIRONMENTAL QUALITY 3-59
rules for Rogue River Basin and Oregon Administrative Rules (OAR) 603-090-0120 through 603-090-0180. If additional monitoring indicates that efforts to address fecal bacteria through the Inland Rogue WQMAP are not adequate, the plan may be required to change or undertake additional actions to address bacteria in surface waters. The criteria that apply to these areas are a log mean of 126 E. coli / 100 ml in 30 days and 406 E. coli / 100 ml daily maximum. Irrigation Districts Management Agency: Grants Pass Irrigation District, ditch associations in the Middle Rogue River Subbasin. The irrigation districts will be required to develop implementation plans that include a description of operations and maintenance practices to limit bacterial inputs into the canals. Districts may contact users directly or in conjunction with Soil and Water Conservation Districts (SWCDs) to inform irrigation users on manure management and practices to keep fecal organisms out of the irrigation system and out of surface waters. Rural Residential and Urban Lands Management Agency: Jackson County and the City of Rogue River Jackson County and the City of Rogue River will be required to submit a TMDL implementation plan within 18 months of TMDL completion as per OAR 340-042-0083(3) with detailed plans of how the jurisdictions will meet the TMDL.
3.3.11 Future Sources OAR 340-042-0040(4)(k) Future permitted sources may discharge effluent containing fecal bacteria at concentrations in compliance with water quality standard criteria (log mean of 126 E. coli / 100 ml in 30 days and 406 E. coli / 100 ml daily maximum).

Rogue River Basin TMDL: Bacteria December 2008
OREGON DEPARTMENT OF ENVIRONMENTAL QUALITY 3-60
3.4 UPPER ROGUE RIVER SUBBASIN
3.4.1 Watershed Description The Upper Rogue River Subbasin (HUC 17100307) was examined in this analysis and consists of the following 5th field watersheds; Headwaters Rogue River, Elk Creek, Lost Creek-Rogue River, South Fork Rogue River, Shady Cove -Rogue River, Trail Creek, Big Butte Creek and Little Butte Creek (Figure 3.30). Bacterial listings in the Shady Cove -Rogue River watershed were addressed as Rogue Mainstem Watersheds in Section 3.2. This section focuses on the 303(d) bacteria listed streams in the Little Butte Creek and Trail Creek watersheds. Figure 3.30. Upper Rogue River Subbasin
Headwaters Rogue River
Little Butte Creek
Big Butte Creek
South Fork Rogue River
Elk Creek
Shady Cove-Rogue River
Trail Creek
Lost Creek-Rogue River
MedfordCentral Point
Eagle Point
Talent
Phoenix
Shady Cove
Jacksonville
Gold Hill
Ashland
Butte Falls
303(d) listed as bacteria "TMDL needed"
rivers and creeks
cities
highways
± 0 10 205 Miles
3.4.2 Waterbodies Listed for Bacteria 303(d) streams listed for bacteria are shown on Figures 3.31 & 3.32.

Rogue River Basin TMDL: Bacteria December 2008
OREGON DEPARTMENT OF ENVIRONMENTAL QUALITY 3-61
3.4.3 Current Conditions: Upper Rogue River Subbasin Bacteria Analysis Sampling Sites E. coli data collected from 1996-2007 from 41 sites within the Little Butte Creek and Trail Creek Watersheds were examined (number of data points: n=1063) (Figures 3.31 and 3.32, Table 3.19 and 3.20). Bacteria data came from samples collected by the Oregon Department of Environmental Quality, the Medford Water Commission, and the City of Eagle Point. Figures 3.31 and 3.32 show the bacteria sample sites as well as the maximum concentration of bacteria at each site for the data set. Bacteria concentrations were found in exceedance of water quality criteria at 36 of 41 stations. Trail Creek had one sample site located at the mouth of the creek (LASAR # 24477). E. coli data for Trail Creek were limited to 10 samples taken in 1998 over a two month period (7/27 – 9/23). The log mean of the available E. coli concentration data was 10.3 organisms/100mL. The water contact recreation standard was exceeded once with an E. coli concentration of 1414.0 organisms /100mL. All other sample concentrations were less than 16 organisms/100mL. The lack of data for Trail Creek limits the analysis that can be done. It is anticipated that future E. coli monitoring will include a more in-depth analysis of Trail Creek. DEQ E. coli data from 1998 to 2000 showed no exceedances of the bacteria water quality standard at the mouths of Big Butte Creek (n=15) or Elk Creek (n=13).

Rogue River Basin TMDL: Bacteria December 2008
OREGON DEPARTMENT OF ENVIRONMENTAL QUALITY 3-62
Figure 3.31. E. coli Sampling Sites and Concentrations on Little Butte Creek
Salt Creek at Hwy 140
Lick Creek at Hwy. 140
Eagle Point Storm Drain
Antelope Creek at Hwy. 62
Little Butte Creek at mouth
Little Butte Creek at Hwy. 140
N. Fk. Little Butte at Hwy. 140
South Fork Little Butte at mouth
Lake Creek at Little Butte Creek
Antelope Creek at Little Butte Creek
North Fork Little Butte Creek below Fish Lake
Little Butte Creek at Agate Road (White City)
North Fork Little Butte Creek at River Mile 7.7
South Fork Little Butte Creek at River Mile 9.8
Nichols Branch Creek at mouth at Brownsboro Hwy.
S. Fk. Little Butte at county bridge near Lost Cr. Rd.
South Fork Little Butte Creek upstream of Dead Indian Creek
Lost Creek near mouthAntelope Creek downstream of Riley Road (tributary of Little Butte Creek)
Little Butte Creek downstream of Stream Mile 12.7Little Butte Creek at stream mile 11.7
Eagle Point Storm Drain at Kelso Street
Little Butte Creek at gage in Lake CreekLittle Butte Creek at town of Lake Creek
Little Butte Creek at Eagle Pt. upstream of mill
North Fork Little Butte Creek at Little Butte Creek
Little Butte Creek upstream of Nichols Branch Creek
Little Butte Cr.Brownsboro Rd. downstream of Nichols
Little Butte Crbelow North Fk. & South Fk. confluence
Little Butte Creek near former Eagle Pt. sewage ponds
Eagle Point Irrigation Ditch near Buchanan Ditch (EPID)
Little Butte Creek at mill diversion pond near Reese Cr. Rd.
Little Butte Cr.at Eagle Pt. residence, 800 block S. Royal Ave.
LBC Upstream of Hwy. 62 Wayside Park in Eagle Point
Little Butte Creek Upstream of Mattie Brown Park (on Royal Ave. in
Little Butte Creek upstream of Stream Mile 12.7
Little Butte Creek, 200 feet downstream of North and South Forks confluence
Little Butte Creek in Eagle Point above Archood Street storm drain
Medford
Ashland
Eagle Point
Talent
Phoenix
Jacksonville
Shady Cove
Gold Hill
Antelope Creek
Dry C
reek
Daley Creek
Grizzly Creek
Stre
am
Little Butte Creek sampling sites
maximum E. coli value0.0 - 126.0
126.1 - 406.0
406.1 - 3000.0
3000.1 - 6212.0
6212.1 - 11612.4
303(d) listed as bacteria "TMDL needed"
streams and rivers
cities
highways±0 5 102.5 Miles
Lost Lake

Rogue River Basin TMDL: Bacteria December 2008
OREGON DEPARTMENT OF ENVIRONMENTAL QUALITY 3-63
Figure 3.32. E. coli Sampling Sites and Concentrations on Trail Creek
!(!(Rogue River@ Trail Cr.
Trail Creek at mouth
Shady Cove
Wall Creek
West Fork Trail Creek
Trail Creek
Walpole Creek
Deadhorse Creek
Romine Creek
Chicago Creek
Canyon Creek
Buck Rock Creek
Hill C
reek
Paradise Creek
Trai
l Cr e
ek
Canyon Creek
Trail Creek sampling sites
maximum E. coli value!( 0.0 - 1414.0
!( 0.0 - 20.0
303d listed as bacteria "TMDL needed"
streams and rivers
cities
highways
±0 1 20.5 Miles
Table 3.19. E. coli data for the Little Butte Creek Watershed
Station ID Creek Mile Station Description Log mean
E. coli Maximum E. coli
Number of Samples
23754 0 Little Butte Creek at mouth 125.6 1414.0 31
10602 1.2 Little Butte Creek at Agate Road (White City) 164.6 1920.0 112
25584 2.6 Antelope Creek at Little Butte Creek 119.8 733.0 11 26645 2.6 Antelope Creek at Hwy. 62 479.5 1800.0 32
24409 2.6 Antelope Creek downstream of Riley Road (tributary of Little Butte Creek) 389.6 1986.0 18
26647 2.7 Little Butte Creek near former Eagle Pt. sewage ponds 313.1 580.0 4
25585 3.6 LBC Upstream of Hwy. 62 Wayside Park in Eagle Point, upstream of 2 475.6 2902.8 100
25589 3.7 Eagle Point Irrigation Ditch near Buchanan Ditch (EPID) 1680.2 4480.0 11
25588 3.8 Eagle Point Storm Buchanan Ditch 622.5 9676.0 11
26648 3.9 Little Butte Cr.at Eagle Pt. residence, 800 block S. Royal Ave. 371.8 1300.0 9
25587 4.3 Eagle Point Storm Drain at Kelso Street 26.0 2190.0 11

Rogue River Basin TMDL: Bacteria December 2008
OREGON DEPARTMENT OF ENVIRONMENTAL QUALITY 3-64
Station ID Creek Mile Station Description Log mean
E. coli Maximum E. coli
Number of Samples
26638 5.0 Little Butte Creek Upstream of Mattie Brown Park (on Royal Ave. in 427.3 3000.0 82
30871 5.4 Little Butte Creek in Eagle Point above Archood Street storm drain (River Mile 5.4), Rogue River
321.8 2419.0 13
25590 5.5 Little Butte Creek at Eagle Pt. upstream of mill 346.6 2902.8 87
26637 5.6 Little Butte Creek at mill diversion pond near Reese Cr. Rd. 525.1 2280.0 21
25586 5.7 Eagle Point Storm Drain 282.0 6212.0 11
26649 6.1 Little Butte Cr.Brownsboro Rd. downstream of Nichols 367.0 1300.0 13
25591 6.2 Nichols Branch Creek at mouth at Brownsboro Hwy. 658.8 11612.4 44
25592 6.3 Little Butte Creek upstream of Nichols Branch Creek 139.7 609.0 23
26646 8.0 Little Butte Creek at Brownsboro Road, mile 4 (Rogue) 382.5 1414.0 42
26650 8.5 Little Butte Cr., u/s Bitterlick Cr. (Rogue) 206.3 700.0 8 26651 10.7 Little Butte Creek at Hwy. 140 244.3 1920.0 9 25973 11.2 Lick Creek at Hwy. 140 134.2 530.0 8 23764 11.7 Little Butte Creek at stream mile 11.7 423.7 1733.0 47
30873 12.7 Little Butte Creek downstream of Stream Mile 12.7 Irrigation Return Flow, Rogue River
270.9 1140.0 6
30872 12.8 Little Butte Creek upstream of Stream Mile 12.7 Irrigation Return Flow, Rogue River 176.7 314.0 6
23738 14.6 Salt Creek at Hwy 140 207.8 3683.0 25 25593 16.7 Little Butte Creek at gage in Lake Creek 87.0 1302.0 11 26632 16.8 Little Butte Creek at town of Lake Creek 372.0 1400.0 20 25594 16.9 Lake Creek at Little Butte Creek 492.3 5805.6 43
26652 17.0 Little Butte Creek, 200 feet downstream of North and South Forks confluence (Rogue) 394.2 2359.0 18
25789 17.1 Little Butte Cr below North Fk. & South Fk. Confluence 486.4 2359.0 10
25595 17.2 South Fork Little Butte at mouth 155.9 1310.0 40
26633 17.2 South Fork Little Butte at county bridge near Lost Cr. Rd. 35.5 97.0 16
26634 17.2 Lost Creek near mouth, park with covered bridge, Lost Creek Road (Rogue) 31.7 450.0 13
24410 17.2 South Fork Little Butte Creek at River Mile 9.8 11.5 31.0 10
25597 17.2 South Fork Little Butte Creek upstream of Dead Indian Creek 6.8 428.0 10
25596 17.3 North Fork Little Butte Creek at Little Butte Creek 361.7 4350.0 38
26636 17.3 North Fork Little Butte at Hwy. 140 232.2 613.0 7
25599 17.3 North Fork Little Butte Creek at River Mile 7.7 9.5 63.0 10
25598 17.3 North Fork Little Butte Creek below Fish Lake 4.7 21.0 10
Notes: Tan indicates tributary inflows to Little Butte Creek mainstem. Green shading indicates exceedance of the E. coli crite.ia

Rogue River Basin TMDL: Bacteria December 2008
OREGON DEPARTMENT OF ENVIRONMENTAL QUALITY 3-65
Table 3.20. E. coli data Trail Creek
Station ID Creek Mile Station Description Log mean of E. coli*
Maximum of E. coli*
Number of Samples
24477 0 Trail Creek at mouth 10.3 1414 10 *Note: Trail Creek data is categorized as Level B based on quality assurance quality control standards. Level B data is appropriate for use in permitting, compliance and 303(d) assessment work when used with professional judgment (DEQ 2005). Green shading indicates exceedance of the E. coli criteria
3.4.4 Seasonal Variation Between 1996 and 2007, 769 samples were taken during the summer and 292 were taken during the fall/winter/spring season, in the Little Butte Creek watershed. Summer: During the summer season, defined by the analysis of available data between June 1 – September 30 during the years of 1996-2007 (n =769), E. coli concentrations exceeded the water quality standard at numerous points along the Little Butte Creek mainstem and tributaries (Figure 3.33). In general, tributary concentrations were higher than mainstem concentrations with concentrations over 10,000 organisms/100mL in Nichols Branch (Little Butte RM 6.2). E. coli concentrations were greater than 1000 organisms/100mL in over 14% of summer samples analyzed. Fall/Winter/Spring: During the fall/winter/spring season (Figure 3.34), defined by the analysis of available data between October 1 through May 31 during the years of 1996-2007 (n = 292), E. coli concentration trends from upstream to downstream are not evident. Several stormwater discharge sites in Eagle Point had extremely high E. coli values with concentrations over 9000 organisms/100mL at the Buchanan Ditch and over 6000 at a storm drain at RM 5.7. As per the summer season, Nichols Branch E. coli showed extreme concentrations with several samples greater than 10,000 organisms/100mL. Overall, 12% of the fall/winter/spring samples had E. coli concentrations greater than 1000 organisms/100mL.

Rogue River Basin TMDL: Bacteria December 2008
OREGON DEPARTMENT OF ENVIRONMENTAL QUALITY 3-66
Figure 3.33. Summer Little Butte Creek E. coli Data
0 1 2 3 4 5 6 7 8 9 10 11 12 13 14 15 16 17
Stream Mile
1
10
100
1,000
10,000
E. C
oli c
once
ntra
tion
(org
anis
ms/
100m
L)
mainstem sitestributary sites
126
Conflu
ence
of N
F an
d
SF L
ittle
Butte
Cre
eks
Ante
lope
Creek
Nichols
Bra
nch
Lick C
reek
Salt C
reek
Lake
Cre
ek
0 1 2 3 4 5 6 7 8 9 10 11 12 13 14 15 16 17
Stream Mile
1
10
100
1,000
10,000
E. C
oli c
once
ntra
tion
(org
anis
ms/
100m
L)
mainstem sitestributary sites
126
Conflu
ence
of N
F an
d
SF L
ittle
Butte
Cre
eks
Ante
lope
Creek
Nichols
Bra
nch
Lick C
reek
Salt C
reek
Lake
Cre
ek
Conflu
ence
of N
F an
d
SF L
ittle
Butte
Cre
eks
Ante
lope
Creek
Nichols
Bra
nch
Lick C
reek
Salt C
reek
Lake
Cre
ek
406

Rogue River Basin TMDL: Bacteria December 2008
OREGON DEPARTMENT OF ENVIRONMENTAL QUALITY 3-67
Figure 3.34. Fall/winter/spring Little Butte Creek E. coli Data
Conflu
ence
of N
F an
d
SF L
ittle
Butte
Cre
eks
Ante
lope
Creek
Nichols
Bra
nch
Lick C
reek
Salt C
reek
Lake
Cre
ek
0 1 2 3 4 5 6 7 8 9 10 11 12 13 14 15 16 17
Stream Mile1
10
100
1,000
10,000
E. C
oli c
once
ntra
tion
(org
anis
ms/
100m
L)
mainstem sitestributary sites
126
Conflu
ence
of N
F an
d
SF L
ittle
Butte
Cre
eks
Ante
lope
Creek
Nichols
Bra
nch
Lick C
reek
Salt C
reek
Lake
Cre
ek
Conflu
ence
of N
F an
d
SF L
ittle
Butte
Cre
eks
Ante
lope
Creek
Nichols
Bra
nch
Lick C
reek
Salt C
reek
Lake
Cre
ek
0 1 2 3 4 5 6 7 8 9 10 11 12 13 14 15 16 17
Stream Mile1
10
100
1,000
10,000
E. C
oli c
once
ntra
tion
(org
anis
ms/
100m
L)
mainstem sitestributary sites
126
Figure 3.35 examines the seasonal behavior of data associated with two downstream sites (RM 0 – 1.2) on Little Butte Creek (Little Butte Creek at mouth and at Agate Road (LASAR Sites: 23754, 10602). Seasonal median concentrations are less than 126 organisms/100mL from January to April but greatly exceed both the 126 and 406 organisms/100mL criteria during the July to November period. An analysis of precipitation records taken from Medford indicate that high summer bacterial concentrations are not linked to rainfall (Figure 3.35). Rather, bacteria concentrations entering Little Butte Creek indicate another source besides rainfall is driving the summer bacteria concentrations. There are no individual NPDES permitted sites in the Little Butte Creek watershed. Other potential sources include septic systems and bacteria loads transported into the watershed or off the landscape via irrigation water use and conveyance.
406

Rogue River Basin TMDL: Bacteria December 2008
OREGON DEPARTMENT OF ENVIRONMENTAL QUALITY 3-68
Figure 3.35. Monthly E. coli Concentrations at the mouth of Little Butte Creek (Combines data RM 0.0-1.2) and Average Rainfall at Medford
January
FebruaryMarch
April MayJune July
August
SeptemberOctober
November
December1
10
100
1,000
E. C
oli c
once
ntra
tion
(org
anis
ms/
100m
L)
126
0
4
8
12
Aver
age
mon
thly
pre
cipi
tatio
n (0
.01
in)
3.4.5 Critical Period - Seasonal Variation Upper Rogue River subbasin: Section 303(d)(1) requires a TMDL to be “established at a level necessary to implement the applicable water quality criteria with seasonal variations.” The critical period for the Upper Rogue River subbasin is that period of time when bacterial concentrations exceed the State of Oregon criteria for water contact recreation. Based on the 2004/2006 303(d) list (Table 3.3) and TMDL analysis, the Creeks in the Upper Rogue River subbasin exceeded the applicable bacteria criteria during both defined seasons (summer and fall/winter/spring). Seasonal percent reductions were calculated for all creeks including Trail Creek. The load duration curve method employed in this TMDL determines loads and percent reduction targets that apply year-round for all waters upstream of the point of analysis. Specific load and wasteload allocations apply to sources across the Upper Rogue River Subbasin.
406

Rogue River Basin TMDL: Bacteria December 2008
OREGON DEPARTMENT OF ENVIRONMENTAL QUALITY 3-69
3.4.6 Existing Pollution Sources OAR 340-042-004(4)(f), CWA §303(d)(1)
Point Sources NPDES Individual Permits The City of Shady Cove and Country View Mobile Estates discharge into the Rogue River and the City of Butte Falls discharges into Big Butte Creek. These individual permits were addressed in the Rogue Mainstem Watersheds section of this document (Section 3.2). Stormwater NPDES Permits The Cities of Shady Cove, Butte Falls, and Eagle Point and Jackson County within the Upper Rogue River Subbasin are not considered NPDES Phase II communities requiring a permit. The city/county stormwater is considered a nonpoint source as discussed below. Confined Animal Feeding Operations The one permitted CAFO in the Upper Rogue River subbasin was addressed in the Rogue Mainstem Watersheds section of this document. Nonpoint Sources Land use and Land cover Land use and land cover were examined in the Upper Rogue River subbasin (Figure 3.36). The Upper Rogue River subbasin is dominated by forested areas (66.3%), dominated by shrub/scrub. For the Little Butte Creek watershed (Figure 3.37), the area is dominated by forested areas (59.1%) dominated by shrub/scrub and evergreen forest. Agricultural uses (27.3%) dominated by grasslands are also significant land uses in the Little Butte Creek watershed. Urban areas cover 7.1% of the watershed. The Trail Creek watershed (Figure 3.38) is dominated by forested areas (88.4%), which are dominated by shrub/scrub, evergreen forest, and mixed forest. The remaining land is used for agriculture, low intensity development, and open spaces.
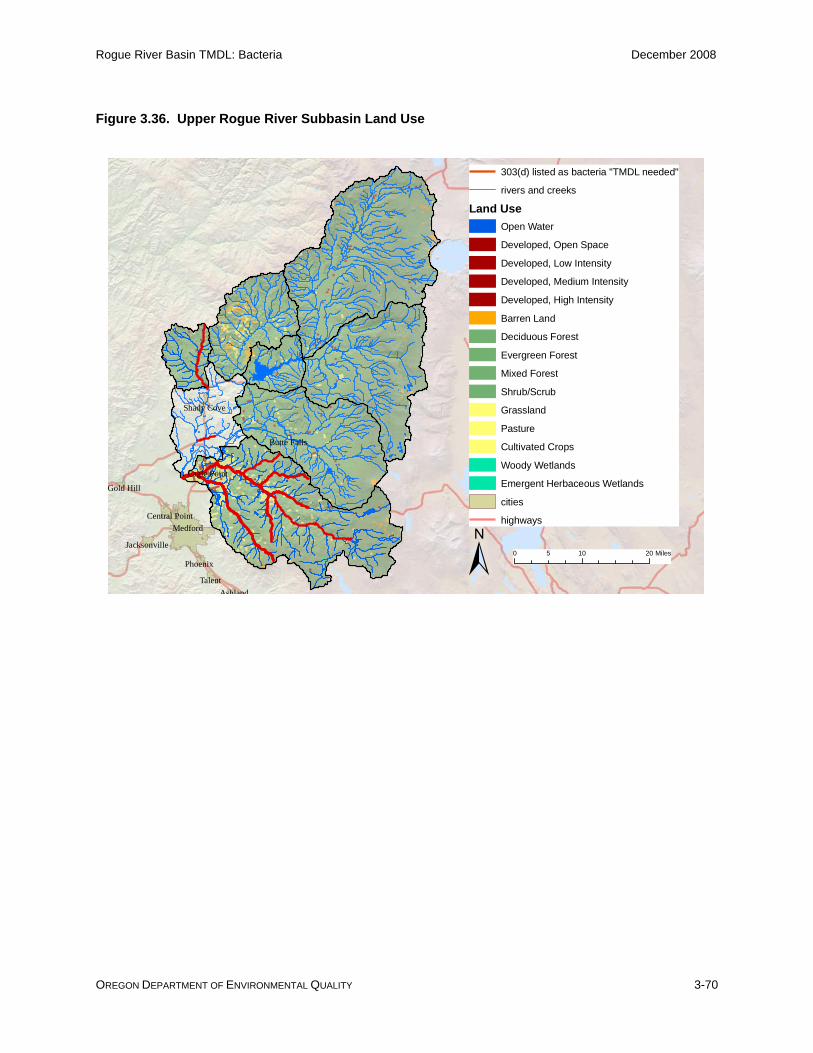
Rogue River Basin TMDL: Bacteria December 2008
OREGON DEPARTMENT OF ENVIRONMENTAL QUALITY 3-70
Figure 3.36. Upper Rogue River Subbasin Land Use
MedfordCentral Point
Eagle Point
Talent
Phoenix
Shady Cove
Jacksonville
Ashland
Gold Hill
Butte Falls
303(d) listed as bacteria "TMDL needed"
rivers and creeks
Land UseOpen Water
Developed, Open Space
Developed, Low Intensity
Developed, Medium Intensity
Developed, High Intensity
Barren Land
Deciduous Forest
Evergreen Forest
Mixed Forest
Shrub/Scrub
Grassland
Pasture
Cultivated Crops
Woody Wetlands
Emergent Herbaceous Wetlands
cities
highways
± 0 10 205 Miles

Rogue River Basin TMDL: Bacteria December 2008
OREGON DEPARTMENT OF ENVIRONMENTAL QUALITY 3-71
Figure 3.37. Little Butte Creek Land Use with Maximum E. coli Concentration Data
Salt Creek at Hwy 140
Lick Creek at Hwy. 140
Eagle Point Storm Drain
Antelope Creek at Hwy. 62
Little Butte Creek at mouth
Little Butte Creek at Hwy. 140
N. Fk. Little Butte at Hwy. 140
South Fork Little Butte at mouth
Lake Creek at Little Butte Creek
Antelope Creek at Little Butte Creek
North Fork Little Butte Creek below Fish Lake
Little Butte Creek at Agate Road (White City)
North Fork Little Butte Creek at River Mile 7.7
South Fork Little Butte Creek at River Mile 9.8
Nichols Branch Creek at mouth at Brownsboro Hwy.
S. Fk. Little Butte at county bridge near Lost Cr. Rd.
South Fork Little Butte Creek upstream of Dead Indian Creek
Lost Creek near mouthAntelope Creek downstream of Riley Road (tributary of Little Butte Creek)
Little Butte Creek downstream of Stream Mile 12.7Little Butte Creek at stream mile 11.7
Eagle Point Storm Drain at Kelso Street
Little Butte Creek at gage in Lake CreekLittle Butte Creek at town of Lake Creek
Little Butte Creek at Eagle Pt. upstream of mill
North Fork Little Butte Creek at Little Butte Creek
Little Butte Creek upstream of Nichols Branch Creek
Little Butte Cr.Brownsboro Rd. downstream of Nichols
Little Butte Crbelow North Fk. & South Fk. confluence
Little Butte Creek near former Eagle Pt. sewage ponds
Eagle Point Irrigation Ditch near Buchanan Ditch (EPID)
Little Butte Creek at mill diversion pond near Reese Cr. Rd.
Little Butte Cr.at Eagle Pt. residence, 800 block S. Royal Ave.
LBC Upstream of Hwy. 62 Wayside Park in Eagle Point
Little Butte Creek Upstream of Mattie Brown Park (on Royal Ave. in
Little Butte Creek upstream of Stream Mile 12.7
Little Butte Creek, 200 feet downstream of North and South Forks confluence
Little Butte Creek in Eagle Point above Archood Street storm drain
Medford
Grants Pass
Ashland
Eagle Point
Talent
Phoenix
Shady Cove
Jacksonville
Gold HillRogue River
Daley Creek
Grizzly Creek
Beaver Dam Creek
LegendLittle Butte Creek sampling sites
maximum E. coli value0.0 - 126.0
126.1 - 406.0
406.1 - 3000.0
3000.1 - 6212.0
6212.1 - 11612.4
303(d) listed "TMDL needed"
streams and rivers
Little Butte Creek watershed
Land UseOpen Water
Developed, Open Space
Developed, Low Intensity
Developed, Medium Intensity
Developed, High Intensity
Barren Land
Deciduous Forest
Evergreen Forest
Mixed Forest
Shrub/Scrub
Grassland
Pasture
Cultivated Crops
Woody Wetlands
Emergent Herbaceous Wetlands
highways ±0 6 123 Miles
Lost Lake
Figure 3.38. Trail Creek Land Use with Maximum E. coli Concentration Data
!(!(Rogue River @ Trail Cr.
Trail Creek at mouth
Shady Cove
Wall Creek
West Fork Trail Creek
Trail Creek
Walpole Creek
Deadhorse Creek
Romine Creek
Chicago Creek
Canyon Creek
Buck Rock Creek
Hill C
reek
Paradise Creek
Trai
l Cr e
ek
Canyon Creek
Trail Creek sampling sites
maximum E. coli value!( 0.0 - 1414.0
!( 0.0 - 20.0
303d listed as bacteria "TMDL needed"
streams and rivers
Land UseGRIDCODE
Open Water
Developed, Open Space
Developed, Low Intensity
Deciduous Forest
Evergreen Forest
Mixed Forest
Shrub/Scrub
Grassland
cities
highways
±0 1 20.5 Miles

Rogue River Basin TMDL: Bacteria December 2008
OREGON DEPARTMENT OF ENVIRONMENTAL QUALITY 3-72
Land Use and E. coli Concentrations The 6th field subwatershed was determined for each of LASAR stations in the Little Butte Creek watershed. The 1996-2007, (n=1061) bacteria concentration data were assigned to each of the six 6th field watersheds by station and plotted against the land use classifications (Figure 3.39). The median bacteria concentrations exceeded the 126 E. coli/100 ml standard for most of the watersheds. The percentages of agricultural areas generally increase from headwaters to mouth as forested lands decrease. Figure 3.39. Little Butte Creek E. coli Concentrations and Upstream Land Use
Kanutchan Cr-L
ittle Butte Cr
Lower Antelope Cr
Lake Cr-Little
Butte CrSalt C
r
Lick Cr-L
ittle Butte Cr
Lower SF Little
Butte Cr
Middle SF Little Butte Cr
Lower NF Little
Butte Cr
Upper NF Little
Butte Cr
Upper NF Little
Butte Cr
1
10
100
1,000
10,000
bact
erio
logi
cal c
once
ntra
tion
(org
anis
ms/
100m
L)
0
20
40
60
80
land
use
type
(per
cent
)126
406
E. ColiOpenUrbanForestAgWetlands
3.4.7 TMDL Loading Capacities OAR 340-042-0040(4)(d), CWA §303(d)(1), 40 CFR 130.2(f) Loading Capacity: This element specifies the amount of fecal bacteria expressed as E. coli organisms per day that Little Butte Creek can receive and still meet water quality standards. The load duration curve for Little Butte Creek was determined using flow data that was reconstructed from a historic USGS gage (Little Butte Creek below Eagle Point gage #14348000) and a similar gaged watershed (Elk Creek near Trail 14338000) (Figure 3.40). The historic Little Butte Creek flow gage site was 3.5 miles upstream of the mouth. This approach may conservatively under-represent the true flow at the mouth but is the best estimate of current flow near the mouth of Little Butte Creek. At the mouth of Little Butte Creek, the bacteria load will be the same or diluted. (Table 3.21).

Rogue River Basin TMDL: Bacteria December 2008
OREGON DEPARTMENT OF ENVIRONMENTAL QUALITY 3-73
Figure 3.40. E. coli Loading Capacity for Little Butte Creek Near the Mouth
389
cfs
152
cfs
67 c
fs
20 c
fs
1.0E+09
1.0E+10
1.0E+11
1.0E+12
1.0E+13
1.0E+14
0 20 40 60 80 100
Flow duration interval (%)
E. C
oli d
aily
in s
tream
load
High Transitional Flow Typical Flow Dry Flow Low Flow Flow
Note: The thin green line represents the E. coli loading capacity of 126 E. coli /100 mL. The wide red line
represents the E. coli loading capacity of 406 E. coli /100 mL. Table 3.21. E. coli Loading Capacity for Little Butte Creek at Mouth
Little Butte Creek High Flow
(Above 389 cfs)
Transitional (152 to 389
cfs)
Typical (67 to 152
cfs)
Dry Flow (20 to 67 cfs)
Low Flow (Below 20
cfs) E. coli Organisms per Day
Loading Capacity (based on 126 E. coli per 100 ml criterion)
Greater than
1.2x10¹²
4.7x10¹¹ to 1.2x10¹²
2.1x10¹¹ to 4.7x10¹¹
6.2x10¹⁰ to 2.1x10¹¹
Less than 6.2x10¹⁰
Loading Capacity (based on 406 E. coli per 100 ml criterion)
Greater than
3.9x10¹²
1.5x10¹² to 3.9 x10¹²
6.7x10¹¹ to 1.5x10¹²
2.0x10¹¹ to 6.7x10¹¹
Less than 2.0x10¹¹
Daily loads based on 406 org.s/100mL
Daily loads based on 126 org.s/100mL

Rogue River Basin TMDL: Bacteria December 2008
OREGON DEPARTMENT OF ENVIRONMENTAL QUALITY 3-74
3.4.8 TMDL Allocations 40 CFR 130.2(G) and (H) This element divides the bacterial loading capacity between individual point and nonpoint sources and sets the load reduction targets and margins of safety that when reached will result in achieving the TMDL loading capacity. Flow based loading capacity for Little Butte Creek was determined using the load duration curve previously discussed (Table 3.22 and Figures 3.41 and 3.42). Loads associated with the bacteria samples were determined by using the flows reconstructed from the historic gage as previously described. Note that of the 303(d) listed streams in the Upper Rogue River Subbasin only Little Butte Creek had sufficient flow data to develop a flow based loading capacity. Table 3.22. Little Butte Creek Flow Based Load Allocations and Percent E. coli Reduction Targets
Allocations High Flow (Above 389
cfs)
Transitional (152 to 389
cfs)
Typical (67 to 152
cfs)
Dry Flow (20 to 67 cfs)
Low Flow (Below 20
cfs)
E. coli Organisms per Day Allowable Loading
Capacity organisms per day
(based on 126 E. coli per 100 ml criterion)
1.2x10¹² 8.3x10¹¹ 3.4x10¹¹ 1.3x10¹¹ 6.2x10¹⁰
Current Loading organisms per day (log mean of E. coli
loads)
1.6x10¹² 1.9x10¹¹ 6.6x10¹¹ 2.5x10¹¹ 8.9x10¹⁰
Percent Reduction to meet 126 E. coli per 100
ml criterion 23% 0% 49% 49% 31%
Allowable Loading
Capacity organisms per day
(based on 406 E. coli per 100 ml criterion)
3.9x10¹² 2.7x10¹² 1.1x10¹² 4.3x10¹¹ 2.0x10¹¹
Current Loading organisms per day
(maximum of E. coli loads)
1.4x10¹³ 1.2x10¹³ 3.5x10¹² 2.4x10¹² 1.2x10¹²
Percent Reduction to meet 406 E. coli per 100
ml 73% 78% 69% 82% 83%

Rogue River Basin TMDL: Bacteria December 2008
OREGON DEPARTMENT OF ENVIRONMENTAL QUALITY 3-75
Figure 3.41. Load Duration Curves for Little Butte Creek
389
cfs
152
cfs
67 c
fs
20 c
fs
1.0E+09
1.0E+10
1.0E+11
1.0E+12
1.0E+13
1.0E+14
0 20 40 60 80 100
Flow duration interval (%)
E. C
oli d
aily
in s
tream
load
High Transitional Flow Typical Flow Dry Flow Low Flow Flow
Note: The thick red line represents the E. coli loading capacity of 406 organisms/100 ml. The thin green line
represents the E. coli loading capacity of 126 organisms /100ml.
Daily loads based on 406 org.s/100mL
Daily loads based on 126 org.s/100mL

Rogue River Basin TMDL: Bacteria December 2008
OREGON DEPARTMENT OF ENVIRONMENTAL QUALITY 3-76
Figure 3.42. Percent reductions needed to meet the water quality standard at the mouth of Little Butte Creek.
20 c
fs
67 c
fs
152
cfs
389
cfs
1.0E+09
1.0E+10
1.0E+11
1.0E+12
1.0E+13
1.0E+14
0 20 40 60 80 100
Flow duration interval (%)
E. C
oli d
aily
in s
tream
load
High Transitional Flow Typical Flow Dry Flow Low Flow Flow
73%
78%
69%
82%
83%
23%
49%
49%
31%
20 c
fs
67 c
fs
152
cfs
389
cfs
1.0E+09
1.0E+10
1.0E+11
1.0E+12
1.0E+13
1.0E+14
0 20 40 60 80 100
Flow duration interval (%)
E. C
oli d
aily
in s
tream
load
High Transitional Flow Typical Flow Dry Flow Low Flow Flow
73%
78%
69%
82%
83%
23%
49%
49%
31%
Note: The green lines represent the geometric means of sampled E. coli values expressed as loads within the flow
interval. The red diamonds represent the maximum sampled E. coli value expressed as a load within the flow interval.
In the Little Butte Creek Watershed, seasonal load allocations were calculated, as described in Section 3.1, at several sampling stations on Little Butte Creek and tributaries with no flow data (Table 3.23 and Table 3.24).
Daily loads based on 406 org.s/100mL
Daily loads based on 126 org.s/100mL

Rogue River Basin TMDL: Bacteria December 2008
OREGON DEPARTMENT OF ENVIRONMENTAL QUALITY 3-77
Table 3.23. Upper Rogue River percent reduction targets to reach 126 E. coli /100ml
Applicable Criterion: 126 E. coli org/100mL
Station name LASAR Station Number
Summer Loading*
Summer Total %
reduction F/W/S
Loading** F/W/S
Total % reduction
Little Butte Creek at Agate Rd 10602 291.0 57 100.9 0 Salt Creek at Hwy 140 23738 406.0 69 88.6 0 Nichols Branch Creek at Little Butte Creek 25591 1032.0 88 251.8 50
Lake Creek at Little Butte Creek 25594 849.3 85 139.8 10 North Fork Little Butte Creek at Little Butte Creek 25596 467.5 73 207.9 39
LickCr.@ Hwy. 140 25973 210.7 40 34.6 0 Lost Creek near mouth, park with covered bridge, Lost Creek Road (Rogue)
26634 35.5 0 17.0 0
Antelope Creek at Little Butte Creek, Antelope Creek at Hwy 62 (Little Butte, Rogue)
25584 & 26645 527.6 76 132.2 5
South Fork Little Butte Creek at Little Butte Creek 25595 246.8 49 60.1 0
Trail Creek 24477 10.3 0 *Summer season = June 1 – Sept 30 ** F/W/S = Fall/Winter/Spring = Oct 1 – May 31 Table 3.24. Upper Rogue River percent reduction targets to reach 406 E. coli org/100ml
Applicable Criterion: 406 E. coli org/100mL
Station name LASAR Station Number
Summer Loading*
Summer Total %
reduction F/W/S
Loading** F/W/S
Total % reduction
Little Butte Creek at Agate Rd 10602 1269.5 68 1920.0 79 Salt Creek at Hwy 140 23738 1620.0 75 3683.0 89 Nichols Branch Creek at Little Butte Creek 25591 11612.4 97 3280.0 88
Lake Creek at Little Butte Creek 25594 5805.6 93 4813.0 92 North Fork Little Butte Creek at Little Butte Creek 25596 4350.0 91 3076.0 87
LickCr.@ Hwy. 140 25973 530.0 23 60.0*** 0 Lost Creek near mouth, park with covered bridge, Lost Creek Road (Rogue)
26634 450.0 10 48.0*** 0
Antelope Creek at Little Butte Creek, Antelope Creek at Hwy 62 (Little Butte, Rogue)
25584 & 26645 1800.0 77 733.0 45
South Fork Little Butte Creek at Little Butte Creek 25595 1310.0 69 259.0 0
Trail Creek 24477 1414.0 71.3 *Summer season = June 1 – Sept 30 ** F/W/S = Fall/Winter/Spring = Oct 1 – May 31 ***number of samples n = 2

Rogue River Basin TMDL: Bacteria December 2008
OREGON DEPARTMENT OF ENVIRONMENTAL QUALITY 3-78
Wasteload Allocations: Point Sources OAR 340-042-0040(4)(g), 40 CFR 130.2(g) This element sets the waste load allocations for all point source discharges regulated under the NPDES permit program. Individual NPDES Discharge Permits Agency with oversight: DEQ Within the Upper Rogue River Subbasin, the City of Shady Cove, and Country View Mobile Estates discharge into the Rogue River. These sources operate under individual NPDES permits and are discussed in the Rogue Mainstem Watersheds section of this document (Section 3.2). The City of Butte Falls discharges into Big Butte Creek and operates under an individual NPDES permit. Onsite Systems Agency with oversight: DEQ Management Agency: Jackson County Failing and/or poorly situated on-site sewage systems can produce significant loads of E. coli. There are regulatory programs in place at DEQ to insure on-site systems do not cause or contribute to water quality violations. Within the Upper Rogue River Subbasin watershed the onsite program is managed by the Jackson County. On-site systems are designed to produce a zero loads. The waste load allocation for all on-site systems is 0.0 E. coli organisms per 100 ml. Stormwater NPDES Permits Agency with oversight: DEQ The Cities of Shady Cove, Butte Falls, and Eagle Point and Jackson County within the Upper Rogue River Subbasin are not considered NPDES Phase II communities requiring a permit. The city/county stormwater is considered a nonpoint source as discussed below. Confined Animal Feeding Operations Management Agency: Oregon Department of Agriculture CAFOs are managed in the State of Oregon to ensure no discharge of fecal bacteria under normal conditions. Discharge is allowed under conditions of an extreme rainfall event, defined in the permit as greater than the 25-year, 24-hour rainfall. The general permit also stipulates that during such a discharge effluent cannot cause or contribute to a violation of state water quality standards. Because the TMDL does not address extreme rainfall event (i.e. the 25-year, 24-hour rainfall), the CAFOs in the Upper Rogue River Subbasin are each allocated zero load.
Load Allocations: Nonpoint Sources OAR 340-042-0040(4)(h), 40 CFR 130.2(h) This element determines the portion of the receiving water’s loading capacity that is allocated to existing nonpoint sources of pollution. The criteria that apply to these areas are a log mean of 126 E. coli / 100 ml in 30 days and 406 E. coli / 100 ml as a daily maximum. The surrogate measure is the percent reduction target. Because management agencies are generally designated by land use, the following is a discussion of bacteria sources by land use also naming the management agency with land use authority. See the Water Quality Management Plan (Chapter 4) for more information and details.
Forest Managed Lands Management Agency: ODF, BLM, USFS The Oregon Department of Forestry (ODF) is the DMA, by statute, for water quality protection from nonpoint source discharges or pollutants resulting from forest operations on non-federal forestlands in the Rogue River Basin, as well as statewide. Water protection rules are applied per OAR 629-635-0000

Rogue River Basin TMDL: Bacteria December 2008
OREGON DEPARTMENT OF ENVIRONMENTAL QUALITY 3-79
through 629-660-0060. Forest operators conducting operations in accordance with the Forest Practices Act (FPA) are considered to be in compliance with water quality standards. In July 2003, the Bureau of Land Management (BLM) signed a memorandum of agreement (MOA) with DEQ establishing a process by which the BLM and DEQ will help ensure compliance with State and Federal point and non-point source rules and regulations requirements on BLM lands. This agreement recognizes the BLM as the DMA on BLM-administered lands in Oregon. The agreement, which expired in 2007, was extended by mutual consent of the agencies until December 31, 2008. Pursuant to the MOA, as resources allow, BLM will coordinate with DEQ to develop WQRPs for BLM-administered lands and will revise or adapt WQRPs to be consistent with and applicable to the final TMDL and associated Water Quality Management Plan (WQMP) (the TMDL subbasin implementation strategy). The WQRP will be the TMDL implementation plan for BLM-administered lands. BLM will conduct management activities on BLM administered lands consistent with WQRPs and provide updates and reports on restoration progress according to DEQ's implementation schedule. Where necessary and appropriate, WQRPs propose a set of actions and timeline for achieving nonpoint source load allocations and meeting water quality standards. In the case of E. coli, research in other Oregon watersheds indicates that the management of federal forest lands does not typically contribute to elevated levels of E. coli that are the basis for the listings. Agricultural Lands Management Agency: Oregon Department of Agriculture The Rogue River Basin is managed under two Agricultural Water Quality Management Plans. Areas within Josephine and Jackson Counties are managed under the Inland Rogue Agricultural Water Quality Management Area Plan. Those areas downstream of the Josephine County border will operate under the conditions of the Curry Agricultural Water Quality Management8. The Inland Rogue Agricultural Water Quality Management Area Plan which applies to the Upper Rogue River Subbasin has been revised in 2008 and includes management actions to address sources of fecal bacteria. The purpose of this Area Plan is to identify strategies to reduce water pollution from agricultural lands through a combination of educational programs, suggested land treatments, management activities, and monitoring. ODA has enforcement authority for the prevention and control of water pollution from agricultural activities under administrative rules for Rogue River Basin and Oregon Administrative Rules (OAR) 603-090-0120 through 603-090-0180. If additional monitoring indicates that efforts to address fecal bacteria through the Inland Rogue WQMAP are not adequate, the plan may be required to change or undertake additional actions to address bacteria in surface waters. The criteria that apply to these areas are a log mean of 126 E. coli / 100 ml in 30 days and 406 E. coli / 100 ml daily maximum. Irrigation Districts Management Agency: Medford Irrigation District, Rogue River Valley Irrigation District, and Eagle Point Irrigation District. The irrigation districts will be required to develop implementation plans that include a description of operations and maintenance practices to limit bacterial inputs into the canals. Districts may contact users directly or in conjunction with Soil and Water Conservation Districts (SWCDs) to inform irrigation users on manure management and practices to keep fecal organisms out of the irrigation system and out of surface waters. Rural Residential and Urban Lands Management Agency: Jackson County and the Cities of Eagle Point, Shady Cove and Butte Falls. Jackson County and the Cities of Eagle Point, Shady Cove and Butte Falls will be required to submit a TMDL implementation plan within 18 months of TMDL completion as per OAR 340-042-0083(3) with detailed plans of how the jurisdictions will meet the TMDL. 8 Agricultural Water Quality Management Area Plan are located here: http://oregon.gov/ODA/NRD/water_agplans.shtml

Rogue River Basin TMDL: Bacteria December 2008
OREGON DEPARTMENT OF ENVIRONMENTAL QUALITY 3-80
State Lands Management Agency: Oregon Department of State Lands (DSL) and Oregon Parks and Recreation Department (PRD). DSL holds public owned lands in trust and manages these lands in the public's best interests. DSL administers the state’s removal-fill permits and is responsible for leasing range and agricultural land and waterways for a variety of business activities. Oregon Parks and Recreation Department is responsible for land stewardship, overseeing Oregon scenic waterways and several permit programs. As with other state agencies that have been identified as DMAs, DSL and PRD is required to submit an implementation plan but may work with DEQ to develop a statewide implementation plan. Plans must be submitted to DEQ within 18 months of the issuance of the TMDLs.
3.4.9 Future Sources OAR 340-042-0040(4)(k) Future permitted sources may discharge effluent containing fecal bacteria at concentrations in compliance with water quality criteria (log mean of 126 E. coli / 100 ml in 30 days and 406 E. coli / 100 ml daily maximum).

Rogue River Basin TMDL: Bacteria December 2008
OREGON DEPARTMENT OF ENVIRONMENTAL QUALITY 3-81
3.5 REFERENCES Burton, G.A. Jr., Gunnison, D. & Lanza, G.R. (1987). Survival of pathogenic bacteria in various
freshwater sediments, Applied and Environmental Microbiology, Vol. 53, No. 4, 663-638.
Byappanahalli, M, Fowler, M., Shively, D. & Whitman, R. (2003). Ubiquity and Persistence of Escherichia coli in a Midwestern Coastal Stream.
Cleland, B. 2002. TMDL development from the “bottom up” – Part II: using duration curves to connect
the pieces. America’s Clean Water Foundation. August 15, 2002. Cleland, B. 2002. TMDL development from the “bottom up” – Part III: duration curves and wet-weather
assessments. America’s Clean Water Foundation. Davies, C.M., Long, J.A.H., Donald, M. & Ashbolt, N.J. (1995). Survival of fecal microogranisms in
marine and freshwater sediments, Applied and Environmental Microbiology. Vol. 61, 1888-1896. Gerba, C.P. & McLeod, J.S. (1976). Effect of sediments on the survival of Escherichia coli in marine
waters, Applied and Environmental Microbiology, Vol. 32, No. 1, 114-120 Kincaid, H., (2001), Deer Creek Watershed Assessment and Action Plan, Umpqua Basin Watershed
Council, 1758 Northeast Airport Rd., Roseburg, Oregon.
LaLiberte P. & Grimes, D.J. (1982). Survival of Escherichia coli in lake bottom sediment, Applied and Environmental Microbiology, Vol. 43, No. 3, 623-628.
Le Fevre, N.M. & Lewis, G.D. (2003). The role of resuspension in Enterococci distribution in water at an
urban beach, Water Science and Technology, Vol. 47, No. 3, pp 205 – 210. beach, Water Science and Technology, Vol. 47, No. 3, 205-210.
MacDonald L.H., Smart A.W., & Wissmar R.C. (1991). Monitoring guidelines to evaluate the effects of
forestry activities on streams in the pacific northwest and Alaska. USEPA Region 10. EPA 910/9-91-001.
Martin, J. L., & McCutcheon,S.C. (1999), Hydrodynamics and Transport for Water Quality Modeling, CRC Press, Inc., Boca Raton, Florida.
National Land Cover Database, (2001). Available at http://www.mrlc.gov/ Neitsch, S.L., Arnold, J.R. Kiniry & Williams, J.R. (2001). Soil and Water Assessment Tool Theoretical
Documentation.
Obiri-Danso K., & Jones, K. (2000). Intertidal sediments as reservoirs for hippurate negative campylobacters, salmonellae and fecal indicators in three EU recognized bathing waters in northwest england, Water Research, Vol. 34, No. 2, 519-527.
Oregon State Service Center, (1998). Zoning for the State of Oregon. Oregon State Service Center for
GIS records. Oregon Department of Agriculture, (2004). Rogue Basin sub-basin Agricultural Water Quality
Management Area Plan. 2004 Revisions Developed by the Rogue Basin Local Advisory Committee and Oregon Department of Agriculture with assistance from Jackson Soil and Water Conservation District. November 30, 2004.
Oregon Department of Environmental Quality (2001). Tillamook Bay Watershed Total Maximum Daily

Rogue River Basin TMDL: Bacteria December 2008
OREGON DEPARTMENT OF ENVIRONMENTAL QUALITY 3-82
Load (TMDL) 2001. Available at www.deq.state.or.us Oregon Department of Environmental Quality (2003). North Coast Subbasins: Lower Columbia-
Youngs, Lower Columbia-Clatskanie, Necanicum, and Nehalem. August 20, 2003. Available at www.deq.state.or.us
Oregon Department of Environmental Quality (2005). Assessment Methodology for Oregon’s 2004
Integrated Report on Water Quality Status. DEQ Water Quality Division. August 12, 2005. Oregon Department of Environmental Quality (2006a). Umpqua Basin Total Maximum Daily Load and
Water Quality Management Plan. DEQ Water Quality Division. November 01, 2006. Available at www.deq.state.or.us
Oregon Department of Environmental Quality (2006b). Willamette Basin Total Maximum Daily Load
(TMDL). DEQ Water Quality Division. September 9. Available at www.deq.state.or.us Oregon Department of Environmental Quality (2007). Bear Creek Watershed Total Maximum Daily
Load (TMDL). October, 2007. Available at www.deq.state.or.us
Percy, K.L., Sutterlin, C., Bella, D.A., & Klingeman, P.C. (1974). Description and information sources for oregon estuaries. Sea Grant College Program, Oregon State University.
Rogue Valley Council of Governments (2005). Bacterial Source Tracking Pilot Study DNA Fingerprinting, Human Bacteroidetes ID and Human Enterococci ID. Rogue Valley Council of Governments, Natural Resources Department, 155 North First Street, Central Point, Oregon, June 2005
Sherer, B.M., Miner, J.A. Moore, J.A., & Buckhouse, J.C. (1988). Resuspending organisms from a
rangeland stream bottom, Transaction of the American Society of Agricultural Engineers, Vol. 31(4), 1217-1222.
Sherer, B.M., Miner, J.A. Moore, J.A. & Buckhouse, J.C. (1992). Indicator bacterial survival in stream
sediments, Journal of Environmental Quality, 21:591-595. Stephenson G.R. & R.C. Rychert (1982). Bottom sediment: a reservoir of escherichia coli in
rangeland streams, Journal of Range Management, 35(1), 119-123. Struck, P.H. (1988). The relationship between sediment and fecal coliform levels in a puget sound
estuary, Journal of Environmental Health, Vol. 50, No. 7, 403-407
U.S. Bureau of Reclamation (1995). Fish passage improvements, savage rapids dam, oregon. Planning
U.S. Environmental Protection Agency. (2001). Protocol for Developing Pathogen TMDLs, First
Edition, EPA 841-R-00-002. U.S. Environmental Protection Agency website: http://www.epa.gov/nps/ Whitman R.L & Nevers, M.B. (2003). Foreshore sand as a source of Escherichia coli in nearshore
water of a lake michigan beach, Applied and Environmental Microbiology, Vol. 69, No. 9, 5555-5562.Cortright, R., Weber, J., & Bailey, R. (1987), The Oregon Estuary Plan Book, Oregon DLCD, Salem, Oregon.
Winfield M. D., & Groisman, E.A. (2003). Role of nonhost environments in the lifestyles of Salmonella
and Escherichia coli, Applied and Environmental Microbiology. Vol. 69, No. 7, 3687-3694.