Chapter 3: Analytical Methods/Data Sources 3: Analytical Methods/Data Sources 3.1 Introduction This...
24
2020 Facilities Plan Conveyance Report Chapter 3: Analytical Methods/Data Sources 3.1 Introduction This chapter describes hydrologic and hydraulic models of the conveyance system and defines the range of application of each. This chapter also describes the data sources used to develop and calibrate the models. The Milwaukee Metropolitan Sewerage District (MMSD) conveyance system includes the metropolitan interceptor sewer (MIS) system, the near surface collector system (NSCS), and the inline storage system (ISS). This system transports wastewater from the municipal collector systems to the MMSD wastewater treatment plants (WWTP). The performance of the conveyance system was evaluated using analytical models for the following purposes: ♦ Determine the peak wastewater flows ♦ Identify hydraulic restrictions (bottlenecks) ♦ Estimate overflow frequencies and volumes for water quality ♦ Identify potential conveyance system improvements The conveyance system modeling has two main components: a sewershed flow model and a dynamic hydraulic model of the conveyance system. The sewershed flow model generates wastewater hydrographs for the sewersheds. The flow is the sum of the base sanitary flow and the infiltration and inflow (I/I) components. The sewershed flow model uses the Flow Forecasting System (FFS) program and is calibrated using measured data to define the generation rates of the residential, commercial, and industrial areas as well as the I/I response to groundwater and wet weather events. The dynamic hydraulic model of the conveyance system simulates the network of pipes, pumps, and storage units. The sewershed wastewater hydrographs are routed through the dynamic hydraulic model to the treatment plants. The model simulates the ISS operations as well as combined sewer overflow (CSO) and sanitary sewer overflow (SSO) discharges using the Model of Urban Sewers (MOUSE) software. The performance of the conveyance system is evaluated for current conditions in Chapter 4, Conveyance Assessment – 2000 Conditions, and for future conditions Chapter 5, Conveyance Assessment – Future 2020 Conditions. The current conditions are based on sewershed flows generated by the current (year 2000) population and land use conditions, and the existing (year 2000) physical configuration of the conveyance system. The future conditions are based on estimated 2020 Baseline population and land use conditions and a future configuration of the conveyance system incorporating “committed” projects such as the Northwest Side Relief Sewer and the North 27 th Street ISS extension. The modeling system is used to evaluate the performance of the conveyance system, supplementing the information based on measured data alone. The modeling results are used to: ♦ Determine flow at any location in the MIS (not just at meter sites) ♦ Fill in gaps in the measured data (due to instrument malfunction or range limitations) with simulated values 3-1
-
Upload
dangnguyet -
Category
Documents
-
view
219 -
download
0
Transcript of Chapter 3: Analytical Methods/Data Sources 3: Analytical Methods/Data Sources 3.1 Introduction This...

2020 Facilities Plan Conveyance Report
Chapter 3: Analytical Methods/Data Sources 3.1 Introduction This chapter describes hydrologic and hydraulic models of the conveyance system and defines the range of application of each. This chapter also describes the data sources used to develop and calibrate the models.
The Milwaukee Metropolitan Sewerage District (MMSD) conveyance system includes the metropolitan interceptor sewer (MIS) system, the near surface collector system (NSCS), and the inline storage system (ISS). This system transports wastewater from the municipal collector systems to the MMSD wastewater treatment plants (WWTP). The performance of the conveyance system was evaluated using analytical models for the following purposes:
♦ Determine the peak wastewater flows
♦ Identify hydraulic restrictions (bottlenecks)
♦ Estimate overflow frequencies and volumes for water quality
♦ Identify potential conveyance system improvements
The conveyance system modeling has two main components: a sewershed flow model and a dynamic hydraulic model of the conveyance system. The sewershed flow model generates wastewater hydrographs for the sewersheds. The flow is the sum of the base sanitary flow and the infiltration and inflow (I/I) components. The sewershed flow model uses the Flow Forecasting System (FFS) program and is calibrated using measured data to define the generation rates of the residential, commercial, and industrial areas as well as the I/I response to groundwater and wet weather events.
The dynamic hydraulic model of the conveyance system simulates the network of pipes, pumps, and storage units. The sewershed wastewater hydrographs are routed through the dynamic hydraulic model to the treatment plants. The model simulates the ISS operations as well as combined sewer overflow (CSO) and sanitary sewer overflow (SSO) discharges using the Model of Urban Sewers (MOUSE) software.
The performance of the conveyance system is evaluated for current conditions in Chapter 4, Conveyance Assessment – 2000 Conditions, and for future conditions Chapter 5, Conveyance Assessment – Future 2020 Conditions. The current conditions are based on sewershed flows generated by the current (year 2000) population and land use conditions, and the existing (year 2000) physical configuration of the conveyance system. The future conditions are based on estimated 2020 Baseline population and land use conditions and a future configuration of the conveyance system incorporating “committed” projects such as the Northwest Side Relief Sewer and the North 27th Street ISS extension.
The modeling system is used to evaluate the performance of the conveyance system, supplementing the information based on measured data alone. The modeling results are used to:
♦ Determine flow at any location in the MIS (not just at meter sites)
♦ Fill in gaps in the measured data (due to instrument malfunction or range limitations) with simulated values
3-1

2020 Facilities Plan Conveyance Report
♦ Simulate the response of the current system to historic wet weather events using the period of record: January 1940 through June 2004
♦ Estimate the response to future changes in population and land use
♦ Evaluate the benefits of future “committed” projects or alternative projects
♦ Generate SSO, CSO, and WWTP flows for water quality analysis of receiving waters
The modeling system is used to evaluate the overall system response, such as the frequency of tunnel-related overflows, and to evaluate the conveyance capacity of the MIS system to prevent conveyance related SSOs or to identify surcharging that may reach critical elevations where local sewers connect to the MIS system. The conveyance system does not include the hydraulics in the local sewer systems.
3.2 Approach The development of the sewershed flow model and the hydraulic conveyance model was guided by the Comprehensive Modeling Strategy and Real Time Control Strategies, Technical Memorandum 2.3 – Modeling Strategy Recommendations (1); and the Comprehensive Modeling Strategy and Real Time Control Strategies, Technical Memorandum 2.4 – Modeling Strategy Implementation Plan.(2) Both documents define the goals and objectives of the modeling system.
3.2.1 Modeling Objectives Various modeling tools are needed to address a wide variety of modeling objectives. These objectives require different levels of detail and the ability to model the system performance over a wide range of time periods. The modeling objectives - in terms of the spatial detail and the time scales of interest - are summarized in Table 3-1.
3.2.2 Methods and Modeling Tools The two main types of models are the sewershed flow generation models and the conveyance system hydraulic models.
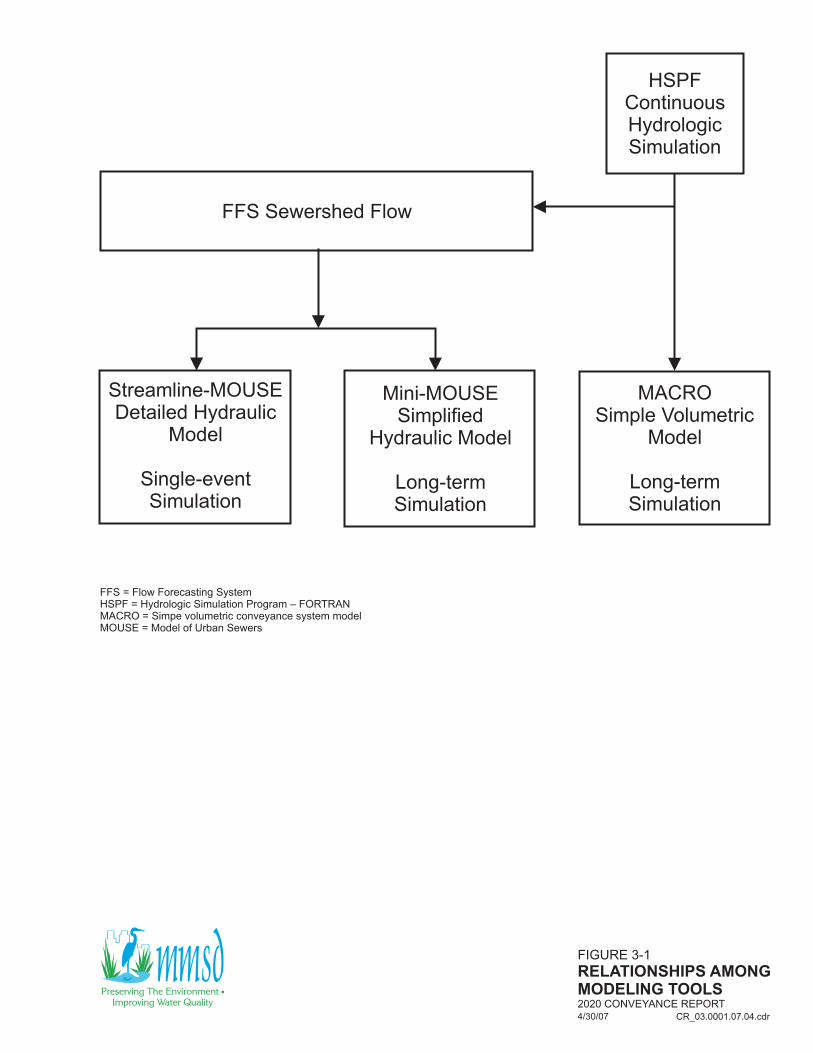
The conveyance system hydraulics are modeled with three programs: Streamline-MOUSE, Mini-MOUSE, and MACRO. These programs have various levels of spatial detail. The input sewershed flows for the Streamline-MOUSE and Mini-MOUSE models are generated by the FFS program. The MACRO model is a simple volumetric model. Figure 3-1 depicts the relationships among the modeling tools. This section is an overview of the modeling tools; each individual tool is described in greater detail in the next section.
Sewershed Wastewater Flow Model – Flow Forecasting System The sewershed flow model, called FFS, generates the base sanitary flow of each sewershed. The program also computes the I/I components and adds these to the base sanitary flow to create sewershed wastewater hydrographs. The base sanitary flow is made up of flow from residential, commercial, and industrial sources.
3-2

TABLE 3-1
MODELING OBJECTIVES2020 CONVEYANCE REPORT
CR_03.T001.07.05.31cdr5/31/07
HSPF
Continuous
Hydrologic
Simulation
FFS Sewershed Flow
Streamline-MOUSE
Detailed Hydraulic
Model
Simulation
Single-event
Mini-MOUSE
Simplified
Hydraulic Model
Long-term
Simulation
MACRO
Simple Volumetric
Model
Long-term
Simulation
FFS = Flow Forecasting System
HSPF = Hydrologic Simulation Program – FORTRAN
MACRO = Simpe volumetric conveyance system model
MOUSE = Model of Urban Sewers
FIGURE 3-1
RELATIONSHIPS AMONGMODELING TOOLS2020 CONVEYANCE REPORT
CR_03.0001.07.04.cdr4/30/07

2020 Facilities Plan Conveyance Report
To compute the I/I components, the FFS program uses the continuous hydrologic results of the Hydrologic Simulation Program – FORTRAN (HSPF). Rain gauge measurements and other meteorological data are inputs for the HSPF program, which converts the rainfall and meteorological inputs into runoff, infiltration, and groundwater responses. The FFS model applies calibration parameters to the HSPF results to compute the I/I response of each sewershed.
The resulting sewershed flow hydrographs from FFS are the sums of the base sanitary flows and the I/I components; these hydrographs are used as inputs for the hydraulic models.
Streamline-MOUSE Streamline-MOUSE is a highly detailed hydraulic model of flow and water level within the conveyance system that is used to simulate individual events. The term “Streamline” distinguishes this model from a more detailed “Comprehensive” model, which was not used by the 2020 technical team. The Streamline-MOUSE model is a full representation of the MIS, NSCS, and ISS. The model does not include every manhole, and some pipe segments have been combined to improve computational efficiency; however, the level of detail is appropriate for this analysis given the modeling objectives of the 2020 Facilities Plan. Streamline-MOUSE was used to identify hydraulic restrictions and specific manholes with critical elevations exceeded.
The Streamline-MOUSE model is simply referred to as the MOUSE model in most of the Facilities Plan Report. It is only called the Streamline-MOUSE model in this chapter to distinguish it from other models used by MMSD that are based on the MOUSE modeling software.
Mini-MOUSE Mini-MOUSE is a simplified version of the Streamline-MOUSE model that predicts discharge rates and volumes. Due to the faster simulation speed of this model, it can be used to simulate and output CSO and SSO hydrographs over long periods of time (such as years and decades). This model was used in the early development of the project, but was not used in later refinements. That is why the remaining chapters in the Facilities Plan Report do not refer to the Mini-MOUSE model and further reference to the MOUSE model mean the Streamline-MOUSE model without confusion with the Mini-MOUSE model. Mini-MOUSE is only discussed here for completeness.
MACRO MACRO is a simple, volumetric model used to simulate the overall response of the system. MACRO does not use the detailed definition of each sewershed; rather, it represents the overall system as two separate sewer units and two combined sewer units. Subsystems 1 through 4 are represented as one unit in the separate sewer service area, and subsystems 5 and 6 are a second unit. The combined sewer service area is also represented with two units; one for the high-level system and another for the low-level system. The model is used for long-term simulations that span the full period of record. It is also used to evaluate the overall system response to alternative operational strategies or improvements to the storage and treatment facilities. MACRO does not compute specific results at manholes or overflow locations.
For a detailed investigation of specific MIS pipes and individual events, Streamline-MOUSE is used. For the overall system performance during a long time period, such as the full period of record, the MACRO model is used.
3-5

2020 Facilities Plan Conveyance Report
3.3 Modeling Tools
3.3.1 Sewershed Wastewater Flow Model – Flow Forecasting System The FFS program is a refinement of MMSD’s Wet Weather Flow (WWF) model as outlined in the Modeling Strategy Implementation Plan.(3) The FFS program computes wastewater hydrographs for the sewersheds. In the sanitary sewer service area, the wastewater flow includes the base sanitary flow and the I/I. In the combined sewer service area, the wastewater flow includes the base sanitary flow, the dry weather infiltration, and the wet weather surface runoff that enters the combined sewers.
The base sanitary flow from residential, commercial, and industrial areas is computed for each sewershed based on calibrated generation rates. Periodic variations in the base sanitary flow are computed from diurnal and weekly flow variation patterns.
The I/I components depend on the hydrologic conditions, which change seasonally and in response to wet weather events. The general hydrologic environment in which the conveyance system is located is modeled on a continuous basis with HSPF, which converts the rainfall and meteorological inputs into runoff, interflow, and groundwater responses.
The HSPF program uses rainfall data from multiple gauges along with other meteorological data (temperature, potential evapotranspiration, dew point temperature, wind movement, and solar radiation) to simulate the wet and dry weather hydrology and soil-water conditions on a continuous basis. The output represents the surface runoff from pervious and impervious land surfaces, interflow in the unsaturated soil above the water table, and active groundwater flow. The program also models the dynamics of snowmelt.
Antecedent moisture conditions and seasonal effects influence the simulated hydrologic response in HSPF because it is a continuous hydrologic model. This hydrologic response, however, is not specific to any particular sewershed; rather, it characterizes the general hydrologic environment in which the conveyance system exists. Specific sewershed hydrographs of wastewater flow are computed in the FFS program using the HSPF simulations as input. The output of the FFS program is formatted for subsequent input into the MOUSE hydraulic models.
Further details about how sewershed flows are computed in FFS are discussed in Section 3.5, Flow Development – Current Wastewater Flows. The calibration of the FFS model is discussed in Section 3.6, Flow Model Calibration and Hydraulic Model Validation.
3.3.2 Streamline-MOUSE: Detailed Hydraulic Model of the Metropolitan Interceptor Sewer, Near Surface Collector Sewer, and Inline Storage System The MOUSE software is a dynamic hydraulic modeling program developed by DHI Water & Environment (formerly Danish Hydraulic Institute). The MMSD conveyance system (MIS, NSCS, and ISS) is modeled with the MOUSE program as a network of links, nodes, and storage elements. An algorithm that is based on the MMSD operating procedures controls the simulated operations of the ISS gates and pumps.
The “Streamline-MOUSE” model is a highly detailed representation of the conveyance system. Some pipe segments were combined to reduce the overall number of modeling elements and eliminate unnecessary manholes. The ISS was modeled as a single storage node and the drop shafts were modeled with ideal pumps to transfer the water to the ISS node. These features improve the computational efficiency of the model. The sewershed hydrographs (from FFS) are
3-6

2020 Facilities Plan Conveyance Report
loaded into the model as upstream boundary conditions while the WWTPs are represented as downstream boundary conditions. Streamline-MOUSE models both flows and water levels throughout the MIS; the results are used to identify hydraulic restrictions and locations where critical elevations are exceeded. The model is also used to simulate SSO and CSO discharges at specific overflow sites. In particular, the Streamline-MOUSE model is used to generate hydrographs of the SSO and CSO discharge for the watercourse and water quality modeling efforts of the 2020 Facilities Plan.
Streamline-MOUSE is a highly detailed model, so it is only used to simulate individual events. For example, the simulation of an eight-day period takes approximately 16 hours to run. Therefore, this model is used for detailed analysis of the system during a few selected events. For long-term simulations, the MACRO model is used because the computational effort of the Streamline-MOUSE model is too great.
3.3.3 Mini-MOUSE: Simplified Hydraulic Model of the Metropolitan Interceptor Sewer, Near Surface Collector Sewer, and Inline Storage System Mini-MOUSE is a simplified version of the Streamline-MOUSE model.(4) Both models use the MOUSE software by DHI. Mini-MOUSE represents the conveyance system with approximately 200 nodes and links, while the Streamline-MOUSE model uses approximately 2,000 nodes and links. Both models use the same sewershed inflows generated by FFS (688 inflow hydrographs), but in Mini-MOUSE the hydrographs are consolidated into 56 inflow hydrographs.
These simplifications improve the computational efficiency so that multiple simulation events, spanning all of the significant wet weather events during the full period of record, can be simulated. The model was calibrated against the Streamline-MOUSE results; consequently, it is a tool that is one more step removed from the measured data. The modeling objective is to have a simplified alternative to the Streamline-MOUSE model that generates consistent results and can be used to evaluate the long-term performance and flow frequency characteristics of the system. The Mini-MOUSE model was used in the early development of the project, but use was discontinued during later refinements. The main objective of the Mini-MOUSE model was to generate SSO and CSO hydrographs for water quality modeling. During model refinement, the 2020 technical team decided that the Streamline-MOUSE model would be used instead because this model produces a more accurate representation of the overflow hydrographs.
3.3.4 MACRO: Simple Volumetric/Operational Model of the Metropolitan Interceptor Sewer, Near Surface Collector Sewer, and Inline Storage System MACRO is a simple volumetric/operational model used to evaluate the overall response of the conveyance system.(5) The MACRO model represents the service area with four subareas (two SSO areas and two CSO areas). The subarea flows are directed to the WWTPs or the ISS using a water balance approach whereby the excess flow becomes CSO and SSO discharges.
Using an hourly time step to continuously simulate the 64.5-year period of record, the entire simulation takes less than five minutes of computation time. This model is used to quickly evaluate alternative system operations or new configurations. The MACRO model computes the number of SSO and CSO events (not just the volume of overflow) that are used to estimate the frequency of overflow events.
The MACRO model is limited in that it only represents the MIS as a volume through which the flow is transferred and does not model the dynamic timing of hydraulic routing through the MIS
3-7

2020 Facilities Plan Conveyance Report
system. Flow in MACRO is based on the treatment capacities of the WWTPs; the storage capacities of the MIS, NSCS, and ISS; and the pumping capacities. Consequently, the MACRO model can only identify SSO events that are related to tunnel closure. MACRO cannot identify SSOs related to conveyance limitations. Some SSO events are not tunnel related; these are conveyance-related SSOs, which are relatively small in terms of volume. All of the large-volume SSO events are tunnel related.
3.4 Data Compilation The MMSD conveyance system models use sewersheds as the fundamental modeling unit. The entire MMSD service area is represented by 689 sewersheds in the current configuration (693 sewersheds in the future configuration) that generate wastewater and seven sewersheds in the current configuration that generate only stormwater (five sewersheds in the future configuration). Each sewershed is a unit with parameters that apply to the entire sewershed area (for example, the distribution of population within the sewershed is not specified, only the total population). No further details are available about smaller sub-sections of a sewershed.
3.4.1 Separate Sewer Service Area Sewershed Delineation Sewersheds in the separate sewer service area are based on the Sewer System Evaluation Survey (SSES) basins that originally were defined as part of the Milwaukee Water Pollution Abatement Program (MWPAP). In the MWPAP Facility Plan, a basin is a sub-unit of the service area used to model wastewater flow. These basins, with some minor adjustments, were used for the 2010 Facilities Plan and all related projects prior to the start of the 2020 facilities planning effort. Over time, municipal and MMSD relief and interceptor sewers have been constructed, pump stations have been added and others removed, and sewers have been added and abandoned. These changes modify the direction of flows within the system. As a result, some of the SSES basins no longer define tributary areas properly. Sewersheds were delineated by the 2020 technical team and reviewed by the local municipalities and the Southeastern Wisconsin Regional Planning Commission (SEWRPC). Sewershed boundaries do not cross-municipal boundaries, meter basin boundaries, or sub-systems. The new areas are called “sewersheds” to avoid confusion with the “basins” used in previous studies. In the current configuration, there are 528 separate sewer service area sewersheds in the MMSD service area (533 sewersheds in the future configuration).
Appendix 3A, Sewer Modifications – Separate Sewer Service Area provides a summary of modifications that the 2020 technical team made to the SSES basins to develop these sewersheds. If an original SSES basin was deleted, the identifier was not reused. Sewersheds were given new identifiers as part of the 2020 Facilities Plan to alert users that the SSES basins have been modified. These identifiers include the community abbreviation, the MIS subsystem number in which the sewershed resides, and a unique three digit numerical identifier. For example, the identifier for SSES basin SF3 in St. Francis (SF = St. Francis) is now called sewershed SF1003 because it is located in Subsystem 1.
3.4.2 Combined Sewer Service Area Sewershed Delineation Appendix 3B, Sewer Modifications – Combined Sewer Service Area provides a summary of the sewersheds in the combined sewer service area. Most of the basins developed for the Central MIS project have been maintained; any modifications are identified in Appendix 3B. Combined
3-8

2020 Facilities Plan Conveyance Report
sewer service area sewersheds are identified with a CS for “combined sewer,” followed by the MIS subsystem in which the sewershed resides, the intercepting structure number to which the sewershed is tributary, and a unique, sequential numerical identifier. For example, the 2020 Facilities Plan identifier for the Central MIS project basin IS135, which is in Subsystem 5, becomes CS5135#1. In many cases, more than one sewershed is tributary to the same intercepting structure (IS). For example, the two sewersheds tributary to IS200A are named CS5200A1 and CS5200A2. Multiple sewersheds that flow to a single IS are numbered sequentially with the lowest number being the sewershed closest to the IS. The number symbol in the first example is a placeholder so that the identifiers for all the combined area sewersheds are eight digits long. In the current configuration, there are 161 sewersheds in the combined sewer service area (160 sewersheds in the future configuration).
Areas within the combined sewer service area boundary that are not sewered but contribute stormwater to a water body are identified as CSSW sewersheds. The naming logic is as follows: CS for “combined sewer” and SW for “stormwater,” such as CSSW004. Although these sewersheds do not generate any sewer flow, these areas were given a 2020 Facilities Plan sewershed identifier to support the watercourse modeling efforts. There are seven CSSW sewersheds in the current configuration (five in the future configuration).
3.4.3 Partially Separated Sewershed Delineation Two sewersheds, MI5300 and SH5009 (future conditions), are considered partially separated. These sewersheds have storm sewers, but most of the homes in these sewersheds have downspouts and foundation drains that are still connected to the combined sewer. The 2020 technical team modeled these sewersheds as separate sewer sewersheds with higher than average I/I rates.
3.4.4 Population Current population values for each sewershed, based on the year 2000 U.S. Census, were supplied by SEWRPC. Year 2020 baseline population estimates were also determined by SEWRPC using input from the municipalities. This data is documented in a memorandum from SEWRPC to the MMSD, dated Sept. 29, 2004.(6) This data is also contained in Appendix 5B of the Facilities Plan Report.
3.4.5 Land Use Land use information was defined by SEWRPC (in cooperation with local communities) for the conditions in years 2000 and 2020. The land use information was used to determine the base sanitary flow from commercial and industrial areas as well as the impervious area of sewersheds in the combined sewer service area.
3.4.6 Major Wastewater Users Major wastewater users were added as point source flows in the model. Major wastewater users include all institutional and commercial point sources greater than 100,000 gallons per day (gpd) and all industrial sources greater than 250,000 gpd. In addition, the Milwaukee County Zoo, the Franklin Landfill, and Chr. Hansen, Inc., (Chris Hanson Lab) in West Allis were included as point sources because these flows are a major portion of the total flow in those sewersheds. Point source flows were defined by an average flow rate and weekly and diurnal (24-hour) patterns.
3-9

2020 Facilities Plan Conveyance Report
3.4.7 Existing Flow Data
The MMSD provided hourly level and flow data obtained from 191 permanent flow meters for the calibration/validation period (1998 through 2001). In addition, flows from each of the wastewater treatment plants, flows from pumping stations, and levels in diversion chambers and bypass stations were used to validate the calibration.
Many of the flow meters are “level only” sensors that record the depth of flow in the MIS. Using a rating curve, which assumes free-flowing conditions, the level data are converted to flow data. Under normal flow conditions this approach produces useful flow data, but there are significant limitations when the MIS is surcharged or subject to backwater conditions. When the MIS is surcharged, the measured flow data are no longer valid because the rating curves are not valid (and in many cases the water level sensors are out of range when surcharged). When the flow in the MIS is influenced by backwater conditions, the level measurements are useful but the flow data derived from the rating curves are not valid.
Area-velocity meters can measure the flow and water level for surcharged and backwater conditions, so the data from area-velocity meters are the most reliable measurements. Only a few of the meter sites use area-velocity meters; the majority of the sites use level-only sensors.
Flows at bypass stations are estimated from hydraulic calculations based on monitoring data taken by a variety of sensors. Due to the intermittent nature of bypass events, these flows are difficult to estimate. In general, the estimated bypass flows provide an indication of the presence or absence of an overflow event and a rough estimate of magnitude.
3.4.8 Meteorological Data Precipitation data for nine MMSD and city of Milwaukee weather stations from 1998 through June 2004 were used in the analysis for the 2020 Facilities Plan. Other rain gauges exist but were not used because the data are not reliable for the period of time being investigated.(7) The data are for five-minute and hourly time intervals. In addition to precipitation data, SEWRPC provided the following meteorological data for General Mitchell International Airport from 1998 through June 2004:
♦ Solar radiation
♦ Evapotranspiration
♦ Wind speed
♦ Dewpoint
♦ Temperature
3.4.9 Milwaukee Metropolitan Sewerage District Conveyance System Facilities Data Geographic Information System (GIS) coverages of the MMSD conveyance system facilities were created to help generate the input for the flow model and the hydraulic models. (A GIS coverage is a set information in the GIS system; examples are given below.) Model results are also linked with the GIS features. The facilities planning team created coverages of the following facilities and features:
♦ Bypass structures
♦ Diversion chambers
3-10

2020 Facilities Plan Conveyance Report
♦ Drop shafts
♦ Flow meters (monitoring sites)
♦ In-line storage system
♦ Intercepting structures
♦ Meter basins
♦ Metropolitan interceptor sewer
♦ Near surface collector sewer
♦ Overflow locations (WPDES sites without a bypass structure designation)
♦ Pump stations
♦ Rain gauges (weather monitoring stations)
♦ Sewersheds
Wastewater treatment plants ♦
3.5 Flow Development – Current Wastewater Flows Separate area sewershed flows are the sum of the base sanitary flow and the infiltration/inflow sources. In the combined sewer service area, wastewater flow includes the base sanitary flow, dry weather infiltration, and wet weather surface runoff. The base sanitary flow has four components: residential, commercial, industrial, and point source flows. The infiltration and inflow also has four components (two dry weather and two wet weather components). Dry weather infiltration in the combined sewer service area has two components: constant infiltration and active groundwater infiltration, the same dry weather components as in the separate area. Wet weather runoff in the combined sewer service area is determined by the HSPF surface runoff components and the percent impervious area within the combined sewer sewershed.
Key calibration parameters are listed in Table 3-2. Some parameters define the base sanitary flow and others define the infiltration and inflow. The wet weather flow components are modeled differently depending on whether a sewershed is in the sanitary sewer service arethe combined sewer service area. For example, the parameter that defines the percent impervious area only applies to sewersheds in the combined sewer service area.
a or
3-11

Base Sanitary Flow Components
Flow ComponentCalibrationParameter Units Related To Notes
Residential BSFPopulation
Generation Rategpcd Population
Diurnal and weekly
pattern defined
Commercial BSFCommercial
Generation Rategpad
Commercial
Area
Diurnal and weekly
pattern defined
Industrial BSFIndustrial
Generation Rategpad Industrial Area
Diurnal and weekly
pattern defined
Point source gpd As needed
Infiltration and Inflow Components
Hydrologic ProcessCalibrationParameter Units Related To HSPF Dataset
Constant infiltration I cfs / acreSewershed
area
Active groundwater X cfs / acre / inSewershed
areaPAGWO
Interflow – RDII
Separate sewer service areaIF cfs / acre / in
Sewershed
areaPIFWO
Surface runoff – RDII
Separate sewer service areaPF cfs / acre / in
Sewershed
areaPSURO
Surface runoff –
Combined sewer service areaPercent Impervious
Sewershed
areaISURO, PSURO
Other Sewershed Characteristics
Area Sewershed area (acres)
Rain gauge assignmentIdentifies the HSPF dataset associated with a rain gauge that is in proximity
to the sewershed
Percent seweredDefines the percentage of the population that is served by a public sewer
system (others assumed to have on-site wastewater systems)
Meter basin Identifies the nearest downstream flow meter
TABLE 3-2
SEWERSHED WASTEWATERFLOW PARAMETERS IN FFS2020 CONVEYANCE REPORT
CR_03.T002.07.04.30.cdr4/30/07

2020 Facilities Plan Conveyance Report
3.5.1 Current Base Sanitary Flow
Current flows computed in FFS are the sum of the base sanitary flow and the infiltration/inflow components. The base sanitary flow has four components: residential flow, commercial flow, industrial flow, and point source flow.
Base sanitary flow is the sum of the four following components:
BSFcurrent = Qres + Qcom + Qind + Qpt
The four components are described below.
Residential Flow Residential flow is based on the current population and a generation rate, which is a calibration parameter. If the sewershed is not fully sewered, the flow rate is reduced by the “percent sewered” parameter that represents the percent of the population in the sewershed that is served by a public sewer system. The residential flow is further defined with flow patterns for diurnal and weekly variation.
Qres = (Population)(Population generation rate)(Current %Sewered)
Commercial Flow Commercial flow is based on the area within the sewershed that has a commercial land use classification. The commercial generation rate is defined per unit area and is a calibration parameter. The commercial flow is further defined with diurnal and weekly flow patterns.
Qcom = (Commercial Area)(Commercial generation rate)
Industrial Flow
Industrial flow is based on the area within the sewershed that has an industrial land use classification. The industrial generation rate is a calibration parameter. The industrial flow is further defined with diurnal and weekly flow patterns.
Qind = (Industrial Area)(Industrial generation rate)
Major commercial and industrial users are modeled as point sources. All other commercial and industrial users are modeled with a generation rate applied to the area within each sewershed that has commercial or industrial land use designations.
Point Source Flow If there is a point source, it is added to the other components of the base sanitary flow. This is also defined with diurnal and weekly flow patterns. The definition of point source flows was given in Section 3.4.6, Major Wastewater Users.
Qpt = specific values
3.5.2 Current Infiltration and Inflow Infiltration and inflow are divided into four components: Constant infiltration, active groundwater infiltration, rainfall derived inflow and infiltration (RDII) that responds to interflow, and RDII that responds to surface runoff. The first two components are active during dry weather periods, and all four components contribute flow during wet weather. In the equations below, the term “AREA” is the sewershed area.
3-13

2020 Facilities Plan Conveyance Report
The four components are described below.
Current Dry Weather Infiltration Dry weather infiltration is composed of a constant component and an active groundwater component. The constant infiltration is present at all times and is described by the parameter I, which is the constant infiltration rate per acre (expressed as cubic feet per second per acre or cfs/acre). The active groundwater infiltration is a seasonal component that responds to the active groundwater component in the HSPF simulation (“PAGWO” in the equations below). The active groundwater parameter is X. The dry weather infiltration parameters apply to sewersheds in both the separate and combined sewer service areas.
Constant infiltration: QI = (I)(AREA)(Current %Sewered)
Active Groundwater infiltration: QX = (X)(PAGWO)(AREA)(Current %Sewered)
Current Wet Weather Flow - Sanitary Sewer Service Area
The wet weather flow components are modeled in different ways in the separate and combined sewer service areas. In the sanitary sewer service area, the RDII has two components. In the combined sewer service area, the wet weather flow is caused by surface runoff.
In the sanitary sewer service area there are two components of RDII: interflow RDII and surface runoff RDII. The surface runoff RDII has a very rapid response to the precipitation and produces high peaks of a short duration. The interflow-related RDII has a slower response but a longer persistence and it influences the receding limb of the flow hydrograph.
Interflow RDII responds to the HSPF pervious surface interflow component (“PIFWO” in the equations below). The calibration parameter in FFS is called IF.
QIF = (IF)(PIFWO)(AREA)(Current %Sewered)
Surface runoff RDII responds to the HSPF pervious surface runoff component (“PSURO” in the equations below). The calibration parameter in FFS is called PF.
QPF = (PF)(PSURO)(AREA)(Current %Sewered)
The separate sewershed flow due to wet weather is the sum of the two components. Qwet = QIF + QPF
Current Wet Weather Flow - Combined Sewer Service Area In the combined sewer service area, the IF and PF parameters are not used. Rather, the flow is determined by the HSPF surface runoff components and the percent of the sewershed area with impervious area. HSPF has two surface runoff components, one for the impervious area (“ISURO” in the equation below) and one for the pervious surface area (“PSURO” in the equation below).
Qwet = (% Impervious)(ISURO)(AREA) + (1 - %Impervious)(PSURO)(AREA)
3-14

2020 Facilities Plan Conveyance Report
Current Total Flow
The total current separate or combined sewershed flow is the sum of the base sanitary flow, the dry weather infiltration, and the wet weather components, with the distinction between separate and combined sewer service area flow calculation differentiated by the calculation of Qwet as described above.
Qcurrent = BSFcurrent + QI + QX + Qwet
The procedure for calibration and validation of the model using the current flows is discussed in the next section. The method of calculating the future flow additions is discussed in Section 3.7, Flow Development – Future Wastewater Flows.
3.6 Flow Model Calibration and Hydraulic Model Validation
3.6.1 Overview of the Calibration Process The calibration/validation process and results are briefly summarized in this section. Detailed documentation of the model calibration and validation is presented in Appendix 3A, Conveyance System Model Calibration/Validation. The model was calibrated for a wide range of flow conditions. The validation results demonstrate that the model is capable of describing the flows and water levels for events of various magnitudes, as well as for dry weather conditions.
The calibration/validation process involves steps in all of the models from HSPF to MOUSE, but the calibration of the sewershed flow parameters in the FFS program is the dominant calibration activity.
In the FFS program, sewershed parameters are chosen to calibrate dry and wet weather flows to measured values. The validation takes place in the MOUSE program after the flows are routed. Therefore, the calibration is focused on the FFS parameters and the validation is focused on the MOUSE results.
The calibration and validation events were selected from 1998 through 2001. The primary calibration and validation events are listed in Table 3-3. Each event is described by season, size, and antecedent conditions. Other events not on the list are used as needed due to deficiencies in the measured data.
3.6.2 Summary of Validation Results The MOUSE validation simulations include one dry weather period and six wet weather events. The wet weather events include:
♦ Spring, summer, autumn, and winter seasons (including snow melt)
♦ Small, medium, and large storms
♦ Wet and dry antecedent conditions
Event volumes were evaluated at the wastewater treatment plants, the harbor siphons, and for the entire system. The validation objective is for volumes to be within 30% of measured values. The simulated volumes are typically within 25% of the measured values. These validation objectives were defined in references (1) and (2).
3-15

Calibration Events Used in FFS
Event Season Size Antecedent Conditions
Dry Weather Periods
October 1998 Fall Dry weather Dry
December 1999 Winter Dry weather Dry
February 2000 Winter Dry weather Dry
Wet Weather Events
November 1998 Fall Small Dry
January 1999 Winter Medium Snowmelt event
April 1999 Spring Large Wet
September 1999 Fall Medium Dry
April 2000 Spring Medium Dry
February 2001 Winter Small Wet
June 2001 Summer Medium Wet
Validation Events Used in MOUSE
Event Season Size Antecedent Conditions
Dry Weather Period
October 2000 Fall Dry weather Dry
Wet Weather Events
October 1998 Fall Small Dry
January 1999 WinterMedium
Snowmelt event
April 1999 SpringLarge Wet
September 1999 Fall Medium Dry
July 2000 Summer
Flashy, short duration
Large CSOs
Small SSOs
Wet
June 2001 Summer Medium Wet
TABLE 3-3
CALIBRATION ANDVALIDATION EVENTS2020 CONVEYANCE REPORT
4/30/07 CR_03.T003.07.04.30.cdr

2020 Facilities Plan Conveyance Report
Peak flow rates were also evaluated at key locations. The validation objective is for peak flow rates to be within 35% of measured values. The simulated peak flow rates are typically within 25% of the measured values. A more detailed discussion of the calibration and validation process and the results are presented in Appendix 3A, Conveyance System Model Calibration/Validation.
The CSO and SSO volumes are a secondary form of validation. There is significant uncertainty in the estimated overflow volumes derived from MMSD monitoring data and hydraulic calculations. Due to the uncertainty in the estimated overflow volume, the simulated overflow volumes are compared to the estimated volumes on a qualitative basis only. The CSO volumes are typically within 15% of the estimated values, except for the April 1999 event in which the simulated CSO volume was about half of the estimated value. The model simulates SSO discharges that are in qualitative agreement with estimated SSOs. When the tunnel remains open, SSOs are small or non-existent.
3.7 Flow Development – Future Wastewater Flows
3.7.1 Modeling Assumptions for Future Flow Additions The calibrated current flows are the foundation of the future flows. The total future flows are the sum of the current flows and future flow additions. Point source flows are also updated to the future conditions.
Population within many sewersheds is predicted to increase in the future. Likewise, commercial and industrial areas are predicted to increase in the future. In a few sewersheds, the future population and commercial/industrial areas provided by SEWRPC show decreases from the current values. In sewersheds where values have decreased, the current values are used for modeling. While this assumption may over-predict the base sanitary flow in a few sewersheds, it is a reasonable assumption for infiltration and inflow because even if the population decreases in the future, much of the existing infrastructure will remain and continue to be a source of I/I. Thus, the future flows are equal to the current flows plus any additional flow components due to future growth.
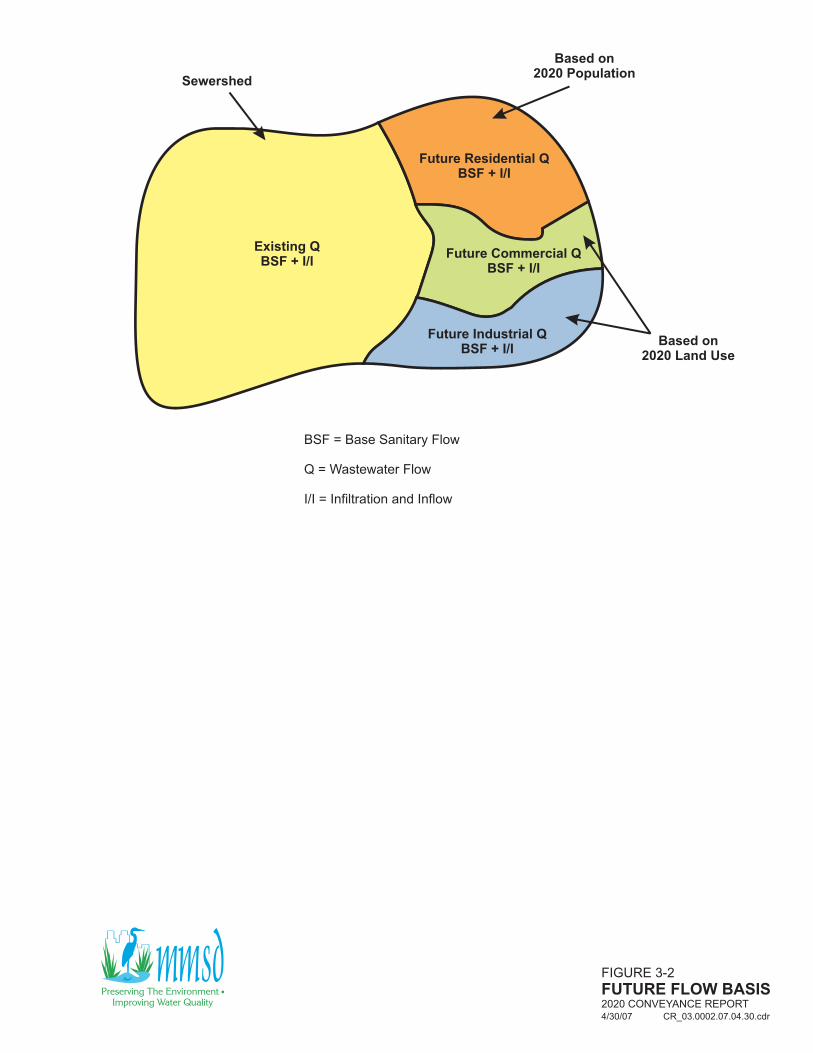
Figure 3-2 is a conceptual image of the future flow computation. The future sewershed flows are the sum of the current flows plus additional contributions due to residential, commercial, and industrial growth. Just as the current flows have sanitary and I/I components, so do the future flow additions.
3.7.2 Uniform Future Flow Generation Rates and Infiltration and Inflow Parameters Though sewershed calibration parameters are unique for each sewershed in the current condition, the future condition uses uniform values for the generation rates and the I/I parameters for all sewersheds. The parameters listed in Table 3-4 are assigned uniformly to the incremental growth in each sewershed.
The generation rate for future population growth is 68 gallons per capita per day (gpcd) and is applied uniformly to the additional population growth in each sewershed. This generation rate was used for MMSD’s User Charge System (operations and maintenance cost billing system) for the years 1991through 2002, based on water use records.
3-17
BSF = Base Sanitary Flow
Q = Wastewater Flow
I/I = Infiltration and Inflow
Sewershed
Existing QBSF + I/I
Based on2020 Population
Future Residential QBSF + I/I
Future Commercial QBSF + I/I
Future Industrial QBSF + I/I
Based on2020 Land Use
FIGURE 3-2
FUTURE FLOW BASIS2020 CONVEYANCE REPORT
CR_03.0002.07.04.30.cdr4/30/07

Base Sanitary Flow Additions
ParameterFutureValue
Units Related to Notes
Population generation rate 68 gpcd Population growth
Commercial generation rate 1500 gpad Commercial area growth
Industrial generation rate 1000 gpad Industrial area growth
Infiltration and Inflow Additions
ParameterFutureValue
Units Related to Notes
Constant infiltration, I 0.0003 cfs / acre Effective area of growth
Active groundwater, X 0.3 cfs / acre / inch Effective area of growth HSPF: PAGWO
Interflow, IF 0.15 cfs / acre / inch Effective area of growth HSPF: PIFWO
Surface runoff, PF 0 cfs / acre / inch Effective area of growth HSPF: PSURO
TABLE 3-4
UNIFORM FUTURE FLOWPARAMETERS FOR FFS2020 CONVEYANCE REPORT
CR_03.T004.07.04.30.cdr4/30/07

2020 Facilities Plan Conveyance Report
The generation rates for future commercial and industrial growth are 1,500 and 1,000 gallons per acre per day (gpad), respectively. These rates were calculated for the User Charge System and are representative of most commercial and industrial areas in the separate sewer service area.
The uniform future I/I parameter values were chosen to represent system performance that can be achieved by conventional materials and construction techniques. Using these parameters, the I/I is better than average and is commonly achieved by many current sewersheds; the same achievement should be a realistic goal for future developments.
High peak flows are due to inflow sources. In the model, high peak flows are associated with a high PF value. There should be few inflow sources due to surface runoff in the new growth areas. Consequently, the uniform future value of surface runoff (PF) is zero (this means that the remaining inflow sources can be accounted for in the IF parameter).
The I/I performance of the current (year 2000) system was reviewed as the basis for the future parameter choices. To guide the selection of the uniform future I/I parameters, a subgroup of newer sewersheds was identified. The nine sewersheds in this subgroup have a significant amount of new construction (at least 60% of the housing units) and have PF = 0. For this subgroup, the area weighted average I/I parameters were I = 0.00226, X = 0.291, and IF = 0.135, where I represents constant infiltration, X represents active groundwater, and IF represents interflow.
The uniform future I/I parameters values are similar to the area weighted average values of the subgroup of newer sewersheds. The uniform parameters are rounded values and were chosen to be: I = 0.003, X = 0.3, IF = 0.15, and PF = 0.
The uniform future I/I parameter values are typical of many sewersheds. A large subgroup of 466 sewersheds was used to define the typical range of parameters. (Sewersheds were excluded from the subgroup if a small fraction of the area was served by a public sewer system or if the peak flow rate was exceptionally high. The subgroup is representative of the majority of separate sewersheds and is not skewed by sewersheds with exceptionally low or high values.) The area weighted average values for I, X, IF, and PF of the large subgroup of 466 typical sewersheds and the smaller subgroup of nine newer sewersheds are listed in Table 3-5.
The uniform future flow parameter values are similar to the values in the other subgroups. These parameters produce an I/I response that is better than average and can be achieved with conventional materials and construction techniques.
3-20

2020 Facilities Plan Conveyance Report
TABLE 3-5 BASIS FOR UNIFORM FUTURE FLOW PARAMETERS FOR FLOW FORECASTING SYSTEM
Parameter Unit of
Measure
Subgroup of 466 Sewersheds
(area weighted average values)
Subgroup of 9 “Newer”
Sewersheds (area weighted average values)
Uniform Future
Flow Values
Constant infiltration, I cfs/acre 0.000226 0.000226 0.0003 Active groundwater, X cfs/acre/inch 0.291 0.291 0.3 Interflow, IF cfs/acre/inch 0.155 0.135 0.15 Surface runoff, PF cfs/acre/inch 0.00825 0 0 cfs = Cubic Feet per Second
3.7.3 Calculation of Future Flow Additions The computation of the future additions to base sanitary flow is similar to current flows, but the calculation of the additional I/I for future flow is significantly different.
Future Base Sanitary Flow Additions The additional population served in a sewershed depends on both the change in the sewershed population and any change in the percent of the sewershed that is served; thus, the additional population increment is:
ΔPop = (Future Population)(Future % sewered) – (Current Population)(Current % sewered)
The additional increment of population served is then used to compute additional residential base sanitary flow by multiplying the population increment by the uniform future population generation rate of 68 gpcd.
ΔQres = (ΔPop)(68 gpcd)
Additional commercial and industrial flows are computed as the future incremental area times the respective generation rates.
ΔAcom = (Future Commercial Area – Current Commercial Area)
ΔQcom = (ΔAcom)(1500 gpad)
ΔAind = (Future Industrial Area – Current Industrial Area)
ΔQind = (ΔAind)(1000 gpad)
The base sanitary flow addition is the sum of the three components.
ΔBSF = ΔQres + ΔQcom + ΔQind
3-21

2020 Facilities Plan Conveyance Report
Future Dry and Wet Weather Infiltration and Inflow Additions – Sanitary Sewer Service Area
Future I/I additions apply to sewersheds in the sanitary sewer service area only. In the combined sewer service area, the wet weather flow is not changed from the current conditions because the impervious fraction is not expected to change significantly.
In future conditions, additional I/I growth will be associated with new sewer lines and connections that may contribute additional infiltration/inflow. The model assumes that I/I from the currently served areas will remain constant; which implies that municipalities and MMSD maintain their systems so that the I/I does not increase above current levels.
Because the current infiltration parameters are calibrated using the area of the sewershed and because the sewershed area does not change from current to future conditions, a different approach to calculating future I/I growth is required. This approach estimates an “effective area” for the growth and uses this effective area to calculate additional I/I flow.
The effective area of population growth is an estimate of area within a sewershed that contains new sewer infrastructure. Unlike commercial and industrial areas that specify the current and future areas explicitly, the residential area must be estimated using an assumed population density. Each sewershed is assigned a value for the density of population growth (derived from SEWRPC values) depending on the dominant classification of residential growth (low, medium, or high density). The residential density classes are listed in Table 3-6. Density is related to the overall sewershed area, so the density values are lower than they would be for specific residential land use blocks. The overall sewershed area includes parks, highways, and commercial/industrial areas; consequently, the population density based on the overall sewershed area is relatively low.
The effective area of the population growth is determined by the density and change in the population.
Aeff = (ΔPop) / Density
TABLE 3-6
FUTURE GROWTH RESIDENTIAL DENSITIES USED TO COMPUTE EFFECTIVE AREA OF FUTURE INFILTRATION AND INFLOW
Density Classifications Future Growth Density (persons/acre)
Low Density 3
Medium Density 6
High Density 14
Note: Density is relative to the overall sewershed area, not the specific density of residential land use blocks only
3-22

2020 Facilities Plan Conveyance Report
Additional I/I from commercial and industrial areas is based on the increase of those land use areas. Typically, the sewer network in commercial and industrial areas is less dense than in residential areas. Therefore, having fewer connections and laterals per acre and large impervious pavement and roof areas, the I/I from a new commercial or industrial area is likely to be less than the I/I from an equivalent area of residential land use.
The current I/I response of sewersheds with a significant fraction of commercial or industrial area is highly variable. It is difficult to predict the I/I response of new commercial and industrial areas based on the limited data available from current sewershed performance. The I/I Demonstration Project examined the response of four meters with significant commercial and industrial areas.(8) These results were highly variable.
Other sewersheds in the FFS model were also used to characterize the commercial and industrial I/I response. A subgroup of 15 sewersheds in which the commercial and industrial area is more than 50% of the sewershed area was identified. Among this subgroup the I/I response was so variable that it could not be used to define a typical response. Consequently, the approach used to model future I/I from new commercial and industrial areas is based on the conceptual argument that there are fewer laterals and a less dense sewer network compared to residential areas. It is assumed that the future I/I rates are half of the residential rates, (Kcom/ind = 50 %). The overall flow generation is not sensitive to this assumption. Additional I/I components due to future growth in residential, commercial, and industrial areas are computed with the following equations:
Additional constant infiltration:
ΔQI = (Ifuture)(Aeff) + (Kcom/ind)(Ifuture)[ΔAcom + ΔAind]
Additional active groundwater infiltration:
ΔQX = (Xfuture) (PAGWO) (Aeff) + (Kcom/ind)(Xfuture)(PAGWO)[ΔAcom + ΔAind]
Additional interflow RDII:
ΔQIF = (IFfuture)(PIFWO)( Aeff) + (Kcom/ind)(IFfuture)(PIFWO)[ΔAcom + ΔAind]
Additional surface runoff RDII:
ΔQPF = (PFfuture)(PSURO)( Aeff) + (Kcom/ind)(PFfuture)(PSURO)[ΔAcom + ΔAind]
The total future flow is the sum of the current flow and the future additions.
Qfuture = Qcurrent + ΔBSF + ΔQI + ΔQX + ΔQIF + ΔQPF
The increase in total future flow is significant in the sanitary sewer service areas due to growth in the base sanitary flow and growth in I/I from newly developed areas. The modeling approach assumes that the I/I from current areas is unchanged. In the combined sewer service area, the increase in future flow is very small because only the base sanitary flow has the potential for growth.
3-23

2020 Facilities Plan Conveyance Report
References (1) Camp, Dresser, and McKee/Brown and Caldwell, Comprehensive Modeling and Real
Time Control Strategies, Technical Memorandum No. 2.3 – Modeling Strategy Recommendations (Milwaukee: Milwaukee Metropolitan Sewerage District, 2003)
(2) Camp, Dresser, and McKee/Brown and Caldwell, Comprehensive Modeling and Real Time Control Strategies, Technical Memorandum No. 2.4 – Modeling Strategy Implementation Plan (Milwaukee: Milwaukee Metropolitan Sewerage District, 2003)
(3) Ibid.
(4) Camp, Dresser, and McKee/Brown and Caldwell, Mini-Mouse Documentation and Users Guide (Draft), Ad Hoc Modeling Question 27, MMSD Project No. K01004P01 (Milwaukee: Milwaukee Metropolitan District, 2004)
(5) Camp, Dresser, and McKee, Macro 2004 Documentation (Draft), MMSD Project No. K01004P01.P770 (Milwaukee: Milwaukee Metropolitan Sewerage District, 2004)
(6) David A. Schilling, Memorandum: Facility Plan Population, Household, and Selected Land Use Mapping and Data Development Process (Waukesha: Southeastern Wisconsin Regional Planning Commission, 2004)
(7) Camp, Dresser, and McKee, Technical Memorandum: Review and Screening of MMSD-Supplied Precipitation Data (Milwaukee: Milwaukee Metropolitan Sewerage District, 2000)
(8) Brown and Caldwell, I/I Reduction Demonstration Project (Milwaukee: Milwaukee Metropolitan Sewerage District, 2004)
3-24