Chapter 3 Adjusting for Gender Disparity in Economic ...
23
fraserinstitute.org/economic-freedom • Fraser Institute ©2017 Chapter 3 Adjusting for Gender Disparity in Economic Freedom and Why It Matters Rosemarie Fike Being persons, then, women are citizens; and no state has a right to make any new law, or to enforce any old law, that shall abridge their privileges or immunities. Susan B. Anthony, in her speech, Woman’s Rights to the Suffrage, given throughout the 29 postal districts of Monroe County, New York in 1873 aſter she was arrested for casting an illegal vote in the 1872 presidential election. Proponents of economic freedom have long opposed any laws or customs that limit the ability of women (and members of other marginalized groups) to work in certain occupations, own or exchange property, enter into contractual agree- ments, open their own businesses, or engage in other formal economic activi- ties. Competitive market forces encourage individuals to allocate their talents where they can receive the highest return for their efforts. In general, if individu- als receive a large return for their labor, this is a signal that many other individuals place a high value on the goods and services their labor produces. In allowing all people to freely choose how to allocate their labor, self-interest will guide them to make choices that are beneficial to them and to society as a whole. Countries that place additional restrictions on the economic rights of women forgo the benefits that would be gained by allowing women to choose for them- selves whether, and how, they would like to participate in the formal economy. Adam Smith argued that the greater the extent to which we can divide our labor, the more prosperous a society could become. e limit to this process is ulti- mately dictated by the size and scope of the market. Laws and regulations that create additional barriers for women artificially limit the size and scope of the market. As a consequence, these restrictions also limit a society’s potential growth Citation Rosemarie Fike (2017). Adjusting for Gender Disparity in Economic Freedom and Why It Matters. In James Gwartney, Robert Lawson, and Joshua Hall, Economic Freedom of the World: 2017 Annual Report (Fraser Institute): 189–211. Author Rosemarie Fike is an Instructor of Economics at Texas Christian University.
Transcript of Chapter 3 Adjusting for Gender Disparity in Economic ...

fraserinstitute.org/economic-freedom • Fraser Institute ©2017
Chapter 3 Adjusting for Gender Disparity in Economic Freedom and Why It MattersRosemarie Fike
Being persons, then, women are citizens; and no state has a right to make any new law, or to enforce any old law, that shall abridge their privileges or immunities.
Susan B. Anthony, in her speech, Woman’s Rights to the Suffrage, given
throughout the 29 postal districts of Monroe County, New York in 1873 after
she was arrested for casting an illegal vote in the 1872 presidential election.
Proponents of economic freedom have long opposed any laws or customs that limit the ability of women (and members of other marginalized groups) to work in certain occupations, own or exchange property, enter into contractual agree-ments, open their own businesses, or engage in other formal economic activi-ties. Competitive market forces encourage individuals to allocate their talents where they can receive the highest return for their efforts. In general, if individu-als receive a large return for their labor, this is a signal that many other individuals place a high value on the goods and services their labor produces. In allowing all people to freely choose how to allocate their labor, self-interest will guide them to make choices that are beneficial to them and to society as a whole.
Countries that place additional restrictions on the economic rights of women forgo the benefits that would be gained by allowing women to choose for them-selves whether, and how, they would like to participate in the formal economy. Adam Smith argued that the greater the extent to which we can divide our labor, the more prosperous a society could become. The limit to this process is ulti-mately dictated by the size and scope of the market. Laws and regulations that create additional barriers for women artificially limit the size and scope of the market. As a consequence, these restrictions also limit a society’s potential growth
Citation Rosemarie Fike (2017). Adjusting for Gender Disparity in Economic Freedom and Why It Matters. In James Gwartney, Robert Lawson, and Joshua Hall, Economic Freedom of the World: 2017 Annual Report (Fraser Institute): 189–211.
Author Rosemarie Fike is an Instructor of Economics at Texas Christian University.

190 • Economic Freedom of the World: 2017 Annual Report
Fraser Institute ©2017 • fraserinstitute.org/economic-freedom
and prosperity. This suggests that the potential costs of excluding women (and other groups) from full participation in the formal economy are quite large and affect all members of society. For this reason, a measure of economic freedom should consider whether all members of society enjoy economic rights, or if some groups of people are systematically excluded.
Of course, the argument for equal rights and freedom for women goes well beyond concerns for economic efficiency. All human beings have a fundamental right to be free, to make their own decisions, and set their own life course. Having autonomy over these choices provides individuals with the motivation to work towards self-improvement, the ability to develop a sense of pride and fulfillment in their successes, and a mechanism to learn from their mistakes.
In last year’s report, Fike (2016) presented an argument for adjusting the index published in Economic Freedom of the World to account for the fact that women and men do not always have equal access to the economic institutions measured in the index. In assuming that all members of society have equal rights under the law, past estimates of economic freedom have been overstated for countries that place additional legal and regulatory restrictions on the scope of women’s eco-nomic choices. This year marks the first year that the Economic Freedom of the World report fully incorporates a gender adjustment into the index. This adjust-ment allows us to capture more accurately how economically free countries are, particularly relative to one another.
This chapter describes the data and methods used to create a Gender Disparity Index; provides details about how that adjustment is incorporated into Area 2, Legal System and Property Rights, of the economic freedom index; and discusses some general trends in the data.
Methodology—calculating the Gender Disparity Index
The Gender Disparity Index (GDI) is generated using one data source: the World Bank’s reports, Women, Business, and the Law (World Bank, 2009, 2011, 2013b, 2015). This World Bank dataset tracks the existence of legal and regulatory bar-riers imposed on women that may impede their ability to participate in formal economic activity. This report was released for the first time in 2009, and the data are updated every two years to incorporate legal and regulatory reforms that have taken place.
The primary sources of information for Woman, Business, and the Law are the written laws and regulations for each country. After the World Bank’s scholars examine the written laws and regulations, they consult with teams of local legal experts comprising judges, lawyers, civil society representatives, and public offi-cials to determine whether the interpretation of the written law is accurate. Thus, the GDI provides a de jure measure of gender disparity under the law.
Since the GDI is derived from formal legal and regulatory codes, social norms, religious customs, and other informal rules are not captured by this measure. Like the economic freedom index itself, the GDI reflects a country’s formal institutional framework. Even though gender norms are not included in the GDI, it is impor-tant to acknowledge that informal institutions may impose severe constraints on the choices of women. Despite a formal legal institutional context that treats men and women equally, women in some countries may face additional informal

Chapter 3: Adjusting for Gender Disparity in Economic Freedom and Why It Matters • 191
fraserinstitute.org/economic-freedom • Fraser Institute ©2017
barriers that greatly limit their economic participation. In such cases, the GDI will not fully account for the gender discrimination that takes place, and the adjusted economic freedom score will still overstate the level of economic freedom.
In 2013, the World Bank’s scholars produced a historical version of this report: 50 Years of Women’s Rights (World Bank, 2013a). These historical data track the changes in gender equality in 100 countries from 1960 to 2010. The report con-tains data for 14 variables, including property ownership, marital regimes, inheri-tance, property titling, legal status and capacity, constitutional rights, and legal pluralism.1 These scholars used the data from Women, Business, and the Law 2010 (World Bank, 2009) as their starting point and looked through historical legal and regulatory codes to track the timing of any reforms that took place going back to 1960. Nine of the variables included in the historical dataset are directly related to economic freedom and have a clear intuitive interpretation.2 The following nine questions are used to create the gender-disparity adjustment applied to Area 2 of the economic freedom index from 1970 to 2008:
1 Do unmarried men and unmarried women have equal property rights over immoveable property?
2 Do married men and married women have equal property rights over immoveable property?
3 Do sons and daughters have equal inheritance rights over immoveable property from their parents?
4 Do female and male surviving spouses have equal inheritance rights over immoveable property?
5 Can an adult married woman legally be designated as the “head of household” or “head of family” in the same way as an adult married man?
6 Can an adult married woman get a job or pursue a trade or profession in the same way as an adult married man?
7 Can an adult married woman legally open a bank account in the same way that an adult married man can?
8 Can an adult married woman sign a contract in the same way as an adult married man?
9 Can an adult married woman initiate legal proceedings without a husband’s permission?
(Hallward-Driemeier, Mary, Tazeen Hasan, and Anca Bogdana Rusu, 2013: table 2, pp. 8–9; World Bank, 2009)
1 See World Bank, 2013a for a more detailed discussion of the World Bank’s methodology. 2 For example, questions about whether customary laws or religious laws are valid sources of law
in each country are not included. The World Bank’s scholars do not assess the content of these laws so there is no clear way to interpret whether the customary nature of the law alone acts as a barrier to women’s rights. Questions asking if the constitution includes a gender-related non-discrimination clause or any guarantee of gender equality, and questions measuring women’s positive freedoms are also omitted.

192 • Economic Freedom of the World: 2017 Annual Report
Fraser Institute ©2017 • fraserinstitute.org/economic-freedom
From 2009 onward, an expanded set of questions is used to track the legal and regulatory barriers that women face. This expanded set of questions incorporated eight of the questions from the historical dataset, the exception being question nine. There are, however, several components included in the expanded set of questions in the annual reports that capture barriers to women’s legal rights that are comparable to question nine above.
Table 3.1 presents the full list of questions and indicates the years in which the corresponding data is available. There are 29 questions used to calculate the index from 2009 to 2012; 39 questions in 2013 and 2014; and 41 questions used in 2015. All of the questions included directly relate to a woman’s ability to fully partici-pate in the formal economy, such as barriers to a woman’s ability to own property, travel, enter into voluntary contracts, or use the court system without receiving someone else’s permission.
The answer to each question is a simple “yes” or “no”, which is then coded into a dummy variable. For every question except one, “yes” responses receive a score of “1”, indicating that women face no additional barriers in that particular area, and “no” responses receive a score of “0”, indicating that there are barriers that limit the choices of women but not men.3 The individual components are then combined into a single GDI score by taking a simple average of a country’s scores for those components. A country’s overall score on the Gender Disparity Index can range between “0” and “1”, with scores being interpreted in a similar fashion. A country with a score of “1” treats men and women equally under the written law for all ques-tions included in the GDI in that year. Countries with scores closer to “0” are places where women face significant formal legal barriers that are not faced by men.
The data are fairly complete for most countries included in the historical data-set, although there are a few instances in which there is information for only a cou-ple of questions. As can be expected, the more recent dataset is far more complete than the historical dataset. To minimize issues with missing data, and to provide greater comparability across time periods, data must be available for at least half of the available questions in order for a country to receive a gender-adjustment score for any given year. For the most recent year, 2015, the gender-adjustment scores range from 0.41 (Saudi Arabia) to 1.00 (48 countries). The further back in time, the lower the lowest gender-adjustment scores, as Lesotho, South Africa, and Zimbabwe each have a score on the GDI equal to 0.00 in 1970.
Table 3.2 presents the correlation coefficients between the GDI scores across five-year time periods between 1970 and 2015. Within this time frame, the corre-lations are quite high, ranging from 0.8289 to 0.9865 when looking at consecutive five-year periods. Comparing data for years that are further apart, the correla-tion coefficients drop significantly. This is consistent with the view that there is a degree of path dependence when it comes to institutional change. This may be particularly true of institutions that reflect informal institutions (gender norms), which tend to change slowly. However, when looking at how these institutions evolve over a long time period, it is clear that institutional change in the direction of greater gender equality has taken place, as the correlation between the GDI scores in 1970 and 2015 is only 0.3746.
3 One question is coded in the opposite manner: “Are married women required by law to obey their husbands?” Here, a “yes” response is indicative of a barrier to a woman’s economic freedom, as her husband can overrule any economic decision that the woman is otherwise allowed to make.

Chapter 3: Adjusting for Gender Disparity in Economic Freedom and Why It Matters • 193
fraserinstitute.org/economic-freedom • Fraser Institute ©2017
Table 3.1: Questions Included in the Gender Disparity Index, 1970–20151970
–20082009
–20102011
–20122013
–20142015
Can an unmarried woman apply for a passport in the same way as an unmarried man? ✓ ✓ ✓ ✓Can a married woman apply for a passport in the same way as a married man? ✓ ✓ ✓ ✓Can an unmarried woman obtain a national ID card in the same way as an unmarried man? ✓ ✓Can a married woman obtain a national ID card in the same way as a married man? ✓ ✓Can an unmarried woman travel outside the country in the same way as an unmarried man? ✓ ✓ ✓ ✓Can a married woman travel outside the country in the same way as a married man? ✓ ✓ ✓ ✓Can an unmarried woman travel outside her home in the same way as an unmarried man? ✓ ✓ ✓ ✓Can a married woman travel outside her home in the same way as a married man? ✓ ✓ ✓ ✓Can an unmarried woman get a job or pursue a trade or profession in the same way as an unmarried man? ✓ ✓ ✓ ✓Can a married woman get a job or pursue a trade or profession in the same way as a married man? ✓ ✓ ✓ ✓ ✓Can an unmarried woman sign a contract in the same way as an unmarried man? ✓ ✓ ✓ ✓Can a married woman sign a contract in the same way as a married man? ✓ ✓ ✓ ✓ ✓Can an unmarried woman register a business in the same way as an unmarried man? ✓ ✓ ✓ ✓Can a married woman register a business in the same way as a married man? ✓ ✓ ✓ ✓Can an unmarried woman open a bank account in the same way as an unmarried man? ✓ ✓ ✓ ✓Can a married woman open a bank account in the same way as a married man? ✓ ✓ ✓ ✓ ✓Can an unmarried woman choose where to live in the same way as an unmarried man? ✓ ✓ ✓ ✓Can a married woman choose where to live in the same way as a married man? ✓ ✓ ✓ ✓Can an unmarried woman confer citizenship on her children in the same way as an unmarried man? ✓ ✓ ✓ ✓Can a married woman confer citizenship on her children in the same way as a married man? ✓ ✓ ✓ ✓Can an unmarried woman be “head of household” or “head of family” in the same way as an unmarried man? ✓ ✓ ✓ ✓Can a married woman be “head of household” or “head of family” in the same way as a married man? ✓ ✓ ✓ ✓ ✓Can a married woman confer citizenship to a non-national spouse in the same way as a man? ✓ ✓ ✓ ✓Are married women required by law to obey their husbands? ✓ ✓ ✓ ✓Do unmarried men and unmarried women have equal ownership rights to property? ✓ ✓ ✓ ✓ ✓Do married men and married women have equal ownership rights to property? ✓ ✓ ✓ ✓ ✓Do sons and daughters have equal rights to inherit assets from their parents? ✓ ✓ ✓ ✓ ✓Do female and male surviving spouses have equal rights to inherit assets? ✓ ✓ ✓ ✓ ✓Can a married woman initiate legal proceedings without a husband’s permission? ✓Does a woman’s testimony carry the same evidentiary weight in court as a man’s? ✓ ✓ ✓ ✓Can nonpregnant and nonnursing women work the same night hours as men? ✓ ✓ ✓ ✓Can nonpregnant and nonnursing women do the same jobs as men? ✓ ✓ ✓ ✓Can nonpregnant and nonnursing women work in jobs deemed hazardous in the same way as men? ✓ ✓Can nonpregnant and nonnursing women work in jobs deemed morally or socially inappropriate in the same way as men? ✓ ✓Can nonpregnant and nonnursing women work in jobs deemed arduous in the same way as men? ✓ ✓Can nonpregnant and nonnursing women work in mining in the same way as men? ✓ ✓Can nonpregnant and nonnursing women work in factories in the same way as men? ✓ ✓Can nonpregnant and nonnursing women work in construction in the same way as men? ✓ ✓Can nonpregnant and nonnursing women work in the same occupations as men? ✓Can nonpregnant and nonnursing women work in metalworking in the same way as men? ✓ ✓Can nonpregnant and nonnursing women engage in jobs requiring lifting weights above a threshold in the same way as men? ✓ ✓Can nonpregnant and nonnursing women do the same job-related tasks as men? ✓
Answers to all questions are coded with Yes = 1 and No = 0 except for the italicized question, which is coded as No = 1 and Yes = 0.

194 • Economic Freedom of the World: 2017 Annual Report
Fraser Institute ©2017 • fraserinstitute.org/economic-freedom
Table 3.3 presents the descriptive statistics for the Gender Disparity Index across five-year time periods between 1970 and 2015. The global average score for the GDI increased from 0.80 in 1970 to 0.90 in 2010.4 This is consistent with the view that social and legal status of women has improved in many societies in the past several decades. During the same time period, the standard deviation steadily decreases, reflecting the fact that the range for the scores on the GDI becomes narrower (moving from 0.00–1.00 in the earliest years to 0.41–1.00 in the later years). Finally, the fact that the global average score is close to 1 indicates that men and women are treated as equals under the formal legal and regulatory codes for most economic activities in the vast majority of countries during this time period.
Countries with low scores, 1970–2015Throughout the dataset, a substantial number of countries receive a Gender Disparity Index score equal to 1, meaning that men and women have equal treat-ment under the set of laws included in the adjustment factor. For example, in
4 Between 2010 and 2015, the global average score decreased from 0.90 to 0.87. This decline is a reflection of an increase in the number of available variables included in Women, Business, and the Law. Between the annual reports of 2012 and 2014, the World Bank added several new ques-tions, 10 of which are included in the GDI beginning in 2013. This resulted in a slight decrease in the scores of 65 countries and a slight increase in the scores of 24 countries. There are 21 countries that had a decrease of 0.12 or higher (the highest is Benin with a drop of 0.20 points). Even taking this into consideration, the decline in the global average between 2010 and 2015 is small, 0.03 points, and the global average score is still 0.07 points higher in 2015 than it was in 1970. The change in scores for these countries between 2012 and 2013 reflects the trade-off made to gain greater precision in the GDI by including more data.
Table 3.2: Correlation Coefficients for the Gender Disparity Index, 1970-2015 1970 1975 1980 1985 1990 1995 2000 2005 2010 2015
1970 1.0000
1975 0.9616 1.0000
1980 0.9390 0.9725 1.0000
1985 0.8363 0.8665 0.9021 1.0000
1990 0.7748 0.7959 0.8253 0.9074 1.0000
1995 0.7376 0.7569 0.7870 0.8828 0.9865 1.0000
2000 0.6159 0.6358 0.6580 0.7438 0.8506 0.8576 1.0000
2005 0.5330 0.5306 0.5726 0.6517 0.7492 0.7508 0.8850 1.0000
2010 0.4110 0.4217 0.4711 0.5453 0.6301 0.6528 0.7741 0.8289 1.0000
2015 0.3746 0.4038 0.4533 0.5121 0.5849 0.5979 0.7145 0.7270 0.8694 1.0000

Chapter 3: Adjusting for Gender Disparity in Economic Freedom and Why It Matters • 195
fraserinstitute.org/economic-freedom • Fraser Institute ©2017
2015, 48 countries have a score on the GDI equal to 1. There are several countries, however, with GDI scores that are substantially lower. Table 3.4 provides a list of countries with the 15 lowest scores on the GDI every five years from 1970 to 1990 and 1995 to 2015, respectively.
From 1970 through 1990, the set of countries with the 15 lowest scores was pre-dominantly made up of African countries, with a couple of Middle Eastern (Saudi Arabia, Bahrain, Iran, Jordan) and Asian countries (Nepal, Indonesia) making the list. There are a few notable exceptions to this. Austria is in the bottom set of coun-tries in 1970 with a score of 0.33, as their formal legal code provided husbands with legal authority over their wives until the mid-1970s. Brazil also appears on the list for a single year, with a score of 0.56 in 1980. Spain appears in the bottom for several years, with a score of 0.22 in 1970 and 1975 and a score of 0.44 in 1980. Additionally, Paraguay’s score of 0.33 from 1970 to 1985 places it among the coun-tries with the greatest gender disparity.
Starting in 1995, however, the Middle Eastern and North African (MENA) countries begin to dominate the list of countries with the greatest gender dispar-ity. By 2015, 11 out of the 15 countries with the 15 lowest scores are located in MENA countries. This shift does not indicate an increase in gender disparity in MENA countries but rather the removal of barriers to women’s economic rights in sub-Saharan Africa. South Africa and Morocco are among the bottom set of countries from 1970 through 1995, and Lesotho is there from 1970 through 2005. Bahrain appears among the bottom for each period starting in 1975, while Syria joins the list in 1980 and remains on it for all subsequent years except 2005. Saudi Arabia and Mauritania are the only countries to be among those with the lowest 15 GDI scores for all years in the dataset. While Saudi Arabia’s score is 0.41 throughout the entire time period, Mauritania’s score increased from 0.33 to 0.66 between 2005 and 2010.
Table 3.3: Summary Statistics for the Gender Disparity Index, 1970–2015Observations Mean Standard Deviation Minimum Maximum
1970 159 0.7996 0.2404 0.00 1.00
1975 159 0.8118 0.2376 0.00 1.00
1980 159 0.8209 0.2289 0.00 1.00
1985 159 0.8375 0.2160 0.00 1.00
1990 159 0.8564 0.2020 0.00 1.00
1995 159 0.8625 0.1983 0.00 1.00
2000 159 0.8781 0.1797 0.11 1.00
2005 159 0.8926 0.1635 0.29 1.00
2010 159 0.8996 0.1259 0.41 1.00
2015 159 0.8709 0.1420 0.41 1.00

196 • Economic Freedom of the World: 2017 Annual Report
Fraser Institute ©2017 • fraserinstitute.org/economic-freedom
Table 3.4: Countries with the Lowest Scores on the Gender Disparity Index, 1970–20151970 1975 1980 1985 1990 1995 2000 2005 2010 2015
0.00 Lesotho Lesotho South Africa South Africa South Africa 0.00 South AfricaSouth Africa South Africa ZimbabweZimbabwe Zimbabwe
0.11 Benin Benin Benin Benin 0.11 Benin BeninLesotho Lesotho Lesotho
0.17 Rwanda Rwanda Rwanda Rwanda 0.170.22 Spain Spain 0.220.25 Namibia Namibia Namibia Namibia 0.250.29 Niger Niger Niger Niger Niger 0.29 Niger Niger Niger
0.33 Austria Congo, Dem. Rep. Congo, Dem. Rep. Congo, Dem. Rep. Congo, Dem. Rep. 0.33 Congo, Dem. Rep. Congo, Dem. Rep. Congo, Dem. Rep.Congo, Dem. Rep. Mauritania Mauritania Mauritania Mauritania Lesotho Lesotho Lesotho
Indonesia Paraguay Paraguay Paraguay Namibia Mauritania Mauritania Mauritania
Mauritania NamibiaParaguay
0.41 Saudi Arabia Saudi Arabia Saudi Arabia Saudi Arabia Saudi Arabia 0.41 Saudi Arabia Saudi Arabia Saudi Arabia Saudi Arabia Saudi Arabia
0.44 Morocco Morocco Morocco Morocco Morocco 0.44 MoroccoMozambique Spain
0.46 0.46 Syria
0.48 0.48 Jordan
0.49 0.49 JordanKuwait
0.51 0.51 United Arab Emirates
0.52 0.52 Iran
0.54 Bahrain Bahrain Bahrain Bahrain 0.54 Bahrain Bahrain Bahrain Bahrain BahrainEgypt
0.56 Angola Angola Cameroon 0.56 Cameroon Cameroon CameroonBrazil Brazil Indonesia Indonesia Iran Iran
Burkina Faso Burkina Faso Iran Iran Jordan Jordan
Cameroon Cameroon Jordan Jordan Madagascar Madagascar
Côte d’Ivoire Iran Madagascar Madagascar Mali Mali
Iran Jordan Mozambique Mozambique Mozambique Yemen, Republic
Jordan Madagascar Nepal Nepal Nepal
Madagascar Mozambique Syria Syria Syria
Mozambique Nepal Yemen, Republic
Nepal Senegal
Senegal Syria
SwitzerlandSyria
0.59 0.59 Kuwait Kuwait CameroonOman Oman Congo, Dem. Rep.
United Arab Emirates Syria IranUnited Arab Emirates
0.61 0.61 MauritaniaOman
0.62 0.62 Qatar QatarYemen, Republic
0.63 0.63 Yemen, Republic
0.65 0.65 Niger
0.66 0.66 Mauritania
0.67 0.67 Malaysia
0.69 0.69 Central African Rep.Congo, Dem. Rep.Swaziland

Chapter 3: Adjusting for Gender Disparity in Economic Freedom and Why It Matters • 197
fraserinstitute.org/economic-freedom • Fraser Institute ©2017
Table 3.4: Countries with the Lowest Scores on the Gender Disparity Index, 1970–20151970 1975 1980 1985 1990 1995 2000 2005 2010 2015
0.00 Lesotho Lesotho South Africa South Africa South Africa 0.00 South AfricaSouth Africa South Africa ZimbabweZimbabwe Zimbabwe
0.11 Benin Benin Benin Benin 0.11 Benin BeninLesotho Lesotho Lesotho
0.17 Rwanda Rwanda Rwanda Rwanda 0.170.22 Spain Spain 0.220.25 Namibia Namibia Namibia Namibia 0.250.29 Niger Niger Niger Niger Niger 0.29 Niger Niger Niger
0.33 Austria Congo, Dem. Rep. Congo, Dem. Rep. Congo, Dem. Rep. Congo, Dem. Rep. 0.33 Congo, Dem. Rep. Congo, Dem. Rep. Congo, Dem. Rep.Congo, Dem. Rep. Mauritania Mauritania Mauritania Mauritania Lesotho Lesotho Lesotho
Indonesia Paraguay Paraguay Paraguay Namibia Mauritania Mauritania Mauritania
Mauritania NamibiaParaguay
0.41 Saudi Arabia Saudi Arabia Saudi Arabia Saudi Arabia Saudi Arabia 0.41 Saudi Arabia Saudi Arabia Saudi Arabia Saudi Arabia Saudi Arabia
0.44 Morocco Morocco Morocco Morocco Morocco 0.44 MoroccoMozambique Spain
0.46 0.46 Syria
0.48 0.48 Jordan
0.49 0.49 JordanKuwait
0.51 0.51 United Arab Emirates
0.52 0.52 Iran
0.54 Bahrain Bahrain Bahrain Bahrain 0.54 Bahrain Bahrain Bahrain Bahrain BahrainEgypt
0.56 Angola Angola Cameroon 0.56 Cameroon Cameroon CameroonBrazil Brazil Indonesia Indonesia Iran Iran
Burkina Faso Burkina Faso Iran Iran Jordan Jordan
Cameroon Cameroon Jordan Jordan Madagascar Madagascar
Côte d’Ivoire Iran Madagascar Madagascar Mali Mali
Iran Jordan Mozambique Mozambique Mozambique Yemen, Republic
Jordan Madagascar Nepal Nepal Nepal
Madagascar Mozambique Syria Syria Syria
Mozambique Nepal Yemen, Republic
Nepal Senegal
Senegal Syria
SwitzerlandSyria
0.59 0.59 Kuwait Kuwait CameroonOman Oman Congo, Dem. Rep.
United Arab Emirates Syria IranUnited Arab Emirates
0.61 0.61 MauritaniaOman
0.62 0.62 Qatar QatarYemen, Republic
0.63 0.63 Yemen, Republic
0.65 0.65 Niger
0.66 0.66 Mauritania
0.67 0.67 Malaysia
0.69 0.69 Central African Rep.Congo, Dem. Rep.Swaziland
198 • Economic Freedom of the World: 2017 Annual Report
Fraser Institute ©2017 • fraserinstitute.org/economic-freedom
In addition, the values of the lowest scores have increased dramatically since 1970. For example, in 1970 the lowest 15 scores range from 0.00 to 0.44. By 2015, however, the range for the 15 lowest scores is from 0.41 to 0.65. This indicates that even the countries that started with the greatest amount of gender disparity in 1970 experienced legal and regulatory reforms that removed barriers to women’s ability to exercise freedom of choice over economic decisions.
The freedom to work and earn is a basic freedom that makes it possible for individuals to achieve, support themselves, and shape their lives according to their own preferences. There are 19 countries where women are legally required to obey their husbands and/or are prohibited from working outside of the home without permission of their husbands. These 19 countries are listed below.
1. Bahrain 8. Iran 15. Qatar
2. Cameroon 9. Jordan 16. Saudi Arabia
3. Chad 10. Kuwait 17. Syria
4. Congo, Democratic Republic 11. Malaysia 18. United Arab Emirates
5. Egypt 12. Mali 19. Yemen
6. Guinea 13. Mauritania
7. Gabon 14. Niger
As seen in table 3.4, the scores on the GDI for each of these countries are rela-tively low. Such differential treatment under the law highlights the importance of adjusting the ratings in Area 2, Legal System and Property Rights, of the EFW index for restrictions that undermine basic liberties of women.
Using the Gender Disparity Index to adjust the EFW index
Much of the discussion about how to incorporate the Gender Disparity Index into the EFW index centered on which part(s) of the EFW index ought to be adjusted. Since the GDI specifically measures whether women and men are receiving equal treatment under the law, it is considered a rule-of-law issue. As such, the gender disparity measure is used to adjust only Area 2, Legal System and Property Rights, of the EFW index.
There is little theoretical reason that the size of government or the soundness of a country’s monetary policy is affected in any way by this type of gender dis-parity, and so there was little debate about whether to adjust Areas 1 and 3. Some made the case that additional barriers to women’s legal rights affect their ability to benefit from open international trade and a regulatory environment that is not burdensome to business, and thus Areas 4 and 5 should also be adjusted for gen-der equality (Fike, 2016). While it is true that some of the measures included in the index are directly related to a woman’s ability to travel and the types of occu-pations she is permitted to pursue, the fact that the World Bank data measures the gender equality of the law by examining a women’s rights relative to what men are permitted to do means that Area 2 is the relevant area of the index to adjust.

Chapter 3: Adjusting for Gender Disparity in Economic Freedom and Why It Matters • 199
fraserinstitute.org/economic-freedom • Fraser Institute ©2017
The adjustment to Area 2 is calculated as follows:
(Area 2 Scoreit + Gender Disparity Indexit × Area 2 Scoreit )Adjusted Area 2 Scoreit = ,
2
where i indicates the country and t denotes the year. The summary score for the EFW index score is then calculated the way it always has been, by taking an aver-age of the scores for each area, only using the gender-adjusted score for Area 2 in place of the unadjusted score.5 For those countries without complete data back to 1970, the first available adjustment factor from the GDI was carried backward for the missing years. That is, if 1980 was the first year the data for the GDI is avail-able for a country, that same factor was used for both 1970 and 1975. This implic-itly assumes that the legal equality of women was no worse in the past than in the present, which is a reasonable assumption for the vast majority of cases. The appendix to this chapter presents the scores in the GDI from 1970 to 2015 for the 159 countries in the EFW index.6
How does the adjustment affect the EFW index?Adjusting for gender differences does not drastically alter the EFW summary scores for most countries in the dataset. As mentioned above, there are 48 countries that have no downward adjustment to Area 2 in the most recent years, meaning their gender-adjusted score is identical to the unadjusted score. Another 74 countries experienced slight decreases in their EFW summary score of less than 0.10 after adjusting for gender equality under the law. Thus, the EFW scores for 122 out of the 159 countries in the dataset are barely affected by the gender adjustment.7
For a small subset of countries, primarily in the Middle East and North Africa, the new method of calculating the EFW index results in a substantial decrease in both their scores on the EFW index and their position in the rankings. Table 3.5a provides a list of the 20 countries with the largest decreases in their rank for the most recent year as a result of the adjustment to Area 2 using the GDI. For these countries, the table presents the adjustment factor derived from the GDI, unad-justed and adjusted EFW rankings, as well as the magnitude of the decrease in rank.
Several countries experience substantial increases in their relative rank after the gender adjustment is applied. The countries with the largest improvement in their relative position are presented in table 3.5b. Over a third of these coun-tries are located in Europe, while the rest are from Asia, sub-Saharan Africa, and South America.
Table 3.6 presents a list of the 25 countries that saw the largest decrease in their overall EFW scores as a result of the gender adjustment. This table presents the GDI, unadjusted and adjusted EFW scores, as well as the difference between the two scores. The lists of countries in tables 3.5a and 3.6 are strikingly similar.
5 For those interested in viewing the Gender Disparity Index, the data are provided in a separate column in the EFW data file.
6 The spreadsheets containing the scores for all questions involved in calculating the GDI for each country from 1970 to 2015 are available to interested parties upon request.
7 The correlation between the gender-adjusted EFW index and the unadjusted version is quite high, ranging from 0.9919 to 0.9982 throughout the entire dataset.

200 • Economic Freedom of the World: 2017 Annual Report
Fraser Institute ©2017 • fraserinstitute.org/economic-freedom
Table 3.5a: Countries with the largest decrease in EFW rank after the Gender Disparity Index adjustment, 2015
GDI adjustment Unadjusted EFW rank Adjusted EFW rank Change in rank
1 Qatar 0.62 22 45 −23
1 Saudi Arabia 0.41 99 122 −23
1 United Arab Emirates 0.51 14 37 −23
4 Bahrain 0.54 27 49 −22
4 Jordan 0.49 17 39 −22
6 Kuwait 0.49 80 97 −17
7 Malaysia 0.67 51 65 −14
7 Oman 0.61 83 97 −14
9 Kazakhstan 0.74 54 66 −12
10 Egypt 0.54 130 140 −10
11 Azerbaijan 0.72 107 114 −7
12 Russia 0.74 94 100 −6
13 Moldova 0.72 97 102 −5
13 Morocco 0.76 115 120 −5
15 India 0.78 91 95 −4
15 Kyrgyz Republic 0.74 76 80 −4
15 Niger 0.65 135 139 −4
15 Poland 0.85 47 51 −4
15 Syria 0.46 149 153 −4
15 Tajikistan 0.72 78 82 −4
20 Lebanon 0.74 75 78 −3

Chapter 3: Adjusting for Gender Disparity in Economic Freedom and Why It Matters • 201
fraserinstitute.org/economic-freedom • Fraser Institute ©2017
Table 3.5b: Countries with the largest increase in EFW rank after the Gender Disparity Index adjustment, 2015
GDI adjustment Unadjusted EFW rank Adjusted EFW rank Change in rank
1 Cape Verde 1.00 101 93 8
1 South Africa 1.00 103 95 8
1 Spain 1.00 44 36 8
4 Hungary 1.00 61 54 7
4 Liberia 1.00 89 82 7
6 Albania 0.95 38 32 6
6 Armenia 1.00 35 29 6
6 Ghana 0.98 109 103 6
6 Japan 0.95 45 39 6
6 Paraguay 1.00 84 78 6
6 Peru 1.00 49 43 6
6 Suriname 0.97 98 92 6
6 Trinidad and Tobago 0.97 111 105 6
14 Belgium 1.00 48 43 5
14 Germany 1.00 28 23 5
14 Greece 1.00 121 116 5
14 Italy 1.00 59 54 5
14 Korea, South 0.92 37 32 5
14 Mexico 1.00 81 76 5
14 Portugal 1.00 39 34 5
14 Slovak Republic 1.00 58 53 5
14 Taiwan 1.00 26 21 5
14 Turkey 0.90 86 81 5
14 Zambia 1.00 93 88 5

202 • Economic Freedom of the World: 2017 Annual Report
Fraser Institute ©2017 • fraserinstitute.org/economic-freedom
Table 3.6: Countries with the largest decrease in EFW score after the Gender Disparity Index adjustment, 2015
Country GDI adjustment Adjusted EFW score Unadjusted EFW score Change in Score
1 Saudi Arabia 0.41 6.24 6.67 −0.4347
2 United Arab Emirates 0.51 7.50 7.88 −0.3810
3 Kuwait 0.49 6.62 6.96 −0.3441
4 Jordan 0.49 7.47 7.80 −0.3289
5 Syria 0.46 5.22 5.54 −0.3173
6 Bahrain 0.54 7.38 7.69 −0.3132
7 Qatar 0.62 7.43 7.73 −0.3041
8 Oman 0.61 6.62 6.91 −0.2926
9 Iran 0.59 5.31 5.54 −0.2346
10 Malaysia 0.67 7.19 7.42 −0.2263
11 Egypt 0.54 5.73 5.94 −0.2124
12 Azerbaijan 0.72 6.38 6.56 −0.1780
13 Cameroon 0.59 5.92 6.09 −0.1702
14 Kazakhstan 0.74 7.18 7.35 −0.1691
15 Tajikistan 0.72 6.80 6.97 −0.1675
16 Mauritania 0.61 5.56 5.72 −0.1624
17 Senegal 0.68 6.16 6.32 −0.1615
18 Morocco 0.76 6.29 6.45 −0.1584
19 Benin 0.66 5.77 5.92 −0.1503
20 Swaziland 0.69 6.79 6.94 −0.1487
21 Niger 0.65 5.74 5.89 −0.1473
22 Mali 0.66 5.90 6.04 −0.1445
23 Russia 0.74 6.60 6.74 −0.1441
24 Ukraine 0.72 5.38 5.52 −0.1425
25 Congo, Dem. Republic 0.59 5.45 5.59 −0.1413

Chapter 3: Adjusting for Gender Disparity in Economic Freedom and Why It Matters • 203
fraserinstitute.org/economic-freedom • Fraser Institute ©2017
Countries that were the most affected, both in score and rank, by the gender adjustment include: Saudi Arabia, United Arab Emirates, Kuwait, Jordan, Bahrain, Qatar, Oman, Iran, Egypt, Morocco, and Syria. In addition to these countries, a few other African and Asian countries also appear on the list. It is apparent that the gender adjustment has the largest impact on MENA nations, as many of these countries would rank as quite economically free if not for the restrictions placed on women’s economic choices.
Figure 3.1 compares the global average scores of the EFW summary index before and after the gender adjustment from 1970 to 2015. The global average scores for both versions of the index follow the same pattern over time: decreasing between 1970 and 1980, and then steadily increasing until 2015. The difference between the gender-adjusted scores and the unadjusted scores narrows over time, reflecting the global movement towards greater gender equality under the law as time progresses. Once again, the exception to this occurs between 2010 and 2015: with the intro-duction of new questions into the World Bank’s Women, Business, and the Law in 2013, the difference between the adjusted and unadjusted scores widens slightly.
The global average scores of the Gender Disparity Index are presented in figure 3.2. The dark-grey columns show the GDI averages sorted into quartiles based on the unadjusted EFW data. The light-grey columns show the GDI averages sorted into quartiles based on the gender-adjusted EFW data. Both sets of global averages are presented to provide a comparison. Regardless of whether you are looking at the unadjusted or adjusted EFW quartiles, the overall pattern is the same. The most economically free countries have the highest average values on the GDI, and with each move to a lower quartile, the global average GDI score declines. This pattern suggests that the more economically free a country is, the more likely that men and women will be treated equally under the law. Even when we are measuring eco-nomic freedom in a way that does not fully capture the experience of women across the world, greater freedom is correlated with greater gender parity under the law.
5.0
5.5
6.0
6.5
7.0
2015201020052000199519901985198019751970
Source: Economic Freedom of the World: 2017 Annual Report; author’s calculations.
Aver
age
EFW
ratin
g
Figure 3.1: Global average summary economic freedom ratings, with gender-disparity adjustment and unadjusted, 1970–2015

204 • Economic Freedom of the World: 2017 Annual Report
Fraser Institute ©2017 • fraserinstitute.org/economic-freedom
The average difference between the unadjusted EFW scores and the adjusted scores are sorted into quartiles based on unadjusted EFW scores from most to least free in figure 3.3. The most economically free countries have the low-est average difference between the gender-adjusted and unadjusted scores. On average, countries with unadjusted economic-freedom scores that place them in the top quartile have a .0454-point difference between their adjusted and unad-justed scores. This average difference steadily increases as you move through each quartile: quartile 2 = 0.0520; quartile 3 = 0.0791; and quartile 4 = 0.0946. Again, this indicates that with greater economic freedom comes greater gender equality under the law.
0.00
0.02
0.04
0.06
0.08
0.10
Most FreeSecondThirdLeast Free
Source: Economic Freedom of the World: 2017 Annual Report; author’s calculations.
Aver
age
EFW
ratin
g
Figure 3.3: Di erence between unadjusted and GDI-adjusted EFW scores, sorted by unadjusted EFW quartiles, 2015
Economic Freedom Quartiles
0.0946
0.0791
0.05200.0454
0.0
0.2
0.4
0.6
0.8
1.0
Most FreeSecondThirdLeast Free
Source: Economic Freedom of the World: 2017 Annual Report; author’s calculations.
Aver
age
EFW
ratin
g
Figure 3.2: Average GDI scores, sorted by adjusted and unadjusted EFW quartiles, 2015
Economic Freedom Quartiles
0.760.85 0.86
0.91 0.94
0.78
0.910.95

Chapter 3: Adjusting for Gender Disparity in Economic Freedom and Why It Matters • 205
fraserinstitute.org/economic-freedom • Fraser Institute ©2017
Concluding remarks
This chapter details the data and methodology used to incorporate a measure of gender equality under the law to adjust Area 2, Legal System and Property Rights, of the index published in Economic Freedom of the World. As a result of this change, the index now accounts for the fact that some countries place additional legal and regulatory barriers to the economic activities of women, providing esti-mates of economic freedom that capture the experience of women as well as men.
For the majority of countries measured by the EFW index, this gender adjust-ment results in no material change in their overall summary score. For many coun-tries in the Middle East and North Africa, however, this adjustment results in a notable downgrading of their economic freedom scores. In the past, the economic freedom in these countries has been overstated as their previous scores for Area 2 only reflected the experience of half of the population. Now, the economic free-dom scores for these countries provide a more accurate measure of economic rights for all members of society.
Examining the patterns in the data leads to several optimistic conclusions. First, the changes in the global average GDI scores indicate that parity under the law has generally been on the rise since 1970. In addition, when looking at the gen-der-adjustment scores for the set of countries with the greatest degree of gender disparity, it is clear that throughout this time period movements towards greater gender equality have been made—even in the places where gender discrimina-tion is the most pronounced.
Further, the relationship between economic freedom and gender equality under the law appears to be a positive one. Countries belonging to the top quar-tile (the most economically free) have higher scores on the Gender Disparity Index than the other quartiles, on average. The average scores on the GDI for the other quartiles steadily declines as economic freedom declines. This pattern holds regardless of whether the countries are sorted into quartiles according to gender-adjusted EFW scores or according to unadjusted EFW scores.
In addition, the average difference between the unadjusted and gender-adjusted EFW scores is smallest when the data are sorted into quartiles according to unad-justed EFW scores. This indicates that countries with greater economic freedom, even when imperfectly measured, have greater gender equality under the law.
As more data become available covering a wider array of equality measures, this adjustment provides a useful framework for incorporating additional mea-sures of equality under the law for other traditionally marginalized groups. In this way, the EFW index will incorporate the experiences of members of these marginalized groups, further increasing the accuracy of the measure. This year’s addition of an adjustment drawn from the Gender Disparity Index into Area 2 of the EFW index is a major step in the right direction.

206 • Economic Freedom of the World: 2017 Annual Report
Fraser Institute ©2017 • fraserinstitute.org/economic-freedom
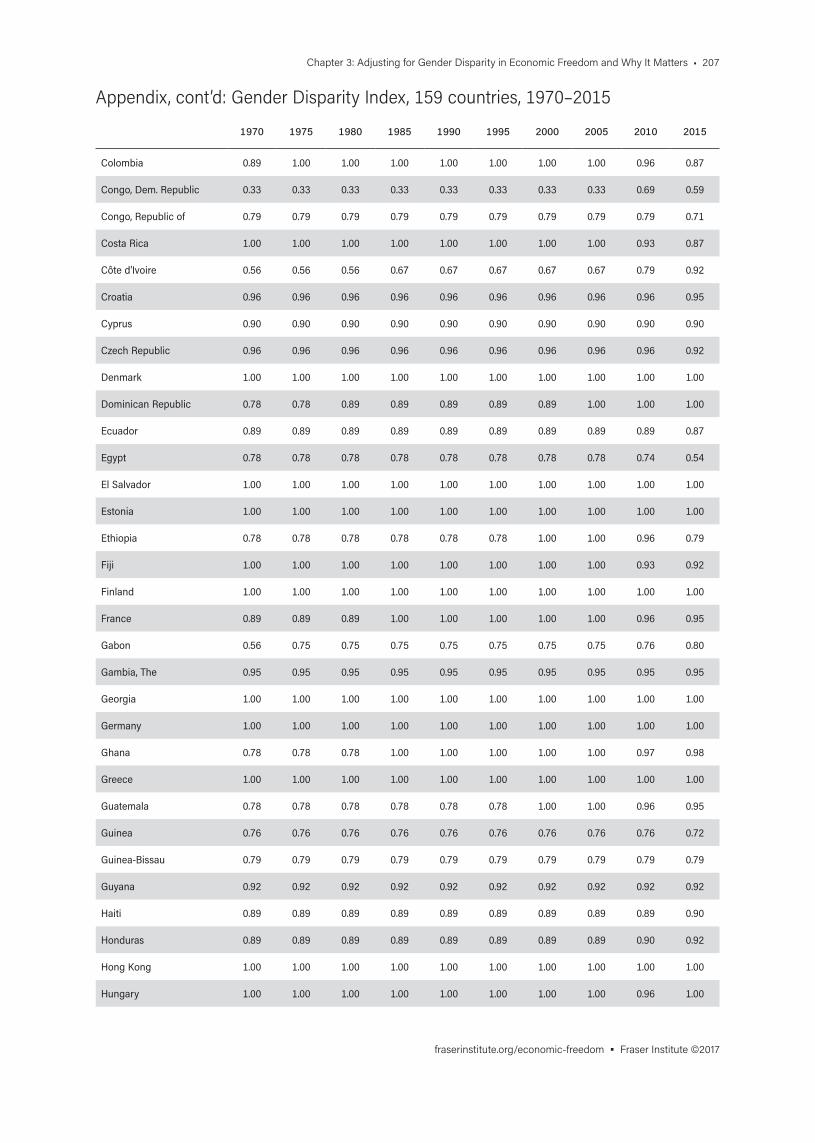
Appendix: Gender Disparity Index, 159 countries, 1970–2015
1970 1975 1980 1985 1990 1995 2000 2005 2010 2015
Albania 0.96 0.96 0.96 0.96 0.96 0.96 0.96 0.96 0.96 0.95
Algeria 0.50 0.63 0.63 0.67 0.67 0.67 0.67 0.78 0.73 0.82
Angola 0.56 0.56 0.56 0.56 1.00 1.00 1.00 1.00 0.96 0.85
Argentina 0.89 0.89 0.89 0.89 0.89 0.89 0.89 1.00 0.96 0.77
Armenia 1.00 1.00 1.00 1.00 1.00 1.00 1.00 1.00 1.00 1.00
Australia 1.00 1.00 1.00 1.00 1.00 1.00 1.00 1.00 1.00 1.00
Austria 0.33 1.00 1.00 1.00 1.00 1.00 1.00 1.00 1.00 1.00
Azerbaijan 0.92 0.92 0.92 0.92 0.92 0.92 0.92 0.92 0.92 0.72
Bahamas 0.95 0.95 0.95 0.95 0.95 0.95 0.95 0.95 0.95 0.95
Bahrain 0.54 0.54 0.54 0.54 0.54 0.54 0.54 0.54 0.54 0.54
Bangladesh 0.78 0.78 0.78 0.78 0.78 0.78 0.78 0.78 0.81 0.79
Barbados 0.87 0.87 0.87 0.87 0.87 0.87 0.87 0.87 0.87 0.87
Belgium 0.56 0.56 1.00 1.00 1.00 1.00 1.00 1.00 0.96 1.00
Belize 0.84 0.84 0.84 0.84 0.84 0.84 0.84 0.84 0.84 0.84
Benin 0.11 0.00 0.11 0.11 0.11 0.11 0.11 1.00 0.86 0.66
Bhutan 0.92 0.92 0.92 0.92 0.92 0.92 0.92 0.92 0.92 0.92
Bolivia 0.78 0.89 0.89 0.89 0.89 0.89 0.89 0.89 0.89 0.87
Bosnia and Herzegovina 0.96 0.96 0.96 0.96 0.96 0.96 0.96 0.96 0.96 0.87
Botswana 1.00 1.00 1.00 1.00 1.00 1.00 1.00 1.00 0.96 0.97
Brazil 0.56 0.56 0.56 0.56 1.00 1.00 1.00 1.00 0.96 0.92
Brunei Darussalam 0.79 0.79 0.79 0.79 0.79 0.79 0.79 0.79 0.79 0.79
Bulgaria 1.00 1.00 1.00 1.00 1.00 1.00 1.00 1.00 0.96 0.85
Burkina Faso 0.56 0.56 0.56 0.56 1.00 1.00 1.00 1.00 0.96 0.87
Burundi 0.86 0.86 0.86 0.86 0.86 0.86 0.86 0.86 0.86 0.90
Cambodia 0.88 0.88 0.88 0.88 0.88 0.89 0.89 0.89 1.00 1.00
Cameroon 0.56 0.56 0.56 0.56 0.56 0.56 0.56 0.56 0.76 0.59
Canada 1.00 1.00 1.00 1.00 1.00 1.00 1.00 1.00 1.00 1.00
Cape Verde 1.00 1.00 1.00 1.00 1.00 1.00 1.00 1.00 1.00 1.00
Central African Republic 0.67 0.67 0.67 0.67 0.67 0.67 0.89 0.89 0.69 0.69
Chad 0.79 0.79 0.79 0.79 0.79 0.79 0.79 0.79 0.79 0.72
Chile 0.78 0.78 0.78 0.78 0.78 0.78 0.78 0.78 0.90 0.90
China 0.67 0.67 0.67 1.00 1.00 1.00 1.00 1.00 0.96 0.87
Chapter 3: Adjusting for Gender Disparity in Economic Freedom and Why It Matters • 207
fraserinstitute.org/economic-freedom • Fraser Institute ©2017
Appendix, cont’d: Gender Disparity Index, 159 countries, 1970–2015
1970 1975 1980 1985 1990 1995 2000 2005 2010 2015
Colombia 0.89 1.00 1.00 1.00 1.00 1.00 1.00 1.00 0.96 0.87
Congo, Dem. Republic 0.33 0.33 0.33 0.33 0.33 0.33 0.33 0.33 0.69 0.59
Congo, Republic of 0.79 0.79 0.79 0.79 0.79 0.79 0.79 0.79 0.79 0.71
Costa Rica 1.00 1.00 1.00 1.00 1.00 1.00 1.00 1.00 0.93 0.87
Côte d’Ivoire 0.56 0.56 0.56 0.67 0.67 0.67 0.67 0.67 0.79 0.92
Croatia 0.96 0.96 0.96 0.96 0.96 0.96 0.96 0.96 0.96 0.95
Cyprus 0.90 0.90 0.90 0.90 0.90 0.90 0.90 0.90 0.90 0.90
Czech Republic 0.96 0.96 0.96 0.96 0.96 0.96 0.96 0.96 0.96 0.92
Denmark 1.00 1.00 1.00 1.00 1.00 1.00 1.00 1.00 1.00 1.00
Dominican Republic 0.78 0.78 0.89 0.89 0.89 0.89 0.89 1.00 1.00 1.00
Ecuador 0.89 0.89 0.89 0.89 0.89 0.89 0.89 0.89 0.89 0.87
Egypt 0.78 0.78 0.78 0.78 0.78 0.78 0.78 0.78 0.74 0.54
El Salvador 1.00 1.00 1.00 1.00 1.00 1.00 1.00 1.00 1.00 1.00
Estonia 1.00 1.00 1.00 1.00 1.00 1.00 1.00 1.00 1.00 1.00
Ethiopia 0.78 0.78 0.78 0.78 0.78 0.78 1.00 1.00 0.96 0.79
Fiji 1.00 1.00 1.00 1.00 1.00 1.00 1.00 1.00 0.93 0.92
Finland 1.00 1.00 1.00 1.00 1.00 1.00 1.00 1.00 1.00 1.00
France 0.89 0.89 0.89 1.00 1.00 1.00 1.00 1.00 0.96 0.95
Gabon 0.56 0.75 0.75 0.75 0.75 0.75 0.75 0.75 0.76 0.80
Gambia, The 0.95 0.95 0.95 0.95 0.95 0.95 0.95 0.95 0.95 0.95
Georgia 1.00 1.00 1.00 1.00 1.00 1.00 1.00 1.00 1.00 1.00
Germany 1.00 1.00 1.00 1.00 1.00 1.00 1.00 1.00 1.00 1.00
Ghana 0.78 0.78 0.78 1.00 1.00 1.00 1.00 1.00 0.97 0.98
Greece 1.00 1.00 1.00 1.00 1.00 1.00 1.00 1.00 1.00 1.00
Guatemala 0.78 0.78 0.78 0.78 0.78 0.78 1.00 1.00 0.96 0.95
Guinea 0.76 0.76 0.76 0.76 0.76 0.76 0.76 0.76 0.76 0.72
Guinea-Bissau 0.79 0.79 0.79 0.79 0.79 0.79 0.79 0.79 0.79 0.79
Guyana 0.92 0.92 0.92 0.92 0.92 0.92 0.92 0.92 0.92 0.92
Haiti 0.89 0.89 0.89 0.89 0.89 0.89 0.89 0.89 0.89 0.90
Honduras 0.89 0.89 0.89 0.89 0.89 0.89 0.89 0.89 0.90 0.92
Hong Kong 1.00 1.00 1.00 1.00 1.00 1.00 1.00 1.00 1.00 1.00
Hungary 1.00 1.00 1.00 1.00 1.00 1.00 1.00 1.00 0.96 1.00

208 • Economic Freedom of the World: 2017 Annual Report
Fraser Institute ©2017 • fraserinstitute.org/economic-freedom
Appendix, cont’d: Gender Disparity Index, 159 countries, 1970–2015
1970 1975 1980 1985 1990 1995 2000 2005 2010 2015
Iceland 1.00 1.00 1.00 1.00 1.00 1.00 1.00 1.00 1.00 1.00
India 0.78 0.78 0.78 0.78 0.78 1.00 1.00 1.00 0.96 0.78
Indonesia 0.33 0.67 0.67 0.67 0.56 0.56 0.67 0.67 0.90 0.93
Iran 0.56 0.67 0.56 0.56 0.56 0.56 0.56 0.56 0.52 0.59
Ireland 1.00 1.00 1.00 1.00 1.00 1.00 1.00 1.00 1.00 1.00
Israel 0.96 0.96 0.96 0.96 0.96 0.96 0.96 0.96 0.96 0.95
Italy 0.89 1.00 1.00 1.00 1.00 1.00 1.00 1.00 1.00 1.00
Jamaica 1.00 1.00 1.00 1.00 1.00 1.00 1.00 1.00 0.93 0.95
Japan 1.00 1.00 1.00 1.00 1.00 1.00 1.00 1.00 0.97 0.95
Jordan 0.56 0.56 0.56 0.56 0.56 0.56 0.56 0.56 0.48 0.49
Kazakhstan 1.00 1.00 1.00 1.00 1.00 1.00 1.00 1.00 0.96 0.74
Kenya 1.00 1.00 1.00 0.89 0.89 0.89 0.89 0.89 0.78 0.92
Korea, South 0.78 0.78 0.78 0.78 1.00 1.00 1.00 1.00 0.96 0.92
Kuwait 0.59 0.59 0.59 0.59 0.59 0.59 0.59 0.59 0.59 0.49
Kyrgyz Republic 1.00 1.00 1.00 1.00 1.00 1.00 1.00 1.00 0.96 0.74
Laos 0.89 1.00 1.00 1.00 1.00 1.00 1.00 1.00 1.00 1.00
Latvia 1.00 1.00 1.00 1.00 1.00 1.00 1.00 1.00 1.00 1.00
Lebanon 0.78 0.78 0.78 0.78 0.78 0.78 0.78 0.78 0.78 0.74
Lesotho 0.00 0.00 0.11 0.11 0.11 0.33 0.33 0.33 0.93 0.89
Liberia 0.78 0.89 0.89 0.89 0.89 0.89 0.89 0.89 1.00 1.00
Libya 0.80 0.80 0.80 0.80 0.80 0.80 0.80 0.80 0.80 0.80
Lithuania 1.00 1.00 1.00 1.00 1.00 1.00 1.00 1.00 1.00 1.00
Luxembourg 1.00 1.00 1.00 1.00 1.00 1.00 1.00 1.00 1.00 1.00
Macedonia 0.96 0.96 0.96 0.96 0.96 0.96 0.96 0.96 0.96 0.90
Madagascar 0.56 0.56 0.56 0.56 0.56 0.56 0.56 0.56 0.86 0.71
Malawi 0.89 0.89 0.89 0.89 0.89 1.00 1.00 1.00 0.93 0.95
Malaysia 0.78 0.78 0.78 0.78 0.78 0.78 0.78 0.78 0.67 0.67
Mali 0.71 0.71 0.71 0.71 0.71 0.71 0.56 0.56 0.72 0.66
Malta 1.00 1.00 1.00 1.00 1.00 1.00 1.00 1.00 1.00 1.00
Mauritania 0.33 0.33 0.33 0.33 0.33 0.33 0.33 0.33 0.66 0.61
Mauritius 1.00 1.00 1.00 1.00 1.00 1.00 1.00 1.00 1.00 0.97
Mexico 1.00 1.00 1.00 1.00 1.00 1.00 1.00 1.00 1.00 1.00

Chapter 3: Adjusting for Gender Disparity in Economic Freedom and Why It Matters • 209
fraserinstitute.org/economic-freedom • Fraser Institute ©2017
Appendix, cont’d: Gender Disparity Index, 159 countries, 1970–2015
1970 1975 1980 1985 1990 1995 2000 2005 2010 2015
Moldova 0.93 0.93 0.93 0.93 0.93 0.93 0.93 0.93 0.93 0.72
Mongolia 1.00 1.00 1.00 1.00 1.00 1.00 1.00 1.00 0.93 0.87
Montenegro 0.96 0.96 0.96 0.96 0.96 0.96 0.96 0.96 0.96 0.82
Morocco 0.44 0.44 0.44 0.44 0.44 0.44 0.67 0.78 0.83 0.76
Mozambique 0.50 0.44 0.56 0.56 0.56 0.56 0.56 1.00 0.96 0.95
Myanmar 0.93 0.93 0.93 0.93 0.93 0.93 0.93 0.93 0.93 0.93
Namibia 0.25 0.25 0.25 0.25 0.33 0.33 1.00 1.00 1.00 1.00
Nepal 0.56 0.56 0.56 0.56 0.56 0.56 0.56 0.78 0.78 0.84
Netherlands 0.89 1.00 1.00 1.00 1.00 1.00 1.00 1.00 1.00 1.00
New Zealand 1.00 1.00 1.00 1.00 1.00 1.00 1.00 1.00 1.00 1.00
Nicaragua 0.89 0.89 0.89 0.89 0.89 0.89 0.89 0.89 0.90 0.95
Niger 0.29 0.29 0.29 0.29 0.29 0.29 0.29 0.29 0.76 0.65
Nigeria 0.93 0.93 0.93 0.93 0.93 0.93 0.93 0.93 0.93 0.85
Norway 1.00 1.00 1.00 1.00 1.00 1.00 1.00 1.00 1.00 1.00
Oman 0.59 0.59 0.59 0.59 0.59 0.59 0.59 0.59 0.59 0.61
Pakistan 0.78 0.78 0.78 0.78 0.78 0.78 0.78 0.78 0.74 0.69
Panama 0.96 0.96 0.96 0.96 0.96 0.96 0.96 0.96 0.96 0.95
Papua New Guinea 1.00 1.00 1.00 1.00 1.00 1.00 1.00 1.00 0.93 0.90
Paraguay 0.33 0.33 0.33 0.33 0.78 1.00 1.00 1.00 1.00 1.00
Peru 0.67 0.67 0.67 1.00 1.00 1.00 1.00 1.00 1.00 1.00
Philippines 0.78 0.78 0.78 0.78 0.89 0.89 0.89 0.89 0.83 0.90
Poland 0.96 0.96 0.96 0.96 0.96 0.96 0.96 0.96 0.96 0.85
Portugal 0.56 0.56 1.00 1.00 1.00 1.00 1.00 1.00 1.00 1.00
Qatar 0.62 0.62 0.62 0.62 0.62 0.62 0.62 0.62 0.62 0.62
Romania 1.00 1.00 1.00 1.00 1.00 1.00 1.00 1.00 1.00 1.00
Russia 1.00 1.00 1.00 1.00 1.00 1.00 1.00 1.00 0.96 0.74
Rwanda 0.17 0.17 0.17 0.17 0.83 0.83 0.89 0.89 0.93 0.95
Saudi Arabia 0.41 0.41 0.41 0.41 0.41 0.41 0.41 0.41 0.41 0.41
Senegal 0.56 0.56 0.56 0.56 0.67 0.67 0.67 0.67 0.76 0.68
Serbia 1.00 1.00 1.00 1.00 1.00 1.00 1.00 1.00 1.00 1.00
Seychelles 0.97 0.97 0.97 0.97 0.97 0.97 0.97 0.97 0.97 0.97
Sierra Leone 0.89 0.89 0.89 0.89 0.89 0.89 0.89 0.89 0.82 0.85

210 • Economic Freedom of the World: 2017 Annual Report
Fraser Institute ©2017 • fraserinstitute.org/economic-freedom
Appendix, cont’d: Gender Disparity Index, 159 countries, 1970–2015
1970 1975 1980 1985 1990 1995 2000 2005 2010 2015
Singapore 1.00 1.00 1.00 1.00 1.00 1.00 1.00 1.00 0.96 0.97
Slovak Republic 1.00 1.00 1.00 1.00 1.00 1.00 1.00 1.00 1.00 1.00
Slovenia 0.93 0.93 0.93 0.93 0.93 0.93 0.93 0.93 0.93 0.95
South Africa 0.00 0.00 0.00 0.00 0.00 0.00 1.00 1.00 1.00 1.00
Spain 0.22 0.22 0.44 1.00 1.00 1.00 1.00 1.00 1.00 1.00
Sri Lanka 1.00 1.00 1.00 1.00 1.00 1.00 1.00 1.00 1.00 0.90
Suriname 0.97 0.97 0.97 0.97 0.97 0.97 0.97 0.97 0.97 0.97
Swaziland 0.69 0.69 0.69 0.69 0.69 0.69 0.69 0.69 0.69 0.69
Sweden 1.00 1.00 1.00 1.00 1.00 1.00 1.00 1.00 1.00 1.00
Switzerland 0.56 0.56 0.56 1.00 1.00 1.00 1.00 1.00 1.00 1.00
Syria 0.56 0.56 0.56 0.56 0.56 0.56 0.56 0.67 0.59 0.46
Taiwan 0.96 0.96 0.96 0.96 0.96 0.96 0.96 0.96 0.96 1.00
Tajikistan 1.00 1.00 1.00 1.00 1.00 1.00 1.00 1.00 0.93 0.72
Tanzania 0.86 0.88 0.88 0.88 0.88 0.88 0.89 0.89 0.89 0.92
Thailand 1.00 1.00 1.00 1.00 1.00 1.00 1.00 1.00 0.93 0.85
Timor-Leste 1.00 1.00 1.00 1.00 1.00 1.00 1.00 1.00 1.00 1.00
Togo 0.71 0.71 0.71 0.71 0.71 0.71 0.71 0.71 0.83 0.93
Trinidad and Tobago 0.97 0.97 0.97 0.97 0.97 0.97 0.97 0.97 0.97 0.97
Tunisia 0.67 0.67 0.67 0.67 0.67 0.67 0.67 0.67 0.72 0.80
Turkey 0.78 0.78 0.78 0.78 0.78 0.78 0.78 1.00 0.93 0.90
Uganda 0.78 0.78 0.78 0.78 0.78 0.78 0.78 0.78 0.96 0.92
Ukraine 1.00 1.00 1.00 1.00 1.00 1.00 1.00 1.00 0.93 0.72
United Arab Emirates 0.59 0.59 0.59 0.59 0.59 0.59 0.59 0.59 0.59 0.51
United Kingdom 1.00 1.00 1.00 1.00 1.00 1.00 1.00 1.00 1.00 1.00
United States 1.00 1.00 1.00 1.00 1.00 1.00 1.00 1.00 1.00 1.00
Uruguay 1.00 1.00 1.00 1.00 1.00 1.00 1.00 1.00 1.00 1.00
Venezuela 1.00 1.00 1.00 1.00 1.00 1.00 1.00 1.00 1.00 1.00
Vietnam 1.00 1.00 1.00 1.00 1.00 1.00 1.00 1.00 0.97 0.78
Yemen, Republic 0.71 0.71 0.71 0.71 0.63 0.67 0.56 0.56 0.62 0.63
Zambia 1.00 1.00 1.00 1.00 1.00 1.00 1.00 1.00 1.00 1.00
Zimbabwe 0.00 0.00 0.00 0.86 0.86 1.00 1.00 1.00 0.96 0.85

Chapter 3: Adjusting for Gender Disparity in Economic Freedom and Why It Matters • 211
fraserinstitute.org/economic-freedom • Fraser Institute ©2017
References
Fike, Rosemarie (2016). Gender Disparity in Legal Rights and Its Effect on Economic Freedom. In James Gwartney, Robert Lawson, and Joshua Hall, Economic Freedom of the World: 2016 Annual Report (Fraser Institute): 189-211. <https://www.fraserinstitute.org/studies/economic-freedom-of-the-world-2016-annual-report>.
Hallward-Driemeier, Mary, Tazeen Hasan, and Anca Bogdana Rusu (2013). Women’s Legal Rights over 50 Years: Progress, Stagnation or Regression? Policy Research working paper WPS 6616. World Bank Group. <http://documents.worldbank.org/curated/en/312581468338398063/Womens-legal-rights-over-50-years-progress-stagnation-or-regression>.
World Bank (2009). Women, Business and the Law 2010: Measuring Legal Gender Parity for Entrepreneurs and Workers. World Bank. <http://wbl.worldbank.org/~/media/WBG/WBL/Documents/Reports/2010/Women-Business-Law.pdf?la=en>.
World Bank (2011). Women, Business and the Law 2012: Removing Barriers to Economic Inclusion. World Bank. <http://wbl.worldbank.org/~/media/WBG/WBL/Documents/Reports/2012/Women-Business-and-the-Law-2012.pdf>.
World Bank (2013a). 50 Years of Women’s Legal Rights. World Bank. <http://wbl.worldbank.org/data/timeseries>.
World Bank (2013b) Women, Business and the Law 2014: Removing Restrictions to Enhance Gender Equality. World Bank. <http://wbl.worldbank.org/~/media/WBG/WBL/Documents/Reports/2014/Women-Business-and-the-Law-2014-FullReport.pdf?la=en>.
World Bank (2015). Women, Business and the Law 2016: Getting to Equal. World Bank. <http://wbl.worldbank.org/~/media/WBG/WBL/Documents/Reports/2016/Women-Business-and-the-Law-2016.pdf>.