CHAPTER 3: ACCESS - health.gov.aucontent/3E9BDF63D…24 CHAPTER 3: ACCESS 3.1 OVERVIEW This chapter...
35
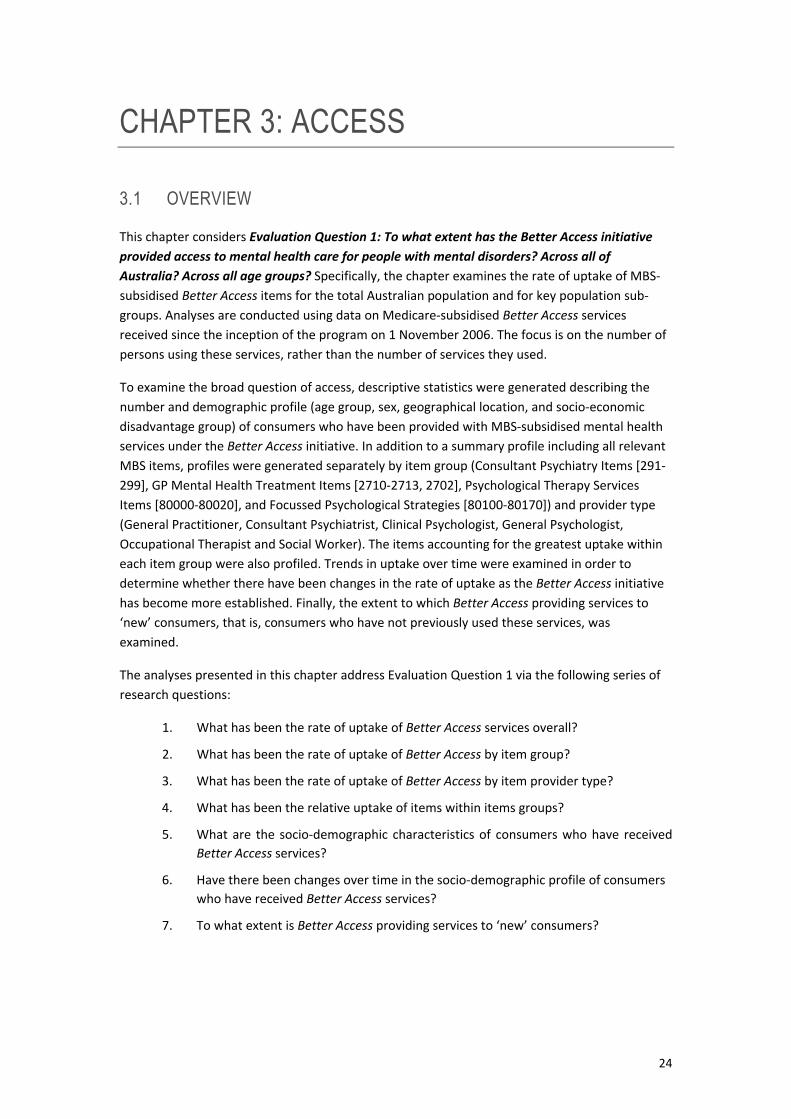
24 CHAPTER 3: ACCESS 3.1 OVERVIEW This chapter considers Evaluation Question 1: To what extent has the Better Access initiative provided access to mental health care for people with mental disorders? Across all of Australia? Across all age groups? Specifically, the chapter examines the rate of uptake of MBS‐ subsidised Better Access items for the total Australian population and for key population sub‐ groups. Analyses are conducted using data on Medicare‐subsidised Better Access services received since the inception of the program on 1 November 2006. The focus is on the number of persons using these services, rather than the number of services they used. To examine the broad question of access, descriptive statistics were generated describing the number and demographic profile (age group, sex, geographical location, and socio‐economic disadvantage group) of consumers who have been provided with MBS‐subsidised mental health services under the Better Access initiative. In addition to a summary profile including all relevant MBS items, profiles were generated separately by item group (Consultant Psychiatry Items [291‐ 299], GP Mental Health Treatment Items [2710‐2713, 2702], Psychological Therapy Services Items [80000‐80020], and Focussed Psychological Strategies [80100‐80170]) and provider type (General Practitioner, Consultant Psychiatrist, Clinical Psychologist, General Psychologist, Occupational Therapist and Social Worker). The items accounting for the greatest uptake within each item group were also profiled. Trends in uptake over time were examined in order to determine whether there have been changes in the rate of uptake as the Better Access initiative has become more established. Finally, the extent to which Better Access providing services to ‘new’ consumers, that is, consumers who have not previously used these services, was examined. The analyses presented in this chapter address Evaluation Question 1 via the following series of research questions: 1. What has been the rate of uptake of Better Access services overall? 2. What has been the rate of uptake of Better Access by item group? 3. What has been the rate of uptake of Better Access by item provider type? 4. What has been the relative uptake of items within items groups? 5. What are the socio‐demographic characteristics of consumers who have received Better Access services? 6. Have there been changes over time in the socio‐demographic profile of consumers who have received Better Access services? 7. To what extent is Better Access providing services to ‘new’ consumers?
Transcript of CHAPTER 3: ACCESS - health.gov.aucontent/3E9BDF63D…24 CHAPTER 3: ACCESS 3.1 OVERVIEW This chapter...
24
CHAPTER 3: ACCESS
3.1 OVERVIEW
This chapter considers Evaluation Question 1: To what extent has the Better Access initiative provided access to mental health care for people with mental disorders? Across all of Australia? Across all age groups? Specifically, the chapter examines the rate of uptake of MBS‐subsidised Better Access items for the total Australian population and for key population sub‐groups. Analyses are conducted using data on Medicare‐subsidised Better Access services received since the inception of the program on 1 November 2006. The focus is on the number of persons using these services, rather than the number of services they used.
To examine the broad question of access, descriptive statistics were generated describing the number and demographic profile (age group, sex, geographical location, and socio‐economic disadvantage group) of consumers who have been provided with MBS‐subsidised mental health services under the Better Access initiative. In addition to a summary profile including all relevant MBS items, profiles were generated separately by item group (Consultant Psychiatry Items [291‐299], GP Mental Health Treatment Items [2710‐2713, 2702], Psychological Therapy Services Items [80000‐80020], and Focussed Psychological Strategies [80100‐80170]) and provider type (General Practitioner, Consultant Psychiatrist, Clinical Psychologist, General Psychologist, Occupational Therapist and Social Worker). The items accounting for the greatest uptake within each item group were also profiled. Trends in uptake over time were examined in order to determine whether there have been changes in the rate of uptake as the Better Access initiative has become more established. Finally, the extent to which Better Access providing services to ‘new’ consumers, that is, consumers who have not previously used these services, was examined.
The analyses presented in this chapter address Evaluation Question 1 via the following series of research questions:
1. What has been the rate of uptake of Better Access services overall?
2. What has been the rate of uptake of Better Access by item group?
3. What has been the rate of uptake of Better Access by item provider type?
4. What has been the relative uptake of items within items groups?
5. What are the socio‐demographic characteristics of consumers who have received Better Access services?
6. Have there been changes over time in the socio‐demographic profile of consumers who have received Better Access services?
7. To what extent is Better Access providing services to ‘new’ consumers?
25
3.2 WHAT HAS BEEN THE RATE OF UPTAKE OF BETTER ACCESS SERVICES OVERALL?
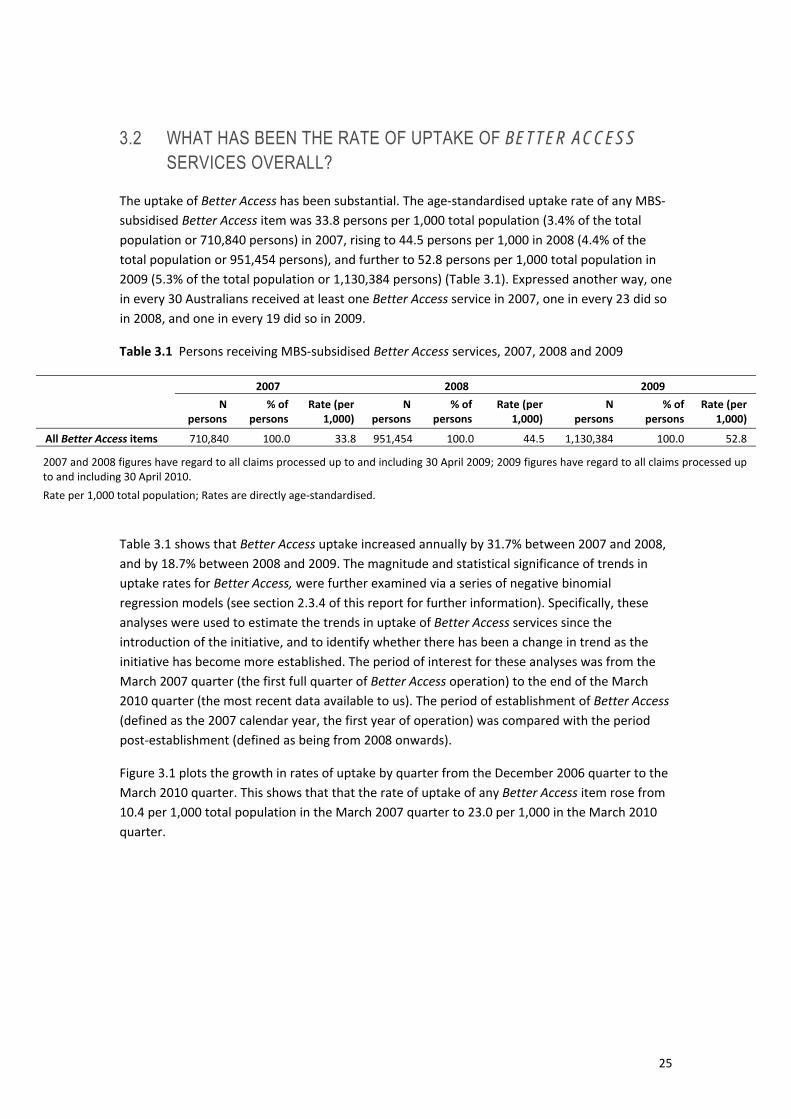
The uptake of Better Access has been substantial. The age‐standardised uptake rate of any MBS‐subsidised Better Access item was 33.8 persons per 1,000 total population (3.4% of the total population or 710,840 persons) in 2007, rising to 44.5 persons per 1,000 in 2008 (4.4% of the total population or 951,454 persons), and further to 52.8 persons per 1,000 total population in 2009 (5.3% of the total population or 1,130,384 persons) (Table 3.1). Expressed another way, one in every 30 Australians received at least one Better Access service in 2007, one in every 23 did so in 2008, and one in every 19 did so in 2009.
Table 3.1 Persons receiving MBS‐subsidised Better Access services, 2007, 2008 and 2009
2007 2008 2009 N
persons % of
persons Rate (per
1,000) N
persons % of
persons Rate (per
1,000) N
persons % of
persons Rate (per
1,000)
All Better Access items 710,840 100.0 33.8 951,454 100.0 44.5 1,130,384 100.0 52.8
2007 and 2008 figures have regard to all claims processed up to and including 30 April 2009; 2009 figures have regard to all claims processed up to and including 30 April 2010. Rate per 1,000 total population; Rates are directly age‐standardised.
Table 3.1 shows that Better Access uptake increased annually by 31.7% between 2007 and 2008, and by 18.7% between 2008 and 2009. The magnitude and statistical significance of trends in uptake rates for Better Access, were further examined via a series of negative binomial regression models (see section 2.3.4 of this report for further information). Specifically, these analyses were used to estimate the trends in uptake of Better Access services since the introduction of the initiative, and to identify whether there has been a change in trend as the initiative has become more established. The period of interest for these analyses was from the March 2007 quarter (the first full quarter of Better Access operation) to the end of the March 2010 quarter (the most recent data available to us). The period of establishment of Better Access (defined as the 2007 calendar year, the first year of operation) was compared with the period post‐establishment (defined as being from 2008 onwards).
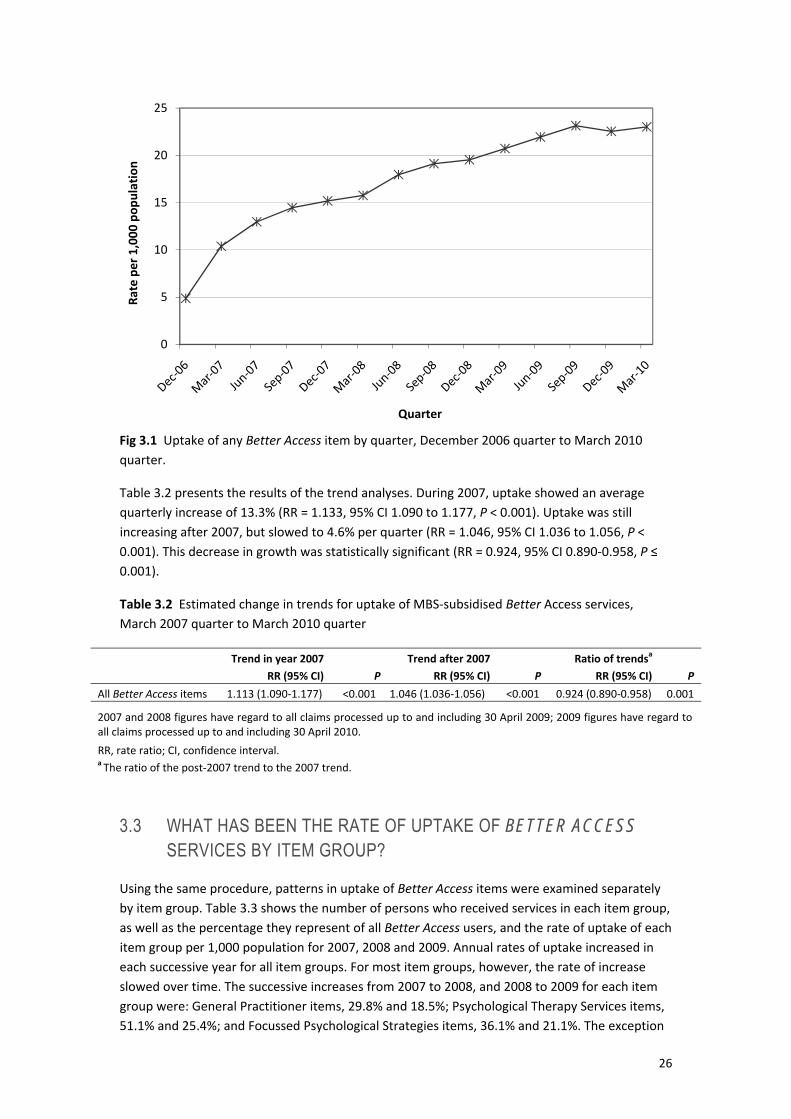
Figure 3.1 plots the growth in rates of uptake by quarter from the December 2006 quarter to the March 2010 quarter. This shows that that the rate of uptake of any Better Access item rose from 10.4 per 1,000 total population in the March 2007 quarter to 23.0 per 1,000 in the March 2010 quarter.
26
Fig 3.1 Uptake of any Better Access item by quarter, December 2006 quarter to March 2010 quarter.
Table 3.2 presents the results of the trend analyses. During 2007, uptake showed an average quarterly increase of 13.3% (RR = 1.133, 95% CI 1.090 to 1.177, P < 0.001). Uptake was still increasing after 2007, but slowed to 4.6% per quarter (RR = 1.046, 95% CI 1.036 to 1.056, P < 0.001). This decrease in growth was statistically significant (RR = 0.924, 95% CI 0.890‐0.958, P ≤ 0.001).
Table 3.2 Estimated change in trends for uptake of MBS‐subsidised Better Access services, March 2007 quarter to March 2010 quarter
Trend in year 2007 Trend after 2007 Ratio of trendsa RR (95% CI) P RR (95% CI) P RR (95% CI) P All Better Access items 1.113 (1.090‐1.177) <0.001 1.046 (1.036‐1.056) <0.001 0.924 (0.890‐0.958) 0.001
2007 and 2008 figures have regard to all claims processed up to and including 30 April 2009; 2009 figures have regard to all claims processed up to and including 30 April 2010. RR, rate ratio; CI, confidence interval. a The ratio of the post‐2007 trend to the 2007 trend.
3.3 WHAT HAS BEEN THE RATE OF UPTAKE OF BETTER ACCESS SERVICES BY ITEM GROUP?
Using the same procedure, patterns in uptake of Better Access items were examined separately by item group. Table 3.3 shows the number of persons who received services in each item group, as well as the percentage they represent of all Better Access users, and the rate of uptake of each item group per 1,000 population for 2007, 2008 and 2009. Annual rates of uptake increased in each successive year for all item groups. For most item groups, however, the rate of increase slowed over time. The successive increases from 2007 to 2008, and 2008 to 2009 for each item group were: General Practitioner items, 29.8% and 18.5%; Psychological Therapy Services items, 51.1% and 25.4%; and Focussed Psychological Strategies items, 36.1% and 21.1%. The exception
0
5
10
15
20
25
Rate per 1,000
pop
ulation
Quarter

27
was the Consultant Psychiatry items, for which rates increased by 4.8% between 2007 to 2008 and by 6.8% between 2008 and 2009.
Table 3.3 Persons receiving MBS‐subsidised Better Access services by item group, 2007, 2008 and 2009
2007 2008 2009 N
persons % of
persons Rate (per
1,000) N
persons % of
persons Rate (per
1,000) N
persons % of
persons Rate (per
1,000)
Item group GP items 618,867 87.1 29.5 817,738 85.9 38.3 971,836 86.0 45.4 CP items 87,947 12.4 4.2 93,736 9.9 4.4 100,434 8.9 4.7 PTS items 98,612 13.9 4.7 151,587 15.9 7.1 189,418 16.8 8.9 FPS items 226,169 31.8 10.8 312,035 32.8 14.7 379,284 33.6 17.8
All Better Access itemsa 710,840 33.8 951,454 44.5 1,130,384 52.8
2007 and 2008 figures have regard to all claims processed up to and including 30 April 2009; 2009 figures have regard to all claims processed up to and including 30 April 2010. GP, General practitioner; CP, Consultant Psychiatry; PTS Psychological Therapy Services; FPS, Focussed Psychological Strategies; Rate per 1,000 total population; Rates are directly age‐standardised. a The sum of persons receiving services under each item group will be greater than for all Better Access items because a person may receive services from more than one item group.
Table 3.3 shows the relative percentage of Better Access users who used each of the item groups:
• In each of 2007, 2008 and 2009, the majority of Better Access service users received at least one of the GP Mental Health Treatment items, which reflects the function of the GP Mental Health Treatment Plan (2710) and Review (2712) items as ‘gateways’ to further Better Access services.
• Uptake of the Focussed Psychological Strategies items was the second greatest in magnitude, with approximately one‐third of Better Access service users receiving at least one of these services (31.8% in 2007, 32.8% in 2008, and 33.6% in 2009).
• Uptake of Psychological Therapy Services items was the third greatest in magnitude with 13.9% of Better Access users receiving at least one of these services in 2007, 15.9% in 2008, and 16.8% in 2009.
• Uptake of the Consultant Psychiatry items was the smallest in magnitude, with 12.4% of Better Access users receiving at least one of these services in 2007, 9.9% in 2008, and 8.9% in 2009.
Figure 3.2 plots the growth in rates of uptake for each item group from the December 2006 quarter to the March 2010 quarter, for each item group.

28
Fig 3.2 Uptake of Better Access item groups by quarter, December 2006 quarter to March 2010 quarter.
Comparisons of the 2007 and post‐2007 trends for each item group are shown in Table 3.4.
Table 3.4 Estimated change in trends for uptake of MBS‐subsidised Better Access services by Item group, March 2007 quarter to March 2010 quarter
Trend in year 2007 Trend after 2007 Ratio of trendsa RR (95% CI) P RR (95% CI) P RR (95% CI) P GP items 1.073 (1.051‐1.094) <0.001 1.044 (1.035‐1.053) <0.001 0.973 (0.945‐1.002) 0.067 CP items 1.008 (1.982‐1.034) 0.567 1.009 (0.995‐1.022) 0.198 1.001 (0.959‐1.045) 0.958 PTS items 1.238 (1.138‐1.348) <0.001 1.056 (1.041‐1.072) <0.001 0.853 (0.798‐0.912) <0.001 FPS items 1.204 (1.123‐1.291) <0.001 1.048 (1.034‐1.062) <0.001 0.871 (0.822‐0.922) <0.001
2007 and 2008 figures have regard to all claims processed up to and including 30 April 2009; 2009 figures have regard to all claims processed up to and including 30 April 2010. GP, General practitioner; CP, Consultant psychiatrist; PTS Psychological Therapy Services; FPS, Focussed Psychological Strategies; RR, rate ratio; CI, confidence interval. a The ratio of the post‐2007 trend to the 2007 trend.
Together, Figure 3.2 and Table 3.4 indicate that:
• The rate of uptake of any GP Mental Health Treatment Better Access item rose significantly from 8.3 persons per 1,000 total population in the March 2007 quarter to 16.4 persons per 1,000 in the March 2010 quarter. Uptake of these items increased significantly in both the 2007 (RR = 1.073; P < 0.001) and post‐2007 (RR = 1.044; P < 0.001) periods. Although the rate of growth was somewhat lower in the post‐2007 period, the change in the rate of growth from 2007 was not statistically significant.
0
2
4
6
8
10
12
14
16
18
20
Rate per 1,000
pop
ulation
Quarter
General Practitioner Mental Health TreatmentConsultant psychiatryPsychological therapiesFocussed psychological strategies
29
• The rates of uptake of any Consultant Psychiatry Better Access item were stable between the March 2007 quarter (1.2 persons per 1,000 total population) and the March 2010 quarter (1.2 persons per 1,000 total population). The analysis of trends showed that there was no significant trend in uptake within or between the 2007 and post‐2007 periods.
• The rate of uptake of any Psychological Therapy Services Better Access item rose from 1.3 persons per 1,000 total population in the March 2007 quarter to 4.2 persons per 1,000 in the March 2010 quarter. The rate of uptake of any Focussed Psychological Strategies Better Access item rose from 3.1 per 1,000 total population in the March 2007 quarter to 7.9 per 1,000 in the March 2010 quarter. Uptake of Psychological Therapy Services and Focussed Psychological Strategies items grew significantly in both the 2007 and post‐2007 periods, but the rate of growth was significantly slower after 2007.
3.4 WHAT HAS BEEN THE RATE OF UPTAKE OF BETTER ACCESS SERVICES BY PROVIDER TYPE?
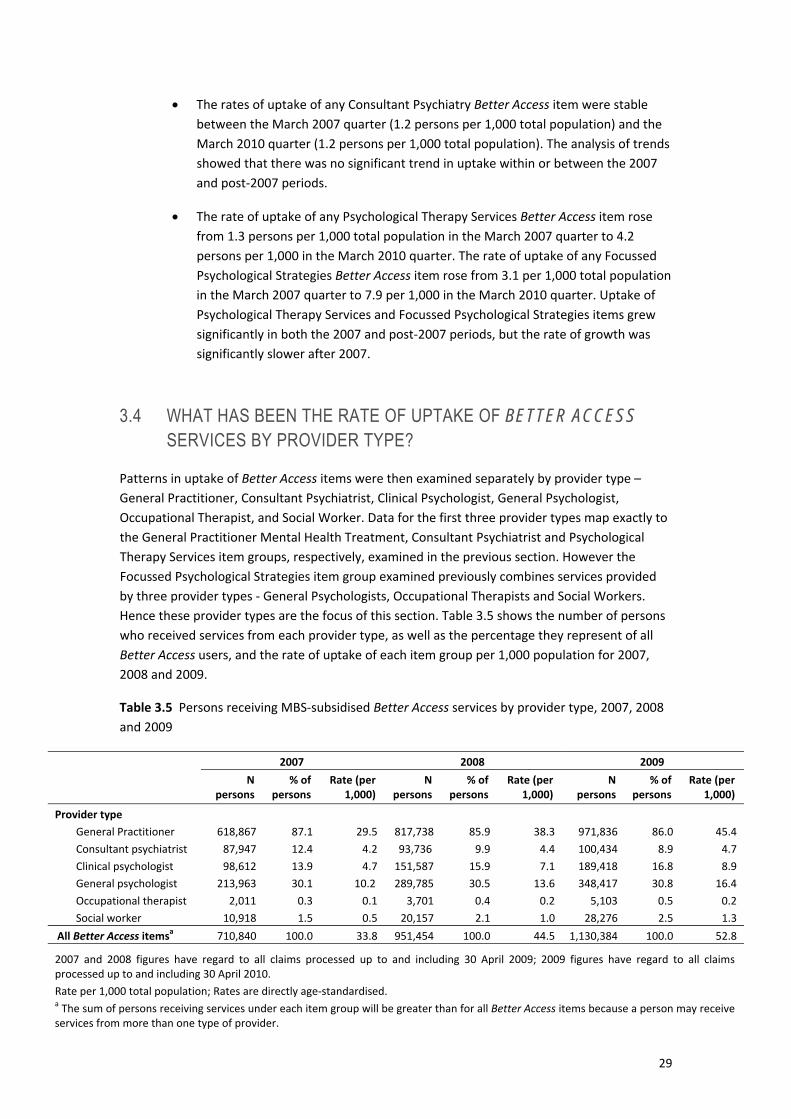
Patterns in uptake of Better Access items were then examined separately by provider type – General Practitioner, Consultant Psychiatrist, Clinical Psychologist, General Psychologist, Occupational Therapist, and Social Worker. Data for the first three provider types map exactly to the General Practitioner Mental Health Treatment, Consultant Psychiatrist and Psychological Therapy Services item groups, respectively, examined in the previous section. However the Focussed Psychological Strategies item group examined previously combines services provided by three provider types ‐ General Psychologists, Occupational Therapists and Social Workers. Hence these provider types are the focus of this section. Table 3.5 shows the number of persons who received services from each provider type, as well as the percentage they represent of all Better Access users, and the rate of uptake of each item group per 1,000 population for 2007, 2008 and 2009.
Table 3.5 Persons receiving MBS‐subsidised Better Access services by provider type, 2007, 2008 and 2009
2007 2008 2009 N
persons % of
persons Rate (per
1,000) N
persons % of
persons Rate (per
1,000) N
persons % of
persons Rate (per
1,000)
Provider type General Practitioner 618,867 87.1 29.5 817,738 85.9 38.3 971,836 86.0 45.4 Consultant psychiatrist 87,947 12.4 4.2 93,736 9.9 4.4 100,434 8.9 4.7 Clinical psychologist 98,612 13.9 4.7 151,587 15.9 7.1 189,418 16.8 8.9 General psychologist 213,963 30.1 10.2 289,785 30.5 13.6 348,417 30.8 16.4 Occupational therapist 2,011 0.3 0.1 3,701 0.4 0.2 5,103 0.5 0.2 Social worker 10,918 1.5 0.5 20,157 2.1 1.0 28,276 2.5 1.3
All Better Access itemsa 710,840 100.0 33.8 951,454 100.0 44.5 1,130,384 100.0 52.8
2007 and 2008 figures have regard to all claims processed up to and including 30 April 2009; 2009 figures have regard to all claims processed up to and including 30 April 2010. Rate per 1,000 total population; Rates are directly age‐standardised. a The sum of persons receiving services under each item group will be greater than for all Better Access items because a person may receive services from more than one type of provider.

30
Table 3.5 shows that:
• Annual rates of uptake increased in each successive year for all provider types. For all provider types, however, the rate of increase slowed over time. The successive increases from 2007 to 2008, and 2008 to 2009 for each item group were: General Psychologist, 33.3% and 20.6%; Occupational therapist, 81.8% and 38.2%; and Social Worker, 81.6% and 40.1%.
• Of the 379,284 people using Focussed Psychological Strategies in 2009 (refer to Table 3.3 for total figures), 91.9% (348,417 people) used services provided by general psychologists, 1.3% (5,103 people) used services provided by Occupational Therapists, and 7.5% (28,276 people) used services provided by Social Workers. The corresponding figures for 2007 were 94.6%, 0.9% and 4.8%; for 2008 they were 92.9%, 1.2% and 6.5%.
Figure 3.3 plots the growth in rates of uptake for each item group from the December 2006 quarter to the March 2010 quarter, for each provider type.
Fig 3.3 Uptake of Better Access items by provider type by quarter, December 2006 quarter to March 2010 quarter [GP, General practitioner; CP, Consultant psychiatrist; PTS Psychological Therapy Services; FPS, Focussed Psychological Strategies].
Comparisons of the 2007 and post‐2007 trends for each item group are shown in Table 3.6. Together, Figure 3.3 and Table 3.6 indicate that:
• The rate of uptake of any General Psychologist Better Access item rose from 2.9 persons per 1,000 total population in the March 2007 quarter to 7.2 persons per 1,000 in the March 2010 quarter. Uptake of these items increased significantly in both the 2007 (RR = 1.193; P < 0.001) and post‐2007 (RR = 1.048; P < 0.001)
0
2
4
6
8
10
12
14
16
18
20
Rate per 1,000
pop
ulation
Quarter
General PractitionersConsultant psychiatristsClinical PsychologistsGeneral PsychologistsOccupational TherapistsSocial Workers

31
periods. Although the rate of growth was somewhat lower in the post‐2007 period, but the rate of growth was significantly slower after 2007 (RR = 0.878; P < 0.001).
• The rates of uptake of any Occupational Therapist Better Access item rose from 0.02 persons per 1,000 total population in the March 2007 quarter to 0.11 persons per 1,000 in the March 2010 quarter. The rate of uptake of any Social Worker Better Access item rose from 0.10 per 1,000 total population in the March 2007 quarter to 0.60 per 1,000 in the March 2010 quarter. Uptake of Occupational Therapist and Social Worker items grew significantly in both the 2007 and post‐2007 periods, but the rate of growth was significantly slower after 2007.
Table 3.6 Estimated change in trends for uptake of MBS‐subsidised Better Access services by Item group, March 2007 quarter to March 2010 quarter
Trend in year 2007 Trend after 2007 Ratio of trendsa RR (95% CI) P RR (95% CI) P RR (95% CI) P General Practitioner 1.073 (1.051‐1.094) <0.001 1.044 (1.035‐1.053) <0.001 0.973 (0.945‐1.002) 0.067 Consultant psychiatrist 1.008 (1.982‐1.034) 0.567 1.009 (0.995‐1.022) 0.198 1.001 (0.959‐1.045) 0.958 Clinical psychologist 1.238 (1.138‐1.348) <0.001 1.056 (1.041‐1.072) <0.001 0.853 (0.798‐0.912) <0.001 General psychologist 1.193 (1.114‐1.278) <0.001 1.048 (1.034‐1.062) <0.001 0.878 (0.830‐0.929) <0.001 Occupational therapist 1.445 (1.317‐1.585) <0.001 1.081 (1.056‐1.108) <0.001 0.749 (0.682‐0.821) <0.001 Social worker 1.400 (1.272‐1.540) <0.001 1.083 (1.064‐1.102) <0.001 0.774 (0.717‐0.836) <0.001
2007 and 2008 figures have regard to all claims processed up to and including 30 April 2009; 2009 figures have regard to all claims processed up to and including 30 April 2010. RR, rate ratio; CI, confidence interval. a The ratio of the post‐2007 trend to the 2007 trend.
3.5 WHAT HAS BEEN THE RELATIVE UPTAKE OF ITEMS WITHIN ITEM GROUPS?
Uptake rates varied enormously across the 28 items that comprise the suite of Better Access MBS items. Figure 3.4 shows the uptake rate for each item, sorted by descending order of magnitude within each item group. Note that rates less than 0.5 per 1,000 total population are not visible on the figure.

32
Figure 3.4 Uptake of individual Better Access MBS items, in descending order of magnitude within Item group, 2007, 2008 and 2009
A complete list of the uptake rates for individual items is provided in Tables 3.7 and 3.8. The first six rows of Table 3.7 show the six items with the highest uptake rates. These items were used by at least 5% of Better Access users in each of 2007, 2008 and 2009. Tables 3.7 and 3.8 show that:
• Three of the six items with the highest uptake were the GP Mental Health Treatment items (2710, 2712 and 2713).
• The highest uptake rate was for the GP Mental Health Treatment Plan (item 2710), which is consistent with its role as the main point for initial assessment and subsequent referral, if appropriate, to other health Better Access services.
• The ratio of people receiving GP Mental Health Treatment Plans (item 2710) relative to people receiving GP Mental Health Treatment Reviews (item 2712) was 4.6:1 in 2007, decreasing to 3.3:1 in 2008 and 3.1:1 in 2009.
• More than one‐third (36.2%) of Better Access users received at least one GP Mental Health Consultation service (item 2713) in 2009 (31.5% in 2007 and 34.3% in 2008). This service is used for ongoing management of a patient with a mental disorder, including but not limited to, patients being managed under a GP Mental Health Treatment Plan (item 2710). Item 2713 can be used with or without item 2710, however item 2710 must be used
0
5
10
15
20
25
30
2710…
2713…
2712…
296…
291…
297…
293…
299…
80010…
80000…
80015…
80020…
80005…
80110…
80160…
80115…
80100…
80135…
80120…
80165…
80105…
80150…
80140…
80125…
80155…
80130…
80145…
80170…
Rate per 1,000
total p
opulation
Better Access Item and Item group
200720082009
GP CP PT FPS
33
initially to trigger patient access to allied health Medicare rebatable services.
• Of consumers who received services under the Consultant Psychiatry items, approximately 80% used item 296 (Consultant Psychiatrist – Initial Consultation), again reflecting the item’s function in assessing consumers for appropriateness to receive other Better Access services. This pattern was consistent across 2007, 2008 and 2009.
• Of consumers who received services from clinical psychologists under the Psychological Therapy Services items, virtually all (98%) used the 80010 (Service provided in rooms, 50+ minute consultation) item. Approximately 4% used the 80000 item (Service provided in rooms, 30‐50 minute consultation). Use of the Psychological Therapy Services items for out of room services (items 80005 and 80015) and for group sessions (item 80020) was negligible. This pattern was consistent across 2007, 2008 and 2009.
• Of consumers who received services from other allied health professionals under the Focussed psychological therapies items, virtually all (approximately 90%) used the 80110 (Service provided in rooms, 50+ minute consultation) item provided by general psychologists. Use of services provided by Occupational Therapists was negligible, as was use of services provided by social workers with the exception of item 80160 (Service provided in rooms, 50+ minute consultation).
• Claims for group session Psychological Therapy Services and Focussed psychological Strategies items (item numbers 80020, 80115, 80145, 80165) were negligible.

34
Table 3.7 Persons using individual MBS Better Access items in 2007, 2008 and 2009, in descending order of magnitude for 2009
Item group
Provider type
Item
number
2007 2008 2009
N persons
% of persons
Rate (per 1,000)
N persons
% of persons
Rate (per 1,000)
N persons
% of persons
Rate (per 1,000)
GP GP 2710 469,902 66.11 22.41 554,984 58.33 26.06 636,908 56.34 29.91 GP GP 2713 223,612 31.46 10.59 325,969 34.26 15.16 409,137 36.19 19.02 FPS GenPsy 80110 206,601 29.06 9.86 279,432 29.37 13.13 334,964 29.63 15.74 GP GP 2712 102,380 14.40 4.86 166,070 17.45 7.76 205,036 18.14 9.59 PT ClinPsy 80010 96,750 13.61 4.63 148,860 15.65 7.01 185,914 16.45 8.75 CP CP 296 72,859 10.25 3.46 75,347 7.92 3.52 79,437 7.03 3.71 FPS SW 80160 10,415 1.47 0.50 18,892 1.99 0.89 26,470 2.34 1.24 CP CP 291 8,836 1.24 0.42 11,280 1.19 0.53 13,451 1.19 0.63 FPS GenPsy 80115 5,350 0.75 0.26 8,773 0.92 0.41 12,902 1.14 0.61 FPS GenPsy 80100 9,794 1.38 0.47 10,343 1.09 0.49 12,511 1.11 0.59 CP CP 297 7,256 1.02 0.34 8,323 0.87 0.38 9,012 0.80 0.41 PT ClinPsy 80000 4,277 0.60 0.20 5,938 0.62 0.28 7,076 0.63 0.33 FPS OT 80135 1,797 0.25 0.09 3,178 0.33 0.15 4,380 0.39 0.21 PT ClinPsy 80015 1,236 0.17 0.06 2,197 0.23 0.10 3,119 0.28 0.15 FPS GenPsy 80120 849 0.12 0.04 1,433 0.15 0.07 2,253 0.20 0.11 FPS SW 80165 501 0.07 0.02 1,287 0.14 0.06 2,151 0.19 0.10 CP CP 293 896 0.13 0.04 1,490 0.16 0.07 2,033 0.18 0.09 FPS GenPsy 80105 890 0.13 0.04 1,117 0.12 0.05 1,479 0.13 0.07 PT ClinPsy 80020 602 0.08 0.03 1,019 0.11 0.05 1,342 0.12 0.06 CP CP 299 915 0.13 0.04 951 0.10 0.04 1,018 0.09 0.05 FPS SW 80150 342 0.05 0.02 607 0.06 0.03 760 0.07 0.04 FPS OT 80140 239 0.03 0.01 538 0.06 0.03 664 0.06 0.03 FPS OT 80125 181 0.03 0.01 374 0.04 0.02 589 0.05 0.03 FPS SW 80155 65 0.01 0.00 346 0.04 0.02 338 0.03 0.02 PT ClinPsy 80005 279 0.04 0.01 292 0.03 0.01 332 0.03 0.02 FPS OT 80130 23 0.00 0.00 63 0.01 0.00 118 0.01 0.01 FPS OT 80145 29 0.00 0.00 107 0.01 0.01 92 0.01 0.00 FPS SW 80170 30 0.00 0.00 70 0.01 0.00 90 0.01 0.00 All Better Access itemsa 710,840 33.8 951,454 44.5 1,130,384 52.8
2007 and 2008 figures have regard to all claims processed up to and including 30 April 2009; 2009 figures have regard to all claims processed up to and including 30 April 2010. Item group: GP, General Practitioner; CP, Consultant Psychiatry; PT, Psychological Therapy Services; FPS, Focussed Psychological Strategies. Provider type: GP, General Practitioner; CP, Consultant Psychiatrist; ClinPsy, Clinical Psychologist; GenPsy, General Psychologist; OT, Occupational Therapist; SW, Social Worker. Rate per 1,000 total population; Rates are directly age‐standardised. a The sum of persons receiving services under each item group will be greater than for all Better Access items because a person may receive services from more than one type of item group.

35
Table 3.8 Persons using individual MBS Better Access items in 2007, 2008 and 2009, in descending order of magnitude within item group for 2009
Item group
Provider type
Item number
2007 2008 2009
N persons
% of persons within Item
group
Rate (per
1,000) N
persons
% of persons within Item
group
Rate (per
1,000) N
persons
% of persons within Item
group
Rate (per
1,000) GP GP 2710 469,902 75.93 22.41 554,984 67.87 26.06 636,908 65.54 29.91 GP GP 2713 223,612 36.13 10.59 325,969 39.86 15.16 409,137 42.10 19.02 GP GP 2712 102,380 16.54 4.86 166,070 20.31 7.76 205,036 21.10 9.59 All GP items 618,867 87.1 29.5 817,738 85.9 38.3 971,836 86.0 45.4 CP CP 296 72,859 82.84 3.46 75,347 80.38 3.52 79,437 79.09 3.71 CP CP 291 8,836 10.05 0.42 11,280 12.03 0.53 13,451 13.39 0.63 CP CP 297 7,256 8.25 0.34 8,323 8.88 0.38 9,012 8.97 0.41 CP CP 293 896 1.02 0.04 1,490 1.59 0.07 2,033 2.02 0.09 CP CP 299 915 1.04 0.04 951 1.01 0.04 1,018 1.01 0.05 All CP items 87,947 12.4 4.2 93,736 9.9 4.4 100,434 8.9 4.7 PT ClinPsy 80010 96,750 98.11 4.63 148,860 98.20 7.01 185,914 98.15 8.75 PT ClinPsy 80000 4,277 4.34 0.20 5,938 3.92 0.28 7,076 3.74 0.33 PT ClinPsy 80015 1,236 1.25 0.06 2,197 1.45 0.10 3,119 1.65 0.15 PT ClinPsy 80020 602 0.61 0.03 1,019 0.67 0.05 1,342 0.71 0.06 PT ClinPsy 80005 279 0.28 0.01 292 0.19 0.01 332 0.18 0.02 All PT items 98,612 13.9 4.7 151,587 15.9 7.1 189,418 16.8 8.9 FPS GenPsy 80110 206,601 91.35 9.86 279,432 89.55 13.13 334,964 88.31 15.74 FPS SW 80160 10,415 4.60 0.50 18,892 6.05 0.89 26,470 6.98 1.24 FPS GenPsy 80115 5,350 2.37 0.26 8,773 2.81 0.41 12,902 3.40 0.61 FPS GenPsy 80100 9,794 4.33 0.47 10,343 3.31 0.49 12,511 3.30 0.59 FPS OT 80135 1,797 0.79 0.09 3,178 1.02 0.15 4,380 1.15 0.21 FPS GenPsy 80120 849 0.38 0.04 1,433 0.46 0.07 2,253 0.59 0.11 FPS SW 80165 501 0.22 0.02 1,287 0.41 0.06 2,151 0.57 0.10 FPS GenPsy 80105 890 0.39 0.04 1,117 0.36 0.05 1,479 0.39 0.07 FPS SW 80150 342 0.15 0.02 607 0.19 0.03 760 0.20 0.04 FPS OT 80140 239 0.11 0.01 538 0.17 0.03 664 0.18 0.03 FPS OT 80125 181 0.08 0.01 374 0.12 0.02 589 0.16 0.03 FPS SW 80155 65 0.03 0.00 346 0.11 0.02 338 0.09 0.02 FPS OT 80130 23 0.01 0.00 63 0.02 0.00 118 0.03 0.01 FPS OT 80145 29 0.01 0.00 107 0.03 0.01 92 0.02 0.00 FPS SW 80170 30 0.01 0.00 70 0.02 0.00 90 0.02 0.00 All FPS items 226,169 31.8 10.8 312,035 32.8 14.7 379,284 33.6 17.8 All Better Access itemsa 710,840 33.8 951,454 44.5 1,130,384 52.8
2007 and 2008 figures have regard to all claims processed up to and including 30 April 2009; 2009 figures have regard to all claims processed up to and including 30 April 2010. GP, General Practitioner; CP, Consultant Psychiatry; PT, Psychological Therapy Services; FPS, Focussed Psychological Strategies. Rate per 1,000 total population; Rates are directly age‐standardised. a The sum of persons receiving services under each item group will be greater than for all Better Access items because a person may receive services from more than one item group.
36
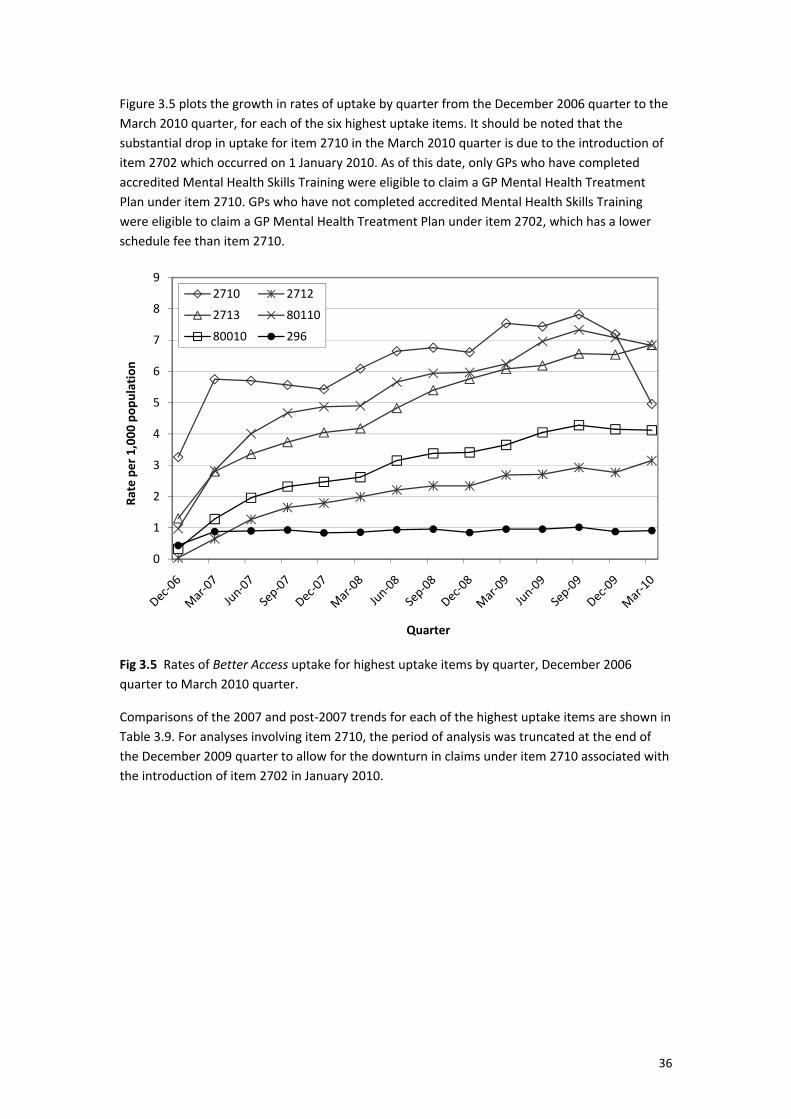
Figure 3.5 plots the growth in rates of uptake by quarter from the December 2006 quarter to the March 2010 quarter, for each of the six highest uptake items. It should be noted that the substantial drop in uptake for item 2710 in the March 2010 quarter is due to the introduction of item 2702 which occurred on 1 January 2010. As of this date, only GPs who have completed accredited Mental Health Skills Training were eligible to claim a GP Mental Health Treatment Plan under item 2710. GPs who have not completed accredited Mental Health Skills Training were eligible to claim a GP Mental Health Treatment Plan under item 2702, which has a lower schedule fee than item 2710.
Fig 3.5 Rates of Better Access uptake for highest uptake items by quarter, December 2006 quarter to March 2010 quarter.
Comparisons of the 2007 and post‐2007 trends for each of the highest uptake items are shown in Table 3.9. For analyses involving item 2710, the period of analysis was truncated at the end of the December 2009 quarter to allow for the downturn in claims under item 2710 associated with the introduction of item 2702 in January 2010.
0
1
2
3
4
5
6
7
8
9
Rate per 1,000
pop
ulation
Quarter
2710 2712
2713 80110
80010 296

37
Table 3.9 Estimated change in trends for uptake of MBS‐subsidised Better Access GP Mental Health Treatment items, March 2007 quarter to March 2010 quarter
Trend in year 2007 Trend after 2007 Ratio of trendsa RR (95% CI) P RR (95% CI) P RR (95% CI) P 2710b 0.981 (0.978‐0.983) <0.001 1.029 (1.016‐1.042) <0.001 1.049 (1.016‐1.083) 0.003 2712 1.388 (1.207‐1.596) <0.001 1.053 (1.043‐1.063) <0.001 0.759 (0.697‐0.827) <0.001 2713 1.129 (1.104‐1.154) <0.001 1.058 (1.044‐1.071) <0.001 0.937 (0.900‐0.976) 0.002 80110 1.194 (1.113‐1.280) <0.001 1.044 (1.031‐1.058) <0.001 0.875 (0.826‐0.926) <0.001 80010 1.239 (1.138‐1.348) <0.001 1.056 (1.041‐1.072) <0.001 0.853 (0.799‐0.911) <0.001 296 0.991 (0.961‐1.022) 0.575 1.004 (0.990‐1.019) 0.568 1.013 (0.967‐1.061) 0.583
2007 and 2008 figures have regard to all claims processed up to and including 30 April 2009; 2009 figures have regard to all claims processed up to and including 30 April 2010. a The ratio of the post‐2007 trend to the 2007 trend. b For item 2710, the period of analysis was from the March 2007 quarter to the December 2009 quarter due to the introduction of item 2702 in January 2010.
Figure 3.5 and Table 3.9 show that:
• The rate of uptake of the GP Mental Health Treatment Plan (2710) item increased from 5.8 per 1,000 total population in the March 2007 quarter to 7.2 per 1,000 in the December 2009 quarter. For this item, the rate of growth was negative in the 2007 period (RR = 0.981; P < 0.001), reflecting that the use of this item was quickly established in the initial months of operation of Better Access, but increased significantly after 2007 (RR = 1.029; P < 0.001). This change in trend was statistically significant (RR = 1.049; P < 0.001).
• The rate of uptake of the GP Mental Health Treatment Review (2712) item increased from 0.7 per 1,000 total population in the March 2007 quarter to 3.2 per 1,000 in the March 2010 quarter. The rate of uptake of the GP Mental Health Consultation (2713) item rose from 2.8 per 1,000 total population in the March 2007 quarter to 6.9 per 1,000 in the March 2010 quarter. Uptake rates for the GP Mental Health Treatment Review and Consultation items grew over both periods, although the rate of growth for both was significantly slower in the post‐2007 period.
• The rate of uptake of the Focussed Psychological Strategies item 80110 (General Psychologist) increased from 2.8 per 1,000 total population in the March 2007 quarter to 6.8 per 1,000 in the March 2010 quarter. The rate of uptake of the Psychological Therapies item 80010 rose from 1.3 per 1,000 total population in the March 2007 quarter to 4.1 per 1,000 in the March 2010 quarter. Uptake rates for items 80110 and 80010 grew significantly over the 2007 and post‐2007 periods, although the rate of growth for both was significantly slower in the post‐2007 period.
• The rates of uptake of Consultant Psychiatry item 296 were stable between the March 2007 quarter (0.9 persons per 1,000 total population) and the March 2010 quarter (0.9 persons per 1,000 total population). The analysis of trends showed that there was no significant trend in uptake within or between the 2007 and post‐2007 periods.

38
3.6 WHAT ARE THE SOCIO-DEMOGRAPHIC CHARACTERISTICS OF CONSUMERS WHO HAVE RECEIVED BETTER ACCESS SERVICES?
Having examined annual rates of uptake of Better Access items, and changes in trends in uptake over time, the socio‐demographic characteristics of people receiving Better Access services were then profiled. Table 3.10 shows the distribution of annual Better Access uptake rates according to four key socio‐demographic factors ‐ age, gender, geographical region and socio‐economic disadvantage ‐ for 2007, 2008 and 2009.
Table 3.10 Persons receiving any MBS‐subsidised Better Access services by age, gender, geographical region and socio‐economic disadvantage for 2007, 2008 and 2009
2007 2008 2009
N persons
% of persons
Rate (per
1,000) N
persons % of
persons
Rate (per
1,000) N
persons % of
persons
Rate (per
1,000) Age group
0‐14 years 41,050 5.8 10.1 61,239 6.4 14.8 81,336 7.2 19.7 15‐24 years 106,078 14.9 35.9 141,840 14.9 47.3 171,876 15.2 57.3 25‐34 years 148,378 20.9 50.6 194,595 20.5 65.2 224,648 19.9 75.2 35‐44 years 161,854 22.8 52.3 213,303 22.4 68.5 249,183 22.0 80.0 45‐54 years 128,275 18.0 44.1 170,316 17.9 57.5 199,434 17.6 67.4 55‐64 years 77,508 10.9 33.2 105,049 11.0 43.6 124,944 11.1 51.8 65+ years 47,697 6.7 17.3 65,112 6.8 23.0 78,963 7.0 27.9
Gender Male 259,533 36.5 24.8 347,705 36.5 32.7 419,561 37.1 39.4 Female 451,307 63.5 42.7 603,749 63.5 56.3 710,823 62.9 66.2
Regiona Capital cities 477,597 67.2 35.2 632,343 66.5 45.8 740,953 65.5 53.7 Other metropolitan centres 62,255 8.8 36.7 83,489 8.8 48.3 101,922 9.0 59.0 Rural centres 92,461 13.0 35.0 127,506 13.4 47.5 155,054 13.7 57.6 Other rural areas 71,572 10.1 28.5 98,863 10.4 38.9 120,434 10.7 47.3 Remote areas 6,954 1.0 12.7 9,253 1.0 16.6 12,012 1.1 21.5
Socio‐economic disadvantageb Quintile 5 (Least) 198,825 28.2 36.1 257,720 27.4 46.1 298,207 26.7 53.4 Quintile 4 153,894 21.8 33.6 205,515 21.8 44.1 245,822 22.0 52.7 Quintile 3 142,904 20.3 33.4 192,273 20.4 44.1 228,413 20.4 52.4 Quintile 2 119,399 16.9 33.2 162,561 17.3 44.6 195,517 17.5 53.6 Quintile 1 (Most) 89,651 12.7 29.4 123,408 13.1 40.0 149,683 13.4 48.5
All Better Access items 710,840 100.0 33.8 951,454 100.0 44.5 1,130,384 100.0 52.8
2007 and 2008 figures have regard to all claims processed up to and including 30 April 2009; 2009 figures have regard to all claims processed up to and including 30 April 2010. Region based on RRMA classification. Socio‐economic disadvantage based on IRSD classification. Rates for gender, region and socio‐economic disadvantage are age‐standardised; Rates for age group are crude. a 2007, 1 case excluded due to missing data on RRMA; b Approximately 1% of cases excluded due to missing IRSD quintile data.
Changes in uptake according to the various socio‐demographic characteristics are examined the following section, hence interpretation focuses on the 2009 data. The following patterns were observed:

39
• Uptake increased with age, peaking among adults in the 25‐34 year and 35‐44 year age groups, then decreased with age thereafter.
• Uptake among young people aged less than 15 years and older people aged 65 years or more was considerably lower than for all other age groups. It should also be noted, however, that relatively lower access by young people is not unique to Better Access: young people access all mental health services less often than other members of the population5, 27, 40 possibly because they are less likely to perceive that they have a need for mental health care.41, 42
• Overall, females used Better Access services to a greater extent than males, by a ratio of approximately 1.7:1.
• In absolute terms, more than two‐thirds of people who used Better Access services (65.5% in 2009) reside in capital cities. However, after adjusting for the population size of each category of geographical region, the age‐standardised uptake rates were found to be slightly lower for capital cities (53.7 per 1,000 population in 2009) than for other metropolitan centres and rural centres (59.0 and 57.6 persons per 1,000 population in 2009, respectively). Rates were around 12% lower for people residing in other rural areas (47.3 per 1,000 population in 2009) and around 60% lower for people in remote areas (21.5 per 1,000 population in 2009) than for people in capital cities.
• In absolute terms, the percentage of people who used Better Access services decreased steadily as level of socio‐economic disadvantage (as defined by quintiles on the IRSD) increased. However, after adjusting for the population size in each quintile of socio‐economic disadvantage, the age‐standardised rates show that uptake rates were around 10% lower for people in the most disadvantaged areas (48.5 persons per 1,000 population in 2009) than in all other areas (ranging from 52.4 to 53.6 persons per 1,000 population in 2009).
Uptake by age within gender was examined to see whether the patterns of uptake by age were similar in both males and females. Figure 3.6 to 3.8 show uptake by age group for each gender, for 2007, 2008 and 2009, respectively. The figures show that:
• The female preponderance in uptake was not evident in the youngest age groups and was relatively small in the oldest age group.
• For both males and females, uptake increased with age, peaking among adults in the 25‐34 year and 35‐44 year age groups, then decreased with age thereafter.
• Although annual rates of uptake have increased, the age‐gender patterns have not changed over the 2007 to 2009 period.

40
Figure 3.6 Uptake of Better Access MBS items by age group and sex, 2007
Figure 3.7 Uptake of Better Access MBS items by age group and sex, 2008
0
20
40
60
80
100
120
0‐14 15‐24 25‐34 35‐44 45‐54 55‐64 65+
Rate per 1,000
pop
ulation
Age group
MaleFemale
0
20
40
60
80
100
120
0‐14 15‐24 25‐34 35‐44 45‐54 55‐64 65+
Rate per 1,000
pop
ulation
Age group
MaleFemale
41
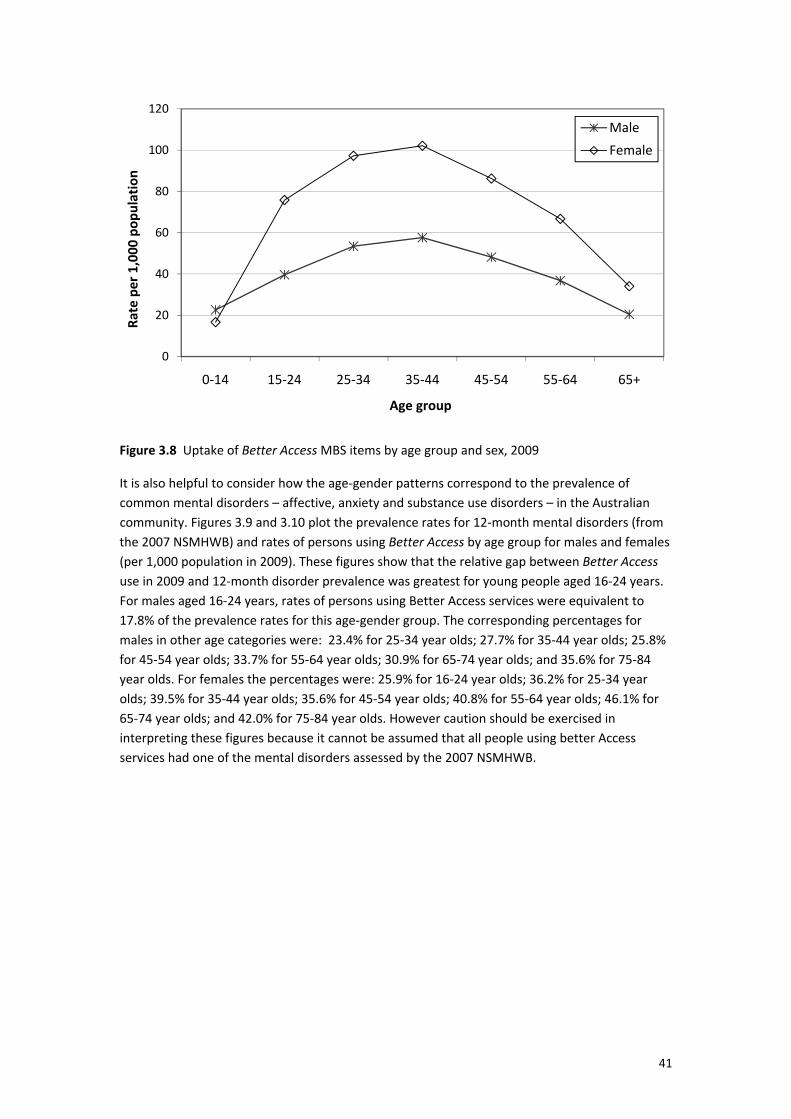
Figure 3.8 Uptake of Better Access MBS items by age group and sex, 2009
It is also helpful to consider how the age‐gender patterns correspond to the prevalence of common mental disorders – affective, anxiety and substance use disorders – in the Australian community. Figures 3.9 and 3.10 plot the prevalence rates for 12‐month mental disorders (from the 2007 NSMHWB) and rates of persons using Better Access by age group for males and females (per 1,000 population in 2009). These figures show that the relative gap between Better Access use in 2009 and 12‐month disorder prevalence was greatest for young people aged 16‐24 years. For males aged 16‐24 years, rates of persons using Better Access services were equivalent to 17.8% of the prevalence rates for this age‐gender group. The corresponding percentages for males in other age categories were: 23.4% for 25‐34 year olds; 27.7% for 35‐44 year olds; 25.8% for 45‐54 year olds; 33.7% for 55‐64 year olds; 30.9% for 65‐74 year olds; and 35.6% for 75‐84 year olds. For females the percentages were: 25.9% for 16‐24 year olds; 36.2% for 25‐34 year olds; 39.5% for 35‐44 year olds; 35.6% for 45‐54 year olds; 40.8% for 55‐64 year olds; 46.1% for 65‐74 year olds; and 42.0% for 75‐84 year olds. However caution should be exercised in interpreting these figures because it cannot be assumed that all people using better Access services had one of the mental disorders assessed by the 2007 NSMHWB.
0
20
40
60
80
100
120
0‐14 15‐24 25‐34 35‐44 45‐54 55‐64 65+
Rate per 1,000
pop
ulation
Age group
MaleFemale

42
Figure 3.9 12‐month prevalence of common mental disorders and uptake of Better Access MBS items by age group, males (per 1,000 population)
Figure 3.10 12‐month prevalence of common mental disorders and uptake of Better Access MBS items by age group, females (per 1,000 population)
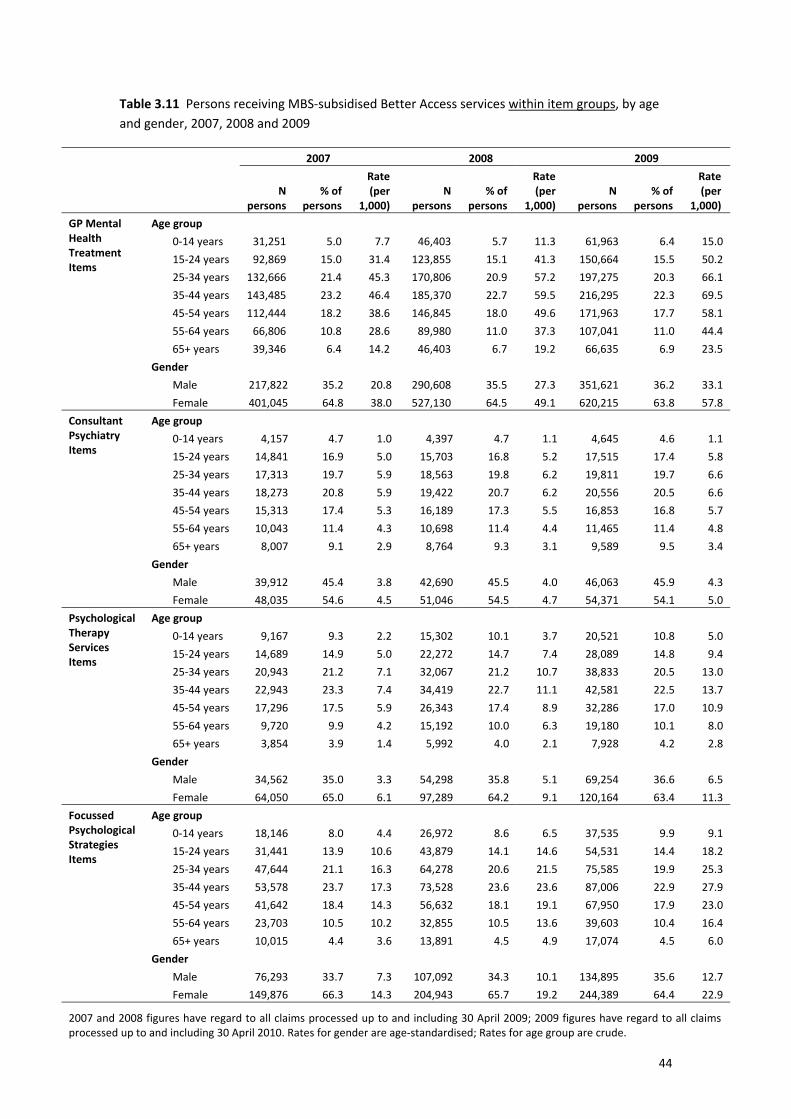
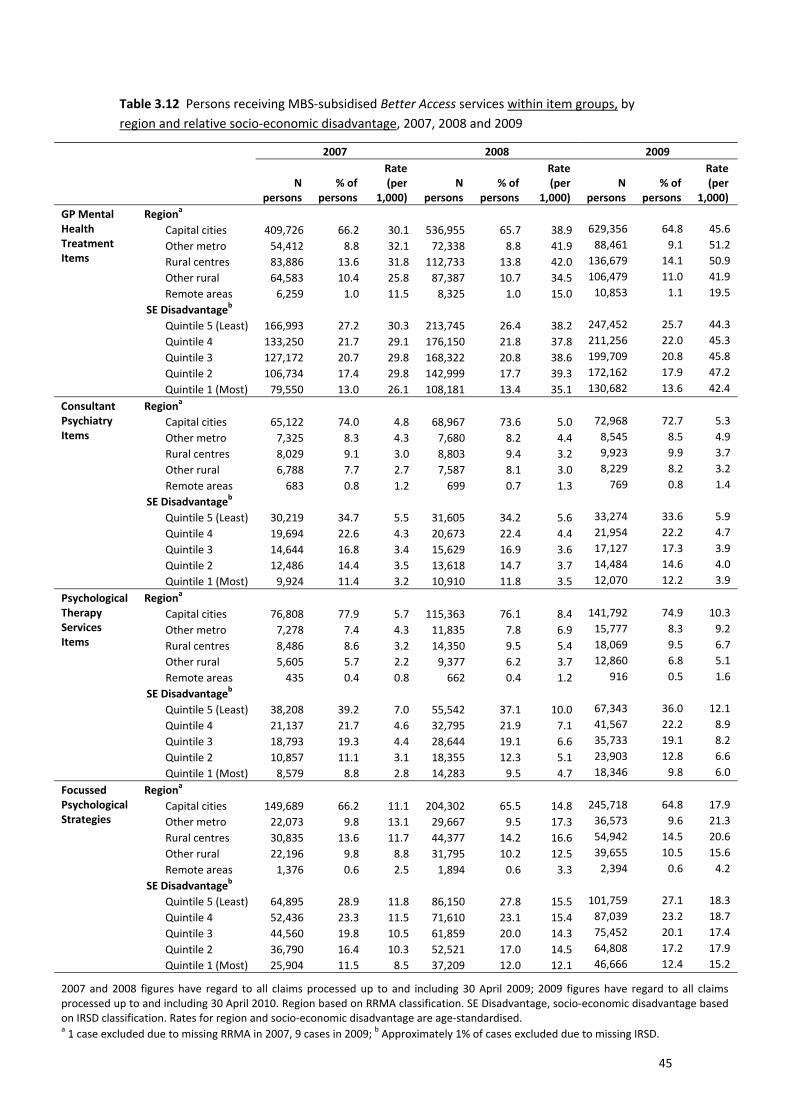
Uptake rates were then examined by socio‐demographic group for the major item groups (GP Mental Health Treatment items, Consultant Psychiatry items, Psychological Therapy items, and Focussed Psychological Strategies items). Table 3.11 shows the distribution of annual Better Access uptake by age and gender for each of the item groups. Table 3.12 shows the distribution
0
50
100
150
200
250
300
350
16‐24 25‐34 35‐44 45‐54 55‐64 65‐74 75‐84
Rate per 1,000
pop
ulation
Age Group
Prevalence of affective, anxiety and substance use disorders (2007 NSMHWB)Persons using Better Access services in 2009
0
50
100
150
200
250
300
350
16‐24 25‐34 35‐44 45‐54 55‐64 65‐74 75‐84
Rate per 1,000
pop
ulation
Age Group
Prevalence of affective, anxiety and substance use disorders (2007 NSMHWB)Persons using Better Access services in 2009
43
of annual Better Access uptake by geographical region and socio‐economic disadvantage categories for each of the item groups. Focusing on the 2009 data, the tables show that:
• The pattern of uptake by age group was similar for all item groups, and mirrors the pattern for any Better Access item (Table 3.10). That is, uptake increased with age, peaking among adults in the 25‐34 year and 35‐44 year age groups, then decreased with age thereafter.
• Young people showed the lowest uptake of GP Mental Health Treatment and Consultant Psychiatry items, whereas older people showed the lowest uptake of Psychological Therapy Services and Focussed Psychological Strategies items.
• The female:male ratio of uptake rates was between 1.7:1 and 1.8:1 for the GP Mental Health Treatment, Psychological Therapy Services and Focussed Psychological Strategies item groups. The female:male ratio for Consultant Psychiatry items was considerably lower (1.2:1).
• For the GP Mental Health Treatment item group, uptake rates were highest among people living in other metropolitan centres (51.2 per 1,000 population) and rural centres (50.9 per 1,000 population), and slightly lower for people living in capital cities (45.6 per 1,000 population). Compared to people living in other metropolitan regions (the region type with the highest uptake), uptake rates were 18% lower (41.9% per 1,000 population) for people residing in other rural areas and 62% lower (19.5 per 1,000 population) for people in remote areas.
• There was a similar pattern for the Focussed Psychological Strategies item group. Uptake was highest among people living in other metropolitan centres (21.3 per 1,000 population) and rural centres (20.6 per 1,000 population), and slightly lower for people living in capital cities (17.9 per 1,000 population). Compared to people living in other metropolitan regions (the region type with the highest uptake), uptake was 27% lower (15.6% per 1,000 population) for people residing in other rural areas and 80% lower (4.2 per 1,000 population) for people in remote areas.
• For the Consultant Psychiatry item group, uptake showed a steady decrease across each category of geographical region from capital cities (5.3 per 1,000 population) to remote areas (1.4 per 1,000 population). Similarly for the Psychological Therapy Services item group, uptake rates steadily decreased from capital cities (10.3 per 1,000 population) to remote areas (1.6 per 1,000 population).
• Uptake of the GP Mental Health Treatment item group was similar across all categories of socio‐economic disadvantage, with the exception of the most disadvantaged areas. Uptake rates for people in the most disadvantaged areas were 10% lower than for those in areas of highest uptake (quintile 2). A similar pattern was found for Focussed Psychological Strategies where uptake rates for people in the most disadvantaged areas were 19% lower than for those in areas of highest uptake (quintile 4).
• In contrast, uptake of the Psychological Therapy Services and, to a lesser extent, the Consultant Psychiatry item groups, decreased as levels of socio‐economic disadvantage increased.
44
Table 3.11 Persons receiving MBS‐subsidised Better Access services within item groups, by age and gender, 2007, 2008 and 2009
2007 2008 2009
N persons
% of persons
Rate (per
1,000) N
persons % of
persons
Rate (per
1,000) N
persons % of
persons
Rate (per
1,000) GP Mental Health Treatment Items
Age group 0‐14 years 31,251 5.0 7.7 46,403 5.7 11.3 61,963 6.4 15.0 15‐24 years 92,869 15.0 31.4 123,855 15.1 41.3 150,664 15.5 50.2 25‐34 years 132,666 21.4 45.3 170,806 20.9 57.2 197,275 20.3 66.1 35‐44 years 143,485 23.2 46.4 185,370 22.7 59.5 216,295 22.3 69.5 45‐54 years 112,444 18.2 38.6 146,845 18.0 49.6 171,963 17.7 58.1 55‐64 years 66,806 10.8 28.6 89,980 11.0 37.3 107,041 11.0 44.4 65+ years 39,346 6.4 14.2 46,403 6.7 19.2 66,635 6.9 23.5
Gender Male 217,822 35.2 20.8 290,608 35.5 27.3 351,621 36.2 33.1 Female 401,045 64.8 38.0 527,130 64.5 49.1 620,215 63.8 57.8
Consultant Psychiatry Items
Age group 0‐14 years 4,157 4.7 1.0 4,397 4.7 1.1 4,645 4.6 1.1 15‐24 years 14,841 16.9 5.0 15,703 16.8 5.2 17,515 17.4 5.8 25‐34 years 17,313 19.7 5.9 18,563 19.8 6.2 19,811 19.7 6.6 35‐44 years 18,273 20.8 5.9 19,422 20.7 6.2 20,556 20.5 6.6 45‐54 years 15,313 17.4 5.3 16,189 17.3 5.5 16,853 16.8 5.7 55‐64 years 10,043 11.4 4.3 10,698 11.4 4.4 11,465 11.4 4.8 65+ years 8,007 9.1 2.9 8,764 9.3 3.1 9,589 9.5 3.4
Gender Male 39,912 45.4 3.8 42,690 45.5 4.0 46,063 45.9 4.3 Female 48,035 54.6 4.5 51,046 54.5 4.7 54,371 54.1 5.0
Psychological Therapy Services Items
Age group 0‐14 years 9,167 9.3 2.2 15,302 10.1 3.7 20,521 10.8 5.0 15‐24 years 14,689 14.9 5.0 22,272 14.7 7.4 28,089 14.8 9.4 25‐34 years 20,943 21.2 7.1 32,067 21.2 10.7 38,833 20.5 13.0 35‐44 years 22,943 23.3 7.4 34,419 22.7 11.1 42,581 22.5 13.7 45‐54 years 17,296 17.5 5.9 26,343 17.4 8.9 32,286 17.0 10.9 55‐64 years 9,720 9.9 4.2 15,192 10.0 6.3 19,180 10.1 8.0 65+ years 3,854 3.9 1.4 5,992 4.0 2.1 7,928 4.2 2.8
Gender Male 34,562 35.0 3.3 54,298 35.8 5.1 69,254 36.6 6.5 Female 64,050 65.0 6.1 97,289 64.2 9.1 120,164 63.4 11.3
Focussed Psychological Strategies Items
Age group 0‐14 years 18,146 8.0 4.4 26,972 8.6 6.5 37,535 9.9 9.1 15‐24 years 31,441 13.9 10.6 43,879 14.1 14.6 54,531 14.4 18.2 25‐34 years 47,644 21.1 16.3 64,278 20.6 21.5 75,585 19.9 25.3 35‐44 years 53,578 23.7 17.3 73,528 23.6 23.6 87,006 22.9 27.9 45‐54 years 41,642 18.4 14.3 56,632 18.1 19.1 67,950 17.9 23.0 55‐64 years 23,703 10.5 10.2 32,855 10.5 13.6 39,603 10.4 16.4 65+ years 10,015 4.4 3.6 13,891 4.5 4.9 17,074 4.5 6.0
Gender Male 76,293 33.7 7.3 107,092 34.3 10.1 134,895 35.6 12.7 Female 149,876 66.3 14.3 204,943 65.7 19.2 244,389 64.4 22.9
2007 and 2008 figures have regard to all claims processed up to and including 30 April 2009; 2009 figures have regard to all claims processed up to and including 30 April 2010. Rates for gender are age‐standardised; Rates for age group are crude.
45
Table 3.12 Persons receiving MBS‐subsidised Better Access services within item groups, by region and relative socio‐economic disadvantage, 2007, 2008 and 2009
2007 2008 2009
N persons
% of persons
Rate (per
1,000) N
persons % of
persons
Rate (per
1,000) N
persons % of
persons
Rate (per
1,000) GP Mental Health Treatment Items
Regiona Capital cities 409,726 66.2 30.1 536,955 65.7 38.9 629,356 64.8 45.6 Other metro 54,412 8.8 32.1 72,338 8.8 41.9 88,461 9.1 51.2 Rural centres 83,886 13.6 31.8 112,733 13.8 42.0 136,679 14.1 50.9 Other rural 64,583 10.4 25.8 87,387 10.7 34.5 106,479 11.0 41.9 Remote areas 6,259 1.0 11.5 8,325 1.0 15.0 10,853 1.1 19.5
SE Disadvantageb Quintile 5 (Least) 166,993 27.2 30.3 213,745 26.4 38.2 247,452 25.7 44.3 Quintile 4 133,250 21.7 29.1 176,150 21.8 37.8 211,256 22.0 45.3 Quintile 3 127,172 20.7 29.8 168,322 20.8 38.6 199,709 20.8 45.8 Quintile 2 106,734 17.4 29.8 142,999 17.7 39.3 172,162 17.9 47.2 Quintile 1 (Most) 79,550 13.0 26.1 108,181 13.4 35.1 130,682 13.6 42.4
Consultant Psychiatry Items
Regiona Capital cities 65,122 74.0 4.8 68,967 73.6 5.0 72,968 72.7 5.3 Other metro 7,325 8.3 4.3 7,680 8.2 4.4 8,545 8.5 4.9 Rural centres 8,029 9.1 3.0 8,803 9.4 3.2 9,923 9.9 3.7 Other rural 6,788 7.7 2.7 7,587 8.1 3.0 8,229 8.2 3.2 Remote areas 683 0.8 1.2 699 0.7 1.3 769 0.8 1.4
SE Disadvantageb Quintile 5 (Least) 30,219 34.7 5.5 31,605 34.2 5.6 33,274 33.6 5.9 Quintile 4 19,694 22.6 4.3 20,673 22.4 4.4 21,954 22.2 4.7 Quintile 3 14,644 16.8 3.4 15,629 16.9 3.6 17,127 17.3 3.9 Quintile 2 12,486 14.4 3.5 13,618 14.7 3.7 14,484 14.6 4.0 Quintile 1 (Most) 9,924 11.4 3.2 10,910 11.8 3.5 12,070 12.2 3.9
Psychological Therapy Services Items
Regiona Capital cities 76,808 77.9 5.7 115,363 76.1 8.4 141,792 74.9 10.3 Other metro 7,278 7.4 4.3 11,835 7.8 6.9 15,777 8.3 9.2 Rural centres 8,486 8.6 3.2 14,350 9.5 5.4 18,069 9.5 6.7 Other rural 5,605 5.7 2.2 9,377 6.2 3.7 12,860 6.8 5.1 Remote areas 435 0.4 0.8 662 0.4 1.2 916 0.5 1.6
SE Disadvantageb Quintile 5 (Least) 38,208 39.2 7.0 55,542 37.1 10.0 67,343 36.0 12.1 Quintile 4 21,137 21.7 4.6 32,795 21.9 7.1 41,567 22.2 8.9 Quintile 3 18,793 19.3 4.4 28,644 19.1 6.6 35,733 19.1 8.2 Quintile 2 10,857 11.1 3.1 18,355 12.3 5.1 23,903 12.8 6.6 Quintile 1 (Most) 8,579 8.8 2.8 14,283 9.5 4.7 18,346 9.8 6.0
Focussed Psychological Strategies
Regiona Capital cities 149,689 66.2 11.1 204,302 65.5 14.8 245,718 64.8 17.9 Other metro 22,073 9.8 13.1 29,667 9.5 17.3 36,573 9.6 21.3 Rural centres 30,835 13.6 11.7 44,377 14.2 16.6 54,942 14.5 20.6 Other rural 22,196 9.8 8.8 31,795 10.2 12.5 39,655 10.5 15.6 Remote areas 1,376 0.6 2.5 1,894 0.6 3.3 2,394 0.6 4.2
SE Disadvantageb Quintile 5 (Least) 64,895 28.9 11.8 86,150 27.8 15.5 101,759 27.1 18.3 Quintile 4 52,436 23.3 11.5 71,610 23.1 15.4 87,039 23.2 18.7 Quintile 3 44,560 19.8 10.5 61,859 20.0 14.3 75,452 20.1 17.4 Quintile 2 36,790 16.4 10.3 52,521 17.0 14.5 64,808 17.2 17.9 Quintile 1 (Most) 25,904 11.5 8.5 37,209 12.0 12.1 46,666 12.4 15.2
2007 and 2008 figures have regard to all claims processed up to and including 30 April 2009; 2009 figures have regard to all claims processed up to and including 30 April 2010. Region based on RRMA classification. SE Disadvantage, socio‐economic disadvantage based on IRSD classification. Rates for region and socio‐economic disadvantage are age‐standardised. a 1 case excluded due to missing RRMA in 2007, 9 cases in 2009; b Approximately 1% of cases excluded due to missing IRSD.

46
Because the Focussed Psychological Strategies item group subsumes services for three provider types – General Psychologists, Occupational Therapists and Social Workers ‐ Tables 3.13 and 3.14 show the uptake rates by socio‐demographic characteristic for these provider groups separately.
Table 3.13 Persons receiving MBS‐subsidised Better Access services by Provider Type (within the Focussed Psychological Strategies item group), by age and gender, 2007, 2008 and 2009
2007 2008 2009
N persons
% of persons
Rate (per
1,000) N
persons % of
persons
Rate (per
1,000) N
persons % of
persons
Rate (per
1,000) General Psychologists
Age group 0‐14 years 16,870 7.9 4.1 24,695 8.5 6.0 33,821 9.7 8.2 15‐24 years 29,853 14.0 10.1 40,892 14.1 13.6 50,365 14.5 16.8 25‐34 years 45,282 21.2 15.4 59,932 20.7 20.1 69,956 20.1 23.4 35‐44 years 50,597 23.6 16.4 68,214 23.5 21.9 79,768 22.9 25.6 45‐54 years 39,362 18.4 13.5 52,586 18.1 17.8 62,482 17.9 21.1 55‐64 years 22,539 10.5 9.7 30,617 10.6 12.7 36,422 10.5 15.1 65+ years 9,460 4.4 3.4 12,849 4.4 4.5 15,603 4.5 5.5
Gender Male 72,528 33.9 6.9 99,953 34.5 9.4 124,498 35.7 11.7 Female 141,435 66.1 13.5 189,832 65.5 17.8 223,919 64.3 21.0
Occupational Therapists
Age group 0‐14 years 552 27.4 0.14 1,287 34.8 0.31 2,094 41.0 0.51 15‐24 years 228 11.3 0.08 465 12.6 0.15 556 10.9 0.19 25‐34 years 299 14.9 0.10 453 12.2 0.15 542 10.6 0.18 35‐44 years 367 18.2 0.12 582 15.7 0.19 737 14.4 0.24 45‐54 years 318 15.8 0.11 500 13.5 0.17 623 12.2 0.21 55‐64 years 158 7.9 0.07 278 7.5 0.12 364 7.1 0.15 65+ years 89 4.4 0.03 136 3.7 0.05 187 3.7 0.07
Gender Male 844 42.0 0.08 1,635 44.2 0.16 2,437 47.8 0.23 Female 1,167 58.0 0.11 2,066 55.8 0.19 2,666 52.2 0.25
Social Workers
Age group 0‐14 years 807 7.4 0.2 1,201 6.0 0.3 2,040 7.2 0.5 15‐24 years 1,444 13.2 0.5 2,747 13.6 0.9 3,944 13.9 1.3 25‐34 years 2,228 20.4 0.8 4,237 21.0 1.4 5,518 19.5 1.8 35‐44 years 2,791 25.6 0.9 5,126 25.4 1.7 7,144 25.3 2.3 45‐54 years 2,093 19.2 0.7 3,812 18.9 1.3 5,256 18.6 1.8 55‐64 years 1,063 9.7 0.5 2,093 10.4 0.9 3,024 10.7 1.3 65+ years 492 4.5 0.2 941 4.7 0.3 1,350 4.8 0.5
Gender Male 3,151 28.9 0.3 6,018 29.9 0.6 8,806 31.1 0.8 Female 7,767 71.1 0.7 14,139 70.1 1.3 19,470 68.9 1.8
2007 and 2008 figures have regard to all claims processed up to and including 30 April 2009; 2009 figures have regard to all claims processed up to and including 30 April 2010. Rates for gender are age‐standardised; Rates for age group are crude. Rates for items provided by Occupational Therapists are given to 2 decimal places as many of the estimates in this group are small.

47
Table 3.14 Persons receiving MBS‐subsidised Better Access services by Provider Type (within the Focussed Psychological Strategies item group), by region and relative socio‐economic disadvantage, 2007, 2008 and 2009
2007 2008 2009
N persons
% of persons
Rate (per
1,000) N
persons % of
persons
Rate (per
1,000) N
persons % of
persons
Rate (per
1,000) General Psychologists
Regiona Capital cities 142,074 66.4 10.5 190,092 65.6 13.8 226,362 65.0 16.5 Other metro 21,321 10.0 12.6 28,114 9.7 16.4 34,289 9.8 20.0 Rural centres 28,959 13.5 11.0 40,889 14.1 15.3 49,872 14.3 18.7 Other rural 20,294 9.5 8.1 28,890 10.0 11.4 35,689 10.2 14.0 Remote areas 1,315 0.6 2.4 1,800 0.6 3.2 2,203 0.6 3.9
SE Disadvantageb Quintile 5 (Least) 61,184 28.8 11.1 79,915 27.8 14.3 93,188 27.0 16.7 Quintile 4 49,883 23.5 10.9 66,999 23.3 14.4 80,727 23.4 17.3 Quintile 3 42,046 19.8 9.9 57,251 19.9 13.2 69,447 20.1 16.0 Quintile 2 34,756 16.4 9.7 48,676 16.9 13.4 58,931 17.1 16.3 Quintile 1 (Most) 24,607 11.6 8.1 34,460 12.0 11.2 42,897 12.4 13.9
Occupational Therapists
Regiona Capital cities 1,337 66.5 0.10 2,384 64.4 0.18 3,491 68.4 0.26 Other metro 164 8.2 0.10 424 11.5 0.25 549 10.8 0.32 Rural centres 259 12.9 0.10 549 14.8 0.21 594 11.6 0.22 Other rural 236 11.7 0.10 319 8.6 0.13 438 8.6 0.17 Remote areas 15 0.7 0.03 25 0.7 0.04 31 0.6 0.05
SE Disadvantageb Quintile 5 (Least) 561 28.1 0.11 1,056 28.7 0.20 1,647 32.5 0.31 Quintile 4 414 20.8 0.09 786 21.4 0.17 1,050 20.8 0.23 Quintile 3 447 22.4 0.11 699 19.0 0.16 969 19.2 0.23 Quintile 2 367 18.4 0.10 684 18.6 0.19 799 15.8 0.22 Quintile 1 (Most) 206 10.3 0.07 451 12.3 0.14 595 11.8 0.19
Social Workers
Regiona Capital cities 6,739 61.7 0.5 12,902 64.0 0.9 17,514 61.9 1.3 Other metro 651 6.0 0.4 1,238 6.1 0.7 1,913 6.8 1.1 Rural centres 1,733 15.9 0.7 3,193 15.8 1.2 4,856 17.2 1.8 Other rural 1,747 16.0 0.7 2,750 13.6 1.1 3,820 13.5 1.5 Remote areas 48 0.4 0.1 74 0.4 0.1 173 0.6 0.3
SE Disadvantageb Quintile 5 (Least) 3,385 31.3 0.6 5,675 28.4 1.0 7,667 27.4 1.4 Quintile 4 2,297 21.2 0.5 4,155 20.8 0.9 5,798 20.7 1.2 Quintile 3 2,209 20.4 0.5 4,224 21.2 1.0 5,498 19.7 1.3 Quintile 2 1,781 16.4 0.5 3,458 17.3 1.0 5,525 19.8 1.5 Quintile 1 (Most) 1,157 10.7 0.4 2,457 12.3 0.8 3,470 12.4 1.1
2007 and 2008 figures have regard to all claims processed up to and including 30 April 2009; 2009 figures have regard to all claims processed up to and including 30 April 2010. Region based on RRMA classification. SE Disadvantage, socio‐economic disadvantage based on IRSD classification. Rates for region and socio‐economic disadvantage are age‐standardised. Rates for items provided by Occupational Therapists are given to 2 decimal places as many of the estimates in this group are small. a 1 case excluded due to missing RRMA in 2007, 9 cases in 2009; b Approximately 1% of cases excluded due to missing IRSD.
Given the preponderance of services provided by General Psychologists, patterns for this group mirror the general patterns for the Focussed Psychological Strategies item group. Focussing on the 2009 data, Table 3.13 shows that persons using Better Access services provided by Occupational Therapist have a somewhat different profile than persons using Better Access

48
services provided by General Psychologists and Social Workers. Occupational Therapists see a higher rate of young people aged less than 15 years. They also see similar proportions of males and females. Table 3.14 shows that the profile of persons seen by region and socio‐economic disadvantage is similar across the three provider types, although Occupational Therapists saw a relatively higher rate of persons from the least disadvantages areas in 2009 (NB. this pattern was, however, not evident in 2007 or 2008).
3.7 HAVE THERE BEEN CHANGES OVER TIME IN THE SOCIO-DEMOGRAPHIC PROFILE OF CONSUMERS WHO HAVE RECEIVED BETTER ACCESS SERVICES?
Table 3.15 shows the percentage change in the rates of persons using any Better Access item between 2007 and 2009, by age, gender, geographical region and socio‐economic disadvantage. The table shows that growth in uptake was greater for some groups than for others.
Table 3.15 Percentage change in persons using any MBS‐subsidised Better Access services by age, gender, geographical region and socio‐economic disadvantage for 2007, 2008 and 2009
Rate (per 1,000) Percentage change 2007 2008 2009 2007‐2008 2008‐2009 2007‐2009
Age group 0‐14 years 10.1 14.8 19.7 47.7 32.8 96.1 15‐24 years 35.9 47.3 57.3 31.7 21.2 59.5 25‐34 years 50.6 65.2 75.2 28.7 15.5 48.6 35‐44 years 52.3 68.5 80.0 30.9 16.8 52.9 45‐54 years 44.1 57.5 67.4 30.6 17.1 52.9 55‐64 years 33.2 43.6 51.8 31.2 18.9 56.0 65+ years 17.3 23.0 27.9 33.3 21.3 61.6
Gender Male 24.8 32.7 39.4 31.7 20.6 58.9 Female 42.7 56.3 66.2 31.6 17.7 54.9
Regiona Capital cities 35.2 45.8 53.7 30.2 17.3 52.7 Other metropolitan centres 36.7 48.3 59.0 31.6 22.1 60.7 Rural centres 35.0 47.5 57.6 35.6 21.4 64.6 Other rural areas 28.5 38.9 47.3 36.4 21.5 65.8 Remote areas 12.7 16.6 21.5 30.6 29.5 69.2
Socio‐economic disadvantageb Quintile 5 (Least) 36.1 46.1 53.4 27.7 15.8 47.9 Quintile 4 33.6 44.1 52.7 31.0 19.7 56.8 Quintile 3 33.4 44.1 52.4 31.9 18.7 56.6 Quintile 2 33.2 44.6 53.6 34.2 20.1 61.2 Quintile 1 (Most) 29.4 40.0 48.5 36.0 21.2 64.8
All Better Access items 33.8 44.5 52.8 33.6 18.7 58.6
2007 and 2008 figures have regard to all claims processed up to and including 30 April 2009; 2009 figures have regard to all claims processed up to and including 30 April 2010. Region based on RRMA classification. Socio‐economic disadvantage based on IRSD classification. Rates for gender, region and socio‐economic disadvantage are age‐standardised; Rates for age group are crude. a 2007, 1 case excluded due to missing data on RRMA; b Approximately 1% of cases excluded due to missing IRSD quintile data.

49
Table 3.15 shows that:
• The rate of growth in uptake was substantially higher for young people aged 0‐14 years than for all other age groups. Growth in uptake for people aged 0‐14 years (96.1%) was 60% higher than the average across all Better Access consumers (58.6%).
• Growth in uptake increased as remoteness increased. Growth among people in remote areas was 20% higher than the average across all Better Access consumers.
• Growth in uptake increased somewhat as level of socioeconomic disadvantage increased. Growth among people in areas of greatest disadvantage was 10% above the average across all Better Access consumers.
Rates of growth in uptake for the various item groups were also examined according to sociodemographic characteristics. Table 3.16 shows the percentage change between 2007 and 2009 for persons using the four main item groups, by age and gender. This shows that:
• The rate of growth in uptake was substantially higher for young people aged 0‐14 years than for all other age groups for GP Mental Health Treatment items, Psychological Therapy Services and Focussed Psychological Strategies items.
Table 3.17 shows the percentage change between 2007 and 2009 for persons using the four main item groups, by geographic region and level of socio‐economic disadvantage. This shows that:
• Patterns of growth by geographic region vary considerably between item groups. However the growth in uptake between 2007 and 2009 tended to be higher for people from non‐capital city areas.
• Growth in uptake for all item groups tended to increase as level of socioeconomic disadvantage increased.

50
Table 3.16 Percentage change in persons using MBS‐subsidised Better Access services by age and gender for 2007, 2008 and 2009
Rate (per 1,000) Percentage change 2007 2008 2009 2007‐2008 2008‐2009 2007‐2009
GP Mental Health Treatment Items
Age group 0‐14 years 7.7 11.3 15.0 47.0 33.5 96.3 15‐24 years 31.4 41.3 50.2 31.3 21.6 59.8 25‐34 years 45.3 57.2 66.1 26.4 15.5 46.0 35‐44 years 46.4 59.5 69.5 28.3 16.7 49.7 45‐54 years 38.6 49.6 58.1 28.4 17.1 50.4 55‐64 years 28.6 37.3 44.4 30.3 19.0 55.0 65+ years 14.2 19.2 23.5 35.2 22.3 65.3
Gender Male 20.8 27.3 33.1 31.1 21.0 58.6 Female 38.0 49.1 57.8 29.3 17.6 52.0
Consultant Psychiatry Items
Age group 0‐14 years 1.0 1.1 1.1 4.9 5.6 10.8 15‐24 years 5.0 5.2 5.8 4.2 11.5 16.1 25‐34 years 5.9 6.2 6.6 5.2 6.6 12.2 35‐44 years 5.9 6.2 6.6 5.6 5.8 11.7 45‐54 years 5.3 5.5 5.7 4.0 4.0 8.2 55‐64 years 4.3 4.4 4.8 3.0 7.2 10.5 65+ years 2.9 3.1 3.4 6.6 9.7 16.9
Gender Male 3.8 4.0 4.3 5.0 8.0 13.4 Female 4.5 4.7 5.0 4.6 6.3 11.3
Psychological Therapy Services Items
Age group 0‐14 years 2.2 3.7 5.0 65.3 34.0 121.4 15‐24 years 5.0 7.4 9.4 49.3 26.1 88.4 25‐34 years 7.1 10.7 13.0 50.3 21.1 82.1 35‐44 years 7.4 11.1 13.7 48.9 23.7 84.2 45‐54 years 5.9 8.9 10.9 49.8 22.6 83.6 55‐64 years 4.2 6.3 8.0 51.3 26.2 90.9 65+ years 1.4 2.1 2.8 52.1 32.1 100.8
Gender Male 3.3 5.1 6.5 54.7 27.3 97.0 Female 6.1 9.1 11.3 49.5 23.5 84.7
Focussed Psychological Strategies Items
Age group 0‐14 years 4.4 6.5 9.1 47.3 39.1 104.9 15‐24 years 10.6 14.6 18.2 37.4 24.3 70.7 25‐34 years 16.3 21.5 25.3 32.5 17.6 55.8 35‐44 years 17.3 23.6 27.9 36.2 18.3 61.2 45‐54 years 14.3 19.1 23.0 33.8 20.0 60.5 55‐64 years 10.2 13.6 16.4 34.2 20.5 61.7 65+ years 3.6 4.9 6.0 35.6 22.8 66.5
Gender Male 7.3 10.1 12.7 38.2 25.9 74.1 Female 14.3 19.2 22.9 34.6 19.3 60.5
2007 and 2008 figures have regard to all claims processed up to and including 30 April 2009; 2009 figures have regard to all claims processed up to and including 30 April 2010. Rates for gender are age‐standardised; Rates for age group are crude.

51
Table 3.17 Percentage change in persons using MBS‐subsidised Better Access services by geographical region and socio‐economic disadvantage, for 2007, 2008 and 2009
Rate (per 1,000) Percentage change 2007 2008 2009 2007‐2008 2008‐2009 2007‐2009
GP Mental Health Treatment Items
Regiona Capital cities 30.1 38.9 45.6 28.9 17.3 51.1 Other metro 32.1 41.9 51.2 30.4 22.3 59.5 Rural centres 31.8 42.0 50.9 32.0 21.0 59.7 Other rural 25.8 34.5 41.9 33.5 21.6 62.4 Remote areas 11.5 15.0 19.5 30.4 30.3 69.9
SE Disadvantageb Quintile 5 (Least) 30.3 38.2 44.3 26.0 15.9 46.1 Quintile 4 29.1 37.8 45.3 29.7 20.0 55.6 Quintile 3 29.8 38.6 45.8 29.7 18.5 53.8 Quintile 2 29.8 39.3 47.2 32.0 20.2 58.7 Quintile 1 (Most) 26.1 35.1 42.4 34.3 20.7 62.1
Consultant Psychiatry Items
Regiona Capital cities 4.8 5.0 5.3 4.2 5.6 10.0 Other metro 4.3 4.4 4.9 2.8 11.1 14.2 Rural centres 3.0 3.2 3.7 8.0 13.0 22.0 Other rural 2.7 3.0 3.2 10.8 8.4 20.1 Remote areas 1.2 1.3 1.4 2.4 9.4 12.1
SE Disadvantageb Quintile 5 (Least) 5.5 5.6 5.9 2.9 5.3 8.4 Quintile 4 4.3 4.4 4.7 3.0 6.1 9.3 Quintile 3 3.4 3.6 3.9 4.7 9.5 14.7 Quintile 2 3.5 3.7 4.0 7.2 6.5 14.2 Quintile 1 (Most) 3.2 3.5 3.9 9.0 10.5 20.4
Psychological Therapy Services Items
Regiona Capital cities 5.7 8.4 10.3 47.7 23.0 81.8 Other metro 4.3 6.9 9.2 59.5 33.4 112.8 Rural centres 3.2 5.4 6.7 66.7 25.5 109.3 Other rural 2.2 3.7 5.1 64.9 36.9 125.8 Remote areas 0.8 1.2 1.6 51.3 38.5 109.5
SE Disadvantageb Quintile 5 (Least) 7.0 10.0 12.1 43.2 21.5 73.9 Quintile 4 4.6 7.1 8.9 52.4 26.8 93.2 Quintile 3 4.4 6.6 8.2 49.6 24.7 86.5 Quintile 2 3.1 5.1 6.6 66.5 30.1 116.6 Quintile 1 (Most) 2.8 4.7 6.0 64.6 28.3 111.3
Focussed Psychological Strategies
Regiona Capital cities 11.1 14.8 17.9 34.3 20.4 61.7 Other metro 13.1 17.3 21.3 32.1 23.3 62.9 Rural centres 11.7 16.6 20.6 41.7 23.7 75.4 Other rural 8.8 12.5 15.6 41.5 24.5 76.2 Remote areas 2.5 3.3 4.2 34.7 26.1 69.9
SE Disadvantageb Quintile 5 (Least) 11.8 15.5 18.3 30.8 18.3 54.7 Quintile 4 11.5 15.4 18.7 34.1 21.6 63.1 Quintile 3 10.5 14.3 17.4 36.2 22.0 66.2 Quintile 2 10.3 14.5 17.9 40.8 23.3 73.5 Quintile 1 (Most) 8.5 12.1 15.2 42.1 25.3 78.0
2007 and 2008 figures have regard to all claims processed up to and including 30 April 2009; 2009 figures have regard to all claims processed up to and including 30 April 2010. Region based on RRMA classification. SE Disadvantage, socio‐economic disadvantage based on IRSD classification. Rates for region and socio‐economic disadvantage are age‐standardised.
52
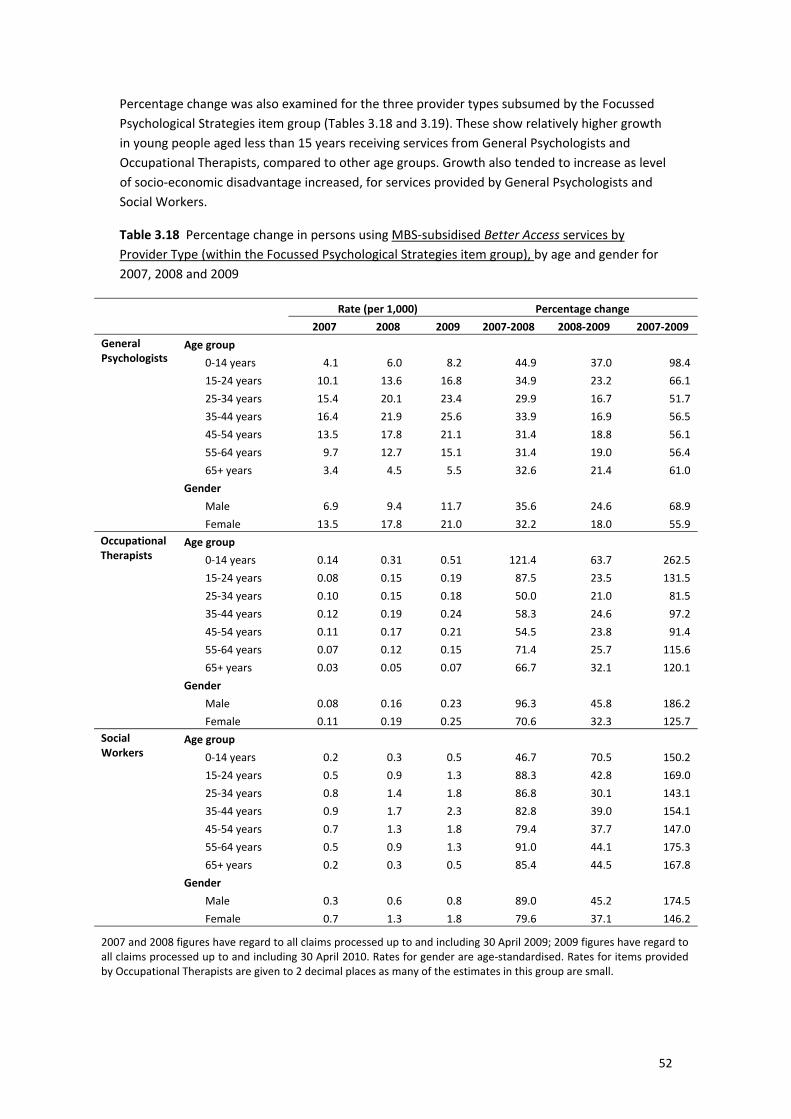
Percentage change was also examined for the three provider types subsumed by the Focussed Psychological Strategies item group (Tables 3.18 and 3.19). These show relatively higher growth in young people aged less than 15 years receiving services from General Psychologists and Occupational Therapists, compared to other age groups. Growth also tended to increase as level of socio‐economic disadvantage increased, for services provided by General Psychologists and Social Workers.
Table 3.18 Percentage change in persons using MBS‐subsidised Better Access services by Provider Type (within the Focussed Psychological Strategies item group), by age and gender for 2007, 2008 and 2009
Rate (per 1,000) Percentage change 2007 2008 2009 2007‐2008 2008‐2009 2007‐2009
General Psychologists
Age group 0‐14 years 4.1 6.0 8.2 44.9 37.0 98.4 15‐24 years 10.1 13.6 16.8 34.9 23.2 66.1 25‐34 years 15.4 20.1 23.4 29.9 16.7 51.7 35‐44 years 16.4 21.9 25.6 33.9 16.9 56.5 45‐54 years 13.5 17.8 21.1 31.4 18.8 56.1 55‐64 years 9.7 12.7 15.1 31.4 19.0 56.4 65+ years 3.4 4.5 5.5 32.6 21.4 61.0
Gender Male 6.9 9.4 11.7 35.6 24.6 68.9 Female 13.5 17.8 21.0 32.2 18.0 55.9
Occupational Therapists
Age group 0‐14 years 0.14 0.31 0.51 121.4 63.7 262.5 15‐24 years 0.08 0.15 0.19 87.5 23.5 131.5 25‐34 years 0.10 0.15 0.18 50.0 21.0 81.5 35‐44 years 0.12 0.19 0.24 58.3 24.6 97.2 45‐54 years 0.11 0.17 0.21 54.5 23.8 91.4 55‐64 years 0.07 0.12 0.15 71.4 25.7 115.6 65+ years 0.03 0.05 0.07 66.7 32.1 120.1
Gender Male 0.08 0.16 0.23 96.3 45.8 186.2 Female 0.11 0.19 0.25 70.6 32.3 125.7
Social Workers
Age group 0‐14 years 0.2 0.3 0.5 46.7 70.5 150.2 15‐24 years 0.5 0.9 1.3 88.3 42.8 169.0 25‐34 years 0.8 1.4 1.8 86.8 30.1 143.1 35‐44 years 0.9 1.7 2.3 82.8 39.0 154.1 45‐54 years 0.7 1.3 1.8 79.4 37.7 147.0 55‐64 years 0.5 0.9 1.3 91.0 44.1 175.3 65+ years 0.2 0.3 0.5 85.4 44.5 167.8
Gender Male 0.3 0.6 0.8 89.0 45.2 174.5 Female 0.7 1.3 1.8 79.6 37.1 146.2
2007 and 2008 figures have regard to all claims processed up to and including 30 April 2009; 2009 figures have regard to all claims processed up to and including 30 April 2010. Rates for gender are age‐standardised. Rates for items provided by Occupational Therapists are given to 2 decimal places as many of the estimates in this group are small.

53
Table 3.19 Percentage change in persons using MBS‐subsidised Better Access services by Provider Type (within the Focussed Psychological Strategies item group), by geographical region and socio‐economic disadvantage, for 2007, 2008 and 2009
Rate (per 1,000) Percentage change 2007 2008 2009 2007‐2008 2008‐2009 2007‐2009
General Psychologists
Regiona Capital cities 10.5 13.8 16.5 31.6 19.2 56.9 Other metro 12.6 16.4 20.0 29.6 22.0 58.1 Rural centres 11.0 15.3 18.7 39.0 21.9 69.5 Other rural 8.1 11.4 14.0 40.7 23.4 73.5 Remote areas 2.4 3.2 3.9 34.2 22.0 63.6
SE Disadvantageb Quintile 5 (Least) 11.1 14.3 16.7 28.7 16.8 50.3 Quintile 4 10.9 14.4 17.3 31.9 20.6 59.0 Quintile 3 9.9 13.2 16.0 33.7 21.3 62.1 Quintile 2 9.7 13.4 16.3 38.1 21.0 67.1 Quintile 1 (Most) 8.1 11.2 13.9 38.5 24.4 72.2
Occupational Therapists
Regiona Capital cities 0.10 0.18 0.26 78.0 46.5 160.8 Other metro 0.10 0.25 0.32 154.2 27.2 223.3 Rural centres 0.10 0.21 0.22 112.6 5.7 124.7 Other rural 0.10 0.13 0.17 36.4 30.7 78.3 Remote areas 0.03 0.04 0.05 49.5 35.4 102.4
SE Disadvantageb Quintile 5 (Least) 0.11 0.20 0.31 88.7 56.7 195.7 Quintile 4 0.09 0.17 0.23 84.1 35.5 149.6 Quintile 3 0.11 0.16 0.23 52.0 41.3 114.8 Quintile 2 0.10 0.19 0.22 85.7 15.9 115.2 Quintile 1 (Most) 0.07 0.14 0.19 108.9 35.4 182.9
Social Workers
Regiona Capital cities 0.5 0.9 1.3 86.8 36.6 155.3 Other metro 0.4 0.7 1.1 86.1 54.3 187.0 Rural centres 0.7 1.2 1.8 81.9 51.4 175.3 Other rural 0.7 1.1 1.5 55.7 38.7 116.0 Remote areas 0.1 0.1 0.3 49.3 137.7 254.9
SE Disadvantageb Quintile 5 (Least) 0.6 1.0 1.4 64.2 35.5 122.5 Quintile 4 0.5 0.9 1.2 77.0 40.0 147.7 Quintile 3 0.5 1.0 1.3 86.9 30.6 144.1 Quintile 2 0.5 1.0 1.5 91.4 58.4 203.2 Quintile 1 (Most) 0.4 0.8 1.1 110.7 41.0 197.0
2007 and 2008 figures have regard to all claims processed up to and including 30 April 2009; 2009 figures have regard to all claims processed up to and including 30 April 2010. Region based on RRMA classification. SE Disadvantage, socio‐economic disadvantage based on IRSD classification. Rates for region and socio‐economic disadvantage are age‐standardised. Rates for items provided by Occupational Therapists are given to 2 decimal places as many of the estimates in this group are small.

54
3.8 TO WHAT EXTENT IS BETTER ACCESS PROVIDING SERVICES TO ‘NEW’ CONSUMERS?
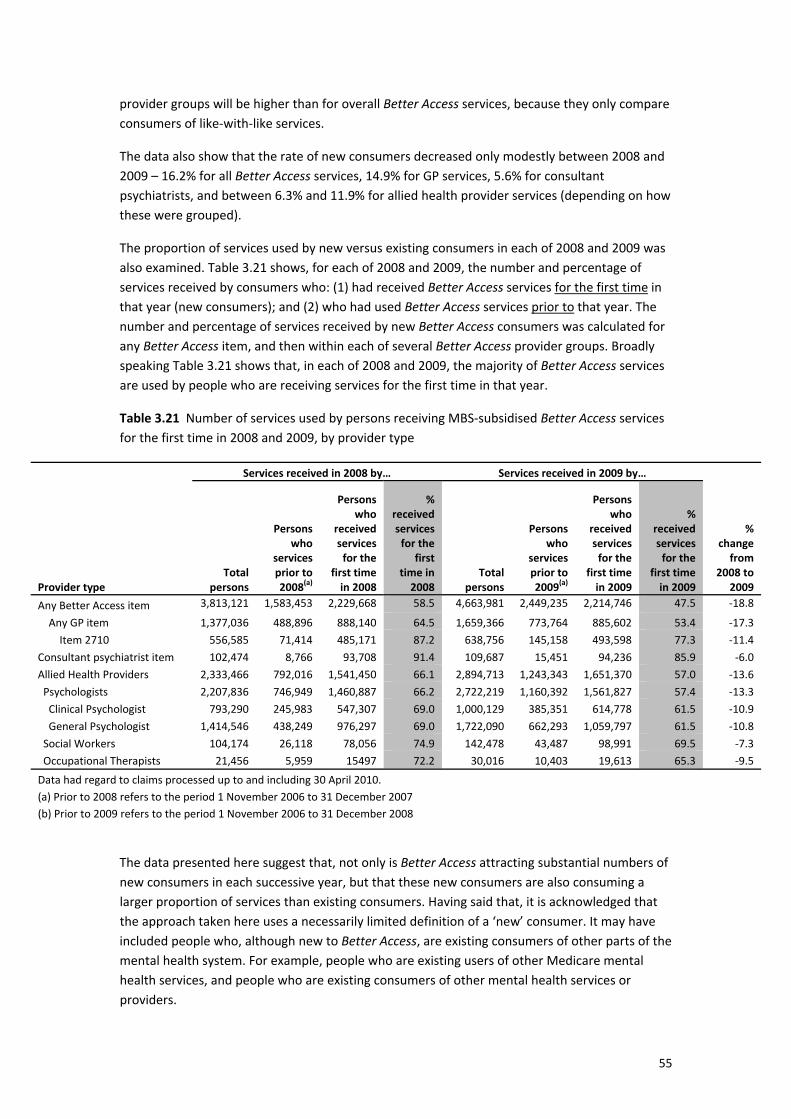
Given the continued and substantial growth in uptake of Better Access since its introduction, it is of interest to know the extent to which the initiative is attracting ‘new’ consumers as it proceeds or, conversely, is providing services to a consistent group of people on an ongoing basis. To examine this question, the percentage of Better Access consumers who were new to the initiative in each of 2008 and 2009 was estimated. Table 3.20 shows, for each of 2008 and 2009, the number and percentage of consumers who: (1) had received Better Access services for the first time in that year (new consumers); and (2) who had used Better Access services prior to that year. The number and percentage of new Better Access consumers was calculated for any Better Access item, and then within each of several Better Access provider groups.
The first row of Table 3.20 shows that the majority of Better Access in 2008 and 2009 were new to the initiative. Of consumers who received at least one Better Access service in 2008, more than two‐thirds (68.0%) were new Better Access consumers. In 2009, the percentage of new consumers was 57.0%. Note that the 2009 figures will always be lower than 2008 because consumers have had more opportunity to receive services prior to 2009. The percentage reduction in new consumers between 2008 and 2009 was 16.2%.
Table 3.20 Persons receiving MBS‐subsidised Better Access services for the first time in 2008 and 2009, by provider type
Received services in 2008 Received services in 2009
Provider type Total N
N received services prior to 2008(a)
N received services for the
first time in 2008
% received services for the
first time in 2008 Total N
N received services prior to 2008(b)
N received services for the
first time in 2009
% received services for the
first time in 2009
% change from 2008
to 2009
Any Better Access item 953,161 304,696 648,465 68.0 1,130,384 486,089 644,295 57.0 ‐16.2 Any GP item 818,434 220,438 597,996 73.1 971,713 367,394 604,319 62.2 ‐14.9 Item 2710 555,479 71,207 484,272 87.2 636,908 144,569 492,339 77.3 ‐11.3 Consultant psychiatrist item 94,398 7,421 86,977 92.1 100,390 13,102 87,288 86.9 ‐5.6 Allied Health Providers 452,600 129,615 322,985 71.4 550,354 204,246 346,108 62.9 ‐11.9 Psychologists 430,928 123,106 307,822 71.4 520,588 191,838 328,750 63.1 ‐11.6 Clinical Psychologist 152,721 39,345 113,376 74.2 189,418 62,640 126,778 66.9 ‐9.8 General Psychologist 292,129 76,870 215,259 73.7 348,417 115,170 233,247 66.9 ‐9.1 Social Workers 20,319 4,155 16,164 79.6 28,276 7,198 21,078 74.5 ‐6.3 Occupational Therapists 3,719 801 2,918 78.5 5,103 1,432 3,671 71.9 ‐8.3
Data had regard to claims processed up to and including 30 April 2010. (a) Prior to 2008 refers to the period 1 November 2006 to 31 December 2007 (b) Prior to 2009 refers to the period 1 November 2006 to 31 December 2008
Subsequent rows of Table 3.20 show the equivalent figures for various provider groupings. The highest rate of new consumers occurs among those who received Consultant Psychiatrist services (92.1% in 2008; 86.9% in 2009). Rates for allied health providers were similar, ranging between 73.7% to 79.5% in 2008, and 66.9% to 74.5% in 2009. Rates were lowest for GP services (73.1% in 2008; 62.2% in 2009). Note that the percentage of new consumers in the individual
55
provider groups will be higher than for overall Better Access services, because they only compare consumers of like‐with‐like services.
The data also show that the rate of new consumers decreased only modestly between 2008 and 2009 – 16.2% for all Better Access services, 14.9% for GP services, 5.6% for consultant psychiatrists, and between 6.3% and 11.9% for allied health provider services (depending on how these were grouped).
The proportion of services used by new versus existing consumers in each of 2008 and 2009 was also examined. Table 3.21 shows, for each of 2008 and 2009, the number and percentage of services received by consumers who: (1) had received Better Access services for the first time in that year (new consumers); and (2) who had used Better Access services prior to that year. The number and percentage of services received by new Better Access consumers was calculated for any Better Access item, and then within each of several Better Access provider groups. Broadly speaking Table 3.21 shows that, in each of 2008 and 2009, the majority of Better Access services are used by people who are receiving services for the first time in that year.
Table 3.21 Number of services used by persons receiving MBS‐subsidised Better Access services for the first time in 2008 and 2009, by provider type
Services received in 2008 by… Services received in 2009 by…
Provider type Total
persons
Persons who
services prior to 2008(a)
Persons who
received services for the
first time in 2008
% received services for the
first time in 2008
Total persons
Persons who
services prior to 2009(a)
Persons who
received services for the
first time in 2009
% received services for the
first time in 2009
% change from
2008 to 2009
Any Better Access item 3,813,121 1,583,453 2,229,668 58.5 4,663,981 2,449,235 2,214,746 47.5 ‐18.8
Any GP item 1,377,036 488,896 888,140 64.5 1,659,366 773,764 885,602 53.4 ‐17.3 Item 2710 556,585 71,414 485,171 87.2 638,756 145,158 493,598 77.3 ‐11.4 Consultant psychiatrist item 102,474 8,766 93,708 91.4 109,687 15,451 94,236 85.9 ‐6.0 Allied Health Providers 2,333,466 792,016 1,541,450 66.1 2,894,713 1,243,343 1,651,370 57.0 ‐13.6 Psychologists 2,207,836 746,949 1,460,887 66.2 2,722,219 1,160,392 1,561,827 57.4 ‐13.3 Clinical Psychologist 793,290 245,983 547,307 69.0 1,000,129 385,351 614,778 61.5 ‐10.9 General Psychologist 1,414,546 438,249 976,297 69.0 1,722,090 662,293 1,059,797 61.5 ‐10.8 Social Workers 104,174 26,118 78,056 74.9 142,478 43,487 98,991 69.5 ‐7.3 Occupational Therapists 21,456 5,959 15497 72.2 30,016 10,403 19,613 65.3 ‐9.5
Data had regard to claims processed up to and including 30 April 2010. (a) Prior to 2008 refers to the period 1 November 2006 to 31 December 2007 (b) Prior to 2009 refers to the period 1 November 2006 to 31 December 2008
The data presented here suggest that, not only is Better Access attracting substantial numbers of new consumers in each successive year, but that these new consumers are also consuming a larger proportion of services than existing consumers. Having said that, it is acknowledged that the approach taken here uses a necessarily limited definition of a ‘new’ consumer. It may have included people who, although new to Better Access, are existing consumers of other parts of the mental health system. For example, people who are existing users of other Medicare mental health services, and people who are existing consumers of other mental health services or providers.

56
3.9 KEY FINDINGS
The key findings from Chapter 3 are presented for each of the research questions explored:
What has been the rate of uptake of Better Access services overall?
• The age‐standardised uptake rate of any MBS‐subsidised Better Access item was 33.8 persons per 1,000 total population (3.4% of the total population or 710,840 persons) in 2007, rising to 44.5 persons per 1,000 in 2008 (4.4% of the total population or 951,454 persons), and further to 52.8 persons per 1,000 total population in 2009 (5.3% of the total population or 1,130,384 persons). That is, one in every 30 Australians received at least one Better Access service in 2007, one in every 23 did so in 2008, and one in every 19 did so in 2009.
• Although the uptake of Better Access has continued to increase, the rate of growth has slowed. The increase in rates of overall Better Access uptake has slowed significantly from 13.3% per quarter in 2007 to 4.6% per quarter post‐2007. In annual terms, Better Access uptake showed an annual increase of 31.7% between 2007 and 2008, and an annual increase of 18.7% between 2008 and 2009.
What has been the rate of uptake of Better Access item groups?
• Most Better Access consumers (86.0%) received at least one GP Mental Health Treatment service. This amounted to 45.4 persons per 1,000 population in 2009. Uptake for the allied health Focussed Psychological Strategies items (17.8 per 1,000 in 2009) was greater than for Psychological Therapy Services items (8.9 per 1,000 in 2009) and Consultant Psychiatry items (4.7 per 1,000 in 2009).
• Within the Focussed Psychological Strategies item group, uptake was considerably greater for items provided by general psychologists (16.4 per 1,000 in 2009) than those provided by social workers (1.3 per 1,000 in 2009) or occupational therapists (0.2 per 1,000 in 2009).
• The GP Mental Health Treatment, Psychological Therapy Services and Focussed Psychological Strategies item groups have all shown significant positive growth over time since Better Access was introduced. Uptake of the Consultant Psychiatry item group has remained stable.
• The rate of growth in uptake was substantially higher for young people aged 0‐14 years than for all other age groups. Growth in uptake for people aged 0‐14 years (96.1%) was 60% higher than the average for all Better Access consumers (58.2%).
• Growth in uptake increased as remoteness increased. Growth among people in remote areas was 20% higher than the average for all Better Access consumers.
• Growth in uptake increased as level of socioeconomic disadvantage increased. Growth among people in areas of greatest disadvantage was 20% above the average for all Better Access consumers.

57
What is the relative uptake of items with item groups?
• Three of the six items with the highest level of uptake were the GP Mental Health Treatment items (2710, 2712 and 2713). The high uptake rate for item 2710 (GP Mental Health Treatment Plan) is consistent with its role as the main point of referral to other Better Access services.
• The ratio of the rates for 2710 to 2712 (Review of a GP MH Treatment Plan) items was 4.6:1 in 2007, decreasing to 3.3:1 in 2008 and 3.1:1 in 2009.
• Of consumers who received services under the Consultant Psychiatry items, approximately 80% used item 296 (Consultant Psychiatrist – Initial Consultation), reflecting the item’s function in assessing consumers for appropriateness to receive other Better Access services.
• Of consumers who received services from clinical psychologists under the Psychological Therapy Services items, virtually all (90%) used the 80010 (Service provided in rooms, 50+ minute consultation) item.
• Of consumers who received services from other allied health professionals under the Focussed psychological therapies items, virtually all (approximately 90%) used the 80110 (Service provided in rooms, 50+ minute consultation) item provided by general psychologists.
What are the socio‐demographic characteristics of Better Access consumers?
• Uptake rates for any Better Access service increase with age, peaking among adults in the 25‐34 year and 35‐44 year age groups, then decrease with age thereafter.
• Females use Better Access services to a greater extent than males, by a ratio of approximately 1.7:1. Only males aged 0‐14 years use Better Access services at a higher rate than females.
• The female:male ratio of uptake rates was between 1.7:1 and 1.8:1 in 2009 for the GP Mental Health Treatment, Psychological Therapy Services and Focussed Psychological Strategies item groups. The female:male ratio for Consultant Psychiatry items was considerably lower (1.2:1).
• Young people showed the lowest uptake of GP and Consultant Psychiatry items, whereas older people showed the lowest uptake of Psychological Therapy Services and Focussed Psychological Strategies items.
• For the GP and Focussed Psychological Strategies item groups, uptake rates were lowest for people residing in remote areas. For Consultant Psychiatry and Psychological Therapy Services items, rates showed a steady decrease across each category of geographical region from capital cities to remote areas.
• Uptake rates for Psychological Therapy Services and, to a lesser extent, in the Consultant Psychiatry item groups decrease as levels of socio‐economic disadvantage increase. In contrast, uptake rates for GP Mental Health Treatment and Focussed Psychological Strategies item groups were somewhat lower for persons residing in the most disadvantaged areas.
58
Have there been changes over time in the socio‐demographic characteristics of consumers who have received Better Access services?
• The rate of growth in uptake was substantially higher for young people aged 0‐14 years than for all other age groups. Growth in uptake for people aged 0‐14 years (96.1%) was 60% higher than the average across all Better Access consumers (58.6%).
• Growth in uptake increased as remoteness increased. Growth among people in remote areas was 20% higher than the average across all Better Access consumers.
• Growth in uptake increased somewhat as level of socioeconomic disadvantage increased. Growth among people in areas of greatest disadvantage was 10% above the average across all Better Access consumers.
To what extent is Better Access providing services to ‘new’ consumers?
• The majority of people who received Better Access services in 2008 (68.0%) and 2009 (57.0%) were new consumers. That is, they had not used any Better Access services in preceding years.
• When analysed according to provider type, the percentage of new consumers was highest for the Consultant Psychiatrist services (92.1% in 2008; 86.9% in 2009), followed by the allied health services (ranging between 73.7% to 79.5% in 2008, and 66.9% to 74.5% in 2009), followed by GP services (73.1% in 2008; 62.2% in 2009).
• The rate of new consumers decreased only modestly between 2008 and 2009 – 16.2% for all Better Access services, 14.9% for GP services, 5.6% for consultant psychiatrists, and between 6.3% and 9.8% for allied health provider services.
• In each of 2008 and 2009, the majority of Better Access services were used by people who received services for the first time in that year. This suggests that, not only is Better Access attracting substantial numbers of new consumers in each successive year, but that these new consumers are also consuming a larger proportion of services than existing consumers.