Chapter 29 Principles of Corporate Finance Tenth Edition Financial Planning Slides by Matthew Will...
28
Chapter 29 Principles of Corporate Finance Tenth Edition Financial Planning Slides by Matthew Will McGraw-Hill/Irwin Copyright © 2011 by the McGraw-Hill Companies, Inc. All rights reserved.
-
Upload
gwendolyn-russell -
Category
Documents
-
view
243 -
download
9
Transcript of Chapter 29 Principles of Corporate Finance Tenth Edition Financial Planning Slides by Matthew Will...

Chapter 29Principles of
Corporate FinanceTenth Edition
Financial Planning
Slides by
Matthew Will
McGraw-Hill/Irwin Copyright © 2011 by the McGraw-Hill Companies, Inc. All rights reserved.

29-2
Topics Covered
Links Between Long-Term and Short-Term Financing Decisions
Tracing Changes in CashCash BudgetingShort-Term Financing PlanLong-Term Financing PlanGrowth and External Financing

29-3
Firm’s Cumulative Capital Requirement
Lines A, B, and C show alternative amounts of long-term finance.
Strategy A: A permanent cash surplus Strategy B: Short-term lender for part of year and borrower for
remainder Strategy C: A permanent short-term borrower
A
B
C
Year 2Year 1
Dollars
Cumulativecapital requirement
Time

29-4
2009 2008 2009 2008
Current assets: Current liabilities:
Cash 25 20 Bank loans 0 25
Marketable securities 25 0 Accounts payable 135 110
Accounts receivable 150 125 Total current liabilities 135 135
Inventory 125 130 Long-term debt 90 60
Total current assets 325 275 Net worth (equity and retained earnings)
350 320
Fixed assets: Total liabilities and net worth 575 515
Gross investment 350 320
Less depreciation 100 80
Net fixed assets 250 240
Total assets 575 515
Balance Sheet
Example - Dynamic Mattress Company

29-5
Income Statement
Example - Dynamic Mattress Company
1. Sales 2,200
2. Cost of goods sold 1,644
3. Other expenses 411
4. Depreciation 20
5. EBIT (1-2-3-4) 125
6. Interest 5
7 Pretax income (5-6) 120
8. Tax at 50% 60
9. Net income (7-8) 60
Dividend 30
Earnings retained in the business 30

29-6
Changes in Cash FlowsExample -Dynamic Mattress Company
Cash flows from operating activities:
Net income 60
Depreciation 20
Decrease (increase) in accounts receivable -25
Decrease (increase) in inventories 5
Increase (decrease) in accounts payable 25
Net cash flow from operating activities 85
Cash flows from investing activities:
Investment in fixed assets -30
Cash flows from financing activities:
Dividends -30
Sale (purchase) of marketable securities -25
Increase (decrease) in long-term debt 30
Increase (decrease) in short-term debt -25
Net cash flow from financing activities -50
Increase (decrease) in cash balance 5

29-7
Changes in Cash Flows
Example - Dynamic Mattress Company
Dynamic sources of cash flows1. It earned $60 million of net income (operating activity).2. It set aside $20 million as depreciation. Remember that depreciation is
not a cash outlay. Thus, it must be added back in order to obtain Dynamic’s cash flow (operating activity).
3. It reduced inventory, releasing $5 million (operating activity).4. It increased its accounts payable, in effect borrowing an additional $25
million from its suppliers (operating activity).5. It issued $30 million of long-term debt (financing activity).

29-8
Changes in Cash Flows
Example - Dynamic Mattress Company
Dynamic uses of cash flows1. It allowed accounts receivable to expand by $25 million (operating activity).
In effect, it lent this additional amount to its customers.
2. It invested $30 million (investing activity). This shows up as the increase in gross fixed assets in Table 29.2.
3. It paid a $30 million dividend (financing activity). (Note: The $30 million increase in Dynamic’s equity in Table 29.2 is due to retained earnings: $60 million of equity income, less the $30 million dividend.)
4. It purchased $25 million of marketable securities (financing activity).
5. It repaid $25 million of short-term bank debt (financing activity)).

29-9
Working Capital
Simple Cycle of operations
Cash
Finished goods
Receivables Raw materials
29-10
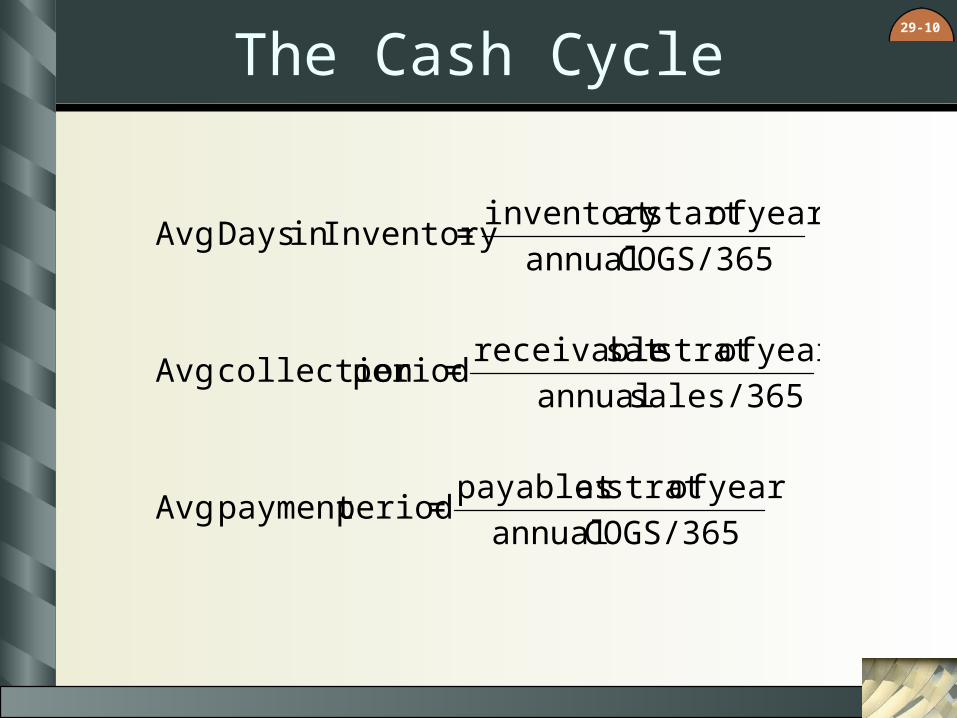
The Cash Cycle
COGS/365 annual
year ofstrat at payables=periodpayment Avg
sales/365 annual
year ofstrat at sreceivable=period collection Avg
COGS/365 annual
year ofstart at inventory =Inventoryin Days Avg

29-11
Cash Budgeting
Steps to preparing a cash budgetStep 1 - Forecast the sources of cash.
Step 2 - Forecast uses of cash.
Step 3 - Calculate whether the firm is facing a cash shortage or surplus.

29-12
Cash Budgeting
Example - Dynamic Mattress Company
Dynamic forecasted sources of cash
AR ending balance = AR beginning balance + sales - collections

29-13
Cash Budgeting
Example - Dynamic Mattress Company
Dynamic collections on AR
First QuarterSecond Quarter
Third QuarterFourth
Quarter
1. Receivables at start of period 150 199 181.6 253.6
2. Sales 560 502 742 836
3. Collections:
Sales in current period (70%) 392 351.4 519.4 585.2
Sales in last period (30%) 119* 168 150.6 222.6
Total collections 511 519.4 670 807.8
4. Receivables at end of period 1 + 2 - 3 199 181.6 253.6 281.8
* We assume that sales in the last quarter of the previous year were $397 million.

29-14
Cash Budgeting
Example - Dynamic Mattress Company
Dynamic forecasted uses of cash Payment of accounts payable Labor, administration, and other expenses Capital expenditures Taxes, interest, and dividend payments

29-15
Cash Budgeting
Example
Dynamic
cash budget
First Second Third Fourth
Quarter Quarter Quarter Quarter
Sources of cash:
Collections on accounts receivable 511 519.4 670 807.8
Other 0 0 77 0
Total sources 511 519.4 747 807.8
Uses of cash:
Payments on accounts payable 250 250 267 261
Increase in inventory 150 150 170 180
Labor and other expenses 136 136 136 136
Capital expenditures 70 10 8 14.5
Taxes, interest, and dividends 46 46 46 46
Total uses 652 592 627 637.5
Sources minus uses -141 -72.6 120 170.3
Cash at start of period 25 -116 -188.6 -68.6
Change in cash balance -141 -72.6 120 170.3
Cash at end of period -116 -188.6 -68.6 101.7
Minimum operating balance 25 25 25 25
Cumulative financing required 141 213.6 93.6 -76.7
Calculation of short-term borrowing requirement:

29-16
A Short Term Financing Plan
Example -
Dynamic
Mattress
Company-
Financing PlanFinancing Plan
continuedcontinued
First Second Third Fourth
Quarter Quarter Quarter Quarter
New borrowing:
1. Bank loan 100 0 0 0
2. Stretching payables 16 92.4 0 0
3. Total 116 92.4 0 0
Repayments:
4. Bank loan 0 0 7.6 92.4
5. Stretching payables 0 16 92.4 0
6. Total 0 16 100 92.4
7. Net new borrowing 116 76.4 -100 -92.4
8. Plus securities sold 25 0 0 0
9. Less securities bought 0 0 12.4 75.3
10. Total cash raised 141 76.4 -112.4 -167.7

29-17
A Short Term Financing Plan
Example -
Dynamic
Mattress
Company-
Financing PlanFinancing Plan
First Second Third Fourth
Quarter Quarter Quarter Quarter
Bank loan 100 100 92.4 0
Stretching payables 16 92.4 0 0
Net securities sold 25 25 12.6 -62.7
Interest payments
11. Bank loan 0 2.5 2.5 2.3
12. Stretching payables 0 0.8 4.6 0
13. Interest on securities sold 0 0.5 0.5 0.3
14. Net interest paid 0 3.8 7.6 2.6
15. Cash required for operations 141 72.6 -120 -170.3
16. Total cash required 141 76.4 -112.4 -167.7
Note: Cumulative borrowing and security sales

29-18
Financial Planning
Planning Horizon - Time horizon for a financial plan.
Departments are often asked to submit 3 alternatives– Optimistic case = best case– Expected case = normal growth– Pessimistic case = retrenchment
Financial plans help managers ensure that their financial strategies are consistent with their capital budgets. They highlight the financial decisions necessary to support the firm’s production and investment goals.

29-19
Financial Planning
Why Build Financial Plans?Contingency planningConsidering optionsForcing consistency

29-20
Financial Planning Steps
Inputs Outputs
Outputs - Projected financial statements (pro forma). Financial ratios. Sources and uses of funds.
Planning Model
Planning Model - Equations specifying key relationships.
Inputs - Current financial statements. Forecasts of key variables (such as sales or interest rates).

29-21
Dynamic Mattress Financial Plan
2009 2008
Net working capital 190 140
Fixed assets:
Gross investment 350 320
Less depreciation 100 80
Net fixed assets 250 240
Total net assets 440 380
Long-term debt 90 60
Net worth (equity and retained earnings) 350 320
Long-term liabilities and net worth* 440 380* When only net working capital appears on a firm’s balance sheet, this figure (the sum of long-term liabilities and net worth) is often referred to as
Condensed year-end balance sheets for2009 and 2008 for Dynamic MattressCompany (figures in $ millions).

29-22
Dynamic Mattress Financial Plan
Latest and forecasted operating cash flows for Dynamic Mattress Company (figures in $ millions).
2009 2010 2011 2012 2013 2014
1. Revenues 2200 2640 3168 3801.6 4561.9 5474.3
2. Costs (92% of revenues) 2055 2428.8 2914.6 3497.5 4197 5036.4
3. Depreciation (9% of net fixed assets at start of year) 20 22.5 29.7 35.6 42.8 51.3
4. EBIT (1-2-3) 125 188.7 223.7 268.5 322.2 386.6
5. Interest (10% of long-term debt at start of year) 5 9 23.4 31.8 42 54.3
6. Tax at 50% 60 89.8 100.1 118.3 140.1 166.2
7. Net income (4-5-6) 60 89.8 100.1 118.3 140.1 166.2
8. Operating cash flow (3+7) 80 112.4 129.8 154 182.9 217.5

29-23
Dynamic Mattress Financial Plan
Latest and forecasted amounts of external capital required for Dynamic Mattress Company(figures in $ millions).
2009 2010 2011 2012 2013 2014
Sources of capital:
1. Net income plus depreciation 80 112.4 129.8 154 182.9 217.5
Uses of capital:
2. Increase in net w orking capital (NWC)
assuming NWC = 11% of revenues
3. Investment in f ixed assets (FA)
assuming net FA = 12.5% of revenues
4. Dividend (60% of net income) 30 53.9 60.1 71 84.1 99.7
5. Total uses of funds (2+3+4) 110 256.8 213.9 255.5 305.5 365.4
6. External capital required (1-5) 30 144.5 84 101.6 122.6 147.9
30 102.5 95.7 114.8 137.8 165.4
50 100.4 58.1 69.7 83.6 100.4

29-24
Dynamic Mattress Financial Plan
Latest and pro forma balance sheets for Dynamic Mattress Company (figures in $ millions).
2009 2010 2011 2012 2013 2014
Net working capital 190 290.4 348.5 418.2 501.8 602.2
Net fixed assets 250 330 396 475.2 570.2 684.3
Total net assets 440 620.4 744.5 893.4 1072.1 1286.5
Long-term debt 90 234.5 318.5 420 542.7 690.6
Equity 350 385.9 426 473.3 529.4 595.8
Total long-term liabilities and equity 440 620.4 744.5 893.4 1072.1 1286.5

29-25
Financial Planning Models
Pro Formas - Projected or forecasted financial statements.
Percentage of Sales Model - Planning model in which sales forecasts are the driving variable and most other variables are proportional to sales.
Balancing Item - Variable that adjusts to maintain the consistency of a financial plan. Also called plug.

29-26
Planners Beware
Many models ignore realities such as depreciation, taxes, etc.
Percent of sales methods are not realistic because fixed costs exist.
Most models generate accounting numbers not financial cash flows
Adjustments must be made to consider these and other factors.

29-27
Growth & External Financing
assetsnet
equityx
equity
incomenet x
incomenet
earnings retained=
assetsnet
earnings retained=rategrowth Internal
Sustainable growth rate = plowback ratio x retrun on equity
Sustainable growth rate - Steady rate at which a firm can grow without changing leverage

29-28
Web Resources
Click to access web sitesClick to access web sites
Internet connection requiredInternet connection required
www.directpayment.org
www.nacha.org
www.phoenixhecht.com
www.gecfosolutions.com
www.federalreserve.gov