Chapter 2 Use of Percentiles and Z -Scores in … · be analyzed as a continuous variable in...
20
29 V.R. Preedy (ed.), Handbook of Anthropometry: Physical Measures of Human Form in Health and Disease, DOI 10.1007/978-1-4419-1788-1_2, © Springer Science+Business Media, LLC 2012 Abstract Percentiles and Z-scores are often used to assess anthropometric measures to help evaluate children’s growth and nutritional status. In this chapter, we first compare the concepts and applications of percentiles and Z-scores and their strengths and limitations. Compared to percentiles, Z-scores have a number of advantages: first, they are calculated based on the distribution of the reference population (mean and standard deviation), and thus reflect the reference distribution; second, as standardized quantities, they are comparable across ages, sexes, and anthropometric measures; third, Z-scores can be analyzed as a continuous variable in studies. In addition, they can quantify extreme growth status at both ends of the distribution. However, Z-scores are not straightforward to explain to the public and are hard to use in clinical settings. In recent years, there has been growing support to the use of per- centiles in some growth and obesity references. We also discuss the issues related to cut point selec- tions and outline the fitting/smoothing techniques for developing reference curves. Finally, several important growth references and standards including the previous and new WHO growth reference/ standards and the US 2000 CDC Growth Charts, are presented and compared. They have been devel- oped based on different principles and data sets and have provided different cut points for the same anthropometric measures; they could, thus, provide different results. This chapter will guide readers to understand and use percentiles and Z-scores based on recent growth references and standards. Abbreviations BMI Body mass index CDC Centers for Disease Control and Prevention IOTF International Obesity Task Force HAZ Height- or length-for-age Z-score MGRS Multicentre Growth Reference Study NCHS National Center for Health Statistics NHANES National Health and Nutrition Examination Survey SD Standard deviation WHO World Health Organization WHZ Weight-for-age Z-score Chapter 2 Use of Percentiles and Z-Scores in Anthropometry Youfa Wang and Hsin-Jen Chen Y. Wang () Department of International Health, Johns Hopkins Bloomberg School of Public Health, Center for Human Nutrition, 615 N Wolfe St. E2546, Baltimore, MD 21205, USA e-mail: [email protected]
Transcript of Chapter 2 Use of Percentiles and Z -Scores in … · be analyzed as a continuous variable in...
29V.R. Preedy (ed.), Handbook of Anthropometry: Physical Measures of Human Form in Health and Disease, DOI 10.1007/978-1-4419-1788-1_2, © Springer Science+Business Media, LLC 2012
Abstract Percentiles and Z -scores are often used to assess anthropometric measures to help evaluate children’s growth and nutritional status. In this chapter, we fi rst compare the concepts and applications of percentiles and Z -scores and their strengths and limitations. Compared to percentiles, Z -scores have a number of advantages: fi rst, they are calculated based on the distribution of the reference population (mean and standard deviation), and thus refl ect the reference distribution; second, as standardized quantities, they are comparable across ages, sexes, and anthropometric measures; third, Z -scores can be analyzed as a continuous variable in studies. In addition, they can quantify extreme growth status at both ends of the distribution. However, Z -scores are not straightforward to explain to the public and are hard to use in clinical settings. In recent years, there has been growing support to the use of per-centiles in some growth and obesity references. We also discuss the issues related to cut point selec-tions and outline the fi tting/smoothing techniques for developing reference curves. Finally, several important growth references and standards including the previous and new WHO growth reference/standards and the US 2000 CDC Growth Charts, are presented and compared. They have been devel-oped based on different principles and data sets and have provided different cut points for the same anthropometric measures; they could, thus, provide different results. This chapter will guide readers to understand and use percentiles and Z -scores based on recent growth references and standards.
Abbreviations
BMI Body mass index CDC Centers for Disease Control and Prevention IOTF International Obesity Task Force HAZ Height- or length-for-age Z -score MGRS Multicentre Growth Reference Study NCHS National Center for Health Statistics NHANES National Health and Nutrition Examination Survey SD Standard deviation WHO World Health Organization WHZ Weight-for-age Z -score
Chapter 2 Use of Percentiles and Z -Scores in Anthropometry
Youfa Wang and Hsin-Jen Chen
Y. Wang (�) Department of International Health , Johns Hopkins Bloomberg School of Public Health, Center for Human Nutrition , 615 N Wolfe St. E2546 , Baltimore , MD 21205 , USA e-mail: [email protected]

30 Y. Wang and H.-J. Chen
2.1 Introduction
Anthropometric assessment for children and adolescents involves the use of growth standards and/or growth references for assessing their growth, nutritional status and well being (Wang et al. 2006 ; WHO 1995 ) . A growth standard refl ects optimal growth, suggesting that all children have the poten-tial to achieve that level, while a growth reference is simply the distribution used for comparison (WHO MGRSG 2006a ) .
Percentiles and Z -scores in anthropometric measures have been widely used to help assess young people’s nutritional status and growth, such as undernutrition (e.g., underweight, stunting and wast-ing) and overnutrition (i.e., overweight and obesity), see Tables 2.1 and 2.2 . Often, percentiles (such as the 5th, 85th, 95th, 97th, 99th percentiles) and Z -scores (e.g., -2 and +2) are used to classify various health conditions, and sex-age-specifi c anthropometric measures cut-points (based on Z -scores or percentiles) are provided in tables and as smoothed curves on growth charts (see Figs. 2.1 and 2.2 ).
For the past four decades, the World Health Organization (WHO) has recommended the use of growth reference (or “growth chart”), mainly based on Z -scores of anthropometric measures, to assess children’s nutritional status and growth. These growth charts were developed based on data
Table 2.1 Comparison of percentiles and Z -scores in anthropometry
Percentiles Z -scores
1. Defi nition The percentage of observations (or population) falls below the value of a variable
The number of standard deviation (SD) away from the mean, when the distribution is normal
2. Scale Rank scale Continuous scale (from – ∞ to ∞) 3. Strengths (a) Intuitively more understandable (a) Allowing comparisons across ages and sexes
(b) Indicating the expected prevalence (b) Able to quantify the extreme values (c) Good for assessing the longitudinal changes
in growth status 4. Limitations (a) Not comparable across different
anthropometries Diffi cult to perceive than percentiles, especially
for the public (b) Extreme values are lumped to the highest/
lowest percentile (c) Not suitable for assessing longitudinal
growth status 5. Under normal distribution, a percentile must correspond to a fi xed Z -score.
Following is a list of usually used percentile- Z -score conversion values. 0.2nd –3 2.3rd –2 2.5th –1.96 5th –1.64 15th –1.04 16th –1 50th (median) 0 84th +1 85th +1.04 95th +1.64 97.5th +1.96 97.7th +2 99.8th +3
This table lists the key defi nitions and scales of percentiles and Z -scores, and compares their strengths and limitations. In practical setting, users would often face the task to convert Z -scores to percentiles or vice versa. Thus, this table also shows the corresponding values between percentiles and Z -scores

312 Use of Percentiles and Z-Scores in Anthropometry
Table 2.2 The 1995 WHO growth reference: use of percentiles and Z -scores
Outcomes Anthropometric measures and cut points Indication of growth/nutrition problems
Infants and children (<10 years) Stunting HAZ < –2 Z score, or <3rd percentile Chronic malnutrition Wasting/thinness WHZ < –2 Z score, or <3rd percentile Acute malnutrition, current malnutrition Overweight WHZ > 2 Z score Overweight
Adolescents (> =10 years) Stunting HAZ <–2, or <3rd percentile Chronic malnutrition Thinness BMI-for-age < 5th percentile Underweight At risk of overweight BMI-for-age > =85th percentile Overweight Obese BMI-for-age > =85th percentile and
triceps and subscapular Obesity
skinfold thickness-for-age > =90th percentiles
This table summarizes the cut-points of percentiles and Z -scores to defi ne problematic growth status in children and adolescents when using anthropometric measures. These cut-points based on statistical distribution are often adopted by other growth references/standards including the recent new WHO growth standards and references HAZ : Height- or length-for-age Z -score; WHZ : Weight-for-age Z -score; BMI : Body mass index (WHO 1995 )
Fig. 2.1 The 2006 WHO growth standards: BMI-for-age percentiles for boys under 2-year-old. The curves for the 3rd, 15th, 50th, 85th, and 97th percentiles of 0–2 year-old boys’ BMI-for-age are presented in this growth chart (Preprinted from WHO Growth Standards website, with permission)
collected in the United States (Wang et al. 2006 ) . In 1995 , WHO recommended the use of the sex-age-specifi c percentiles of some anthropometric measures for adolescents (WHO 1995 ) . Historically, the WHO international growth references focused more on undernutrition problems, including wasting, stunting and underweight, even as the need to address a growing obesity problem in many countries has risen over the past two decades. The earlier versions of WHO growth
32 Y. Wang and H.-J. Chen
references were based on US data, whereas the new 2006 WHO Growth Standards for preschool age children have been developed based on data collected from several countries (see below).
Pediatric growth charts have been widely used globally by researchers, pediatricians, nurses and parents to assess the growth and nutritional status of children, but often users might not be aware of their limitations (Wang et al. 2006 ) . For example, growth charts were not designated as a sole diag-nostic instrument. Instead, they contribute to forming an overall clinical impression of the child being measured (CDC 2000 ) . In addition, many users are not aware of the differences between “growth standard” and “growth reference” as these two terms are often used interchangeably.
In this chapter, we fi rst describe the concepts and application of percentiles and Z -scores in anthropometry and compare their limitations and strengths. Next, we address two important issues: the selection of anthropometric measure cut points and the statistical methods and techniques for growth curve fi tting and smoothing. Finally, we describe several international growth references including the 2006 WHO Growth Standards, growth references based on the US population, and an international reference for childhood obesity. In some of these references, anthropometric values corresponding to certain Z -scores and percentiles are provided.
2.2 The Use of Z -Scores
The use of Z -scores is recommended for several reasons (Table 2.1 ). First, Z -scores are calculated based on the distribution of the reference population (both the mean and the standard deviation [SD]); thus, they refl ect the reference distribution. Second, as standardized measures, Z -scores are comparable
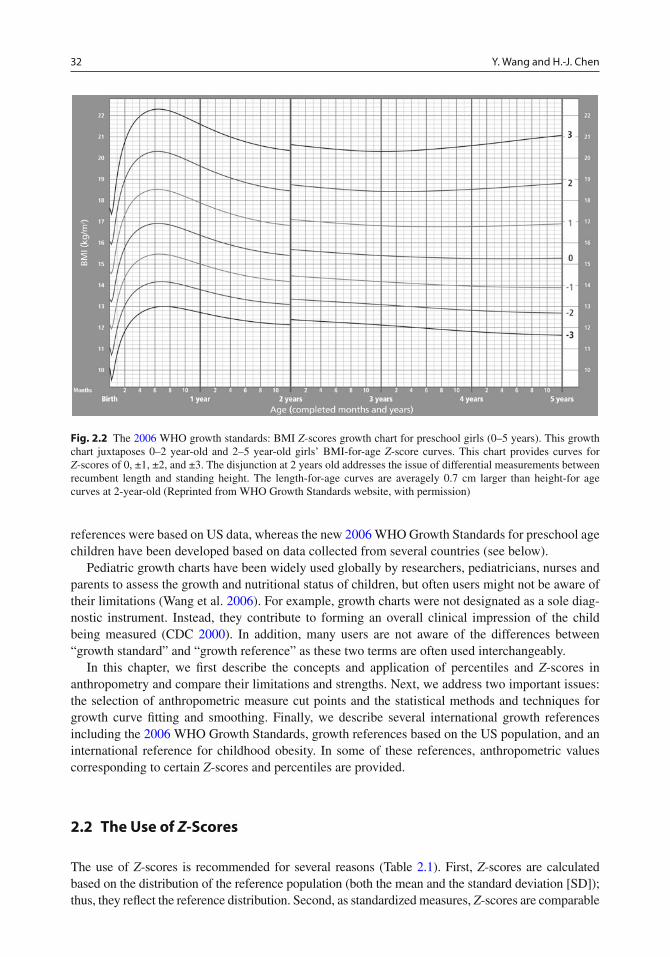
Fig. 2.2 The 2006 WHO growth standards: BMI Z -scores growth chart for preschool girls (0–5 years). This growth chart juxtaposes 0–2 year-old and 2–5 year-old girls’ BMI-for-age Z -score curves. This chart provides curves for Z -scores of 0, ±1, ±2, and ±3. The disjunction at 2 years old addresses the issue of differential measurements between recumbent length and standing height. The length-for-age curves are averagely 0.7 cm larger than height-for age curves at 2-year-old (Reprinted from WHO Growth Standards website, with permission)
332 Use of Percentiles and Z-Scores in Anthropometry
across age, sex and measure (as a measure of “dimensionless quantity”). Third, a group of Z -scores can be subject to summary statistics such as mean and SD and can be studied as a continuous variable. In addition, Z -score values can quantify the growth status of children outside of the percentile ranges (WHO 1995 ) . However, the major limitation of Z -scores is that they are not straightforward to explain to the public and may be of limited use in clinical settings. The WHO and US Centers for Disease Control and Prevention (CDC) have ever developed a statistical software to help researchers to calcu-late Z -scores based on the 1978 WHO/NCHS (National Center for Health Statistics) references.
In statistical terms, Z -scores are a special application of transformation rules. The Z -score for a measure (e.g., height or BMI), indicates how far and in what direction (positive vs. negative) a mea-sured value deviates from the population mean, expressed in units of the population SD. It is a dimensionless quantity derived from dividing the difference between individual value ( x ) and the population mean ( µ ) by the population SD ( σ ). The transformed Z -scores’ distribution will have a mean of zero and a SD of one (i.e., mean = 0, SD = 1). This conversion process is called standard-izing or normalizing.
ms−
=x
Z
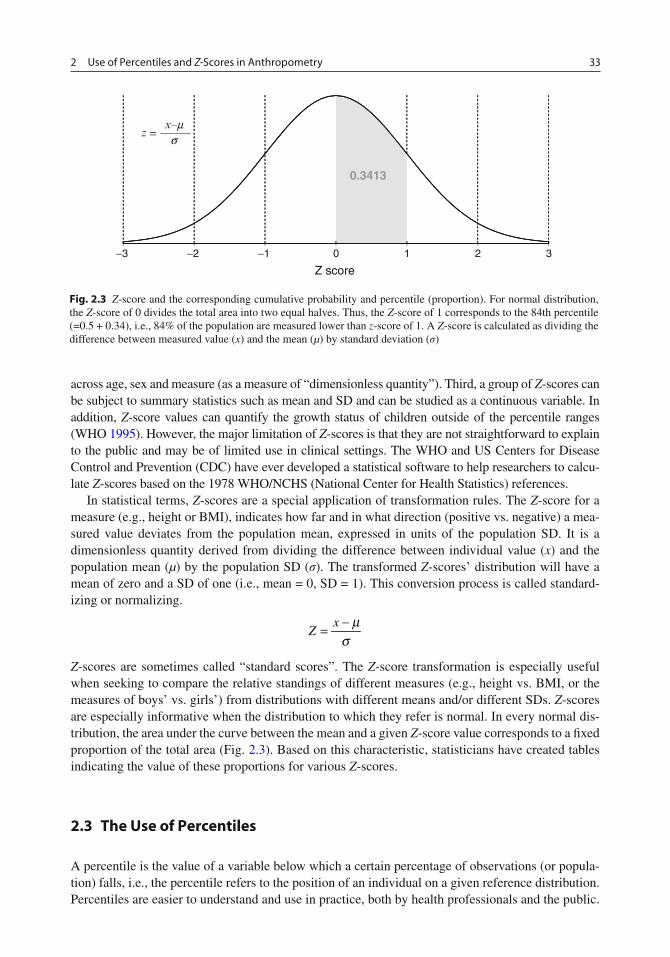
Z -scores are sometimes called “standard scores”. The Z -score transformation is especially useful when seeking to compare the relative standings of different measures (e.g., height vs. BMI, or the measures of boys’ vs. girls’) from distributions with different means and/or different SDs. Z -scores are especially informative when the distribution to which they refer is normal. In every normal dis-tribution, the area under the curve between the mean and a given Z -score value corresponds to a fi xed proportion of the total area (Fig. 2.3 ). Based on this characteristic, statisticians have created tables indicating the value of these proportions for various Z -scores.
2.3 The Use of Percentiles
A percentile is the value of a variable below which a certain percentage of observations (or popula-tion) falls, i.e., the percentile refers to the position of an individual on a given reference distribution. Percentiles are easier to understand and use in practice, both by health professionals and the public.
0.3413
−3 −2 −1 0 1 2 3
Z score
=x–m
zs
Fig. 2.3 Z -score and the corresponding cumulative probability and percentile (proportion). For normal distribution, the Z -score of 0 divides the total area into two equal halves. Thus, the Z -score of 1 corresponds to the 84th percentile (=0.5 + 0.34), i.e., 84% of the population are measured lower than z -score of 1. A Z -score is calculated as dividing the difference between measured value ( x ) and the mean ( µ ) by standard deviation ( σ )
34 Y. Wang and H.-J. Chen
In addition, a percentile dictates the expected percentage of a population should be above (or below) it (see Table 2.1 ). Often age-sex-specifi c percentiles are recommended to assess children’s growth and nutritional status based on anthropometric measures as well as other health conditions such as blood pressure. During recent years, there is a growing consensus on using sex- and age-specifi c BMI percentiles as cut-offs instead of weight-for-height Z -scores (WHZ) for assessing overweight and obesity as well as thinness/underweight in children over 2 years old (Kuczmarski et al. 2002 ; Wang et al. 2006 ; WHO 2006 ) . The widely used percentiles include the 3rd, 5th, 50th (median), 85th, 95th, 97th, 99th.
In statistics, the term percentile and the related term percentile rank are often used in descriptive statistics as well as in the reporting of scores from norm-referenced tests. Percentiles are often rep-resented graphically, using a normal curve (Fig. 2.3 ). A normal curve is always represented with some key features. The peak or the center of the bell-shaped curve stands the point of the mean of the distribution. The mean ( z = 0) halves the normal distribution into two equal and symmetric areas. On both the right and left sides each, the graph can be shown as divided into three parts, according to Z -scores of 1, 2, and 3 SD to the right and -1, -2, -3 SD to the left, respectively. At each point of these SDs, the corresponding percentile (or cumulative probability) is fi xed. In other words, as long as the distribution is normal, every SD unit on the x -axis has a specifi c percentile which is always paired with them. Therefore, on a normal curve, 34.13% of the data lies between 0 and -1 (or +1), 13.59% between -1 and -2 (or between +1 and +2), and 2.14% between -2 and -3 (or between +2 and +3). The remaining 0.14% of the data lies below -3 (or above +3).
A limitation of using percentiles is that the same interval of percentile values corresponds to different ranges in absolute values for different measurements. For instance, increments from 85th to 90th percentile correspond to different ranges in subscapular and in triceps skinfold thickness. Even within the distribution of one measurement, same increments at different percentile levels could cor-respond to different changes in both Z -scores and absolute measures. In addition, it does not allow for quantifying the change in percentile values near the extremes of the reference distribution (e.g., people in the uppermost 1st percentile can have very different absolute values). For these rea-sons, we suggest that percentiles should not be used to assess change in status over time, while change in Z -scores is a better measure. Z -scores are more useful in research while percentiles are easier for use in clinical settings and by the public.
Z -scores and percentiles can be converted to each other, but the commonly used cut points of each are not at exactly comparable levels. For example, Z -scores of 2 and -2 correspond to the 97.7th and 2.3rd percentiles, while the 85th and 5th percentiles correspond to Z -scores of 1.04 and -1.65, respectively.
2.4 Selection of Anthropometric Measure Cut Points
In growth references and standards based on international data or those from individual countries, Z -scores of +2 and -2, and/or certain percentiles (e.g., 5th, 85th, and 95th), have often been chosen as cut points to classify problematic growth/nutritional status such as malnutrition or obesity. These criteria are based on statistical distribution rather than on the risks of health outcomes (see Table 2.2 ). Ideally, the criteria should be established based on their associations with higher health risks, and cut points should be chosen for the particular purpose. The classifi cation of “higher risk” indi-viduals and population groups should be based on the evidence of increased risk for morbidity, mortality, or/and impaired function performance (WHO 1995 ) .

352 Use of Percentiles and Z-Scores in Anthropometry
However, to assess the relationship between different indicators and health outcomes is often more diffi cult in children than in adults. It is even harder to choose cut points for “higher risk”. In children, two types of health outcomes need to be considered for studying the association with anthropometric measurement/indicators: (a) the short- and intermediate-term health outcomes dur-ing childhood and adolescence, and (b) long-term health outcomes in adulthood. Before well- designed long-term longitudinal studies provided suffi cient information for these purposes, the International Obesity Task Force (IOTF) recommended sex-age-specifi c cut points for overweight and obese children and adolescents. These cut points are distinct from other statistical criteria based on growth reference/standards: they correspond to the overweight and obesity status in adulthood. (Cole et al. 2000 , see below) Even with these unprecedented features, more solid evidence regarding the association between growth status and health outcomes are necessary.
In addition to connecting the deviations in anthropometric indicators and health/functional con-sequences, Pelletier suggested two more considerations for selecting cut points to assess growth and nutritional status: (1) Variation in age, maturation, gender, ethnicity, and other “technical” factors that affect anthropometry “independently” or in conjunction with health or social causes or conse-quences; and (2) The intended or potential applications of the anthropometric cut points, such as clinical diagnosis, policy formulation, social utility as well as advocacy for particular problems and solutions. (Pelletier 2006 ) He further argued that different indicators and cut points are needed for different application purposes. However, this notion may not be agreed upon by various user com-munities, including international expert groups, because universal cut points of simple indicators are considered easier to use and better for international comparisons.
Nevertheless, given the increasing understanding of the complexity of assessing children’s growth and the new reality of a growing global obesity epidemic, as well as that many developing countries are facing a double burden of under- and over-nutrition problems, the international community and the public might take a new position if appropriate single cut points for simple indicators cannot be developed (Wang et al. 2006 ) . For example, although the WHO has been recommending to use the BMI cut points of 25 and 30 for adults to classify overweight and obesity since the mid 1990s (WHO 1995 ) , later research suggested that different BMI cut points may be more appropriate for specifi c populations and for different purposes, for example, lower BMI cut points of 23 and 25 for some Asian Pacifi c populations (Inoue et al. 2000 ; WHO Expert Consultation 2004 ) .
2.5 Statistical Methods/Techniques Used for Curve-Fitting or Smoothing
Growth references/standards are used to compare an individual’s measurements with that of the population. To develop sex-age-specifi c growth curves of critical percentile or Z -score cut points is important. Several different curve-fi tting and smoothing techniques have been used in the develop-ment of existing growth references. When the 1978 WHO/NCHS growth curves were developed, a least-squares-cubic-spline technique was used (Hamill et al. 1979 ) . The BMI and skinfold thickness percentiles being recommended by the WHO for international use were developed based on data collected in the US using the LOWESS method (LOcally WEighted regression Scatter-plot Smoothing) (Must et al. 1991 ) . Several recent growth and obesity references, such as the 2000 CDC Growth Charts, the 2006 WHO Growth Standards, and the 2007 WHO Growth references (see below) used the LMS (lambda, mu, and sigma) estimation procedure or its modifi ed approach to accommodate the distributions of different anthropometric measurements. The LMS method was introduced in the 1980 s (Cole et al. 1992 ). For example, the CDC Growth Charts were carried out in

36 Y. Wang and H.-J. Chen
two stages: curve smoothing and transformation. The LMS method was modifi ed for the transformation stage (Kuczmarski et al. 2002 ) . In general, methods which summarize the centiles as an underlying distribution, such as the LMS method, “borrow strength” from neighboring ages and centiles and thus make better use of the data than the separate percentile-fi tting methods used in the 1978 WHO/NCHS reference (Wang et al. 2006 ) .
Based on the smoothed percentile curves over ages, the normalized distribution can be recon-structed and the Z -scores can be estimated. Theoretically, under normal distribution, each percentile should correspond to a Z -score (see below). Thus, the transformation procedure of the data is then carried out. For example, to develop the US 2000 CDC Growth Charts, Box-Cox transformation procedure and/or LMS (lambda, mu, and sigma) method were conducted for correcting the skewness of distribution at each age month, and then converting the percentile into Z -score. Given the LMS equation for specifi c indicator and the estimated parameters λ ( L , the power in the Box-Cox transfor-mation for “correcting” the skewness), µ ( M , median), and σ ( S , a coeffi cient of variation) for each age of month, child’s anthropometric measurements can be converted to Z -scores and percentiles (see below).
These different methods may affect the fi nal curves and cut points. For example, the BMI percen-tiles developed by Must et al. and Hammer et al. based on the First National Health and Nutrition Examination Survey (NHANES) data are not identical (Hammer et al. 1991 ; Must et al. 1991 ) . Take the 5th percentile for 18-year-old white adolescents as an example, Must et al.’s fi gure vs. Hammer et al.’s was 17.5 vs. 18.3 for males and 16.9 vs. 17.2 for females, respectively. For the 95th percentile, the fi gures were 29.9 vs. 29.7 for males and 29.2 vs. 31.0 for females, respectively. Hence, different curve-fi tting and smoothing techniques could lead to different results.
2.6 Practical Methods and Techniques: How to Use Growth References/Standards
To use a growth reference or standard to help assess individual or groups of children’s growth and nutritional status, one will need to compare the subject(s)’s measure against the cut points pro-vided in such growth references or standards, provided either in tables or growth charts (called growth curves). To use the growth charts, the users plot the observations on them. Since the growth charts were designated applicable to different sexes and age ranges, users need to choose the appropriate one.
Figure 2.4 is an example showing how to use the 2000 CDC Growth Charts to monitor a girl’s growth in weight. This is a weight-for-age chart, and the girl’s body weight measurements at 11 months after birth were plotted on the chart. The chart shows reference curves for the 5th, 10th, 25th, 50th, 75th, 90th and 95th percentiles from birth to 36 months old. These curves can be used to evalu-ate the position of a child’s anthropometric measurement relative to the reference population. The girl’s weight-for-age was fi rst generally between the 50th and 75th percentile curves after birth, but faltered to below the 10th percentile after 15 months old. This indicated failure of growth and the need of more careful examination and care such as better nutrition and/or appropriate treatment to the underlying causes. Similarly, one can use the growth charts for different anthropometric indica-tors provided by other growth references and standards.
Another way to use the recent growth references and standards, in particular, for research, is to calculate exact percentile and Z -score values for the subjects’ measured values, compared to the selected reference or standard. The WHO 2006 and 2007 growth standards and reference and the 2000 CDC Growth Charts utilized similar techniques of smoothing and transformation (the LMS method).

372 Use of Percentiles and Z-Scores in Anthropometry
They all provide the sex-age-specifi c LMS parameters that allow users to calculate the Z -score corresponding to each individual child’s measured value. The formula for calculating Z -score is:
( ) ( )−= ≠ = =
1 lnwhen 0; when 0;
Ly y
M Mz L z L
SL S
where y is the individual observation, while the LMS parameters for the individual’s age and sex need to be applied. For example, to calculate the WHZ for a 60-month-old (or 5 year-old) boy with a body weight of 15 kg based on the 2000 CDC Growth Reference, the reference table of weight-for-age
Fig. 2.4 An example from CDC of how to use growth chart to monitor individual child’s growth (Adapted from http://www.cdc.gov/growthcharts/case_mary.htm ). This fi gure uses a case to show how to apply a growth chart to assess a child’s growth trajectory and health status. It shows a girl who had experienced growth faltering after age of 6 months. More details were provided in text (Reprinted from CDC website: http://www.cdc.gov/growthcharts/case_mary.htm )
38 Y. Wang and H.-J. Chen
children of 2–20 years of age should be used. The estimated LMS parameters for boys aged 60.0–60.9 months old are listed on the reference table as -1.000453886 for L , 18.48592413 for M , and 0.129879257 for S . Thus, the boy’s WHZ is -1.79 according to the formula.
As for percentile, it can be calculated after the Z -score is obtained, because the distributions of anthropometric measurements are close to normal under the Box-Cox transformation. In the above case, where the WHZ is -1.79, the corresponding percentile is the 3.7th. Namely, within the normal distribution with a mean of 0 and SD of 1, the cumulative probability below -1.79 SD from mean is 0.037. This can be calculated using a statistical software or by looking up the Z -table. This boy’s body weight was below the lowest 5% compared to 60-month-old boys in the 2000 CDC reference. If the CDC’s weight-for-age chart for children aged 2–20 was used, this boy’s body weight would be plotted between the 3rd and 5th percentile curves.
Additional attention should be paid to including the 2006 WHO Growth Standard’s formulas to adjust distorted extreme values and the 2000 CDC Growth Reference’s formula for special occasions when L parameter equals to 0 (CDC 2000 ; WHO MGRSG 2006a ) . Furthermore, the formula for Z -scores of different anthropometric indicators may vary in the 2006 WHO Growth Standards (WHO MGRSG 2006a ) . Users should read the manuals carefully before applying these formulae. Furthermore, even though the recent growth charts from the CDC and the WHO since 2000 are developed using similar statistical techniques, the reference populations and data used to develop them are quite different (see below).
2.7 The WHO Growth References and Standards
Since the 1970s the WHO has published several versions of growth references, recommended for international use to help assess children’s growth and nutritional status. Thus far, there are three widely known and used versions: the 1978 WHO/NCHS Growth References (for children up to age 10), the WHO Growth References (for children and adolescents up to age 19), and the 2006 WHO Growth Standards (for preschool children, under 6 years of age).
Most of the earlier versions are based on growth references developed and used in the US. The US CDC NCHS developed growth references based on national survey data collected in the 1960s and 1970s. These NCHS Growth Charts included anthropometric measurements such as weight-for-height, weight-for-age, height-for-age, and head circumference-for-age. They were developed based on several national surveys (namely NHES II, NHES III, and NHANES I) and a local study for infants (the Fels Longitudinal Study). More details about the history of the WHO growth references are provided elsewhere (WHO 1995 ; Wang et al. 2006 ; WHO MGRSG 2006a ) .
2.7.1 The 1978 WHO/NCHS Growth References
In 1978, the WHO/CDC produced a normalized version of the US CDC/NCHS growth curves, showing Z -scores instead of absolute anthropometric values. It was called the 1978 WHO/NCHS Growth References, and has been widely used all over the world since then. However, it has a num-ber of limitations (Wang et al. 2006 ) . For example, one of its main limitations is about representa-tiveness, because the growth reference for infants was developed based on data collected from the Fels Longitudinal Study, which followed mainly formula-fed children in an area in Ohio State in mid-west of the USA. Moreover, these children were followed with large time intervals, which

392 Use of Percentiles and Z-Scores in Anthropometry
provided insuffi cient data to describe the rapid and changing rate of growth in early infancy (Kuczmarski et al. 2002 ) . Recent studies have shown that the growth pattern of breast-fed infants differed from that of formula-fed infants (Victora et al. 1998 ; de Onis and Onyango 2003). To over-come these limitations, new growth references and standards have been developed in the US in 2000 and by the WHO in 2006 , respectively (see below).
2.7.2 The 1995 WHO Growth References
In 1995 , a WHO Expert Committee reviewed existing growth references and research fi ndings, and then re-endorsed the use of the 1978 WHO/NCHS Growth Charts. In addition, for adolescents, the committee recommended use of the sex- and age-specifi c BMI ³ the 85th percentile and both triceps and subscapular skinfold thickness ³ the 90th percentile for classifying “at risk of overweight” and “overweight” (WHO 1995 ) . These percentiles were developed based on the US data. Previously the WHO had not made specifi c recommendation for adolescents. The committee acknowledged the weaknesses of the NCHS infant growth charts, and some potential problems when using these US adolescent BMI percentiles in other populations. For example, their predictability to future health risk and generalizability for children from developing countries was unknown. The committee rec-ommended the use of these references on a provisional basis, until better reference data became available (WHO 1995 ) .
2.7.3 The 2006 WHO Growth Standards for Preschool Children
On April 27, 2006, the WHO released new growth standards for children from birth to the age of 60 months (5 years old, see Tables 2.3 and 2.4 ). In order to establish growth standards for different races/ethnicities, the Multicentre Growth Reference Study (MGRS) recruited affl uent, breast-fed, and healthy infants/children whose mothers did not smoke during or after delivery from six cities in
Table 2.3 Key anthropometric measures and indicators provided in recent WHO and US CDC growth references/standards
2000 CDC growth reference
2006 WHO growth standards
2007 WHO growth reference
Applicable age range (years) 0–3 2–20 0–2 2–5 5–19
Length/height/stature-for-age v v v v v Weight-for-age v v v – v Weight-for-length v – v – – Weight-for-height/stature – v – v – BMI-for-age – v v v v Head circumference-for-age v – v – – Arm circumference-for-age – – v a v – Subscapular skinfold-for-age – – v a v – Triceps skinfold-for-age – – v a v – This table lays out the anthropometric measures included in the three sets of recent growth references/standards. The fi rst two are widely used by people in different countries “v” indicates available measures a From 3 months to 5 years (CDC 2000 ; de Onis et al. 2007 ; WHO 2006 )
Tab
le 2
.4 E
stim
ated
chi
ldre
n/ad
oles
cent
s’ p
erce
ntile
s an
d Z -
scor
es c
orre
spon
ding
to th
e re
com
men
ded
BM
I cu
t poi
nts
for
adul
ts f
or th
e cl
assi
fi cat
ion
of th
inne
ss g
rade
2 (
BM
I <
=17
),
over
wei
ght (
BM
I >
=25
), a
nd o
besi
ty (
BM
I >
=30
)
Boy
s G
irls
Perc
entil
es c
orre
spon
ding
to
Z -sc
ores
cor
resp
ondi
ng to
Pe
rcen
tiles
cor
resp
ondi
ng to
Z -
scor
es c
orre
spon
ding
to
D
ata
Sour
ce
BM
I =
17
BM
I =
25
BM
I =
30
BM
I =
17
BM
I =
25
BM
I =
30
BM
I =
17
BM
I =
25
BM
I =
30
BM
I =
17
BM
I =
25
BM
I= 3
0
WH
O (
2007
) a U
SA
– –
– –
1 2
– –
– –
1 2
IOT
F (2
000,
200
7) b
Bra
zil
3 95
.3
99.9
–1
.9
1.7
3.1
2 84
.8
98.0
–2
.0
1.0
2.1
Hon
g K
ong
9 88
.3
96.9
–1
.3
1.2
1.9
6 90
.2
98.2
–1
.6
1.3
2.1
The
Net
herl
ands
2
94.5
99
.7
–2.2
1.
6 2.
7 3
93.5
99
.7
–1.9
1.
5 2.
7 Si
ngap
ore
6 89
.5
98.3
–1
.5
1.3
2.1
9 93
.0
99.0
–1
.3
1.5
2.3
UK
2
90.4
99
.1
–2.2
1.
3 2.
7 2
88.3
98
.8
–2.0
1.
2 2.
3 U
SA
1 81
.9
96.7
–2
.4
0.9
1.8
3 83
.5
96.0
–2
.0
1.0
1.8
Thi
s ta
ble
sum
mar
izes
the
corr
espo
ndin
g pe
rcen
tiles
and
Z -s
core
s w
hich
cor
resp
ond
to th
e sp
ecifi
c B
MI
cut-
poin
ts a
t the
age
(e.
g., 1
8 or
19
year
s ol
d) o
f tr
ansi
tioni
ng to
adu
lthoo
d a W
HO
(20
07 )2
007
grow
th r
efer
ence
, BM
I eq
ual t
o th
ese
cut p
oint
s at
age
19
year
s ol
d (d
e O
nis
et a
l. 20
07 )
b The
IO
TF
refe
renc
e, a
t age
of
18 y
ears
on
each
cou
ntry
’s d
ata
set (
Col
e et
al.
2000
, 200
7 )
412 Use of Percentiles and Z-Scores in Anthropometry
Brazil, Ghana, India, Norway, Oman, and the USA. This study included a longitudinal sample followed from birth to 24-month-old and a cross-sectional sample recruiting 18- to 71-month-old children. The MGRS data showed great similarities in growth across all study centers, with only about 3% of the total variation in growth was contributed by race/country. Hence, the multicenter data were pooled for a more powerful sample (WHO MGRSG 2006a ) . The data demonstrate that preschool children in different regions of the world have the same growth potential to achieve similar levels of heights and weights when their nutrition and health care needs are met. However, this con-clusion was based on children from birth to 6 years (72 months) of age. Genetic infl uence on inter-individual variation in the ultimate height in adulthood cannot be ruled out.
The WHO recommends these new standards in replace of the old versions for international use among preschool children, although some countries still use their own growth references/stan-dards. The 2006 WHO Growth Standards include anthropometric indicators such as length/height-for-age, weight-for-age, weight-for-length/height, BMI-for-age, head circumference-for-age, arm circumference-for-age, subscapular skinfold-for-age, and triceps skinfold-for-age. Recumbent length-for-age was used for indicator of stature from birth to age of 24 months, while standing height-for-age from 2 to 5 years old. Due to the differential measurements of body length and body height, a 0.7 cm taller in length at 24-month-old was observed. Thus, to address this issue, weight-for-length for 0–2 year-old children and weight-for-height for 2–5 year-old children were presented on separate charts. Meanwhile, growth charts for all other indicators that involve length/height show a disjunction between the curves for 0–24 months-old and those for 24–60 month-old, like the BMI-for-age chart in Fig. 2.2 . The WHO provides growth charts and tables of percentiles and Z -scores, separately for girls and boys. On the Z -score growth charts, the curves for 0, ±2, and ±3 SD from the age specifi c median of certain indicator were plotted. As for the percentile charts, fi ve curves for the 3rd, 15th, 50th, 85th, and 97th percentiles were shown for each indicator. In the tables, the values of indicator at 0, ±1, ±2, and ±3 SD, and for percentiles of 1st, 3rd, 5th, 15th, 25th, 50th, 75th, 85th, 97th and 99th were provided for each age of month.
The 2006 WHO Growth Standards differ from the existing growth charts in many ways. They sug-gest “how children should grow”, which is developed using a prescriptive approach, not just a descrip-tive one. They show that all children can attain similar levels of healthy height and weight as long as they have adequate feeding and health care. A key characteristic of the new standards is that it pre-sumed breastfeeding as a biological norm. Furthermore, the pooled sample from the six participating countries creates better international standards, in contrast to the previous growth reference based on children from a single country. The standards can serve as tools for detecting both under-nutrition and obesity. The standards go beyond the previous references and include indicators like BMI and skin-folds. These charts are particularly useful in monitoring childhood obesity, which is relevant to public health in both developed and developing countries (WHO MGRSG 2006a ; WHO 2006 ) .
2.7.4 The 2007 WHO Growth Reference for School-Age Children and Adolescent
Based on recommendations made in 2006 by a group of international experts including the lead author, in particular, regarding the limitation of the previous growth references and the needs of better ones for assessing both overweight and undernutrition (Wang et al. 2006 ) , the WHO released another set of growth reference for children and adolescents aged 5–19 years in 2007 (de Onis et al. 2007 ) . To our knowledge, this reference has not been widely used yet. The references were derived based on the same US dataset as for the 1978 WHO/NCHS growth references but used different growth curve
42 Y. Wang and H.-J. Chen
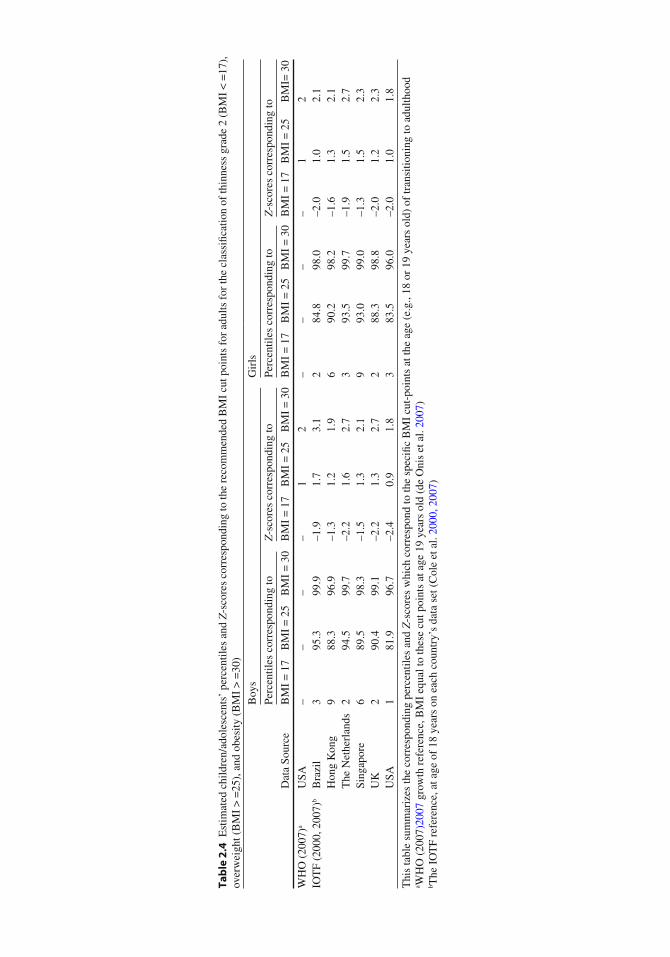
smoothing techniques. The references include three indicators: BMI-for-age, weight-for-age, and height-for-age (Tables 2.3 and 2.4 ). For each indicator, charts and tables for percentiles and Z -scores were provided. The percentiles charts draw the 3rd, 15th, 50th, 85th, and 97th percentile curves, while the tables provided the values of anthropometric measures for more percentiles (1st, 3rd, 5th, 15th, 25th, 50th, 75th, 85th, 95th, 97th, and 99th). Regarding Z -scores of these three indicators, the curves for 0, ±1, ±2, ±3 Z -scores from median were shown on charts, and the values for these cut points were provided in tables.
The WHO recommended the cut points for overweight and obesity based on the BMI-for-age Z -scores. With the smoothing methods, it showed that the BMI-for-age Z -score = 1 at 19 year-old was 25.4 for boys and 25.0 for girls, which equals or is close to the WHO BMI cut point of 25 used in adults. Thus, the reference curve of Z -score = 1 was recommended to classify “overweight”, while that of Z -score > 2 for classifying “obesity” based on the same idea. BMI-for-age Z -score < -2 and < -3 were set as the cut-points for thinness and severe thinness, respectively (WHO MGRSG 2006b ) .
2.8 The 2000 International Obesity Task Force (IOTF) Reference for Classifi cation of Childhood Obesity
To defi ne “overweight” and “obesity” among children aged 2–18 years, the IOTF endorsed a series of sex-age-specifi c BMI cut points. Based on data from multinational surveys, the cut points were developed from sex-specifi c BMI-age curves that pass through a BMI of 25 for overweight and 30 for obesity at age of 18 years old, respectively (Cole et al. 2000 ) . Thus, these classifi cations of over-weight and obesity in young people would be more biologically or pathologically meaningful com-pared to those references just based on distribution (i.e. percentiles or Z -scores). Given the concern for the differences among races/ethnicities, the reference was developed based on nationally repre-sentative data from six countries/regions: Brazil, Great Britain, Hong Kong, the Netherlands, Singapore, and the USA. The LMS methods with Box-Cox transformation was used to construct percentile curves. At age of 18 years, the BMI Z -score corresponding to 25kg/m 2 ranged from 0.91 to 1.68 across the six countries/regions, while the pooled data of the WHO MGRS data showed that this BMI for 19 year-old was about at the Z -score of 1 for boys and girls (Table 2.4 ). This IOTF refer-ence used pooled data to calculate sex-age-specifi c BMI cut points for overweight and obesity.
The cut points were reported for children from 2 to 18 years old in every half year in age for clinical use. For epidemiological studies, Cole et al. recommended that the mid-year cut points could be used for the year group to obtain unbiased prevalence estimate (e.g., using the cut point at 7.5 years for the age group 7.0–7.9). However, these BMI cut points for obesity may be less precise than those for overweight because of the larger variations in the percentile curves for obesity among the 6 datasets.
The IOTF reference has been recommended for international use due to its unique strengths: First, it is based on large data sets from six countries or regions and covers different races/ethnicities. Second, the BMI cutoffs are linked to adult cutoffs for overweight and obesity, which are good indicators of risks for adverse health outcomes. On the other hand, there are also concerns about this reference (Wang 2004 ) . There is great variation in the prevalence of overweight and obesity across the six countries/regions that the IOTF reference population was based on Cole et al. ( 2000 ) .
Moreover, recently the same procedure was applied using the same data for generating the cut point curve for thinness in children and adolescents, using the WHO-recommended cut point for adults of BMI < 17 for grade 2 thinness (Cole et al. 2007 ) . They intentionally used the term “ thinness” rather than “underweight”. Because these cut-points were only based on BMI-for-age, they want to make this distinct from wasting and stunting. The 2007 WHO Growth Reference also used the term thinness rather than underweight for BMI-Z < 2.

432 Use of Percentiles and Z-Scores in Anthropometry
2.9 The US 2000 CDC Growth Charts
As mentioned above, the US CDC/NCHS has developed several versions of growth charts since the 1970s, and some of them had been recommended by the WHO for international use. In order to address the limitations of the previous growth charts, the CDC/NCHS released new growth charts in 2000, which were developed based on data of infants and children from birth to 5 years old in the Third National Health and Nutrition Examination Survey (NHANES III) to replace the Fels Longitudinal Study, and on the other data from earlier national surveys.
The growth charts consist of a series of percentile curves of selected anthropometric measures, including weight-for-age, length-for-age, weight-for-length, and head circumference-for-age from birth to 36 months of age. For children above 2 years old, there are weight-for-age, stature-for-age, BMI-for-age, and weight-for-stature charts for children taller than 77cm (Table 2.3 ) (CDC 2000 ; Kuczmarski et al. 2002 ) . The charts are presented separately for 0–2 year-old and for 2–20 year-old children, thus, the issue of disjunction between length and height measurements at the age of 2 years is not observable on the charts.
Growth curves for these anthropometric measurements were laid out as two sets of charts, “Individual Growth Charts” and “Clinical Growth Charts.” Each chart is printed on one page, namely “Individual Growth Charts.” As for “Clinical Growth Charts”, length/stature-for-age and weight-for-age were graphed on a same page, and so were the head circumference-for-age and weight-for-length charts displayed together. The growth charts and tables present the 3rd, 5th, 10th, 25th, 50th, 75th, 90th, 95th and 97th percentile curves. The 85th percentile curve is in addition provided, on the BMI-for-age and weight-for-stature growth charts for 2–20 year-old children because this is a recom-mended cut point for childhood overweight. Regarding the Z -score for the indicators, only tables provide the detailed corresponding values indicator-for-age at 0, ±0.5, ±1, ±1.5, and ±2.
2.10 Comparisons of Using Different International and Local Growth References/Standards
As many previous studies have used the earlier growth references and various recent and new growth references/standards will continue to be used in the future, it is important to know how comparable the results are if these references and standards are applied on the same study population. A number of studies have attempted to address this issue. Following highlighted some of the related fi ndings (see Table 2.5 for a summary). Overall, they showed that the estimated unhealthy growth status can vary when different growth reference/standards are applied.
One recent study showed that the Bangladeshi, Dominican Republic, and North American/European children aged 0–12 months had higher prevalence of overweight and stunting but lower prevalence of underweight, when the 2006 WHO Growth Standards was used compared to the 2000 CDC Growth Charts. In addition, according to the 2000 CDC Growth Charts, these children’s WHZ decreased as age increased but were relatively stable based on the 2006 WHO Growth standards (de Onis et al. 2006 ) . The US children showed a higher prevalence in stunting but lower prevalence in wasting when using the WHO 2006 Growth Standards versus the 2000 CDC Growth Charts, but they used the percentiles as cut points (5th for undernutrition and 95th for overweight) (Mei et al. 2008 ) . Schwarz et al., compared the prevalence of undernutrition among Gabonese children based on three growth references/standards, namely the 1978 WHO/NCHS, the 2000 CDC and the 2006 WHO ones. They found that the prevalence of wasting and stunting was signifi cantly higher when applying the 2006 WHO Growth Standards among 3-month-old children, while for 15-month-old

44 Y. Wang and H.-J. Chen
Table 2.5 Comparisons of prevalence (%) of growth/nutritional status problems assessed based on The 1978 WHO/NCHS reference, The 2000 CDC Growth Charts and The 2006 WHO Growth Standards
Country/settings, data collection year, sample
WHO/NCHS (1978) CDC ( 2000 ) WHO ( 2006 ) References
Bangladesh, 1996–1997 4,787 children aged 0–60
months
N/A Stunting: 54.4% Stunting: 60.1% de Onis et al. (2006) Wasting: 56.5% Wasting: 52.9%
Gabon, 2002 (baseline) 289 children aged 3 months 289 children aged 15
months (at follow-up)
Stunting: 10–15% Stunting: 10–15% Stunting: 23.5% Schwarz et al. (2008)
Wasting: 1.0% Wasting: 4.0% Wasting: 0.7% Stunting: ~30% Stunting: ~15% Stunting: ~30% Wasting: ~15% Wasting: ~20% Wasting: ~5%
Madagascar, 2004 969 children aged 6–59
months
Stunting: 35.8% Stunting: 30.0% N/A Roberfroid et al. (2006) Wasting: 3.2% Wasting: 12.2%
US, 1999–2004 (NHANES) 3,920 children aged 0–59
months
N/A Stunting: 3.7% Stunting: 7.0% Mei et al. (2008) Wasting: 5.0% Wasting: 2.8%
Overweight: 9.2% Overweight: 12.9% Dominican Republic, 2004 N/A Overweight: 6.4% Overweight: 8.6% de Onis et al. (2006)
10,381 children aged 0–60 months
This table shows selected studies that compared the results based on different growth references/standards, and they have revealed considerable differences. Except for the US study, stunting is defi ned as length/height-for-age z scores < –2, wasting as weight-for-age z -scores (WHZ) < –2, and overweight as weight-for-length/height z -scores >2. Findings in the US study were based on the 5th or 95th percentiles for weight-for-age, length-for-age, and weight-for-height, respectively
children, the prevalence of stunting was lowest based on the 2000 CDC reference (Schwarz et al. 2008 ) . Comparing the 1978 WHO/NCHS Growth References and the 2000 CDC Growth Charts, Roberfroid et al. ( 2006 ) demonstrated that for children aged 6–59 months in Madagascar, the esti-mated prevalence of stunting and underweight were different. The prevalence of stunting was higher using the 1978 reference, while the prevalence of underweight was more salient when applying the 2000 CDC references.
These fi ndings suggest that, when the CDC 2000 Growth Charts replaced the Fels Longitudinal Study with the NHANES III data, the reference was representative of a heavier preschool subpopula-tion. Thus, the prevalence of wasting became higher. It is important to consider the reference popula-tion and methods used for developing the references/standards when choosing a growth reference/standard for assessing problematic growth outcomes.
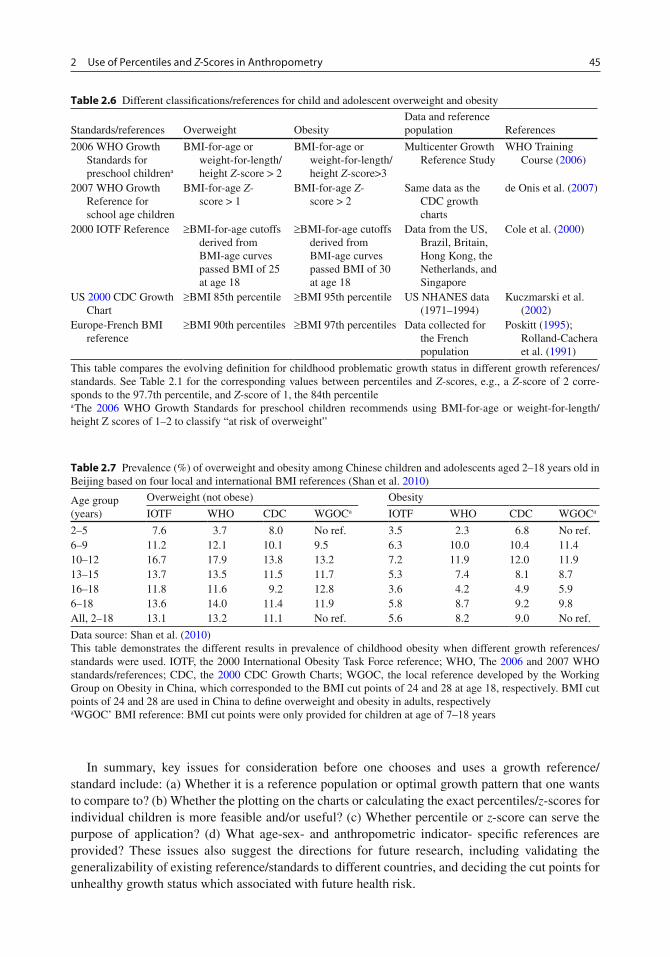
Table 2.6 summarizes the main references and classifi cations having been used to defi ne over-weight and obesity in children and adolescents. Table 2.7 shows that according to one of our recent studies, the obesity prevalence estimated for Chinese children aged 6–18 years old in Beijing could vary between 5.8% and 9.8%, but in relative term, by 69% (Shan et al. 2010 ) . Prevalence of over-weight in Dominican and the US children was lower when using the 2000 CDC Growth Charts than using the 2006 WHO Growth Standards, regardless of the cut points (de Onis et al. 2006 ; Mei et al. 2008 ; Table 2.5 ). These fi ndings indicate considerable differences in the prevalence of overweight/obesity based on different references, and the need of more research in these areas to help understand and guide appropriate applications of such references in different populations and for various purposes (Wang 2004 ; Wang et al. 2006 ) .
452 Use of Percentiles and Z-Scores in Anthropometry
Table 2.7 Prevalence (%) of overweight and obesity among Chinese children and adolescents aged 2–18 years old in Beijing based on four local and international BMI references (Shan et al. 2010 )
Age group (years)
Overweight (not obese) Obesity
IOTF WHO CDC WGOC a IOTF WHO CDC WGOC a
2–5 7.6 3.7 8.0 No ref. 3.5 2.3 6.8 No ref. 6–9 11.2 12.1 10.1 9.5 6.3 10.0 10.4 11.4 10–12 16.7 17.9 13.8 13.2 7.2 11.9 12.0 11.9 13–15 13.7 13.5 11.5 11.7 5.3 7.4 8.1 8.7 16–18 11.8 11.6 9.2 12.8 3.6 4.2 4.9 5.9 6–18 13.6 14.0 11.4 11.9 5.8 8.7 9.2 9.8 All, 2–18 13.1 13.2 11.1 No ref. 5.6 8.2 9.0 No ref.
Data source: Shan et al. ( 2010 ) This table demonstrates the different results in prevalence of childhood obesity when different growth references/standards were used. IOTF, the 2000 International Obesity Task Force reference; WHO, The 2006 and 2007 WHO standards/references; CDC, the 2000 CDC Growth Charts; WGOC, the local reference developed by the Working Group on Obesity in China, which corresponded to the BMI cut points of 24 and 28 at age 18, respectively. BMI cut points of 24 and 28 are used in China to defi ne overweight and obesity in adults, respectively aWGOC’ BMI reference: BMI cut points were only provided for children at age of 7–18 years
Table 2.6 Different classifi cations/references for child and adolescent overweight and obesity
Standards/references Overweight Obesity Data and reference population References
2006 WHO Growth Standards for preschool children a
BMI-for-age or weight-for-length/height Z -score > 2
BMI-for-age or weight-for-length/height Z -score>3
Multicenter Growth Reference Study
WHO Training Course ( 2006 )
2007 WHO Growth Reference for school age children
BMI-for-age Z -score > 1
BMI-for-age Z -score > 2
Same data as the CDC growth charts
de Onis et al. ( 2007 )
2000 IOTF Reference ³ BMI-for-age cutoffs derived from BMI-age curves passed BMI of 25 at age 18
³ BMI-for-age cutoffs derived from BMI-age curves passed BMI of 30 at age 18
Data from the US, Brazil, Britain, Hong Kong, the Netherlands, and Singapore
Cole et al. ( 2000 )
US 2000 CDC Growth Chart
³ BMI 85th percentile ³ BMI 95th percentile US NHANES data (1971–1994)
Kuczmarski et al. ( 2002 )
Europe-French BMI reference
³ BMI 90th percentiles ³ BMI 97th percentiles Data collected for the French population
Poskitt ( 1995 ) ; Rolland-Cachera et al. ( 1991 )
This table compares the evolving defi nition for childhood problematic growth status in different growth references/standards. See Table 2.1 for the corresponding values between percentiles and Z -scores, e.g., a Z -score of 2 corre-sponds to the 97.7th percentile, and Z -score of 1, the 84th percentile a The 2006 WHO Growth Standards for preschool children recommends using BMI-for-age or weight-for-length/height Z scores of 1–2 to classify “at risk of overweight”
In summary, key issues for consideration before one chooses and uses a growth reference/ standard include: (a) Whether it is a reference population or optimal growth pattern that one wants to compare to? (b) Whether the plotting on the charts or calculating the exact percentiles/ z -scores for individual children is more feasible and/or useful? (c) Whether percentile or z -score can serve the purpose of application? (d) What age-sex- and anthropometric indicator- specifi c references are provided? These issues also suggest the directions for future research, including validating the generalizability of existing reference/standards to different countries, and deciding the cut points for unhealthy growth status which associated with future health risk.
46 Y. Wang and H.-J. Chen
2.11 Applications to Other Areas of Health and Diseases
People can use the percentiles and Z -scores of anthropometric measures in various growth standards or references to assess children’s growth and nutritional status problems including malnutrition (e.g., stunting, wasting, underweight) and overnutrition (e.g., overweight and obesity). In addition, percen-tiles of other health measures such as blood pressure has been used to help classify elevated blood pressure (or called “hypertension”) in young people (National High Blood Pressure Education Program 1996 ) . This means that blood pressure readings are ranked according to where they fall against the percentage of the reference population of all children, while taking into account varia-tions in gender, height, age, and other developmental parameters. For example, in the USA, the updated blood pressure tables were developed based on the NHANES 1999–2000 data, and included the 50th, 90th, 95th, and 99th percentiles (NHLBI 2004 ) . The 50th percentile indicates the midpoint of normal blood pressure range, and is additionally compared to earlier guidelines. “Prehypertension” is defi ned as average systolic and/or diastolic blood pressure (SBP/DBP) ³ 90th and < 95th percen-tiles (previously defi ned as “high normal”). Hypertension is defi ned based on the 95th percentile, and the 99th percentile allows more precise staging of hypertension.
Summary Points
Percentile and • Z -score of anthropometry are statistical tools to help assess child growth and nutritional status, relative to a reference or standard population. Percentile and • Z -score can be converted to each other when the distribution is normal. Percentile indicates the percentage of observations that fall below a certain value. It is easier to • use and for the public to understand, but may not be a good quantitative tool. • Z -score is the distance and direction of an observation away from the population mean. Although it is not very intuitively perceivable, this dimensionless quantity can be used for comparison across indicators and populations. Individual children’s measurments can be transformed to Z -scores based on growth reference, and Z -scores can be used as a continuous variable in research. Usually a growth reference is developed based on data collected from a representative sample of • a population and shows the growth pattern of the reference population, which may not be an opti-mal growth pattern. A growth standard derived from a healthy and affl uent child population can be regarded as an • optimal distribution of growth. Various statistical methods and techniques have been used for curve-fi tting and smoothing to help • derive the related cut points for anthropometric measures in existing growth references and stan-dards. These methods/techniques can affect the derived cut points. The • 2006 WHO Growth Standards for preschool children differ from the other existing refer-ences, and show “how children should grow.” It is developed based on a prescriptive approach for evaluating children’s growth rather than a descriptive one. The • 2006 WHO Growth Standards provide a tool for detecting both under nutrition and obesity, and thus address the double burden of under- and over-nutrition problems. They are relevant to both developed and developing countries. The US • 2000 CDC Growth Charts have a number of improvements when compared to earlier versions of CDC growth references, but may not be appropriate for use in other populations, in particular, developing countries.
472 Use of Percentiles and Z-Scores in Anthropometry
Prevalence of problematic growth or nutrition status patterns can be different when estimated • based on different growth references/standards. More research is needed to assess and guide the appropriate application of international growth • references and standards in different populations, in particular, in developing countries.
Acknowledgments This work was supported in part by research grants from the NIH/NIDDK (R01DK81335-01A1, 1R03HD058077-01A1, R03HD058077-01A1S1) and the Nestle Foundation. We also thank Irwin Shorr for his comments on an earlier draft of this chapter.
References
Centers For Disease Control and Prevention. CDC growth charts [Online]. 2000. http://www.cdc.gov/growthcharts/Default.htm . Accessed 31 Jan 2010.
Cole TJ, Green PJ. Smoothing Reference Centile Curves - the LMS Method and Penalized Likelihood. Stat Med. 1992;11:1305–19.
Cole TJ, Bellizzi MC, Flegal KM, Dietz WH. Establishing a standard defi nition for child overweight and obesity worldwide: international survey. BMJ. 2000;320:1240–3.
Cole TJ, Flegal KM, Nicholls D, Jackson AA. Body mass index cut offs to defi ne thinness in children and adolescents: international survey. BMJ. 2007;335:194–7.
de Onis M, Onyango AW. The Centers for Disease Control and Prevention 2000 growth charts and the growth of breastfed infants. Acta Paediatr. 2003;92:413–9.
de Onis M, Onyango AW, Borghi E, Garza C, Yang H; WHO Multicentre Growth Reference Study Group. Comparison of the World Health Organization (WHO) Child Growth Standards and the National Center for Health Statistics/WHO international growth reference: implications for child health programmes. Public Health Nutr. 2006;9:942–7.
de Onis M, Onyango AW, Borghi E, Siyam A, Nishida C, Siekmann J. Development of a WHO growth reference for school-aged children and adolescents. Bull World Health Organ. 2007;85:660–7.
Hamill PV, Drizd TA, Johnson CL, Reed RB, Roche AF, Moore WM. Physical growth: National Center for Health Statistics percentiles. Am J Clin Nutr. 1979;32:607–29.
Hammer LD, Kraemer HC, Wilson DM, Ritter PL, Dornbusch SM. Standardized percentile curves of body-mass index for children and adolescents. Am J Dis Child. 1991;145:259–63.
Inoue S, Zimmet P, Caterson I, Chen C, Ikeda Y, Khalid AK, Kim YS, Bassett J. The Asia-Pacifi c perspective: redefi n-ing obesity and its treatment. 2000. http://iotf.org/.
Kuczmarski RJ, Ogden CL, Guo SS, Grummer-Strawn LM, Flegal KM, Mei Z, Wei R, Curtin LR, Roche AF, Johnson CL. 2000 CDC Growth Charts for the United States: methods and development. Vital Health Stat. 2002;11:1–190.
Mei Z, Ogden CL, Flegal KM, Grummer-Strawn LM. Comparison of the prevalence of shortness, underweight, and overweight among US children aged 0 to 59 months by using the CDC 2000 and the WHO 2006 growth charts. J Pediatr. 2008;153:622–8.
Must A, Dallal GE, Dietz WH. Reference data for obesity: 85th and 95th percentiles of body mass index (wt/ht2) and triceps skinfold thickness. Am J Clin Nutr. 1991;53:839–46.
National High Blood Pressure Education Program. Update on the 1987 Task Force Report on High Blood Pressure in Children and Adolescents: A working group report from the National High Blood Pressure Education Program. National High Blood Pressure Education Program Working Group on Hypertension Control in Children and Adolescents. Pediatrics. 1996;98:649–58.
NHLBI. Blood pressure tables for children and adolescents. http://www.nhlbi.nih.gov/guidelines/hypertension/child_tbl.htm . Accessed 10 Jan 2009.
Pelletier D. Theoretical considerations related to cutoff points. Food Nutr Bull. 2006;27:S224–36. Poskitt EME. Defi ning Childhood Obesity - the Relative Body-Mass Index (BMI). Acta Paediatr. 1995;84:961–3. Roberfroid D, Lerude MP, Pérez-Cueto A, Kolsteren P. Is the 2000 CDC growth reference appropriate for developing
countries? Public Health Nutr. 2006;9:266–8. Rolland-Cachera MF, Cole TJ, Sempé M, Tichet J, Rossignol C, Charraud A. Body-Mass Index Variations - Centiles
from Birth to 87 Years. Eur J Clin Nutr. 1991;45:13–21.
48 Y. Wang and H.-J. Chen
Schwarz NG, Grobusch MP, Decker ML, Goesch J, Poetschke M, Oyakhirome S, Kombila D, Fortin J, Lell B, Issifou S, Kremsner PG, Klipstein-Grobusch K. WHO 2006 child growth standards: implications for the prevalence of stunting and underweight-for-age in a birth cohort of Gabonese children in comparison to the Centers for Disease Control and Prevention 2000 growth charts and the National Center for Health Statistics 1978 growth references. Public Health Nutr. 2008;11:714–9.
Shan X, Xi B, Chen H, Hou D, Wang Y, Mi J. Prevalence and behavioral risk factors of overweight and obesity among children aged 2–18 in Beijing, China. Int J Ped Obe. 2010;5:383–9 .
Victora CG, Morris SS, Barros FC, de Onis M, Yip R. The NCHS reference and the growth of breastand bottle-fed infants. J Nutr. 1998;128:1134–8.
Wang Y. Epidemiology of childhood obesity - methodological aspects and guidelines: what is new? Int J Obes. 2004;28:S21–8.
Wang Y, Moreno LA, Caballero B, Cole TJ. Limitations of the current world health organization growth references for children and adolescents. Food Nutr Bull. 2006;27:S175–88.
WHO. Physical status: the use and interpretation of anthropometry. Report of a WHO Expert Committee. World Health Organ Tech Rep Ser. Geneva; 1995.
WHO. The WHO child growth standards website [Online]. 2006. http://www.who.int/childgrowth/en/ . Accessed 31 Jan 2010.
WHO Expert Consultation. Appropriate body-mass index for Asian populations and its implications for policy and intervention strategies. Lancet. 2004;363:157–63.
WHO Multicentre Growth Reference Study Group. WHO child growth standards: length/height-for-age, weight- forage, weight-for-length, weight-for-height and body mass index-for-age: Methods and development. Geneva: World Health Organization; 2006a.
WHO Multicentre Growth Reference Study Group. Assessment of differences in linear growth among populations in the WHO Multicentre Growth Reference Study. Acta Paediatr Suppl. 2006b;450:56–65.
WHO Training Course. Training course on child growth assessment: investigating causes of undernutrition and of overweight. November 2006. Geneva: WHO. http://www.who.int/childgrowth/training/jobaid_investigating_causes.pdf . Accessed 30 Jan 2010.