Chapter 2 - The demand for educationchecchi.economia.unimi.it/pdf/chpt2.pdf · Chapter 2 - The...
23
1 Chapter 2 - The demand for education In this chapter we analyse the reasons why people go to school. Our initial answer will call into play the notion of functioning by Nobel laureate Amartya Sen. We will then move to the theory of human capital by another Nobel laureate, Gary Becker, who portrays education as investment in human capital. Other alternative approaches, based on the idea of signalling, screening or convenient human traits, will be reviewed in chapter 6. The human capital approach derives from the assumption that perfect financial markets exist. When we remove this assumption, family then family income distribution becomes a limiting factor, and income inequality persistence arises as an equilibrium outcome. 1. Education as creation of minimal capabilities When discussing equality and justice, we typically consider the distribution of economic resources such as income and wealth. Amartya Sen has, however, repeatedly drawn our attention to the fact that mere ownership does not necessarily imply an increase in utility, since a person might be unable to benefit from the additional economic resources. Yet this may not depend so much on individual heterogeneity 1 as on individual capability to transform resources into behaviours so as to function adequately. 2 Being able to read, calculate and process information can be thought as a functioning necessary for conducting a normal social life (namely, appearing in public without shame). To convince the reader, here is a list of ordinary life acts that require some education in order to be performed successfully: using public transportation, finding a street address, checking a bill in a restaurant, signing a check, enrolling your child at school, reading the instructions on an electric appliance, and so on. We should be convinced that the capability of reading and computing in the entire population constitutes non-excludable public goods, since they allow a more complex organisation of social life. 3 In such a case, the public provision of compulsory education is equivalent to the provision of any other public goods. Whenever the externalities from individual choices are strong enough, there are good (at least from the economic view point) reasons to ensure a positive production of it. Public goods are characterised by underproduction in a market solution, because private demand would fall short of optimal provision. 4 This may offer a rationale for the widespread diffusion of some compulsory and freely provided education in all modern states after the French revolution. 5 However the public goods nature requires free access (as in the case of public defence or road building) but not necessarily 1 See the discussion on the relationship between equality and heterogeneity in Roemer 1986. 2 The exposition of the differences between functionings and capabilities is found in Sen 1992. A typical example of what is meant by functioning is the following: consider a free distribution of computers to children’s families in a school. Does this represent equality in resource distribution ? The answer depends on the ability to use the computers to help the children do their homework. If some parents are illiterate, and are unable to operate a computer since they cannot read the instructions (that is they have imperfections in their functionings), then resources are still unequally distributed (for they do not ensure equal capabilities in helping the children to learn), in spite of formal equality in their distribution. 3 Helliwell and Putnam 1999 show that education (both at individual level and as community average) is the most important predictor of political and social engagement (where “social trust” is measured either through objective indicators – like participating to meetings - or through subjective attitude towards other individuals – answering questions like “do you agree/disagree on the proposition ‘most people are honest’ ?”). 4 Even in a Tiebout world (Tiebout 1956), where people express their preferences with respect to expenditure and taxation by choosing the local community to live in, we could not be sure that a minimal provision of education would be achieved. For example, we could in fact obtain a self-sorting of families into communities according to the relative importance attributed to the importance of children’s education. And we would not be surprised to find local communities where girl’s education is considered redundant with respect to boy’s education. 5 Actually the first introduction of compulsory education is attributed to Fredrick the Great, who introduced it in Prussia in 1763, followed ten years later by the Austrian Queen Mary Theresa.
Transcript of Chapter 2 - The demand for educationchecchi.economia.unimi.it/pdf/chpt2.pdf · Chapter 2 - The...

1
Chapter 2 - The demand for education In this chapter we analyse the reasons why people go to school. Our initial answer will call into play the notion of functioning by Nobel laureate Amartya Sen. We will then move to the theory of human capital by another Nobel laureate, Gary Becker, who portrays education as investment in human capital. Other alternative approaches, based on the idea of signalling, screening or convenient human traits, will be reviewed in chapter 6. The human capital approach derives from the assumption that perfect financial markets exist. When we remove this assumption, family then family income distribution becomes a limiting factor, and income inequality persistence arises as an equilibrium outcome.
1. Education as creation of minimal capabilities When discussing equality and justice, we typically consider the distribution of economic resources such as income and wealth. Amartya Sen has, however, repeatedly drawn our attention to the fact that mere ownership does not necessarily imply an increase in utility, since a person might be unable to benefit from the additional economic resources. Yet this may not depend so much on individual heterogeneity1 as on individual capability to transform resources into behaviours so as to function adequately.2 Being able to read, calculate and process information can be thought as a functioning necessary for conducting a normal social life (namely, appearing in public without shame). To convince the reader, here is a list of ordinary life acts that require some education in order to be performed successfully: using public transportation, finding a street address, checking a bill in a restaurant, signing a check, enrolling your child at school, reading the instructions on an electric appliance, and so on. We should be convinced that the capability of reading and computing in the entire population constitutes non-excludable public goods, since they allow a more complex organisation of social life.3 In such a case, the public provision of compulsory education is equivalent to the provision of any other public goods. Whenever the externalities from individual choices are strong enough, there are good (at least from the economic view point) reasons to ensure a positive production of it. Public goods are characterised by underproduction in a market solution, because private demand would fall short of optimal provision.4 This may offer a rationale for the widespread diffusion of some compulsory and freely provided education in all modern states after the French revolution.5 However the public goods nature requires free access (as in the case of public defence or road building) but not necessarily 1 See the discussion on the relationship between equality and heterogeneity in Roemer 1986. 2 The exposition of the differences between functionings and capabilities is found in Sen 1992. A typical example of what is meant by functioning is the following: consider a free distribution of computers to children’s families in a school. Does this represent equality in resource distribution ? The answer depends on the ability to use the computers to help the children do their homework. If some parents are illiterate, and are unable to operate a computer since they cannot read the instructions (that is they have imperfections in their functionings), then resources are still unequally distributed (for they do not ensure equal capabilities in helping the children to learn), in spite of formal equality in their distribution. 3 Helliwell and Putnam 1999 show that education (both at individual level and as community average) is the most important predictor of political and social engagement (where “social trust” is measured either through objective indicators – like participating to meetings - or through subjective attitude towards other individuals – answering questions like “do you agree/disagree on the proposition ‘most people are honest’ ?”). 4 Even in a Tiebout world (Tiebout 1956), where people express their preferences with respect to expenditure and taxation by choosing the local community to live in, we could not be sure that a minimal provision of education would be achieved. For example, we could in fact obtain a self-sorting of families into communities according to the relative importance attributed to the importance of children’s education. And we would not be surprised to find local communities where girl’s education is considered redundant with respect to boy’s education. 5 Actually the first introduction of compulsory education is attributed to Fredrick the Great, who introduced it in Prussia in 1763, followed ten years later by the Austrian Queen Mary Theresa.

2
compulsory attendance. One possible explanation of this may come from the difference existing between those who decide (the parents) and those who obtain the benefits of the decision (the children). In addition, in many countries where poverty is endemic and child labour is not prohibited, children are a significant source of income for poor families. In such cases, society will aim to protect children from ‘wrong’ choices by their parents, as happens to what occurs in the case of vaccination against infectious diseases.6 When we try to match an empirical content with the idea of literacy and numeracy capabilities, we encounter several problems. In principle, we would like to test a representative sample of the population of interest. But this would lead to an over-estimate of deprivation in the older segment of the population, due to the natural decline in general abilities with age. In addition, the set of minimal capabilities evolves with time, and it is inappropriate to require the same set of competences from different age cohorts.7 Both considerations would suggest that capabilities should be assessed within each generation, more than in an intergenerational framework. Indeed, most international comparisons of educational attainments sponsored by the OECD are conducted over populations of the same age cohorts.8 But if we are interested in assessing the extent of capability deprivation in the entire population, we should resort to differentiated tests across the population, which would lead to insurmountable difficulties. For this reason, the easiest strategy is to use proxy measures, based on enrolment rates, on the assumption that attending school provides basic literacy and numeracy capabilities. In Table 1 we report some indicators that are used to produce the Human Development Indicator proposed by the United Nations Development Programme (see UNDP 2001 and previous issues). The first column shows an aggregate indicator of school attendance. By comparing it with the last column, it is easy to recognise that school enrolment is positively correlated with per capita income. While school attendance is a flow measure (i.e. it records the population fraction attending school per unit of time), the second column proposes a stock measure (i.e. the distribution of a given characteristic in the population in a specific date). In this case we observe that in almost the entire developed world primary school attendance is universal, leading to the presumption that basic capabilities are generally achieved. However, when we look at the third column (with measures available for only the subset of OECD countries9) we recognize that having attended school is by itself insufficient to grant control of literacy
6 Eckstein and Zilcha 1994 present an overlapping generation model where parents randomly differ in the degree of altruism, and show that the introduction of free compulsory education (financed through taxation) constitutes a second best policy, which is closer to the first best chosen by a benevolent dictator. A related argument is offered by Appleton, Hoddinott and Knight 1996, where they draw attention on the vertical integration nature of the educational process: thus reducing school attendance at early stages reduces possible inputs in subsequent stages. 7 In fact, knowledge deprivation is somehow a relative concept: in a population of illiterate persons, one is not ashamed to be illiterate oneself, and therefore the inability to read does not represent a bad functioning creating a limitation in freedom. 8 The most recent one is the PISA (Programme for International Student Assessment), ended in 2001. Previous researches were conducted by the IEA (International Association for the Evaluation of Educational Achievement). See OECD 2001, chapter F: “Learning outcomes of education”. 9 “The International Adult Literacy Survey (IALS) is the world’s first international comparative assessment of adult literacy skills. The IALS study has combined household survey methods and educational assessment to provide comparable estimates of literacy skills for 24 countries. The survey tests representative samples of adults (aged 16 –65) in their homes, asking them to undertake a range of common tasks using authentic materials from a wide range of social and cultural contexts. The IALS study is jointly sponsored by Statistics Canada, the US Center for Education Statistics and the Organisation for Economic Co-operation and Development (OECD). While traditional measures of literacy focus primarily on the ability to decode the printed word, the IALS study defines literacy as the ability to understand and use printed information in daily activities at home, at work and in the community. It compiled the cross-country data to ensure that the results are comparable across countries with different languages and cultures and that any known sources of bias are corrected.” (UNDP 2001, p.137). The UNDP report uses the percentage of adults lacking functional literacy skills, defined on the basis of prose literacy (i.e. the knowledge and skills needed to understand and use information from texts, including editorials, news stories, poems and fiction).

3
ability. The final two columns remind us that cultural deprivation is only one aspect of multifaceted deprivation. Even without being able to assess the direction of causality (higher mortality is the consequence of ignorance of basic sanitation rules, or the other way round: given the high rate child mortality, there are other social priorities, so that schools are neglected), we realize that the possibility to deliver the public service of compulsory education varies significantly across countries (and even within countries).
Table 1 – Indicators of diffusion of capabilities, life expectancy and per capita income - 1999
Combined primary, secondary and tertiary gross
enrolment rates (%)
Adult literacy rate (% population above 15 yrs)
People lacking functional literacy
skills (% age 15-65)
life expectancy at birth (years)
Gross domestic product per capita
(PPP US $)
High human development countries 91.0 98.5 n.a. 73.8 14.922
Medium human development countries 67.0 78.5 n.a. 67.0 3.044
Low human development countries 38.0 48.9 n.a. 56.0 1.241
Entire world 65.0 79.2 n.a. 66.7 6.980 for comparison: United States
95.0
99.0*
20.7
76.8
31.872
Japan 82.0 99.0* n.a. 80.8 24.898 Germany 94.0 99.0* 14.4 77.6 23.742 France 94.0 99.0* n.a. 78.4 22.897 Italy 84.0 98.4 n.a. 78.4 22.172 Great Britain 106.0 99.0* 21.8 77.5 22.093
Source: UNDP 2001, tables 1 and 4 - * indicates estimates.
2. Education as investment in human capital In the previous section we have outlined the idea that the state may oblige its citizens to attend some school in order to acquire basic capabilities so as to improve the organisation of social life. However we know that many individuals choose to attend school beyond the minimum requirement, and we will now go on to analyse this behaviour.10 A first approach conceives education as a commodity: people go to school because they enjoy acquiring new knowledge.11 In such a case the standard theory of utility maximisation predicts that the optimal demand for education will equate the marginal utility of additional knowledge to the marginal disutility of renouncing alternative uses of the time involved. Thus, as for any luxury item, income effect raises optimal consumption more than proportionally, which helps us to understand why rich countries reveal higher enrolment rates than poor countries. However, this explanation is at odds with most of the educational choices regarding tertiary education. At this stage of schooling, cost increases significantly when compared to secondary education, without any evidence of increased pleasure in attending university lectures. Thus education cannot be conceived merely as a commodity.12 10 So far we leave aside the question whether parents or children undertake educational choices, and we will maintain the simplifying assumption that individuals are held responsible for their educational choices. 11 A variant of this approach is to consider that education provides higher social status, and therefore individuals demand education in order to increase the esteem they obtain from other people. Fershtman, Murphy and Weiss 1996 offer a model along this line. 12 Schultz 1963 proposes a tripartite description of the roles played by education: a present consumption component (say the utility derived from the pleasure of knowing); a future consumption component (that takes into account the fact that education improves the ability to consume other goods in life – think of improved health conditions or better informed fertility choices associated with higher education); and an investment component (see below). For an attempt to disentangle consumption and investment components see Lazear 1977.

4
We can look at educational choice as investment decisions, where current income opportunities are renounced in exchange for better income prospects in the future. This is equivalent to purchasing a production unit today in order to obtain the rents associated with its ownership, net of depreciation associated with its usage. The close similarity with the investment theory of the firm, where physical capital is demanded up to the point where its marginal productivity equates its user cost, has led many economists to think of education as investment in human capital.13 However, on deeper scrutiny the analogy between investment in physical capital and investment in human capital proves somewhat imprecise. The main difference is that human capital is incorporated in human beings, and cannot be resold. While physical capital can be acquired at (almost any) desired amount in boom periods, and be resold during recession on secondary hand markets, human capital can be acquired mostly at the beginning of individual life, its pace of accumulation is given by physiological factors, and it cannot be resold.14 The feature of being embodied in human beings and being irreversible opens the door to many potential market failures, which are absent in the case of physical capital. To begin with, human capital cannot be collateralised, outside the case of slavery. While offering the machine as collateral eases borrowing from a bank in order to buy it, it is impossible to finance the education of your children offering their incorporated knowledge as collateral! Thus, whenever financial markets are plagued with informational asymmetries (as they typically are), the difference between investment in physical and human capital will amplify. A second, and even more important difference is given by the possibility of moral hazard behaviour, which is relevant for human capital, but not for physical capital. The future benefits of a current acquisition of education are conditional on exerting adequate effort in the labour market, but given the impossibility to check for future effort renders it non contractible. Seen in this perspective, any current investment in education is riskier than any financial investment (at least from the point of view of investing agents, i.e. the parents).15 Last, but not least, the apparent similarity between the two concepts of capital conceals substantial differences in the degree of control of the resource. The owner of physical capital can be properly termed as capitalist, since she is in control of either employing it in a production process or converting it into a liquid asset, living on it as rentier. On the contrary, an educated person, who owns her own human capital, cannot employ it in a production process unless hired as dependent worker, thus becoming a wage earner. Thus human capital does not command the same market power as does physical capital.16 Despite all these differences, the use of the term ‘investment in human capital’ as synonymous with ‘acquisition of education’ has become so pervasive that we will not refrain from using the same terminology. There is an additional reason to do so. If we consider human capital, embodied in people, as a production input, we then obtain an (endogenous) explanation of returns to education from profit maximising behaviour of firms. Each worker is paid up to the point corresponding to her marginal productivity, which will differ in accordance with the embodied human capital input. Though convenient, this remains nothing but an analogy, because we do not have compelling evidence that education increases workers’ productivity per se. In general education induces self-sorting of
13 The term “human capital” has nowadays become common in economic jargon, thanks to the pioneering works of Gary Becker (see Becker 1993). 14 In a more technical way, we can rephrase the same concept by saying that the investment in physical capital has an option value to waiting, while the corresponding value for investment in human capital is almost zero (you cannot postpone going to school when till you are older, waiting for better labour market conditions). 15 See the discussion in Piketty 1997. 16 This is because the rents associated to the ownership physical capital are profits from productive activity, whereas the rents associated to the ownership of human capital are wages. For a critique along this line of argument see Bowles and Gintis 1975.

5
individuals, who therefore differ not only for acquired education, but also for many other unobservable characteristics that may be valuable for a firm.17 Let us now present a simple model that allows the identification of the main determinants of educational choices as investment in human capital.18 Suppose that for simplicity the life of an individual nii ,...,1, = can be divided into two periods, youth (in period t ) and adulthood (in period
1+t ). The i -th individual can devote a fraction itS of her time in each period of life to schooling, in order to increase her stock of human capital itH . Human capital is rewarded in the labour market at its marginal productivity rate tβ .19 Thus the incentive to accumulate human capital is provided by the prospect of future gains. ( ) 1,, +=β= ttjHHW ijjijij (2.1) where ijW indicates labour earnings of individual i in period j . The accumulation of human capital is not instantaneous, but requires time; in addition, human capital depreciates with time at rate δ , as assumed by the following relationship ( ) ititit HHH ∆+δ−=+ 11 (2.2) where 1−−=∆ ttt xxx denotes first time differences. Devoting a fraction tS of time to schooling produces new human capital. If we indicate with iA individual unobservable ability, we assume that abler individuals are advantaged in acquiring education (either because they need less effort to study or because they are characterised by better family environment).20 We also assume that more human capital is produced when more resources itE are used in schooling (say, more and/or better teachers, libraries, and so on). Finally, it is also assumed that there are decreasing returns to time spent in education. All these factors are imperfect substitutes (i.e. it is possible to compensate low talent with greater effort or better educational resources). All these assumptions are summarised in the following equation (2.3). ( ) 1, <α=∆ α
itititiit HESAH (2.3) Finally, we have to specify individual preferences that consist of the discounted value of life-long earnings
17 Suppose for example that self-consciousness favours the acquisition of education, and for similar reasons reduces absenteeism while working as dependent employee. Then firms will demand self-conscious workers because they are more productive (i.e. less absenteeist), and the workers themselves will also be more educated. See Weiss 1995 for additional examples. 18 This constitutes a two-period simplified version of the original model by Ben-Porath 1967. A continuous time version is reported in the Appendix to the present chapter. 19 Notice that here we are assuming an identical return rate to education across individuals that are differentiated in terms of ability; moreover the same rate of return is independent on the amount of human capital employed in production (i.e. we disregard decreasing marginal productivity). Some of these assumptions will be relaxed later on (see chapter 6); see also the discussion in Card 1999. 20 We are not interested in going deeper into defining here what we mean by “unobservable ability”. We find convincing the definition provided by Rubinstein and Tsiddon 1998: ability is “everything that contributes to the child’s income potential, is in the child at the time he takes his education decision, and cannot be purchased on the market” (p.19).

6
( ) ( ) ( ) ( )
( ) ( )ρ+
γ−−β+γ−−β=
=ρ+
γ−−+γ−−=
+++++
+++++++
11
1
1
11111
1111111
ttitittittititt
ittitititititittitititititi
SSHSSH
SHWSHWSHWSHWV
(2.4)
where tγ represents the direct cost of school attendance and ρ indicates the subjective rate of intertemporal discount. When perfect financial markets exist, then ρ is replaced by the market interest rate. Notice that there are various sources of costs in acquiring education: i) direct monetary costs, here represented by factor γ . They consist of tuition fees, book purchases,
transport and living costs, ii) indirect monetary costs (or opportunity costs) corresponding to forgone income due to school attendance.
In equation (2.4) it is represented by the term ititWS : if the time fraction itS is devoted to school attendance, it cannot be employed in the labour market; as a consequence the student gives up a corresponding fraction of the income that would have been earned had the entire time span been spent in the labour market. Opportunity costs are obviously related to labour market outcomes: while for simplicity we are assuming here full employment, one should keep in mind that higher (youth) unemployment reduces the costs of school attendance.
iii) we ignore here non-monetary costs, which correspond to the effort put into education acquisition. If we consider that school levels become more and more selective the higher you go, we could imagine some sort of increasing non-monetary costs of schooling.
We are now in the position to establish some results on the demand for education from the optimal choice of investment in human capital. If we maximise utility (2.4) subject to constraints (2.1)-(2.3), including an existence interval 1,,,...,1,10 +==≤≤ ttjniSij , we obtain
( ) ( ) ( )[ ]( )ρ+
γ−−+δ−β+γ−−β= +++
α+
++ 1111maxmax 1111
,, 11
ittititititiittittititt
SSi
SS
SSHESAHSSHVitititit
(2.5)
The first order condition with respect to 1+itS easily shows that the optimal choice is 0*
1 =+itS . Given the simplified structure of the model, it does not pay to acquire education in the second period of life, because it augments human capital to be sold in a hypothetical third period, when the individual will be (presumably) dead. This result is general: if an individual demands more education in order to increase her market value, it is better to do it at early stages of life, in order to benefit from increased earnings accruing from additional human capital as long as possible. This proves true despite a declining value of the same capital at rate δ , which proxies both scientific obsolescence of knowledge and natural decay of the human brain. When we take the first order condition with respect to itS (and supposing the existence of an internal solution) we get the following result
43421
43421
benefitmarginal costmarginal
*1
1 it
ittttt S
HH ∆αρ+
β=γ+β + (2.6)
Equation (2.6) tells us that each individual chooses to acquire education up to a point where the cost of acquisition (the left hand side of expression (2.6), including direct and indirect monetary costs) equates

7
the benefit of acquisition. The right hand side of expression (2.6) represents the discounted value of earnings increase due to human capital accumulation, taking into account the relative productivity of school attendance in generating new human capital. If we rearrange equation (2.6) in order to obtain the reduced form in terms of the optimal demand of education in the first period of life we get
( )( )
γρββ=
βγ+α
ρ+ββ
=+−−+
++
α−α+
ittttitittit
ititi
t
tit EHAS
HHEAS ,,,/,,
/1 1
11
1*
m
(2.7)
From equation (2.7) we obtain several conclusions: i) more talented people will demand more education, because their marginal return is higher. Equation
(2.3) assumes that unobservable ability iA raises the production of new human capital for any unit of time spent in school.
ii) the demand for education is higher when future expected gain 1+βt is higher relative to current one
tβ . The former affects expected gains, the latter determines current (opportunity) costs. Thus better employment conditions reduce current demand for education.21 On the contrary, the expectation of higher returns in the future (for example as a consequence of generalised adoption of information technology) stimulates current demand for education.
iii) future gains are discounted to the present in accordance with the subjective intertemporal discount rate. The higher the ρ parameter, the more myopic the agent, the more she evaluates current costs in exchange for future gains, and consequently the lower is her demand for education. When financial markets exist, the ρ parameter is replaced by the market interest rate, because the individual could borrow money to cover current cost (when young) and repay when future benefits start accruing (when adult). In this case, an increase in market interest rate lowers the demand for education.22
iv) the demand for education is more intense the lower the starting level of human capital itH . However this incentive declines with the accumulation of human capital, because of decreasing marginal productivity in the formation of new capital.23
v) finally, the demand for education declines with the increase in direct cost tγ of school attendance, but increases with greater and better resources itE employed in the education production function.
The working of this model can be visualised by making reference to figure 1, depicting both sides of equation (2.6). Even if in equation (2.4) we have assumed a constant cost tγ , here the cost schedule is drawn as upward sloping, to account for the fact that higher levels of education are typically associated with increasing costs (both monetary and non monetary – this is equivalent to a case where
( ) 0, >γ′γ=γ S ). Conversely, the return schedule is downward sloping to account for the decreasing return in the production technology of new human capital. While in the model the choice variable itS
21 There is evidence that prohibition of child labour, by lowering the return to work for children, induces greater attendance at schools. See for example Dehejia and Gatti 2002. 22 This conclusion holds irrespective of whether the individual is actually borrowing in the financial market. In the event of an interest rate rise, even a rich person, who does not need to borrow money to cover the direct and indirect cost of schooling, may find it (economically) convenient to reduce her demand for education. By so doing, she will obtain a higher current income, that invested in financial market, will yield a higher return tomorrow. Things are different if the imperfection of financial markets charges different interest rates on different individuals. In such a case individuals from poorer families will face higher costs of borrowing, and other things being constant will demand less education.
23 Taking the first order derivative of equation (2.7) it is easy to prove that ( )( )ittit
it HsignHSsign βα−−α=
∂∂ 1
*.

8
describes the amount of time devoted to education in the first period of life, it can easily be converted into years of education acquisition. How does the model work ? Suppose that an individual is optimally choosing the amount of education 1E corresponding to the intersection of marginal cost with marginal benefit in point A. When she expects that in the next period there will be an increase in the demand for skilled labour, the (perceived) relative return to education will rise (since tt ββ + /1 is expected to be higher). This is represented as an outward shift of the marginal return, provoking an increase in the demand for education up to point 2E .
Figure 1 – The model of human capital investment This figure may help us to understand why different individual demand different amount of education. Let us consider the role of talent. We see from equation (2.7) that more talented individuals demand more education, and obtain higher human capital. This is due to the fact that they experience a higher marginal return for any portion of time invested in education. This can be seen by looking at earnings in second period of life, as obtained by replacing equations (2.3) and (2.2) into equation (2.1), ( )[ ] ( ) ( )[ ]α+++++ +δ−β=∆+δ−β=β= itititiittitittittit HESAHHHHW 11 11111 (2.8) and then taking the first derivative with respect to itS
( )
αβ=
∂∂
α−
α
++
111
it
ititit
it
it
SHEA
SW (2.9)
Equation (2.9) tells us that an additional year of schooling does not have the same impact on earnings for each individual. More talented people (higher iA ), as well as those attending better schools (greater
itE ) expect a higher return because they “accumulate” more human capital per unit of time, and therefore have an incentive to stay in school longer. In terms of condition (2.6), the right hand side (marginal benefit) is higher for these people; in terms of figure 1, this is equivalent to the case where agents look at point B instead of point A.24 24 This case has been defined “elitist” by Becker 1993, cap.3, pg.108, because only the elite of ablest people choose the maximum amount of education.
marginal cost of education acquisition
marginal return to education
A
B
education = years of schooling 1E 2E

9
A second case of differentiated demands for education emerges when we consider the problem of financing educational choices. If we look at first period budget constraint implicit in equation (2.4), we
notice that nothing ensures that ( ) ***1 ittitt
ittittititt S
HHSSH ≥
γ+ββ
⇔γ≥−β , i.e. the income
obtained in the first period of life (when partially employed) exceeds the direct costs of optimally demanded schooling. If financial markets exist, any agent can borrow any required amount to finance educational expenditures, to be repaid in the second period when earning a higher income. In our simple model, where uncertainty about the future is absent and everything is perfectly observable, this seem a reasonable occurrence. But what about unobservable abilities ? Investing in education is a risky investment, and the borrower has better information than the lender about the real chance of succeeding at school. She also has better knowledge about her prospective outcomes in the labour market, whereas a bank does not. In such a context, a bank (or any generic lender) will require either a collateral or will charge a higher interest rate, to protect against the default risk. In both cases individuals are asymmetrically affected by this occurrence, since only individuals from poor families need to borrow in order to finance their schooling. When the bank requires a collateral, the amount of education that an agent can demand is upwardly constrained by available wealth (which typically derive from family bequests). When the bank charges a higher interest rate, this reduces the optimal amount of education in accordance with equation (2.7). In both cases, people from poor families are discriminated against for their lack of financial resources.25 This situation can be visualised by looking at figure 2. The marginal rate of return to education is identical for all individuals, as in figure 1. If all agents had sufficient wealth and were not liquidity constrained, they would all choose the optimal amount of education corresponding to point B. When some of them cannot entirely finance their demand for education up to point 2E , they are forced to limit their acquisition of education to point 1E . But this situation is inefficient, because there is a positive difference between marginal return and marginal cost of education (the distance between points A and C), leaving unexploited opportunities of human capital production. In such a context the state could fruitfully intervene, by taxing agents and using the proceedings to support poor families in financing their educational expenditures. This will increase the total amount of human capital investment in the society.26 We can summarise what we have found so far. Human capital investment theory predicts that people will demand education up to the point where marginal benefit equates marginal costs. Marginal benefits depend on labour market conditions, on resources invested in education and on individual ability. Marginal costs depend on direct costs of schooling and possibly on individual ability. While in principle all individuals should demand the same amount of education, two factors contribute to differentiating educational attainment in the population. One is talent (be it ‘pure intelligence’ or ‘better family background’) that boosts the human capital accumulation.27 The other is family wealth, that can constraint poor families when financial markets are imperfect or absent. We now consider both arguments in more detail.
25 Alternative formulations of financial market imperfection with respect to educational choices are analysed in Kodde and Ritzen 1985. 26 Becker 1993 calls this case as ‘egalitarian’ because it provides a rationale for public funding of educational expenditure. In this situation redistributive policies are Pareto improving, and there is no conflict between equality and efficiency. He also claims that in principle it is possible to distinguish between ‘elitist’ and ‘egalitarian’ cases by observing the positive (negative) correlation between return and years of schooling (Becker 1993, 128-130). 27 We could have easily introduced a cost reducing assumption for talent: brightest children (or children from educated parents) need less time to learn, thus facing lower opportunity costs. This corresponds to the case where ( ) 0, <γ′γ=γ ii A . The cost schedule in figure 1 would become flatter, whereas the return schedule would not shift, but the final outcome would be identical.

10
Figure 2 – Human capital investment under liquidity constraints
3. The role of individual talent Observing different educational choices in the population one may wonder about the underlying causes of these differences. The question is not trivial, because the two alternative explanations we have reviewed in the previous section have radically different policy implications. When different educational attainments derive from differences in talent endowment, there is no reason (at least on grounds of efficiency) to intervene in order to favour access to education of less endowed individuals. From an efficiency perspective, one should evaluate one additional euro spent on educating the more endowed against spending the same amount for the less endowed. Equity reasons may render it advisable, but efficiency reasons may work in the opposite direction. On the contrary, if differential education is the outcome of wealth (or income) inequality, then we have already mentioned that redistributive policies are both equity and efficiency enhancing.28 This explains why it is crucial in empirical analysis to distinguish between these two cases. In principle one could divide the population into two (or more) groups and safely assume that the richest portion of families is not liquidity constrained. The remaining differences within this group could be attributed to differences in talent.29 But the concept of talent is itself hard to grasp. When we look at educational attainment, it is difficult to distinguish whether a well performing student is either a natural genius or the offspring of graduate parents. The problem arises from the fact that we do not possess good measure for factors like ‘intelligence’, ‘creativity’, ‘smartness’ and the like.
28 This is true only under first best conditions, because otherwise granting equality of opportunity may rise output and equality of outcomes at the same time: see Benabou 2000. 29 Becker and Tomes 1986 have suggested this strategy in order to estimate the intergenerational persistence of incomes dispensing for liquidity constraints. Shea 2000 proposes an alternative test, based on unexpected components of income affecting educational attainment. While positive correlation could be taken as evidence of liquidity constraints, he finds no effect when actual family income is instrumented with the unexpected component.
marginal cost of education acquisition
marginal return to education
A
B
education = years of s chooling 1 E 2E
C
11
Some authors have polemically claimed that unobservable ability is not only genetically dependent but it is also inter-generationally transmitted. Murray and Herrstein (1994)30 have put forward an explanation of income inequality and racial differences in the United States based on the following line of argument. There is positive evidence of correlation between talent (as measured by IQ test scores) and earnings. Likewise, there is positive correlation between talent measures across generations. If IQ test scores are a good proxy of unobservable ability, then earnings inequality is a ‘natural’ outcome, since nature distributes the genes of intelligence at random. Finding intergenerational correlation of IQ test scores can consequently be taken as evidence of genetic transmittability of intelligence genes.31 While the theoretical argument (IQ proxying unobservable ability) is questionable,32 the policy implications were surprising. Recording a persistent income differential between whites and Afro-Americans in the United States, this differential is explained by referring to persistent IQ test score differentials, which repeats across generations. As a consequence, income inequality in the United States should be abandoned from the political agenda, being an obvious outcome of ‘natural’ differences: Afro-Americans are less endowed with unobservable ability, and therefore earn less. Since ability is transmitted across generations, Afro-Americans will keep on populating the bottom tail of income distribution. Any attempt to revise this result adopting compensatory schooling is destined to failure. These ideas were not new, at least in North American academia. Already in the 60’s the diffusion of IQ test measures raised the issue of their correlation with family background, in particular with parental education.33 The introduction of test scores in earning regressions opened the discussion on whether their statistical significance was a correct measure of genuine unobservable ability or the result of spurious correlation with unobservable parental characteristics. The discussion proceeded along two lines. On one side, some authors were able to control for genetic ability by using particular samples (typically twins). An interesting attempt to decompose among different factors affecting educational attainment and labour earnings is provided by Miller, Mulvin and Martin 1997. They analyse an Australian sample of twins, either monozygotic or dizygotic ones. By regressing income differences for identical twins on educational differences, one is controlling for both family background and ‘natural’ unobservable ability. By repeating the same analysis for fraternal twins and comparing the results with the previous case one obtains an estimate of the relative role played by ability: “… hence the conclusion from the traditional twins model is that the estimated return to schooling for males of 7.1% is comprised of 2.3% due to the ‘true’ returns to schooling, 4.2% due to the effects of family background and of 0.7% due to the influence of genetic factors.” 34 On the other side, availability of better dataset allowed the researcher to decompose the ability proxy by different subjects, in order to test which aspects were more relevant in shaping earning ability.35
30 See also the critical book review by Goldberger and Manski 1995. 31 Feldman, Otto and Christiansen 2000 distinguish between “genetic” heritability (genotypes) and “environmental” heritability (phenotypes), and review the recent literature on IQ genetic transmittability: while in the 70’s, IQ was held genetically transmittable at 80%, most recent works has lowered such estimate as far as 30%. 32 Flynn 2000 shows that IQ measures are unable to define a time invariant standard for what can be termed “normal intelligence”, since in many industrialised countries each generation outscores the previous one. 33 See the account of this debate in Bowles and Nelson 1974 and in Bowles and Gintis 1976 (chapters 2 and 4). 34 Miller, Mulvin and Martin 1997, p.130. Ashenfelter and Rouse 1998 pursue an alternative strategy by assuming the existence of a common unobservable variable called ‘family ability’, and study the correlation between this unobservable and educational attainment of twins. Finding some evidence of negative correlation between family ability and the average wage in the couple of twins, they suggest that public education could act as compensatory device. See the review of this line of research in Card 1999. 35 Murnane, Willet and Levy 1995 show that mathematical abilities were more relevant in wage regressions than any other measure based on test scores. Bowles and Gintis 2000 review several studies including controls for ability in earnings regressions, showing that the inclusion of ability does not reduce the explanatory power of schooling of more than 20%:

12
Overall, the literature seems rather inconclusive on the role and measurement of unobservable ability. Some authors argue that education provides human capital, which in turn raises individual productivity. In this perspective, favouring educational access of more disadvantaged individuals can attenuate income inequality. Some others argue against a causal interpretation, because individuals with higher ability receive more education and more income, but the correlation between the two is spurious. In the latter perspective, any corrective policy is at best uninfluential.36
4. Imperfect financial market and indivisibility of human capital investment In section 2 we have seen that school attendance may be prevented by the lack of financial resources. In principle, whenever a profitable investment is available, economic agents should take advantage of this opportunity by arbitraging between different sources of funds. Whenever any additional year of schooling has a marginal benefit exceeding its marginal cost (including interest repayment), it should be worth undertaking. Under decreasing marginal returns of time spent in schooling and homogeneity of agents, we should observe the convergence of human capital (and therefore of earnings) in the population.37 However actual financial markets do not work in this way, and do not offer an unlimited amount of lending to anyone. They typically ration the borrower by charging higher interest rates and/or require collaterals in order to insure against default risks. Both stances hurt disproportionately families in the lower tail of income distribution, for they are unable to bear the opportunity costs of school attendance and need to borrow. But they typically need huge amounts (at least in relative terms) and do not have collateralisable ownerships. As a consequence, other things being equal individuals from poorer families tend to acquire less education than individuals from richer families. In the specific case of education financing, financial markets are very likely to work imperfectly (or even be absent) because of the impossibility of providing collaterals (outside the unrealistic case of slavery) and the existence of moral hazard incentives in education acquisition and labour market performance (since individual effort at school and at work is unobservable).38 Without public intervention to correct this market failure, differential access to education persists across generations: poor families are unable to finance the education of their offspring, who in turn obtain less education, earn less and are themselves unable to finance the education of grandchildren. Thus imperfect financial markets could be responsible for persistent inequality, both in education and in income. However, from a theoretical point of view the assumption of financial market imperfection is by itself insufficient to “This suggests that a substantial portion of the return to schooling are generated by effects of correlates of schooling substantially unrelated to the skills measured on the available tests” (p.122). 36 More recently, an emerging literature on the so-called ‘natural experiments’ claims to be able to measure the real contribution of acquired education to earnings, irrespective of natural ability. Whenever an exogenous source of variation (a war, an educational reform or even the birth quarter) induces people to attend more schooling, the unintended variation of education can be used to measure the additional earnings associated with education. See Angrist and Krueger 1999. 37 The convergence to identical incomes is a general property of the neoclassical growth model, due to decreasing marginal returns (see Stiglitz 1969 and the counterarguments in Bourguignon 1981). The intuition is that the poor experience a higher rate of return on their investment than the richer do, thus catching up in the long run. This result holds even in presence of externalities from accumulation of individual human capital (Tamura 1991). Whenever agents differ along some characteristics (ability, family wealth, resources spent on education), we observe conditional convergence, i.e. convergence of incomes for all individuals with identical characteristics (see Barro and Sala-i-Martin 1992 for the discussion of σ-convergence). 38 This could even be exacerbated if the repayment is progressively related to earned income, as in the Australian experience: see Chapman 1997.

13
yield this result, and an additional condition is required, the indivisibility of human capital investment. In section 3 we have assumed that individual human capital itH can be varied continuously, so that each individual can choose the exact amount of education to satisfy the optimality condition described by equation (2.7). However the real world works differently, and educational certificates can be obtained at predetermined stages of career only. A university degree requires three years of university attendance, and attending only two of them may make an irrelevant impact on earnings ability. In order to prove these propositions, we now move to the exposition of a simplified version of the Galor and Zeira (1993) model. It consists of an overlapping generation model, with stationary population living two periods. In the first period, when young, individuals can choose whether to work or study; in the second period, when adult, they work either as skilled (in case they studied in the first period) or as unskilled (in case they worked also in the first period). They also consume, give birth to an offspring and die. Indivisibility of human capital investment is represented by a dichotomised choice: each agent can choose whether to pay a fixed cost γ for school attendance and obtain a degree, or work as unskilled worker. The amount of human capital obtained by school attendance is fixed and identical across agents.39 All agents are identical in terms of unobservable ability, but they can differ in terms of inherited family wealth. Combining an initial inequality with imperfect financial markets generates persistent inequality in education and income in the long run. A crucial assumption requires that human capital investment be always profitable. If we indicate with
ntW the market wage for an unskilled worker at time t and with s
tW 1+ the corresponding wage of a skilled worker (i.e. a person who paid the amount γ and forwent the income obtainable working as unskilled when young in order to become unskilled when adult), the profitability condition (expressed in future values) requires that ( ) ( ) ( )RWRWWRW nn
tnt
st +=++>+γ− ++ 211 11 (2.10)
where R indicates the market interest rate.40 nW , sW and R are exogenously given.41 Under the condition expressed by equation (2.10) everyone would like to obtain education. Those who do not attend schools are prevented from doing it by the impossibility of paying the fixed cost of access γ .
39 Indivisibility of human capital investment creates a non convexity in the production of human capital, which sustains persistent inequality, even in the long run. If the poor could acquire fractions of the degree by paying a fraction of its cost, in the long run they would achieve the same wealth as the rich.
40 An alternative formulation of equation (2.10) requires that the return to education, equal to n
ns
WWW
+γ−γ− 2 (where the
numerator is the income gain obtained through education, whereas the denominator collects direct and indirect cost of educational choice), exceeds the market interest rate. When this does not create ambiguity, we will neglect temporal indices. 41 In order to sustain this assumption, Galor and Zeira 1993 consider a small economy producing an homogenous good. In a small economy, R is given by international financial markets. While financial intermediaries can access these markets (that operate efficiently), workers are prevented from borrowing on these markets. If the production technology exhibits constant returns to scale in physical capital and skilled labour, then profit maximisation univocally determines sW for any given user cost of capital R . Let us suppose that production technology is β−β= 1KLY s . Then first order condition for physical capital
requires ( ) ββ
β−
=⇔=
β−
111RL
KRKL
s
s . By replacing this condition in the first order condition for skilled
labour sL we obtain ββ−β−
β−β=
β=
111RL
KWs
s , where the skilled labour wage is negatively related to user cost of
capital, via the substitutability of these two inputs. In an open economy the output price is determined on international

14
Financial resources to finance education are derived either form inheritance from parents or from the financial intermediaries. If workers could gain access to foreign financial markets and debt repudiation could be safely excluded, all of them would borrow the amount required to finance education at the interest rate R , would attend school and become skilled, would repay the debt and still would obtain a profit (given the assumption (2.10)). On the contrary, if debt default is an open possibility and access to international financial market is prevented to workers, the financial intermediary bears a monitoring cost Z in order to minimise the probability of this event from the borrower. In a competitive financial sector, profits are driven to zero, and therefore the cost of fund collection (by assumption they are obtained on international financial markets) must equal their use. Monitoring cost will therefore be charged on borrower according to the following relationship ZRDiD += (2.11) where i is the lending interest rate and D is the amount of debt. Each borrower considering the possibility of defaulting her debt takes into account the costs involved prosecution avoidance by the lender; these costs are assumed to be proportional to its monitoring activity and are indicated by
1, >λλZ . Knowing the set of incentives of the borrower, the lender will choose a level of monitoring activity that is proportional to the amount of debt, up to a point where the borrower is indifferent between debt repayment and debt repudiation ( ) ZiD λ=+1 (2.12) Making use of equations (2.11) and (2.12) we can show that the borrowing rate exceeds the lending rate, determined on international financial markets.
( ) RiRiRi >⇔+−λλ
=+⇔−λλ+
= 11
11
1 (2.13)
The possibility of debt repudiation is the ultimate reason why poor families are discriminated against. Since they must borrow to finance their education, they face an opportunity cost of borrowing given by the interest rate i , which is higher than the opportunity cost R faced by rich families.42 Individuals are assumed to be altruistic, and therefore they care about the future welfare of their offspring by leaving a bequest X . Utility is defined over consumption in second period of life and bequest; when it takes a Cobb-Douglas formulation we get ( ) 11 log1log ++ α−+α= ttt XCU (2.14) Each individual maximises her own utility for given labour income and inheritance received by her own parent. Given the fact that Cobb-Douglas utility functions are in the homothetic class, the optimal
markets, and for simplicity is normalised to one. Finally they assume the existence of a second type of technology, using unskilled labour only. In such a case nW is equal to the average productivity in the sector using this last technology. 42 One may wonder why rich families do not lend directly to poor families, earning an interest rate comprised between i and R . Acting this way, the rich family will bear the entire default risk from the borrower. But even leaving aside the default risk, the equilibrium interest rate will depend on the relative supply and demand of funds, which reflect initial income (or wealth) distribution in the population. Thus in a very unequal society there will be many borrowers and few lenders, and the equilibrium interest rate will be pushed up, further reducing the educational investment of the poor. See Piketty 1997 for a model along these lines.

15
choice will be characterised by constant income shares devoted to consumption and bequest. If 1+tI denotes total disposable income when adult, optimal choices is ( ) 1
*11
*1 1, ++++ α−=α= tttt IXIC (2.15)
By replacing optimal choices described by equation (2.15) in the utility function (2.14), we obtain the indirect utility function tV characterising each generation t , which is loglinear in disposable income. ( ) ( ) ( )[ ] 1
*1
*1 log1log1loglog1log +++ +α−α−+αα=α−+α= tttt IXCV (2.16)
Depending on the choice made with respect to education when young, we observe three possible destinies in the model (reported in table 2): a) unskilled workers, who did not acquire education when young and worked as unskilled in both periods of life; b) skilled workers from poor families, who did not receive an inheritance sufficient to finance their education, and therefore were forced to borrow in order to pay for it; c) skilled workers from rich families, who did not incur debt to get an education.
Table 2 – Alternative life destinies Possible destinies: Lifetime disposable income Bequest left to the offspring
a) individuals who do not acquire education ( )( ) nnt WRWX +++ 1 ( ) ( )( )[ ]nn
tt WRWXX +++α−=+ 111b) individuals who need borrowing for acquiring education ( γ<tX ) ( )( )iXW t
s +γ−+ 1 ( ) ( )( )[ ]iXWX ts
t +γ−+α−=+ 111 c) individuals who do not need borrowing to invest in their own education ( γ>tX ) ( )( )RXW t
s +γ−+ 1 ( ) ( )( )[ ]RXWX ts
t +γ−+α−=+ 111
Under the assumption of profitability of the investment in education (see equation (2.11)) all individuals would like to become skilled. Those who inherit sufficient funds (e.g. exceeding the cost of accessing education γ ) become skilled. Among the remaining population, there will be a fraction that is so poor that it will be unable to afford the debt required to obtain education: they will not invest in education, and remain unskilled. Given the absence of stochastic elements in the model, they will earn a low income and will leave a low bequest, perpetuating the unskilled status in their dynasty. By equating case a) and b) in table 2, we find the inheritance level that makes no difference whether an individual enters a debt to become skilled and remains unskilled
( )( ) ( )( )
( ) ( ) fXRi
iWRW
iXWWRWX
t
sn
tsnn
t
==−
+γ+−+
+γ−+=+++
12
11c (2.17)
We have already seen in equation (2.15) that bequests are proportional to disposable income. Therefore, we can study the evolution of income distribution by means of the evolution of bequests distribution. And bequests evolve according to first order difference equations reported in third column of table 2, which are plotted in figure 3.43
43 Figure 3 is drawn under the assumption that nX and sX being stable equilibria, whereas g is an unstable equilibrium.
This is equivalent to assume ( )( )
( )( ) ( )( )
>−λλ
+α−=+α−
<+α−
11
1111
111
Ri
R which jointly imply ( )( ) 1111
<+α−<λ−λ R .

16
Figure 3 – Dynamics of individual wealth All individuals inheriting an amount lower than f are better off non investing in education, and their
income evolves according to case a) in table 2, converging to α−1nX , where nX is defined according to
( ) ( ) ( )[ ]RWXRX n
nn +++α−= 211 (2.18) The individuals receiving an inheritance in the interval ( )gf , will invest in education, but the debt burden exceeds their ability to pay, and they also converge to nX .44 Finally, the ‘happy few’ who get a
bequest greater than g experience a growing level of income across generations, converging to α−1sX ,
where sX satisfies ( ) ( ) ( )[ ] n
sss XRWXRX >γ+−++α−= 111 (2.19)
The speed of convergence rate will be lower for debtors (where hX t <−1 ) than for people from rich families (where hX t >−1 ), because of the different interest rate they pay to or receive from financial intermediaries. In the long run income distribution becomes bimodal, with a population share
concentrated around α−1nX , and its complementary share concentrated around
α−1sX . The mean
income in the population is determined as weighed average, where weights depend on initial income distribution
44 The g value corresponds to the unstable equilibrium satisfying ( )( ) ( ) ( )[ ]γ+−α−++α−== iWXiXg s 1111 .
X tXn Xs
45°degree line
gf h
Xt+1

17
( ) ( ) ( ) ( ) ( )( ) 0,1 <φ′φ=−−=
−+= gnXX
ngnXX
ngnX
ngnX nsssn (2.20)
where F is the cumulative distribution function at time zero, and ( ) ( )∫=g
XdFgn0
indicates the
number of individual with initial wealth smaller than or equal to g . Given the deterministic nature of
the model, their descendants will achieve in the long run an income level equal to α−1nX . An egalitarian
economy will be characterised by a low share ( )gn of (relatively) poor individuals, and will experience a higher average income in the long run. Income redistribution from rich to poor raises average income (or wealth) in the economy, but does not constitute a Paretian improvement, since the rich do not obtain any direct benefit from this move. On the contrary, intertemporal redistribution achieved by means of fiscal policy (subsidising the education of the young by taxing their income when adult) solves the market failure, lowers the debt cost and is therefore Pareto superior.45
45 Galor and Zeira 1993 also consider the case of an endogenous unskilled wage nW . This reinforces a poverty trap, because a rising portion of population converging to nX lowers nW , which translates into a further lowering of nX . On
the contrary, when α−
>1gW n the economy converges to a unique long run equilibrium given by sX .

18
References Angrist, J. and A.Krueger. 1999. Empirical strategies in labor economics. in O.Ashenfelter and D.Card
(eds). Handbook of Labor Economics – vol.3. North Holland, New York. Appleton, S., J.Hoddinott and J.Knight. 1996. Primary education as an input into post-primary
education: a neglected benefit. Oxford Bulletin of economics and Statistics 58/1: 211-219. Arrow, K., S.Bowles and S.Durlauf. (eds) 2000. Meritocracy and economic inequality. Princeton University
Press. Ashenfelter, O. and C.Rouse. 1998. Income, schooling and ability: evidence from a new sample of
identical twins. Quarterly Journal of Economics 113:253-284 Ashenfelter, O. and C.Rouse. 2000. Schooling, intelligence and income in America. in Arrow, K.,
S.Bowles and S.Durlauf. (eds) 2000. Meritocracy and economic inequality. Princeton University Press. Barro, R. and X.Sala-i-Martin. 1992. Convergence. Journal of Political Economy 100: 223-251. Becker, G. 1993. Human capital: a theoretical and empirical analysis, with special reference to education. University
of Chicago Press, Chicago (first edition: 1964). Becker, G. and N.Tomes 1986. Human capital and the rise and fall of families, Journal of Labor
Economics, 4: S1-S39. Ben-Porath, Y. 1967. The Production of Human Capital and the Life-Cycle of Earnings. Journal of
Political Economy 75/4 (1): 352-365. Benabou, R. 2000. Meritocracy, redistribution and the size of the pie. in Arrow, K., S.Bowles and
S.Durlauf. (eds) 2000. Meritocracy and economic inequality. Princeton University Press. Bourguignon, F. 1981. Pareto superiority of unegalitarian equilibria in Stiglitz model of wealth
distribution with convex saving functions. Econometrica, 49(6): 1469-1475. Bowles, S. and H.Gintis. 1975. The problem with human capital theory - a Marxian critique. American
Economic Review vol.65 P&P: 74-82. Bowles, S. and H.Gintis. 2000. Does schooling raise earnings by making people smarter ? in Arrow, K.,
S.Bowles and S.Durlauf. (eds) 2000. Meritocracy and economic inequality. Princeton University Press. Bowles, S. and V.Nelson. 1974. The “inheritance of IQ” and the intergenerational reproduction of
economic inequality, Review of Economics and Statistics 56/1: 39-51. Bowles, S., and H.Gintis. 1976. Schooling in capitalist America. Routledge & Kegan, London. Card, D. 1999. The causal effect of education on earnings. in O.Ashenfelter-D.Card (eds). Handbook of
Labor Economics – vol.3. North Holland, New York. Chapman, B. 1997. Conceptual issues and the Australian experience with income contingent charges
for higher education. Economic Journal 107: 738-751. Dehejia, R. and R.Gatti. 2002. Child labor: the role of income variability and access to credit across
countries. NBER wp.9018 Eckstein, Z. and I.Zilcha. 1994, The effects of compulsory schooling on growth, income distribution
and welfare. Journal of Public Economics 54: 339-359. Feldman, M., S.Otto and F.Christiansen. 2000. Genes, culture and inequality. in Arrow, K., S.Bowles
and S.Durlauf. (eds) 2000. Meritocracy and economic inequality. Princeton University Press. Fershtman, C., K.Murphy e Y.Weiss. 1996. Social status, education, and growth. Journal of Political
Economy 104/1: 108-132. Flynn, J. 2000. IQ trends over time: intelligence, race and meritocracy. in Arrow, K., S.Bowles and
S.Durlauf. (eds) 2000. Meritocracy and economic inequality. Princeton University Press. Galor, O. and J.Zeira 1993. Income distribution and macroeconomics. Review of Economic Studies 60: 35-
52. Goldberger, A. and C.Manski. 1995. Review article: The Bell Curve by Herrnstein and Murray, Journal of
Economic Literature 33: 762-776. Helliwell, J. and R.Putnam. 1999. Education and social capital. NBER wp.7121. Herrnstein, R. and C.Murray. 1994. The Bell curve: intelligence and class structure in American life, Free Press,
New York.

19
Kamien, M. and N.Schwartz. 1981. Dynamic optimization: the calculus of variations and optimal control in economics and management, Amsterdam: North Holland
Kodde, D. and J.Ritzen 1985. The demand for education under capital market imperfection, European Economic Review 28: 347-362.
Lazear, E. 1977. Education: consumption or production ? Journal of Political Economy 85/3: 569-597. Miller, P., C.Mulvey and N.Martin. 1997. Family characteristics and the returns to schooling: evidence
on gender differences from a sample of Australian twins, Economica 64: 119-136. Murnane, R., J.Willet and F.Levy. 1995. The growing importance of cognitive skills in wage
determination, NBER Working Paper n.5076, March. OECD, 2001. Education at a glance. OECD, Paris. Piketty, T. 1997. The dynamics of the wealth distribution and the interest rate with credit rationing.
Review of Economic Studies 64(2): 173-189. Roemer, J. 1986. Equality of resources implies equality of welfare. Quarterly Journal of Economics,
November: 751-784. Rubinstein, S., and D.Tsiddon. 1998. Copying with technological progress: the role of ability in making
inequality so persistent. Tel Aviv University working paper 27-98, December. Schultz, T. 1963. The economic value of education. New York: Columbia University Press Sen, A. 1992. Inequality re-examined, Oxford University Press. Shea J. 2000, Does parents' money matter ?, Journal of Public Economics 77/2: 155-84. Stiglitz, J. 1969. Distribution of income and wealth among individuals. Econometrica 37(3): 382-397. Tamura, R. 1991. Income convergence in an endogenous growth model. Journal of Political Economy
99(31): 522-540. Tiebout, C. 1956. A pure theory of local expenditure. Journal of Political Economy 64: 416-424. UNDP, 2001. Human development report. Blackwell. Weiss, A. 1995. Human capital vs. signalling explanation of wages. Journal of Economic Perspectives 9/4:
133-154.

20
Appendix – The human capital investment in continuous time model We present here a continuous time version of the human capital investment model, drawing heavily on Ben-Porath (1967). The main advantage with respect to the model presented in section 2 is that we obtain in a multiperiod context a closed solution for the optimal path of investment. Basic assumptions of the model are: i) leisure does not enter the utility function; time can be devoted to either study or work; ii) perfect financial markets, so consumption smoothing is feasible; iii) human capital has a constant rental rate β in the labour market, which ensures full employment. While earnings potential is proportional to current individual stock of human capital tH , actual earnings tW are given by ttttt BHSHW γ−β−β= (A.2.1) where tS is the fraction of the available stock of human capital allocated to the production of human capital (capturing the opportunity costs of human capital investment), tB represents other resources used in producing human capital (capturing the direct cost of schooling) and γ is the unitary cost of additional resources employed in schooling. The production function of newly added human capital is given by ( ) ( ) 1, 21
21 <α+α= ααtttt BHSAQ (A.2.2)
where the shift parameter A is a proxy of individual talent. The human capital is assumed to depreciate at a constant rate δ ; its continuous time variation is therefore given by
( ) ( ) tttttttt HBHSAHQH
dtdH
δ−=δ−== αα 21& (A.2.3)
Cost minimisation in the production of new human capital yields an optimal choice between two factors, tS and tB , according to their relative cost and their relative impact. If we define our objective as problem (A.2.4) ( ) ( ) ( ) 21..min
,
αα=γ+β tttttttBSBHSAQtsBHS
tt
(A.2.4)
by taking the ratio of the two first order conditions, 2
1αα
=γ
β
t
ttBHS , we obtain the cost function
associated to the production of new human capital
( )tttttttt QC
AQHSBHSC =
γαβα
β
αα+α
=βαα+α
=γ+β=α+α
α
α+α 21
2
21
2
1
1
1
21
1
21 (A.2.5)

21
Each agent maximises her human wealth, equivalent to the discounted value of disposable income over the life span, assumed to be finite with length T (known with certainty), net of cost of accumulation described by equation (A.2.5)
( ) ( )( )∫∫ γ−−β=−β ρ−ρ−T
tvvv
v
S
T
tvv
v
SdvBHSedvCHe
tt
1maxmax (A.2.6)
subject to the accumulation equation (A.2.3). By using the definition of equation (A.2.5) the maximising behaviour can be expressed as
( )∫ δ−
γαβα
=
αα+α
−β α+αα
ρ−T
ttttvv
v
SHHSAHtsdvSHe
t
21
2
1
2
1
21 ..1max & (A.2.7)
or using a more compact form
( ) ( )∫ =ρ−T
tvv
v
SSHgHtsSHFe
t
,..,max & (A.2.8)
Problem (A.2.8) can be solved using standard optimal control techniques.46 By replacing
η=
γαβα
α2
1
2A for notational clarity, we write the Hamiltonian function as
( )( )HSHSHe t δ−ηλ+
αα+α
−β=Ω α+αρ− 21
1
211 (A.2.9)
The necessary conditions associated with the Hamiltonian are
( ) ( ) 0121
1
21 21 =α+αλη+
αα+α
β−=∂Ω∂ −α+αρ− SHHHeS
t (A.2.10)
( ) ( ) λδ+α+αλη+
αα+α
−β−=λ⇔λ−=∂Ω∂ −α+αρ− 1
211
21 211 SHSSeH
t&& (A.2.11)
( ) HSHHH δ−η=⇔=λ∂Ω∂ α+α 21&& (A.2.12)
The two addends in equation (A.2.10) constitute marginal cost and marginal benefit respectively associated with human capital accumulation; this equation can be solved explicitly in terms of optimal choice of schooling
( )
µβγ=
βγαµαα
=+−−+−
α−α−
α−α
α
,,,,1 21
22
2 11
11
21* AHSAH
S (A.2.13)
46 See for example Kamien and Schwartz 1981.

22
Equation (A.2.13) is the continuous time version of equation (2.7), where teρλ=µ represents the shadow (current) price on investment. Additional boundaries conditions [ ]1,0*∈S are implicitly present. Finally, transversality condition requires that ( ) ( ) 0lim =µ
→tHt
Tt be satisfied.
Using the result of equation (A.2.13) into equation (A.2.11), one can rewrite it as δλ+β−=λ ρ− te& , or re-expressing in terms of µ ( )ρ+δµ+β−=µ& (A.2.14) By forward integration of equation (A.2.14) we obtain47
( ) ( )( )( )tTet −δ+ρ−−δ+ρ
β=µ 1 (A.2.15)
Ben-Porath indicates the costate variable µ as the “demand price” of human capital, since it corresponds to the marginal benefit of varying the stock of human capital.48 By studying its dynamics we infer the properties of the optimal path of human capital accumulation. Given the results that ( ) 00 >µ and ( ) 0=µ T , we observe that along all the optimal path of investment
0<µ& ; as a consequence, 0* <S& and ( ) 0* <= SQQ && as well. The higher is T , the higher is ( )0µ , and the higher is ( )0*S : the longer the life expectation, the higher the initial investment in human capital since the time horizon for collecting education return is longer. We devise three phases in the path of accumulation. In the initial phase, the existing stock of human capital, even when fully allocated to education, is insufficient to provide the flow of services demanded at the existing price. As a consequence, µ is high and the upper bound 1* =S is reached: the agent spends all her time in accumulating additional human capital, and no labour earnings materialise. In the second phase of life, when the human capital stock becomes adequate, marginal cost and marginal benefit are equated, and 10 * << S .49 By replacing the optimal solution (A.2.13) into equation (A.2.3), we get ( ) HHSQH δ−= *& : since *S declines steadily, the human capital stock reaches a maximum when 0=H& , and from then onwards declines. If we look at the dynamics of actual earnings defined in (A.2.1), by making use of cost minimisation (A.2.4), we get
47 By multiplying both sides of (A.2.14) by ( )te δ+ρ− , taking the integrals of both sides on the interval ( )Tt, and integrating
by parts the left hand side, we reach the following condition ( ) ( ) ( ) ( ) ( ) ( )( )tTtT eeeteT δ+ρ−δ+ρ−δ+ρ−δ+ρ− −δ+ρ
β=µ−µ , from
which equation (A.2.15) is derived.
48 By rewriting the Hamiltonian (A.2.9) as ( )( ) ( )HQQCHe t δ−λ−−β=Ω ρ− and deriving it with respect to Q (namely, the
optimal increase in human capital), we obtain µ=λ=⇔=λ− ρρ− tt edQdC
dQdCe 0 .
49 “The value at time t of acquiring an additional unit of human capital is the discounted value to that time of the additions to earnings that the undepreciated part of this unit will bring about” (Ben-Porath 1967, 355).
23
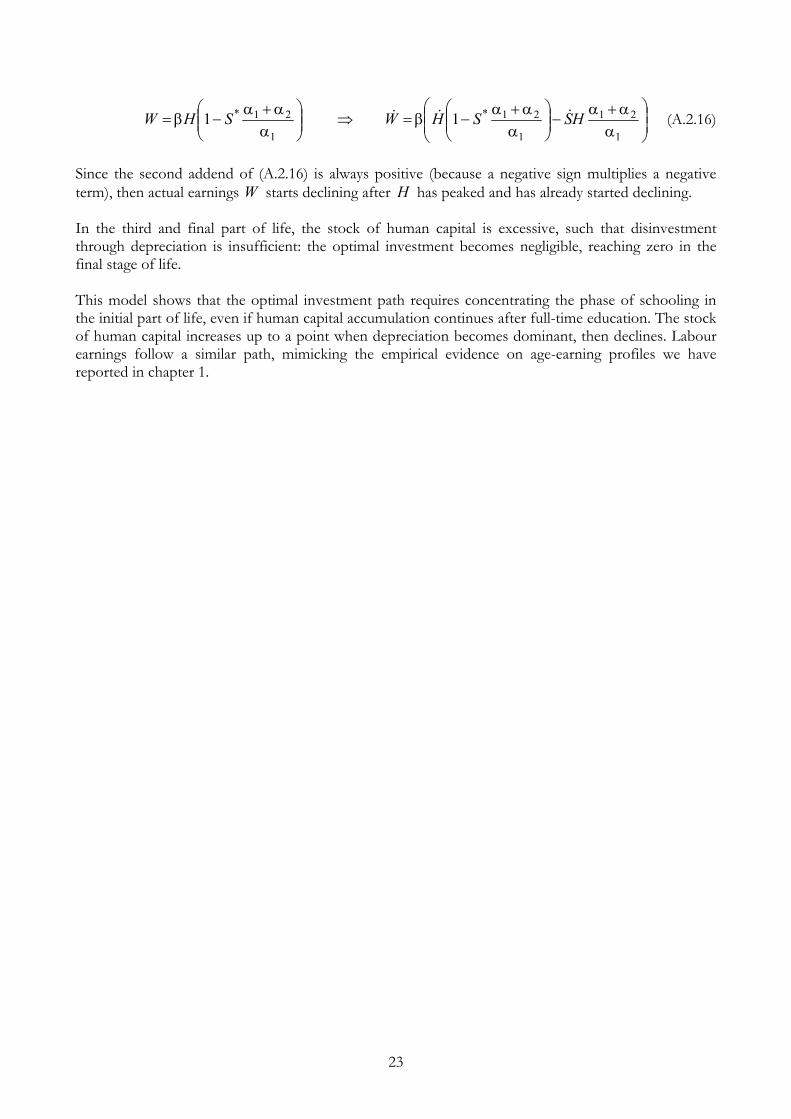
αα+α
−
αα+α
−β=⇒
αα+α
−β=1
21
1
21*
1
21* 11 HSSHWSHW &&& (A.2.16)
Since the second addend of (A.2.16) is always positive (because a negative sign multiplies a negative term), then actual earnings W starts declining after H has peaked and has already started declining. In the third and final part of life, the stock of human capital is excessive, such that disinvestment through depreciation is insufficient: the optimal investment becomes negligible, reaching zero in the final stage of life. This model shows that the optimal investment path requires concentrating the phase of schooling in the initial part of life, even if human capital accumulation continues after full-time education. The stock of human capital increases up to a point when depreciation becomes dominant, then declines. Labour earnings follow a similar path, mimicking the empirical evidence on age-earning profiles we have reported in chapter 1.