CHAPTER 2 TDIP SURVEY
68
- 37 - CHAPTER 2 TDIP SURVEY 2-1 Objectives The TDIP (Time Domain Induced Polarization) survey was carried out in order to extract mineralized zones in the potential area delineated by geological and airborne magnetic survey in Phase I and II of this project. 2-2 Survey Locations and Specifications The survey areas were Khujiriin gol area, Zuukhiin gol area, Danbatseren east area and Tsagaan chuluut west area located respectively to the west-northwest, north, southwest and northwest of Erdenet Mine. The distance from Erdenet Mine is about 45km to Khujiriin gol area, about 25km to Zuukhiin gol area and about 20km to Tsagaan chuluut west area. In Danbatseren east area, the potential area was narrowed down to three small areas(Danbatseren east 1, 3 and 4 areas) based on the result of airborne magnetic survey. Table II-2-1 shows the coordinates of the survey areas. Table II-2-1 Coordinate of the survey area UTM coordinate of the corners UTM coordinate of the corners Area East North Area East North 390860 5445450 415340 5414120 396250 5445450 417300 5414120 396250 5438150 417300 5412640 Khujiriin gol 390860 5438150 420230 5412640 440550 5454660 420230 5409000 447050 5454660 416320 5409000 447050 5448150 416320 5407690 Zuukhiin gol 440550 5448150 414235 5407690 425580 5402440 414235 5410000 427780 5402440 Danbatseren east-4 415340 5410000 427780 5399620 417040 5439730 Danbatseren east-1 425580 5399620 423520 5439730 412210 5412650 423520 5435730 414240 5412650 Tsagaan chuluut west 417040 5435730 414240 5410450 Danbatseren east-3 412210 5410450
Transcript of CHAPTER 2 TDIP SURVEY
- 37 -
CHAPTER 2 TDIP SURVEY
2-1 Objectives
The TDIP (Time Domain Induced Polarization) survey was carried out in order to extract
mineralized zones in the potential area delineated by geological and airborne magnetic survey in
Phase I and II of this project.
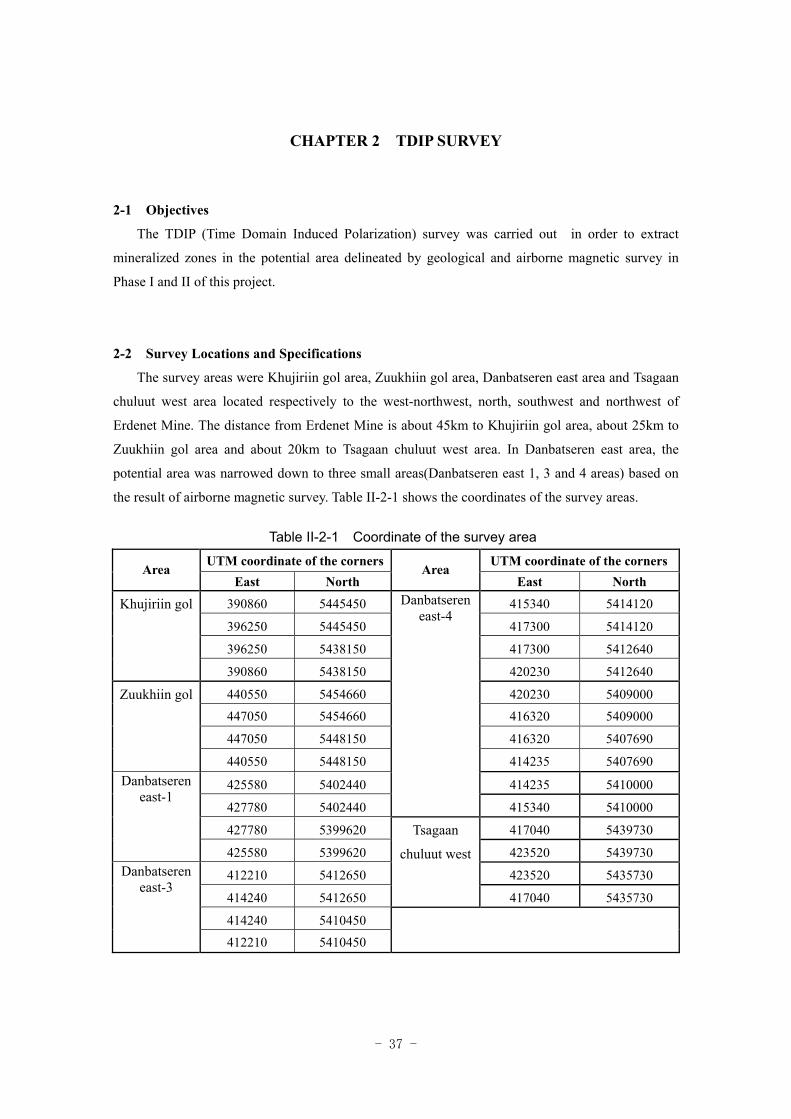
2-2 Survey Locations and Specifications
The survey areas were Khujiriin gol area, Zuukhiin gol area, Danbatseren east area and Tsagaan
chuluut west area located respectively to the west-northwest, north, southwest and northwest of
Erdenet Mine. The distance from Erdenet Mine is about 45km to Khujiriin gol area, about 25km to
Zuukhiin gol area and about 20km to Tsagaan chuluut west area. In Danbatseren east area, the
potential area was narrowed down to three small areas(Danbatseren east 1, 3 and 4 areas) based on
the result of airborne magnetic survey. Table II-2-1 shows the coordinates of the survey areas.
Table II-2-1 Coordinate of the survey area
UTM coordinate of the corners UTM coordinate of the cornersArea
East North Area
East North
390860 5445450 415340 5414120
396250 5445450 417300 5414120
396250 5438150 417300 5412640
Khujiriin gol
390860 5438150 420230 5412640
440550 5454660 420230 5409000
447050 5454660 416320 5409000
447050 5448150 416320 5407690
Zuukhiin gol
440550 5448150 414235 5407690
425580 5402440 414235 5410000
427780 5402440
Danbatseren east-4
415340 5410000
427780 5399620 417040 5439730
Danbatseren east-1
425580 5399620 423520 5439730
412210 5412650 423520 5435730
414240 5412650
Tsagaan
chuluut west
417040 5435730
414240 5410450
Danbatseren east-3
412210 5410450
- 38 -
The IP data were taken along lines by keeping a potential dipole of 200m with a separation
factor from 1 to 5. Table II-2-2 shows amounts of TDIP survey.
Table II-2-2 Amounts of TDIP survey
Area Number of lines Total length Number of points
Khujiriin gol 3.0km × 4 lines 12.0km 220
Zuukhiin gol 3.0km × 9 lines 4.0km × 3 lines
39.0km 735
Danbatseren east-1 3.0km × 2 lines 6.0km 110
Danbatseren east-3 5.0km × 1 lines 5.0km 105
Danbatseren east-4 3.0km × 2 lines 6.0km 110
Tsagaan chuluut west 2.4km × 1 lines 2.4km 40
Total 22 lines 70.4km 1320
Resistivity as well as chargeability values of rocks and core samples were also measured in the
laboratory
2-3 Survey Method
2-3-1 Procedures
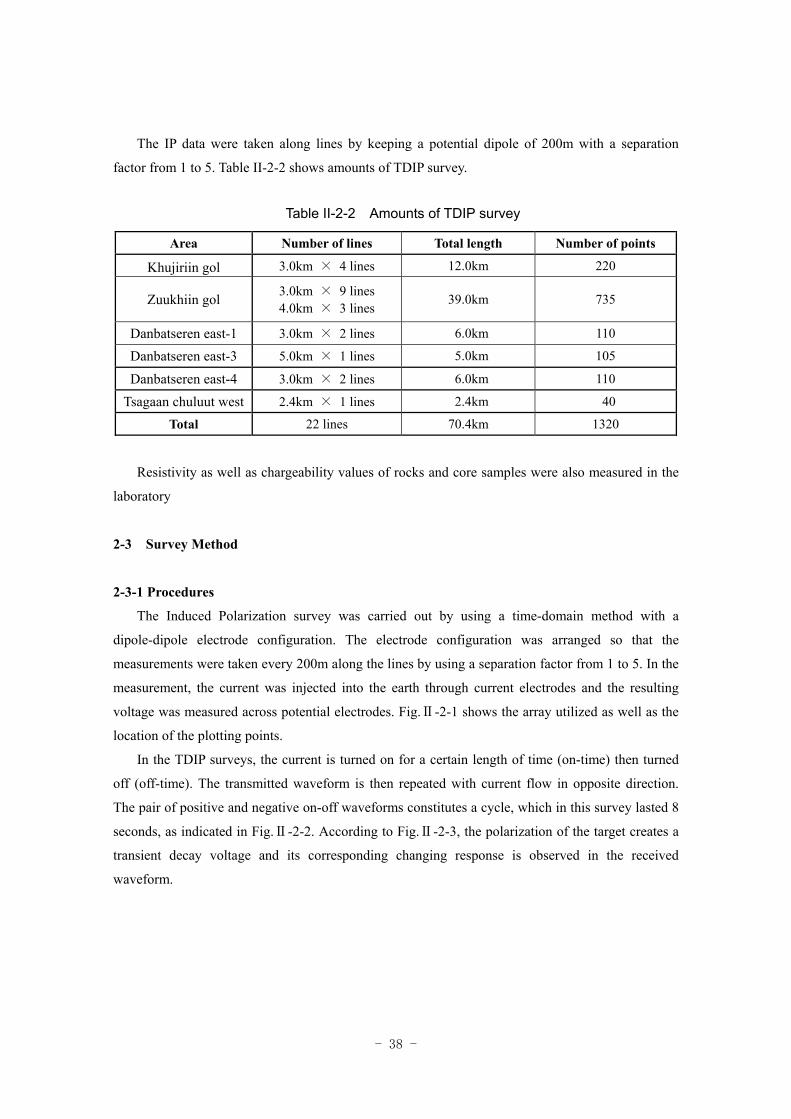
The Induced Polarization survey was carried out by using a time-domain method with a
dipole-dipole electrode configuration. The electrode configuration was arranged so that the
measurements were taken every 200m along the lines by using a separation factor from 1 to 5. In the
measurement, the current was injected into the earth through current electrodes and the resulting
voltage was measured across potential electrodes. Fig.Ⅱ-2-1 shows the array utilized as well as the
location of the plotting points.
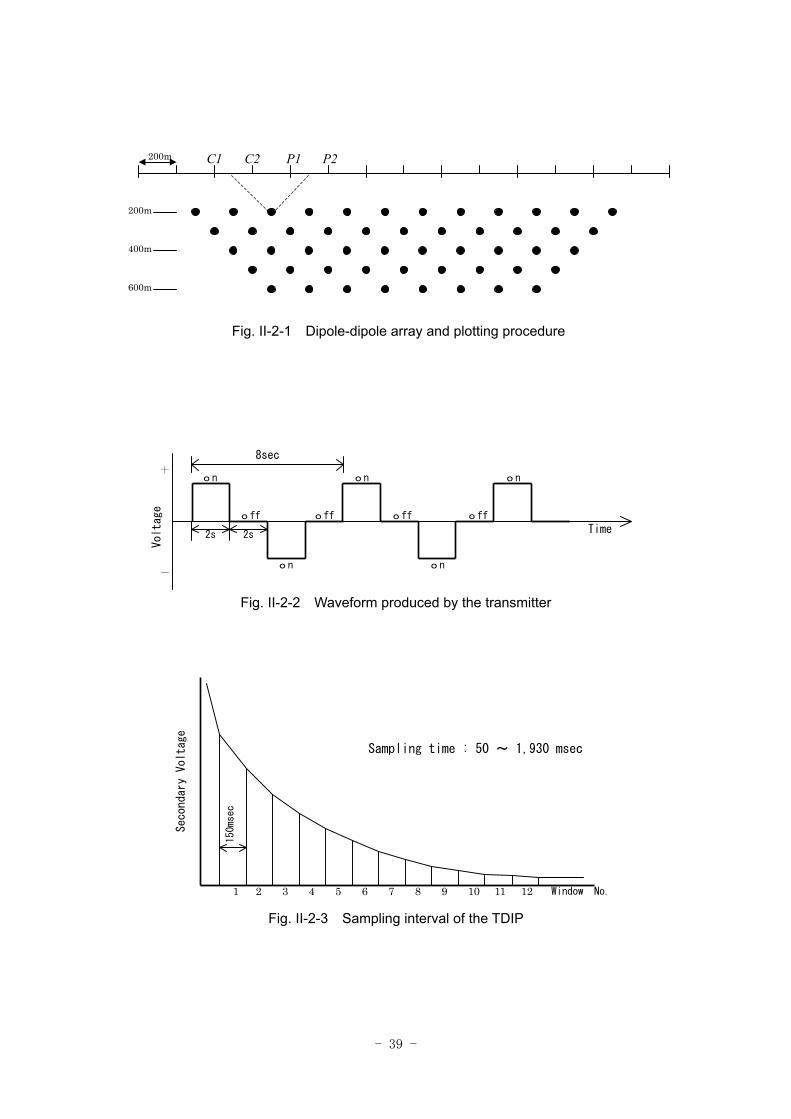
In the TDIP surveys, the current is turned on for a certain length of time (on-time) then turned
off (off-time). The transmitted waveform is then repeated with current flow in opposite direction.
The pair of positive and negative on-off waveforms constitutes a cycle, which in this survey lasted 8
seconds, as indicated in Fig.Ⅱ-2-2. According to Fig.Ⅱ-2-3, the polarization of the target creates a
transient decay voltage and its corresponding changing response is observed in the received
waveform.
- 39 -
Voltage
+
-
on on on
on on
off off off off
8sec
Time 2s 2s
Fig. II-2-2 Waveform produced by the transmitter
12 11
Secondary Voltage
150msec
1 2 3 4 5 6 7 8 9 10 Window No.
Sampling time : 50 ~ 1,930 msec
Fig. II-2-3 Sampling interval of the TDIP
200m
200m
400m
600m
Fig. II-2-1 Dipole-dipole array and plotting procedure
C1 C2 P1 P2
- 40 -
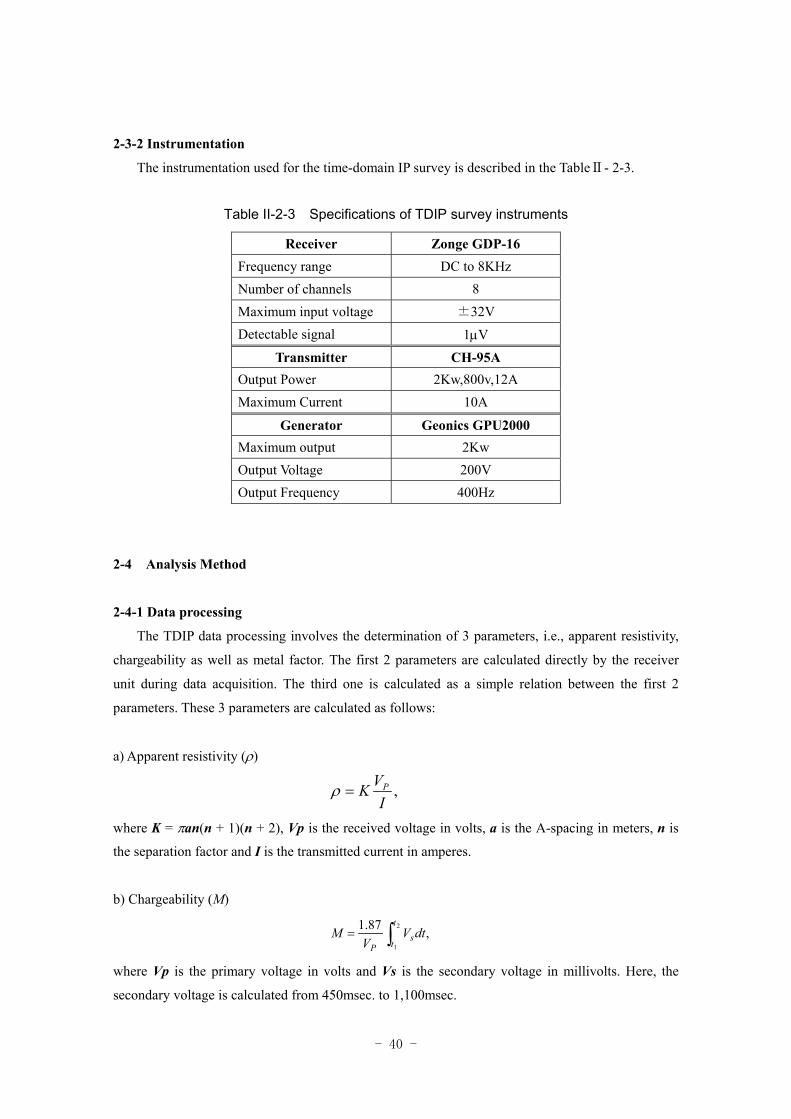
2-3-2 Instrumentation
The instrumentation used for the time-domain IP survey is described in the TableⅡ- 2-3.
Table II-2-3 Specifications of TDIP survey instruments
Receiver Zonge GDP-16 Frequency range DC to 8KHz Number of channels 8 Maximum input voltage ±32V Detectable signal 1µV
Transmitter CH-95A Output Power 2Kw,800v,12A Maximum Current 10A
Generator Geonics GPU2000 Maximum output 2Kw Output Voltage 200V Output Frequency 400Hz
2-4 Analysis Method
2-4-1 Data processing
The TDIP data processing involves the determination of 3 parameters, i.e., apparent resistivity,
chargeability as well as metal factor. The first 2 parameters are calculated directly by the receiver
unit during data acquisition. The third one is calculated as a simple relation between the first 2
parameters. These 3 parameters are calculated as follows:
a) Apparent resistivity (ρ)
,I
VK P=ρ
where K = πan(n + 1)(n + 2), Vp is the received voltage in volts, a is the A-spacing in meters, n is
the separation factor and I is the transmitted current in amperes.
b) Chargeability (M)
,87.1 2
1
dtVV
Mt
ts
P∫=
where Vp is the primary voltage in volts and Vs is the secondary voltage in millivolts. Here, the
secondary voltage is calculated from 450msec. to 1,100msec.
- 41 -
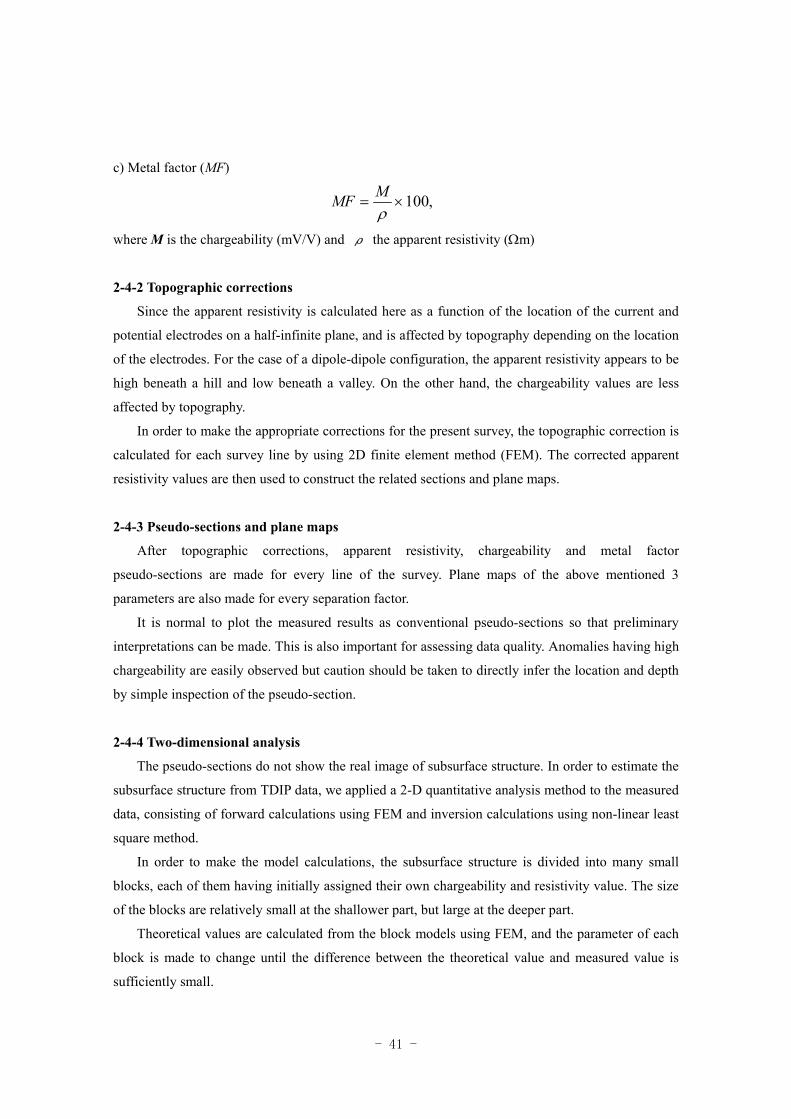
c) Metal factor (MF)
,100×=ρMMF
where M is the chargeability (mV/V) and ρ the apparent resistivity (Ωm)
2-4-2 Topographic corrections
Since the apparent resistivity is calculated here as a function of the location of the current and
potential electrodes on a half-infinite plane, and is affected by topography depending on the location
of the electrodes. For the case of a dipole-dipole configuration, the apparent resistivity appears to be
high beneath a hill and low beneath a valley. On the other hand, the chargeability values are less
affected by topography.
In order to make the appropriate corrections for the present survey, the topographic correction is
calculated for each survey line by using 2D finite element method (FEM). The corrected apparent
resistivity values are then used to construct the related sections and plane maps.
2-4-3 Pseudo-sections and plane maps
After topographic corrections, apparent resistivity, chargeability and metal factor
pseudo-sections are made for every line of the survey. Plane maps of the above mentioned 3
parameters are also made for every separation factor.
It is normal to plot the measured results as conventional pseudo-sections so that preliminary
interpretations can be made. This is also important for assessing data quality. Anomalies having high
chargeability are easily observed but caution should be taken to directly infer the location and depth
by simple inspection of the pseudo-section.
2-4-4 Two-dimensional analysis
The pseudo-sections do not show the real image of subsurface structure. In order to estimate the
subsurface structure from TDIP data, we applied a 2-D quantitative analysis method to the measured
data, consisting of forward calculations using FEM and inversion calculations using non-linear least
square method.
In order to make the model calculations, the subsurface structure is divided into many small
blocks, each of them having initially assigned their own chargeability and resistivity value. The size
of the blocks are relatively small at the shallower part, but large at the deeper part.
Theoretical values are calculated from the block models using FEM, and the parameter of each
block is made to change until the difference between the theoretical value and measured value is
sufficiently small.
- 42 -
2-5 Survey Results
2-5-1 Khujiriin gol area
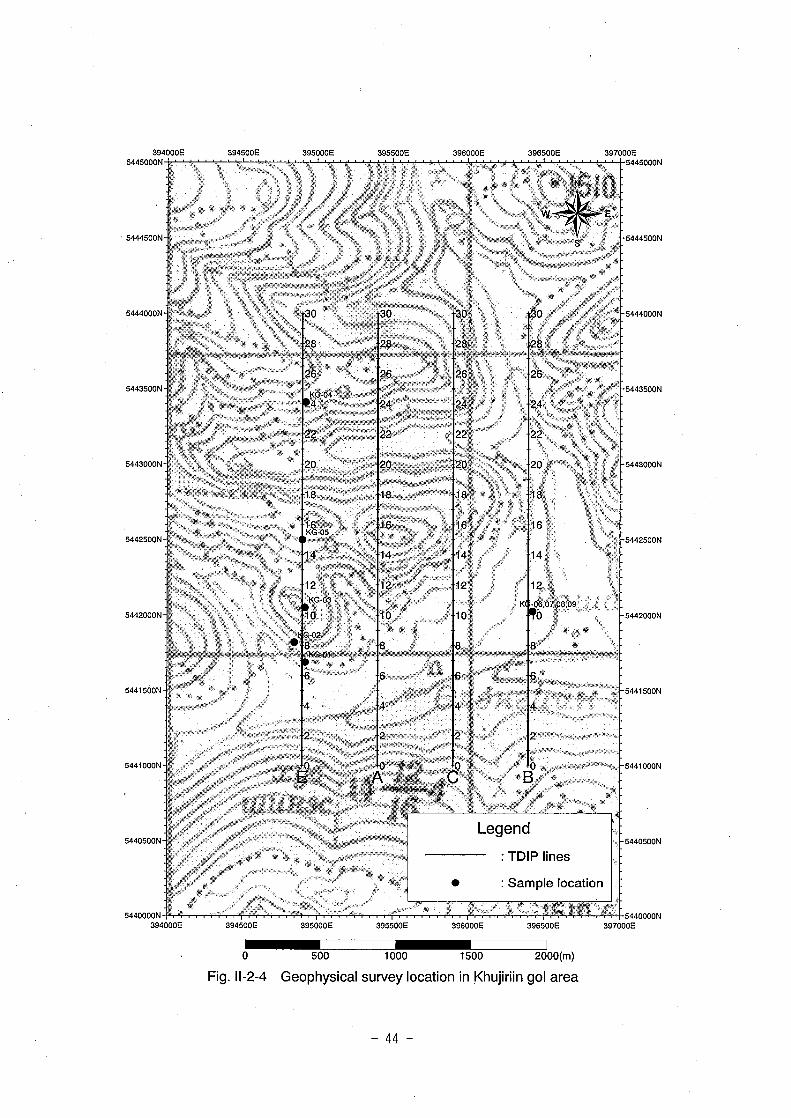
(1) Lines location
Fig.II-2-4 shows the location of the TDIP lines in Khujiriin gol area. 4 lines of 3.0km long each
were set up along N0°E. Total line length is 12.0km.
(2) Results
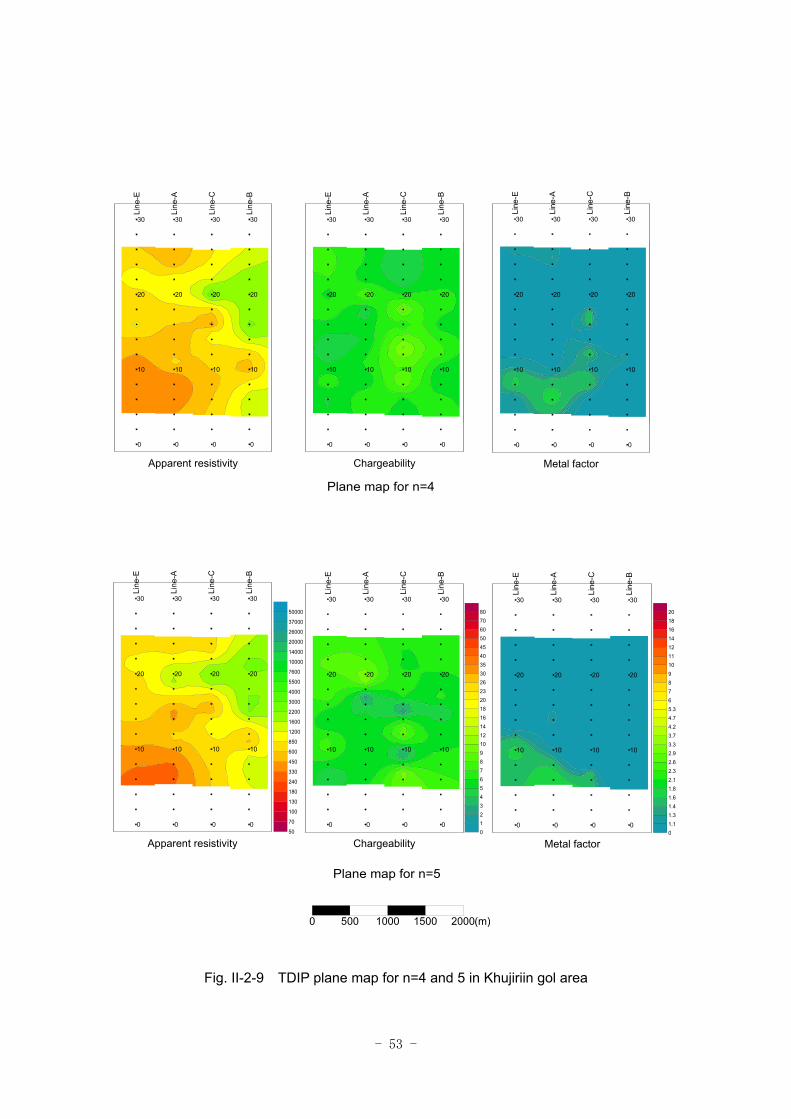
Figs.II-2-5 ~ II-2-7 show the pseudo-sections, while Figs.II-2-8 ~ II-2-10 indicate the plane
maps from n=1 to 5.
In this area, the apparent resistivity value ranges between 217 ~ 3050Ωm, and average is 836Ωm.
Low resistivity zones are distributed along the direction of E-W, and are corresponds to the area
underlain by Quaternary sediments. High resistivity above 1000Ωm is distributed widely from n=2
to 5 on the north side of the station 14 and on the south side of the station 8 on the line B and is also
recognized at the north part of the other lines. According to the plane maps, high resistivity zone is
distributed in the mountain area on the east side of the stream running through the eastern part of the
area from north to south. The plane maps from n=3 to 5 show that this high resistivity zone extends
westward in the north part of this area.
The chargeability value ranges between 1.4 and 10.6mV/V, and average is 5.4mV/V. No
remarkable high chargeability anomaly such as to indicate existence of porphyry copper deposit is
detected. Slightly high chargeability above 10mV/V is recognized at deeper part on the lines A and
C.
The maximum value of metal factor is 2.1, and no remarkable anomaly is recognized.
(3) 2-D analysis
Figs.II-2-11 ~ II.2-14 show the 2-D analysis sections and plane maps.
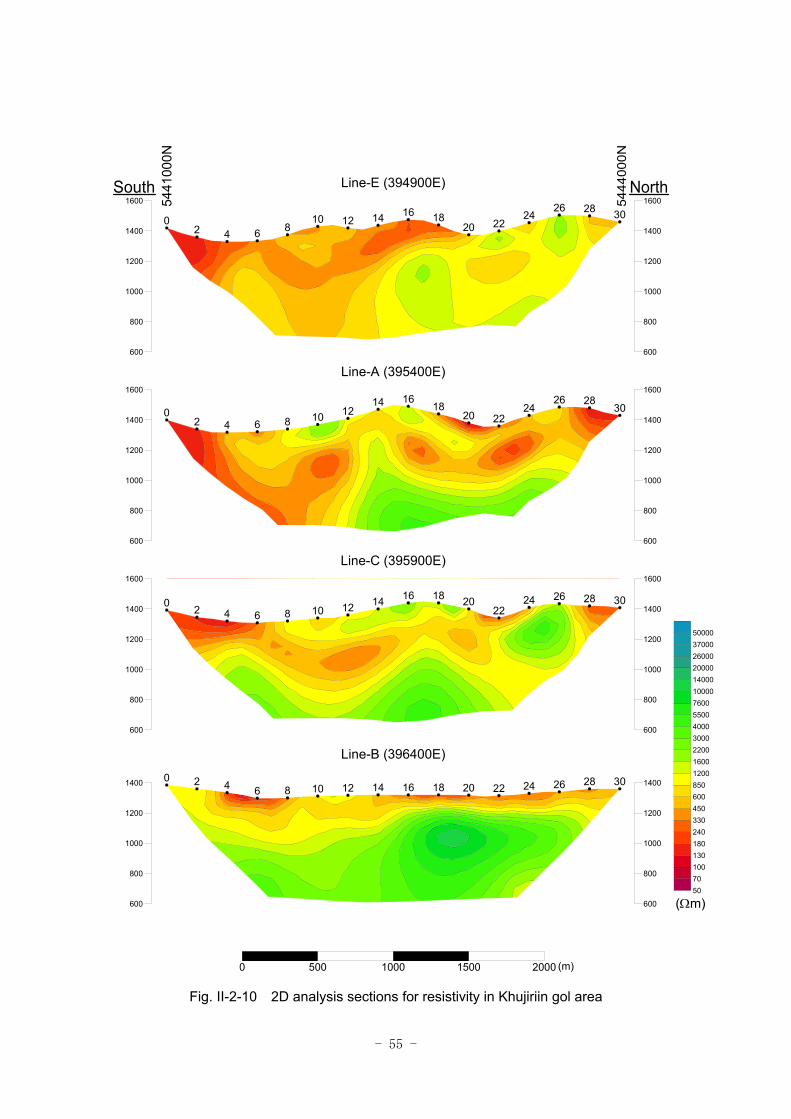
The analyzed resistivity value ranges between 82 ~ 11kΩm, and average is 1270Ωm. According
to the plane map at the depth of 50m, low resistivity under 500Ωm is distributed at the area
underlain by Quaternary sediments, and high resistivity is distributed at the mountain area. The plane
maps below the depth of 150m show high resistivity distributed widely in the east part of the area.
The resistivity structure changes greatly on the east and west of the stream running through the
eastern part of the area from north to south. Below the depth of 300m, the high resistivity extends
westward around the stations 14 to 16 on each line. The section of the line A shows high resistivity
zone inclining to north.
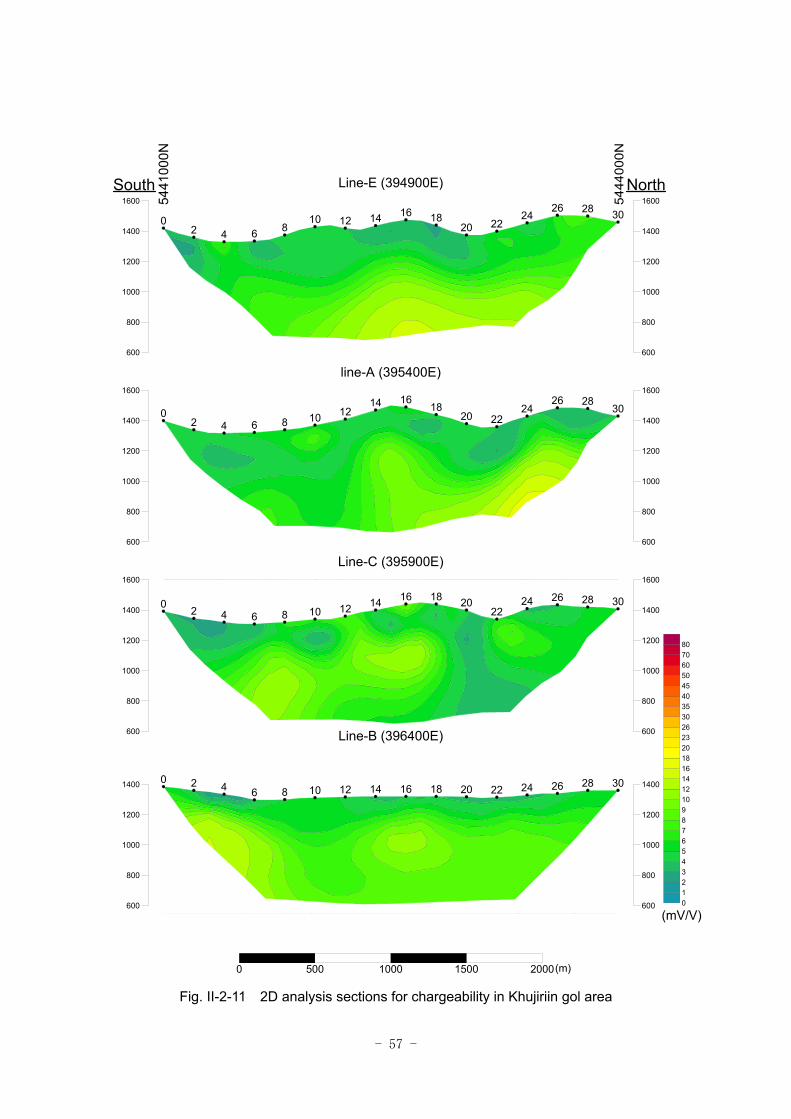
The analyzed chargeability value ranges between 1.6 ~ 16.7mV/V and, average is 6.2mV/V. In
- 43 -
the western part of the area, high chargeability anomaly zone inclining to north is distributed
continuously to deeper part below the depth of 200m around the stations 12 to 16 on the lines A and
E. This high chargeability zone is seemed to continue eastward, but on the lines C and B, the center
of high chargeability is located at the depth of 300 to 400m around the stations 14 to 18, and
continuity to deeper part is not recognized. High chargeability is also distributed at the deep part of
the stations 24 to 26 on the line A.
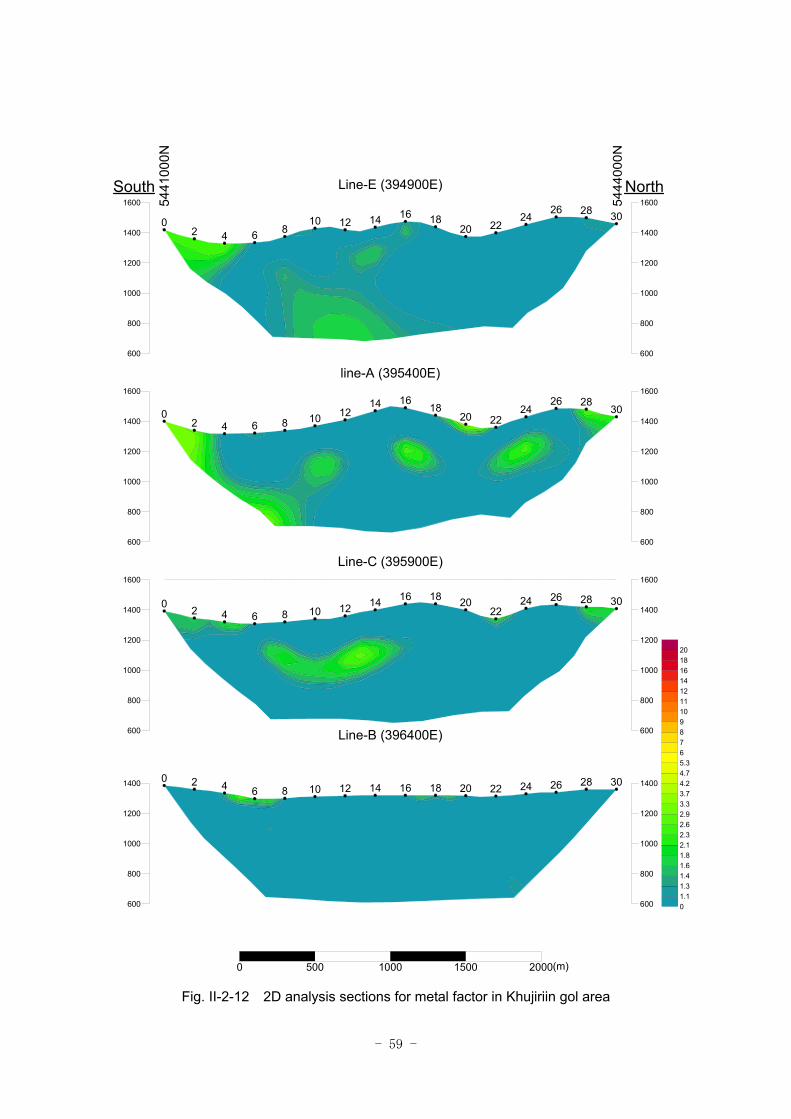
Metal factor value is almost under 4, and no remarkable anomaly is recognized.
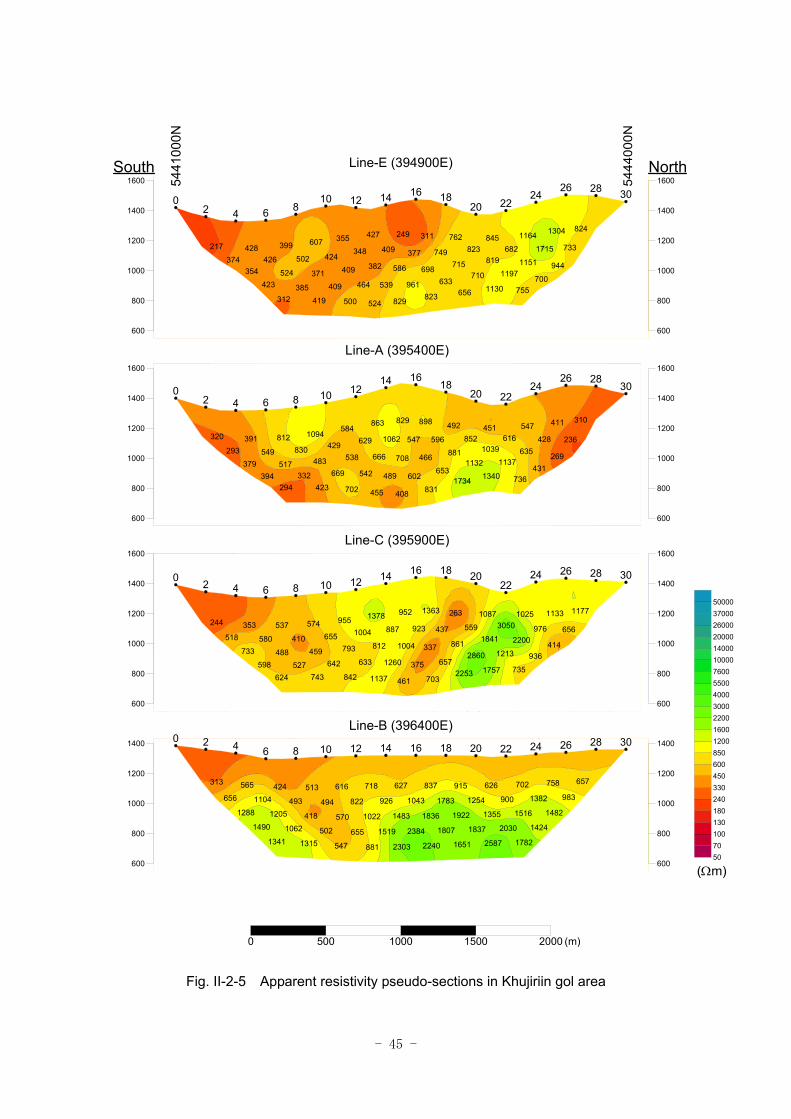
- 45 -
Fig. II-2-5 Apparent resistivity pseudo-sections in Khujiriin gol area
8241304
7331164
1715
944
845682
1151
700
762823
819
1197
755
311
749715
710
1130
249
377
698633
656
427
409
586
961823
355348
382
539
829
607
424409
464
524
399
502
371409
500
428426
524
385419
217
374354
423
312
02 4 6 8
10 12 14 16 1820 22
2426 28 30
Line-E (394900E)
600
800
1000
1200
1400
1600
600
800
1000
1200
1400
1600
310411
236
547428
269
451616
635
431
492852
10391137
736
898
596881
11321340
829
547
466653
1734
863
1062
708
602831
584629
666
489
408
1094429
538
542
455
812830
483669
702
391
549517
332423
320
293379
394294
02 4 6 8 10 12
14 1618
20 2224
26 2830
Line-A (395400E)
600
800
1000
1200
1400
1600
600
800
1000
1200
1400
1600
11771133
656
1025
976
414
10873050
2200
936
263
5591841
1213
735
1363
437
8612860
1757
952
923
337
6572253
1378
887
1004
375
703
9551004
812
1260
461
574655
793
633
1137
537
410459
642
842
353
580
488527
743
244
518
733
598624
0 2 4 6 8 10 12 14 16 18 2022
24 26 28 30
Line-C (395900E)
600
800
1000
1200
1400
1600
600
800
1000
1200
1400
1600
657758
983702
1382
1482
626
900
1516
1424
915
1254
1355
2030
1782
837
1783
1922
1837
2587
627
1043
1836
1807
1651
718
926
1483
2384
2240
616
822
1022
1519
2303
513
494
570
655
881
424
493
418
502
547
565
1104
1205
1062
1315
313
656
1288
1490
1341
0 2 4 6 8 10 12 14 16 18 20 22 24 26 28 30Line-B (396400E)
600
800
1000
1200
1400
600
800
1000
1200
1400
50701001301802403304506008501200160022003000400055007600100001400020000260003700050000
0 500 1000 1500 2000
5441
000N
5444
000N
South North
(Ωm)
(m)
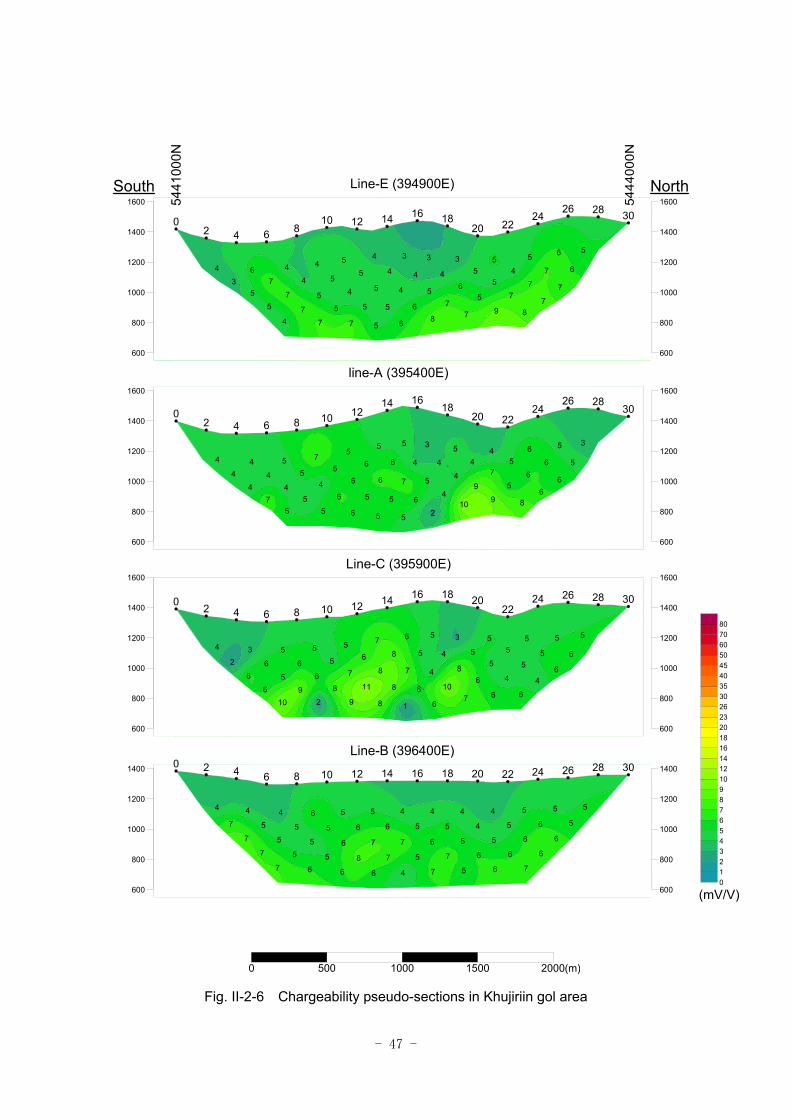
- 47 -
Fig. II-2-6 Chargeability pseudo-sections in Khujiriin gol area
56
65
7
7
54
7
7
35
5
7
8
3
46
5
9
3
4
57
7
4
4
4
68
55
5
5
6
4
54
5
5
4
4
55
7
67
7
77
4
35
5
4
02 4 6 8
10 12 14 16 1820 22
2426 28 30
Line-E (394900E)
600
800
1000
1200
1400
1600
600
800
1000
1200
1400
1600
35
5
66
6
45
6
6
54
75
8
3
44
99
5
4
54
10
5
6
7
62
56
6
5
5
75
6
5
5
55
46
6
4
44
55
4
44
75
02 4 6 8 10 12
14 1618
20 2224
26 2830
line-A (395400E)
600
800
1000
1200
1400
1600
600
800
1000
1200
1400
1600
55
6
5
5
6
55
5
4
3
55
4
6
5
4
86
6
6
5
4
107
7
8
7
6
6
56
8
8
1
55
7
11
8
5
66
8
9
3
6
59
2
4
2
6
610
02 4 6 8 10 12 14 16 18 20
2224 26 28 30
Line-C (395900E)
600
800
1000
1200
1400
1600
600
800
1000
1200
1400
1600
55
55
6
6
4
5
6
6
4
4
5
6
7
4
5
5
6
6
4
5
6
7
5
5
6
7
5
7
5
6
7
7
4
6
5
6
8
6
4
5
5
5
6
4
5
5
5
6
4
7
7
7
7
0 2 4 6 8 10 12 14 16 18 20 22 24 26 28 30Line-B (396400E)
600
800
1000
1200
1400
600
800
1000
1200
1400
5441
000N
5444
000N
South North
(mV/V)
0 500 1000 1500 2000
012345678910121416182023263035404550607080
(m)
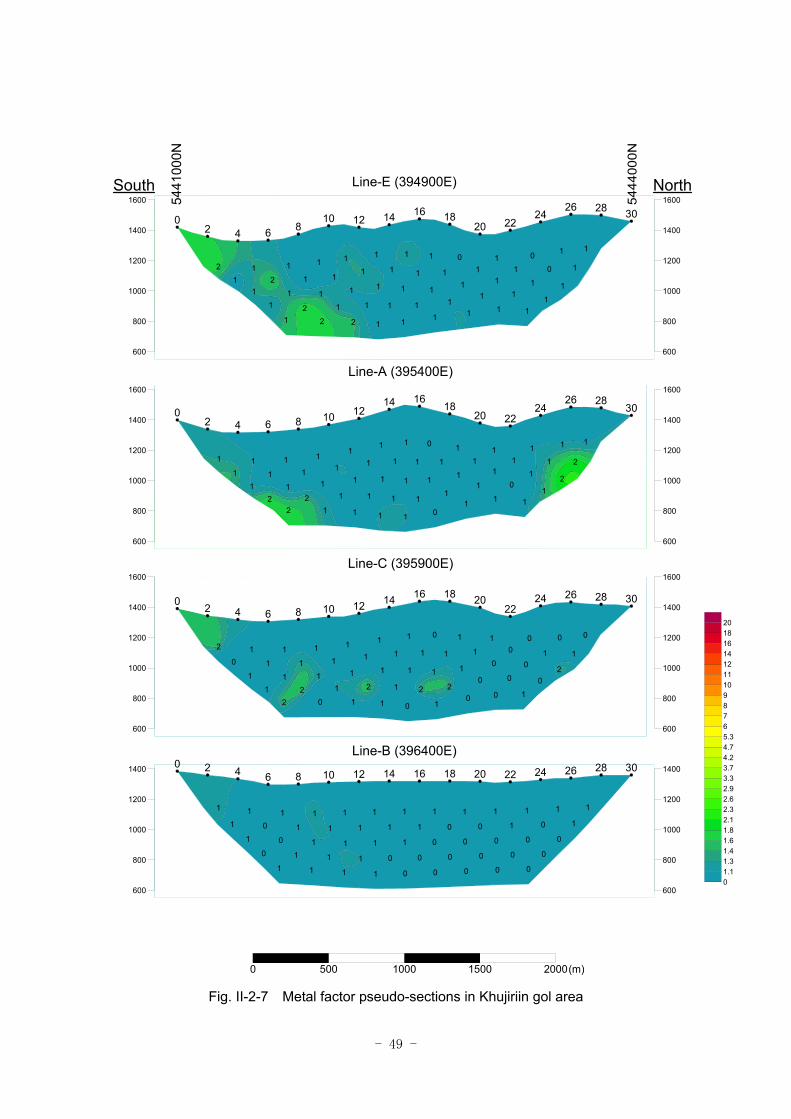
- 49 -
Fig. II-2-7 Metal factor pseudo-sections in Khujiriin gol area
11
10
0
1
11
1
1
01
1
1
1
1
11
1
1
1
1
11
1
1
1
1
11
11
1
1
1
1
11
1
1
1
1
11
2
12
1
22
2
11
1
1
02 4 6 8
10 12 14 16 1820 22
2426 28 30
Line-E (394900E)
600
800
1000
1200
1400
1600
600
800
1000
1200
1400
1600
11
2
11
2
11
1
1
11
10
1
0
11
11
1
1
11
1
1
1
1
10
11
1
1
1
11
1
1
1
11
11
1
11
12
1
1
11
22
02 4 6 8 10 12
14 1618
20 2224
26 2830
Line-A (395400E)
600
800
1000
1200
1400
1600
600
800
1000
1200
1400
1600
00
1
0
1
2
10
0
0
1
10
0
1
0
1
10
0
1
1
1
20
1
1
1
2
1
11
1
1
0
11
1
2
1
1
11
1
1
1
1
12
0
2
0
1
12
0 2 4 6 8 10 12 14 16 18 2022
24 26 28 30
Line-C (395900E)
600
800
1000
1200
1400
1600
600
800
1000
1200
1400
1600
11
11
0
0
1
1
0
0
1
0
0
0
0
1
0
0
0
0
1
1
0
0
0
1
1
1
0
0
1
1
1
0
0
1
1
1
1
1
1
1
1
1
1
1
0
0
1
1
1
1
1
0
1
0 2 4 6 8 10 12 14 16 18 20 22 24 26 28 30Line-B (396400E)
600
800
1000
1200
1400
600
800
1000
1200
1400
5441
000N
5444
000N
South North
0 500 1000 1500 2000
01.11.31.41.61.82.12.32.62.93.33.74.24.75.3678910111214161820
(m)
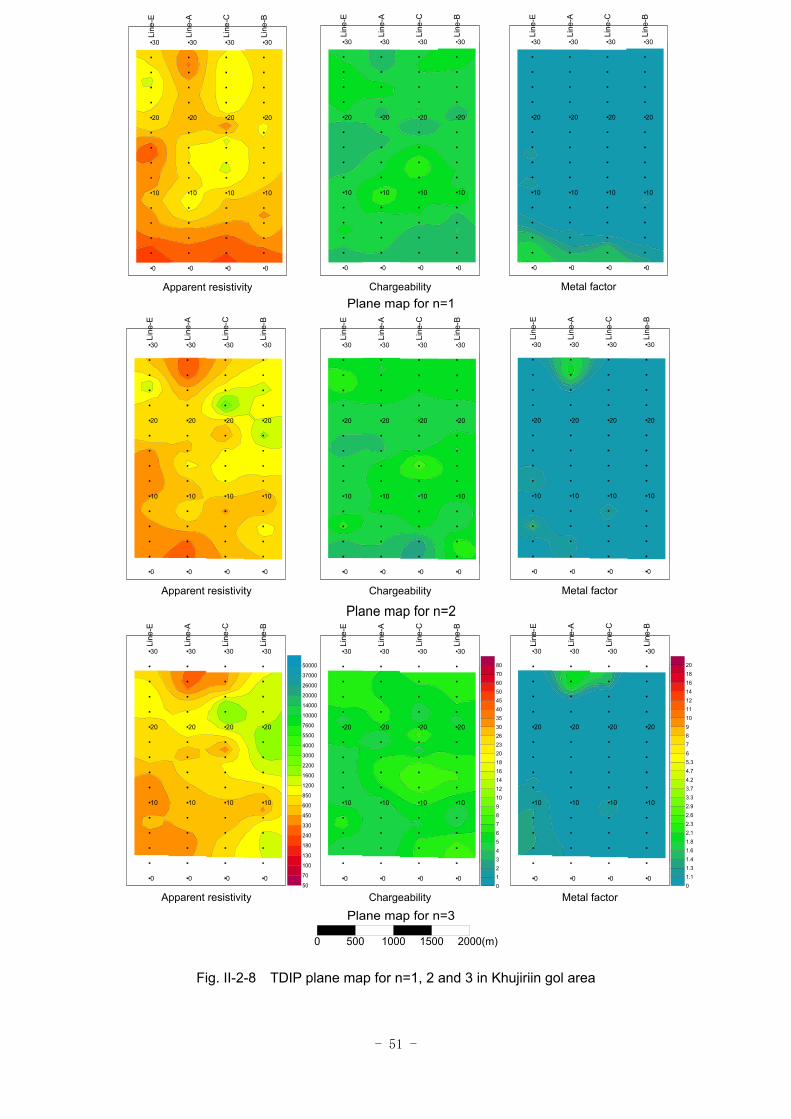
- 51 -
Fig. II-2-8 TDIP plane map for n=1, 2 and 3 in Khujiriin gol area
0
10
20
30
0
10
20
30
0
10
20
30
0
10
20
30
Line
-E
Line
-A
Line
-C
Line
-B
Apparent resistivity
0
10
20
30
0
10
20
30
0
10
20
30
0
10
20
30
Line
-E
Line
-A
Line
-C
Line
-B
Chargeability
0
10
20
30
0
10
20
30
0
10
20
30
0
10
20
30
Line
-E
Line
-A
Line
-C
Line
-B
Metal factor
0
10
20
30
0
10
20
30
0
10
20
30
0
10
20
30
Line
-E
Line
-A
Line
-C
Line
-B
Apparent resistivity
0
10
20
30
0
10
20
30
0
10
20
30
0
10
20
30Li
ne-E
Line
-A
Line
-C
Line
-B
Chargeability
0
10
20
30
0
10
20
30
0
10
20
30
0
10
20
30
Line
-E
Line
-A
Line
-C
Line
-B
Metal factor
0
10
20
30
0
10
20
30
0
10
20
30
0
10
20
30
Line
-E
Line
-A
Line
-C
Line
-B
Apparent resistivity50
70
100
130
180
240
330
450
600
850
1200
1600
2200
3000
4000
5500
7600
10000
14000
20000
26000
37000
50000
0
10
20
30
0
10
20
30
0
10
20
30
0
10
20
30
Line
-E
Line
-A
Line
-C
Line
-B
Chargeability012345678910121416182023263035404550607080
0
10
20
30
0
10
20
30
0
10
20
30
0
10
20
30
Line
-E
Line
-A
Line
-C
Line
-B
Metal factor01.11.31.41.61.82.12.32.62.93.33.74.24.75.3678910111214161820
0 500 1000 1500 2000(m)
Plane map for n=1
Plane map for n=2
Plane map for n=3
- 53 -
Fig. II-2-9 TDIP plane map for n=4 and 5 in Khujiriin gol area
0
10
20
30
0
10
20
30
0
10
20
30
0
10
20
30
Line
-E
Line
-A
Line
-C
Line
-B
Apparent resistivity
0
10
20
30
0
10
20
30
0
10
20
30
0
10
20
30
Line
-E
Line
-A
Line
-C
Line
-B
Chargeability
0
10
20
30
0
10
20
30
0
10
20
30
0
10
20
30
Line
-E
Line
-A
Line
-C
Line
-B
Metal factor
0
10
20
30
0
10
20
30
0
10
20
30
0
10
20
30
Line
-E
Line
-A
Line
-C
Line
-B
Apparent resistivity50
70
100
130
180
240
330
450
600
850
1200
1600
2200
3000
4000
5500
7600
10000
14000
20000
26000
37000
50000
0
10
20
30
0
10
20
30
0
10
20
30
0
10
20
30
Line
-E
Line
-A
Line
-C
Line
-B
Chargeability012345678910121416182023263035404550607080
0
10
20
30
0
10
20
30
0
10
20
30
0
10
20
30
Line
-E
Line
-A
Line
-C
Line
-B
Metal factor01.11.31.41.61.82.12.32.62.93.33.74.24.75.3678910111214161820
0 500 1000 1500 2000(m)
Plane map for n=4
Plane map for n=5
- 55 -
Fig. II-2-10 2D analysis sections for resistivity in Khujiriin gol area
02 4 6 8
10 12 14 16 1820 22
2426 28 30
Line-E (394900E)
600
800
1000
1200
1400
1600
600
800
1000
1200
1400
1600
02 4 6 8 10 12
14 1618
20 2224
26 2830
Line-A (395400E)
600
800
1000
1200
1400
1600
600
800
1000
1200
1400
1600
02 4 6 8 10 12 14 16 18 20
2224 26 28 30
Line-C (395900E)
600
800
1000
1200
1400
1600
600
800
1000
1200
1400
1600
0 2 4 6 8 10 12 14 16 18 20 22 24 26 28 30
Line-B (396400E)
600
800
1000
1200
1400
600
800
1000
1200
1400
50701001301802403304506008501200160022003000400055007600100001400020000260003700050000
0 500 1000 1500 2000
5441
000N
5444
000N
South North
(Ωm)
(m)
- 57 -
Fig. II-2-11 2D analysis sections for chargeability in Khujiriin gol area
02 4 6 8
10 12 14 16 1820 22
2426 28 30
Line-E (394900E)
600
800
1000
1200
1400
1600
600
800
1000
1200
1400
1600
02 4 6 8 10 12
14 1618
20 2224
26 2830
line-A (395400E)
600
800
1000
1200
1400
1600
600
800
1000
1200
1400
1600
0 2 4 6 8 10 12 14 16 18 2022
24 26 28 30
Line-C (395900E)
600
800
1000
1200
1400
1600
600
800
1000
1200
1400
1600
0 2 4 6 8 10 12 14 16 18 20 22 24 26 28 30
Line-B (396400E)
600
800
1000
1200
1400
600
800
1000
1200
1400
5441
000N
5444
000N
South North
(mV/V)
0 500 1000 1500 2000
012345678910121416182023263035404550607080
(m)
- 59 -
Fig. II-2-12 2D analysis sections for metal factor in Khujiriin gol area
02 4 6 8
10 12 14 16 1820 22
2426 28 30
Line-E (394900E)
600
800
1000
1200
1400
1600
600
800
1000
1200
1400
1600
02 4 6 8 10 12
14 1618
20 2224
26 2830
line-A (395400E)
600
800
1000
1200
1400
1600
600
800
1000
1200
1400
1600
02 4 6 8 10 12 14 16 18 20
2224 26 28 30
Line-C (395900E)
600
800
1000
1200
1400
1600
600
800
1000
1200
1400
1600
0 2 4 6 8 10 12 14 16 18 20 22 24 26 28 30
Line-B (396400E)
600
800
1000
1200
1400
600
800
1000
1200
1400
5441
000N
5444
000N
South North
0 500 1000 1500 2000
01.11.31.41.61.82.12.32.62.93.33.74.24.75.3678910111214161820
(m)
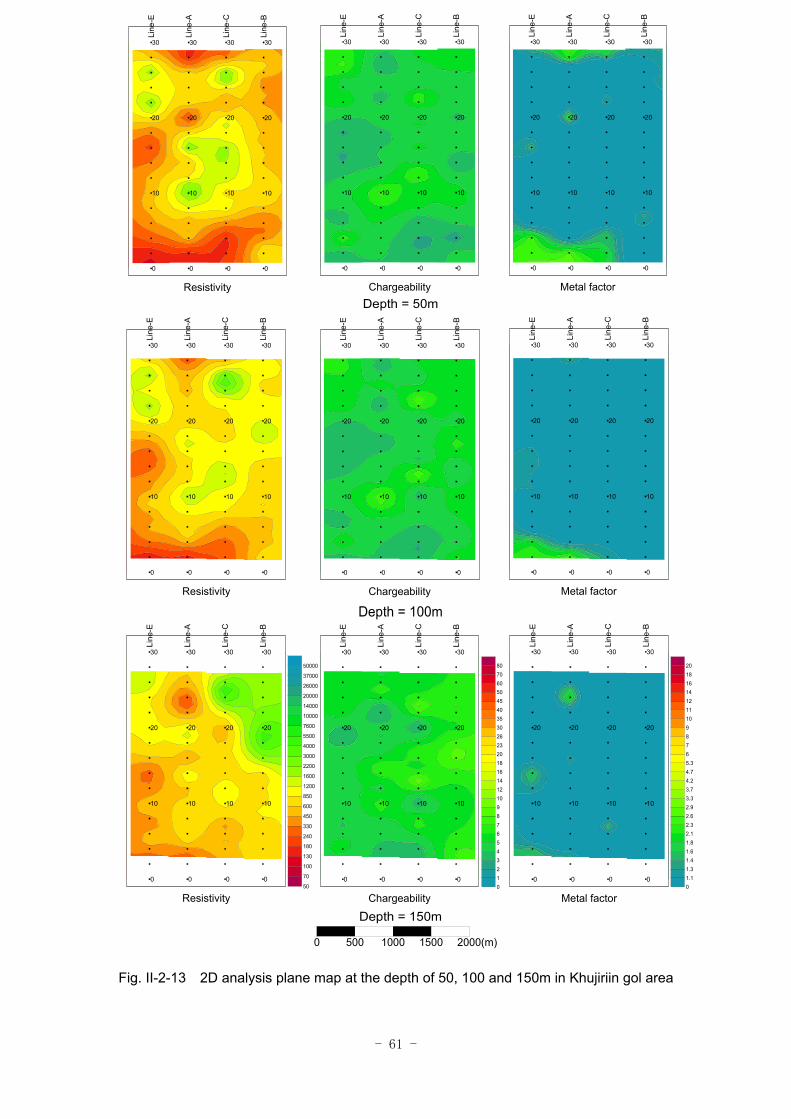
- 61 -
Fig. II-2-13 2D analysis plane map at the depth of 50, 100 and 150m in Khujiriin gol area
0
10
20
30
0
10
20
30
0
10
20
30
0
10
20
30
Line
-E
Line
-A
Line
-C
Line
-B
Resistivity
0
10
20
30
0
10
20
30
0
10
20
30
0
10
20
30
Line
-E
Line
-A
Line
-C
Line
-B
Chargeability
0
10
20
30
0
10
20
30
0
10
20
30
0
10
20
30
Line
-E
Line
-A
Line
-C
Line
-B
Metal factor
0
10
20
30
0
10
20
30
0
10
20
30
0
10
20
30
Line
-E
Line
-A
Line
-C
Line
-B
Resistivity
0
10
20
30
0
10
20
30
0
10
20
30
0
10
20
30Li
ne-E
Line
-A
Line
-C
Line
-B
Chargeability
0
10
20
30
0
10
20
30
0
10
20
30
0
10
20
30
Line
-E
Line
-A
Line
-C
Line
-B
Metal factor
0
10
20
30
0
10
20
30
0
10
20
30
0
10
20
30
Line
-E
Line
-A
Line
-C
Line
-B
Resistivity50
70
100
130
180
240
330
450
600
850
1200
1600
2200
3000
4000
5500
7600
10000
14000
20000
26000
37000
50000
0
10
20
30
0
10
20
30
0
10
20
30
0
10
20
30
Line
-E
Line
-A
Line
-C
Line
-B
Chargeability012345678910121416182023263035404550607080
0
10
20
30
0
10
20
30
0
10
20
30
0
10
20
30
Line
-E
Line
-A
Line
-C
Line
-B
Metal factor01.11.31.41.61.82.12.32.62.93.33.74.24.75.3678910111214161820
0 500 1000 1500 2000(m)
Depth = 50m
Depth = 100m
Depth = 150m
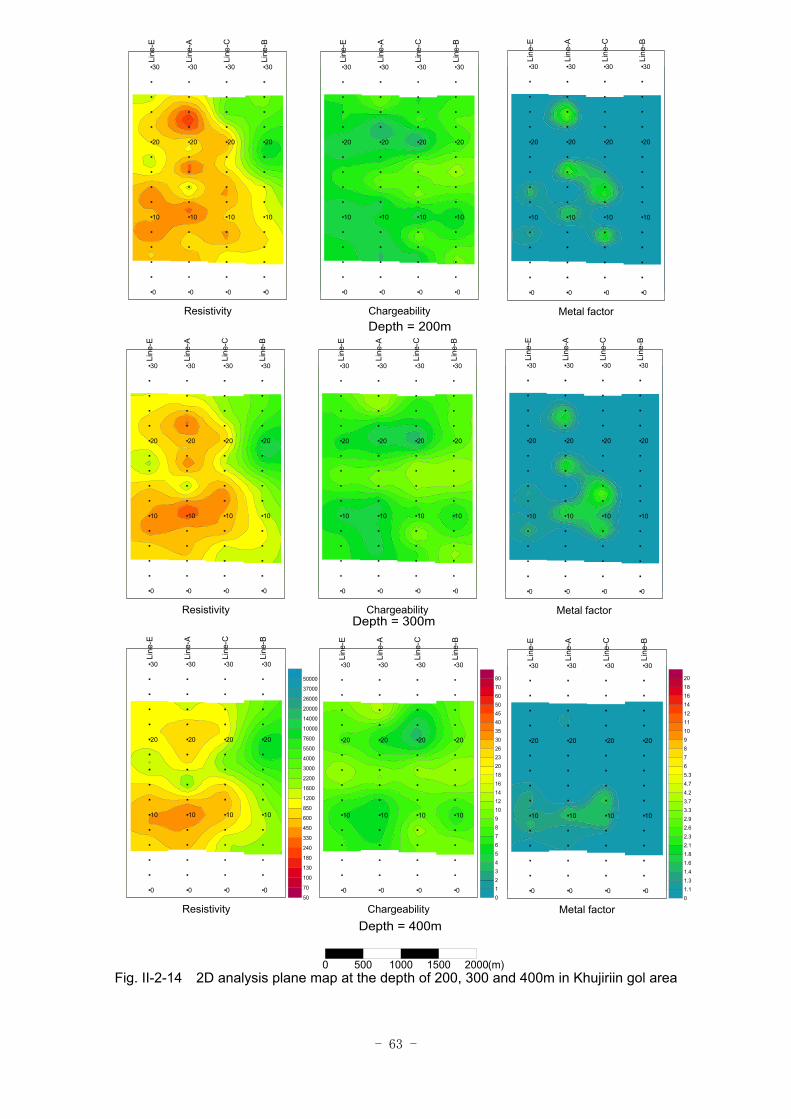
- 63 -
Fig. II-2-14 2D analysis plane map at the depth of 200, 300 and 400m in Khujiriin gol area
0
10
20
30
0
10
20
30
0
10
20
30
0
10
20
30
Line
-E
Line
-A
Line
-C
Line
-B
Resistivity
0
10
20
30
0
10
20
30
0
10
20
30
0
10
20
30
Line
-E
Line
-A
Line
-C
Line
-B
Chargeability
0
10
20
30
0
10
20
30
0
10
20
30
0
10
20
30
Line
-E
Line
-A
Line
-C
Line
-B
Metal factor
0
10
20
30
0
10
20
30
0
10
20
30
0
10
20
30
Line
-E
Line
-A
Line
-C
Line
-B
Resistivity50
70
100
130
180
240
330
450
600
850
1200
1600
2200
3000
4000
5500
7600
10000
14000
20000
26000
37000
50000
0
10
20
30
0
10
20
30
0
10
20
30
0
10
20
30
Line
-E
Line
-A
Line
-C
Line
-B
Chargeability012345678910121416182023263035404550607080
0
10
20
30
0
10
20
30
0
10
20
30
0
10
20
30
Line
-E
Line
-A
Line
-C
Line
-B
Metal factor01.11.31.41.61.82.12.32.62.93.33.74.24.75.3678910111214161820
0 500 1000 1500 2000(m)
Depth = 300m
Depth = 400m
0
10
20
30
0
10
20
30
0
10
20
30
0
10
20
30
Line
-E
Line
-A
Line
-C
Line
-B
Resistivity
0
10
20
30
0
10
20
30
0
10
20
30
0
10
20
30
Line
-E
Line
-A
Line
-C
Line
-B
Chargeability
0
10
20
30
0
10
20
30
0
10
20
30
0
10
20
30
Line
-E
Line
-A
Line
-C
Line
-B
Metal factorDepth = 200m
- 65 -
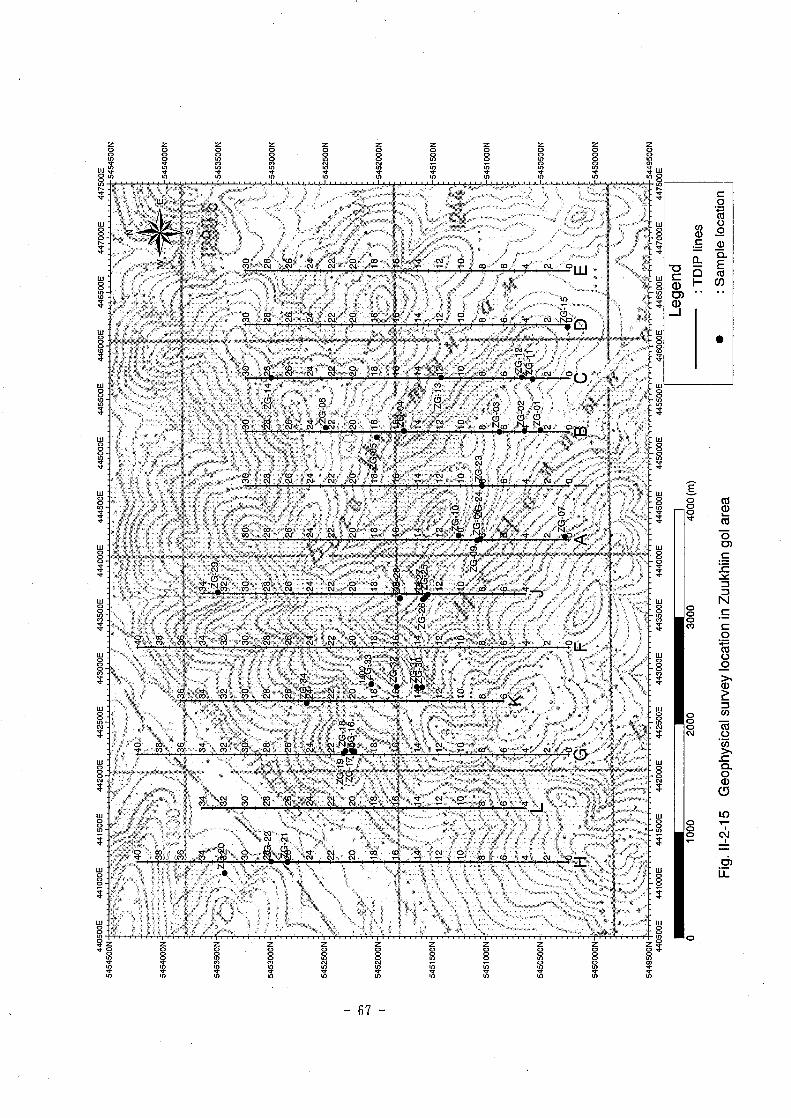
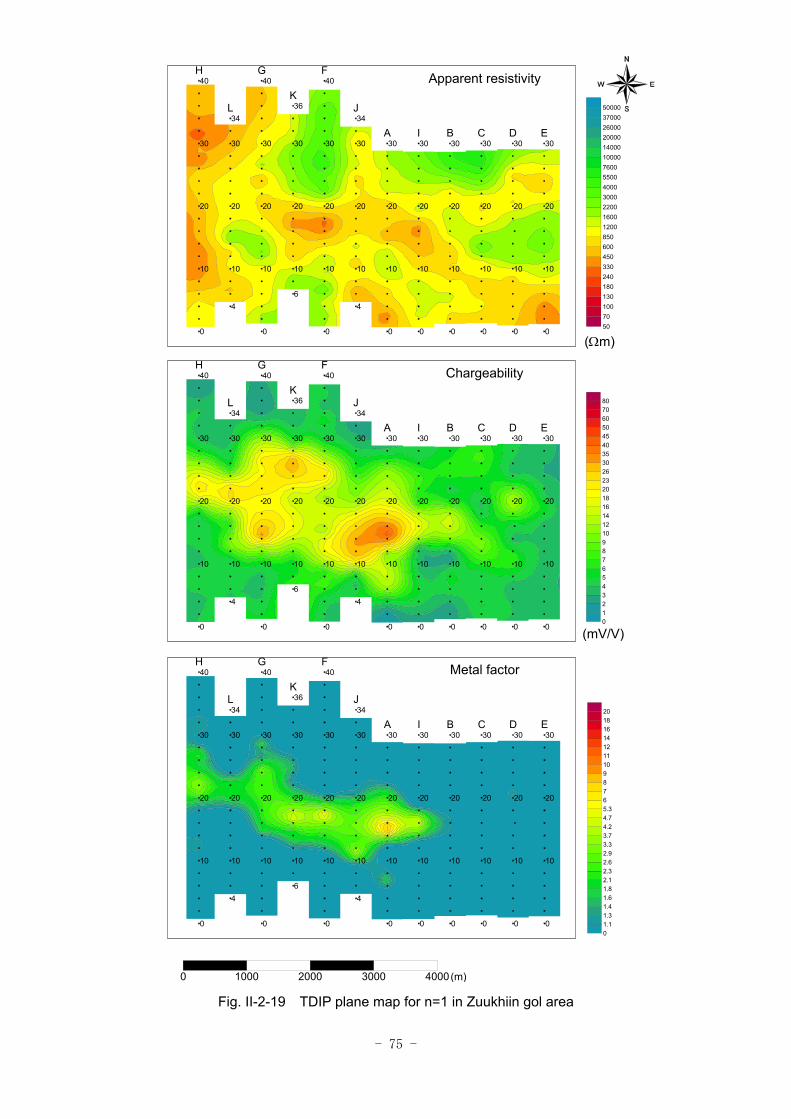
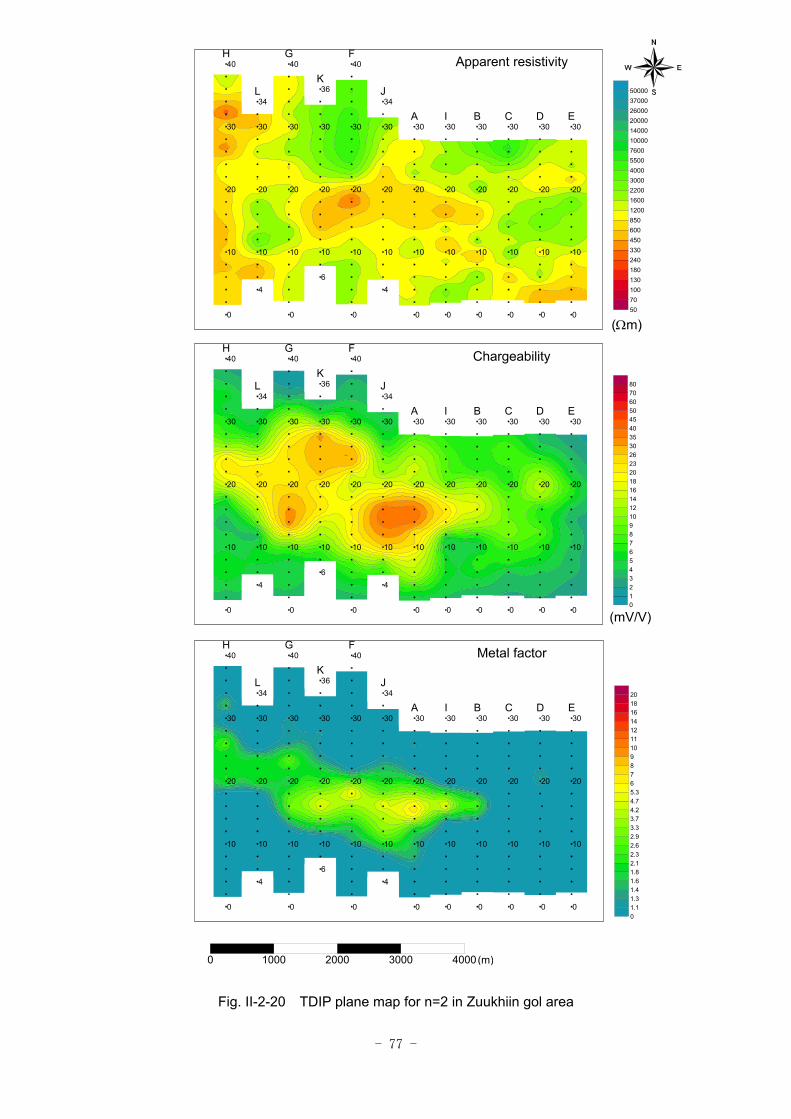
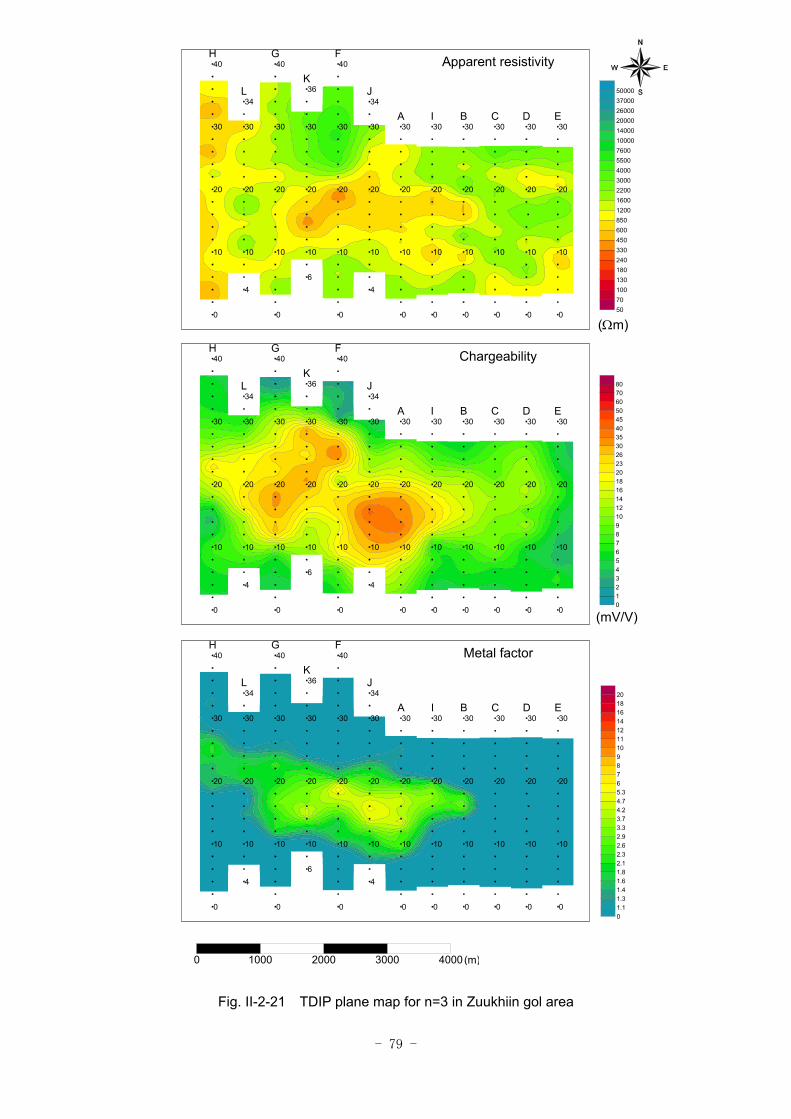
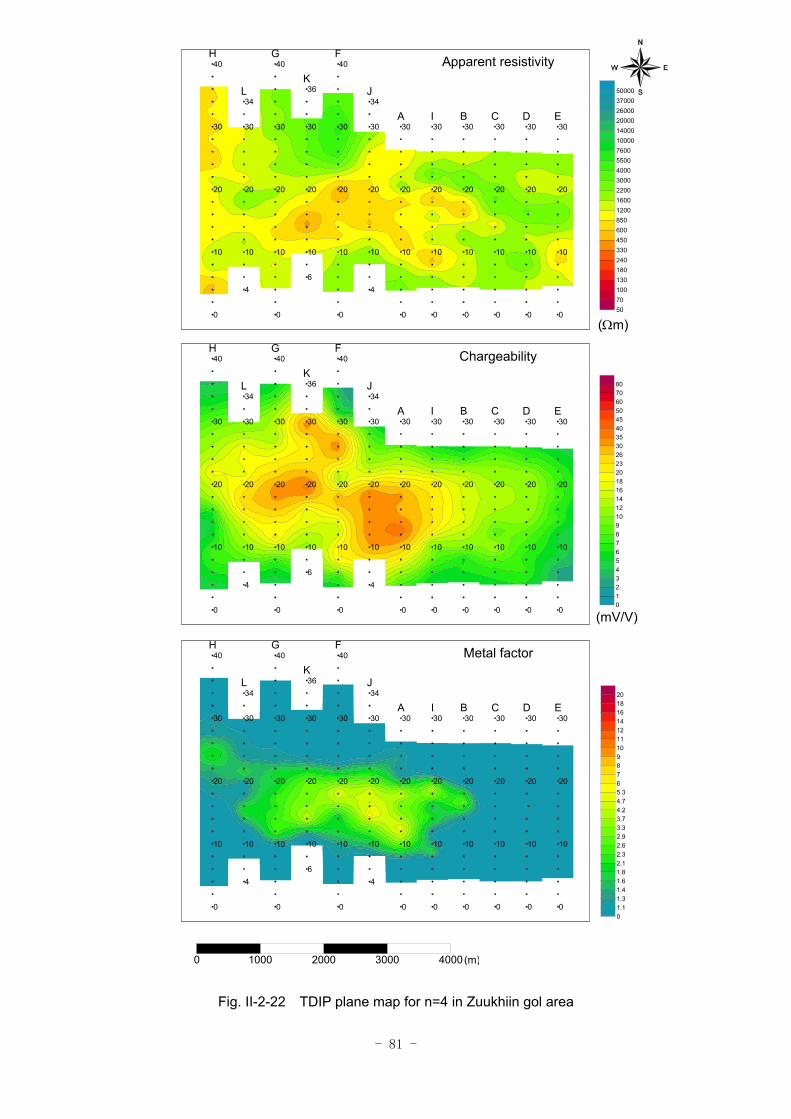
2-5-2 Zuukhiin gol area
(1) Lines location
Fig.II-2-15 shows the location of TDIP lines. 9 lines of 3.0km and 3 lines of 4.0km were set up
along N0°E. Total line length is 39.0km.
(2) Results
Figs.II-2-16 ~ II-2-18 show the pseudo-sections, while Figs.II-2-19 ~ II-2-23 indicate the plane
maps from n=1 to 5.
In this area, the apparent resistivity value ranges between 237 ~ 6581Ωm, and average is
1480Ωm. According to the plane maps for n=1 and 2, low resistivity is distributed at the area
underlain by Quaternary sediments, and high resistivity is distributed in the mountain area. Low
resistivity is distributed exceptionally at the ridge around the stations 16 to 20 on the lines F and K.
This low resistivity zone continues from shallow to deep part.
The chargeability value ranges between 1.5 ~ 46.2mV/V, and average is 13.0mV/V. High
chargeability over 20mV/V is distributed widely from shallow to deep part around the stations 10 to
30 on all lines located in the western half of this area (from line H to I). This anomaly indicates a
large scale mineralization. Within this high chargeability zone, highest value over 40mV/V is
recognized at n=2 and 3 around the stations 14 to 16 on the line J and at n=1 and 2 around the
stations 14 to 16 on the line A. On the east of the line I, chargeability show high value over 10mV/V,
and it is considered that sulfide exists all over the area.
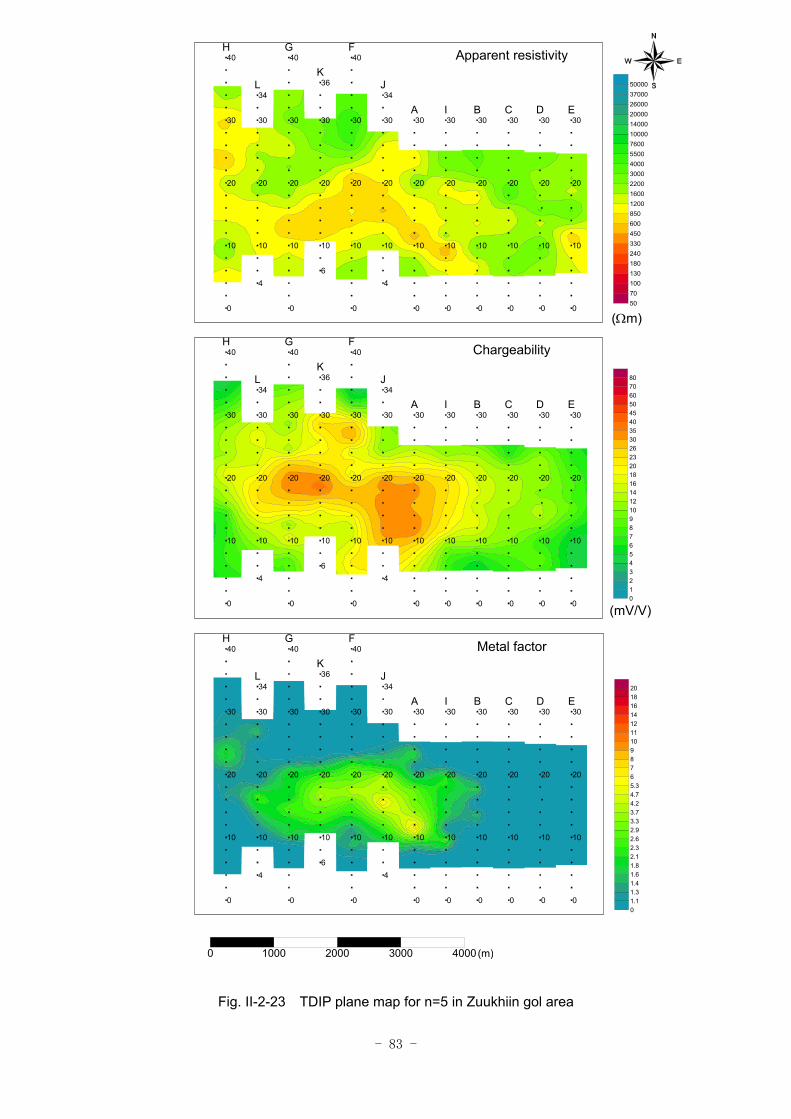
The maximum value of metal factor is 11. High metal factor zone is distributed along the
direction of EW in the western part of the area corresponding to the high chargeability zone.
(3) 2-D analysis
Figs.II-2-24 ~ II.2-32 show the 2-D analysis sections and plane maps.
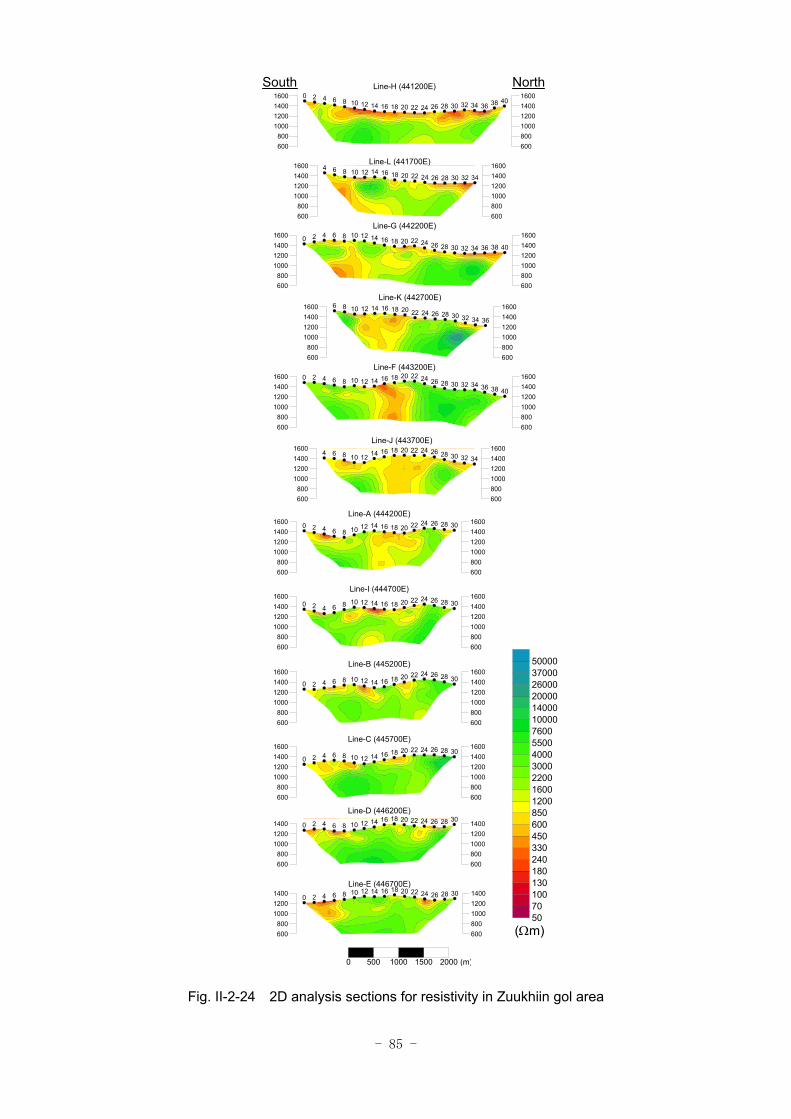
The analyzed resistivity value ranges between 85 ~ 18kΩm, and average is 2032Ωm. According
to the plane maps at the depth of 50m and 100m, low resistivity is distributed at the area underlain
by Quaternary sediments, and high resistivity is distributed in the mountain area. Low resistivity is
distributed exceptionally at the ridge around the station 16 to 20 on the lines F and K. Below the
depth of 150m, low resistivity caused by Quaternary sediments disappear. At the depth from 200m to
400m, low resistivity zone extends from the station 10 on the line L to the station 20 on the line J
along the direction of WSW-ENE.
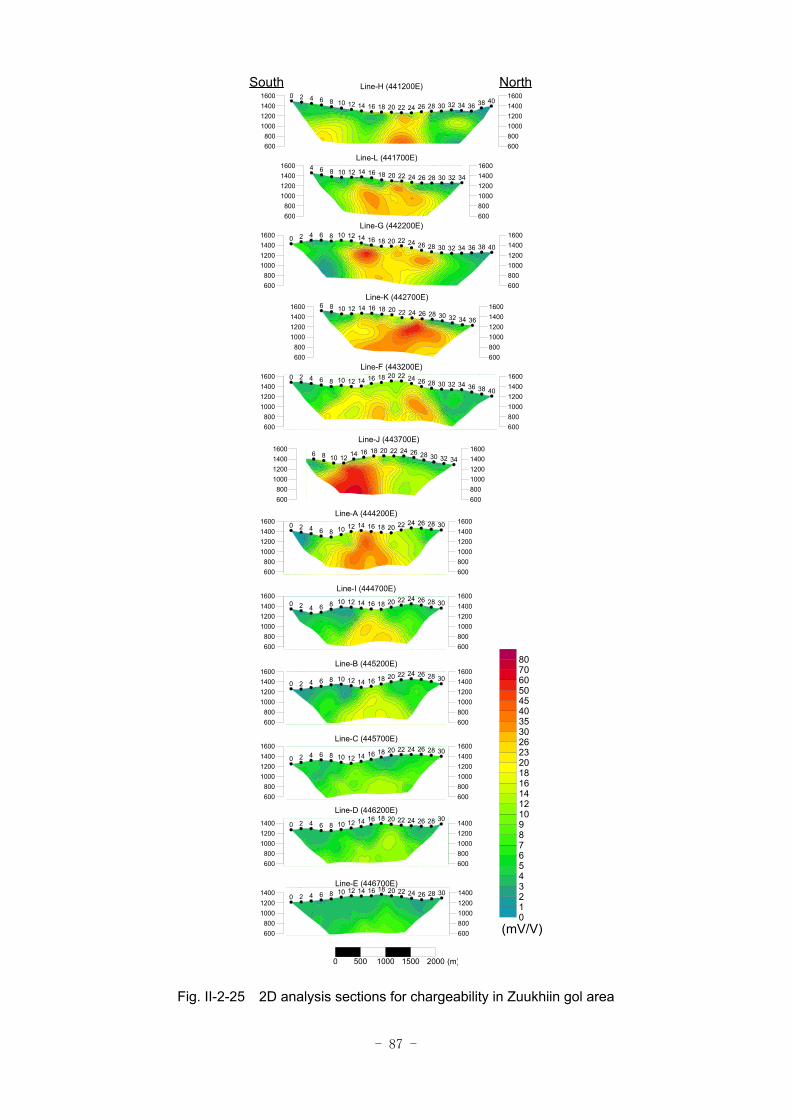
The analyzed chargeability value ranges between 0.4 ~ 70.6mV/V and average is 14.3mV/V.
High chargeability zone is distributed widely in the western part of the area. The area of this high
chargeability zone becomes broader at the deeper part, and high chargeability zone over 20mV/V
- 66 -
ranges 4km in E-W, and 2km in N-S at the depth of 200m. It seems that the high chargeability zone
consists three parts. According to the plane map at the depth of 200m, high chargeability zones over
30mV/V are recognized around the stations 10 to 18 on the lines F to I, the stations 20 to 28 on the
lines G to F and the stations 12 to 18 on the lines L to K. The low resistivity zone above mentioned
is surrounded by these three high chargeability zones.
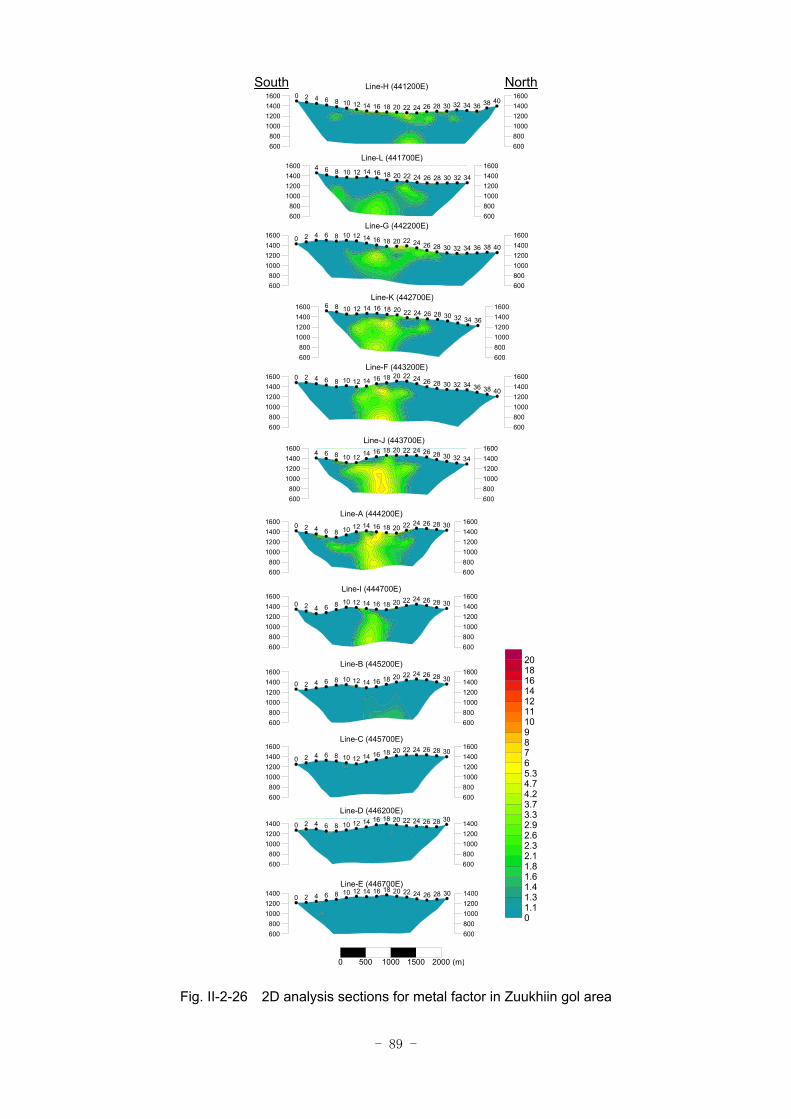
The maximum value of metal factor is 17. High metal factor zone is distributed in the direction
of E-W in the western part of the area corresponding to the high chargeability zone.
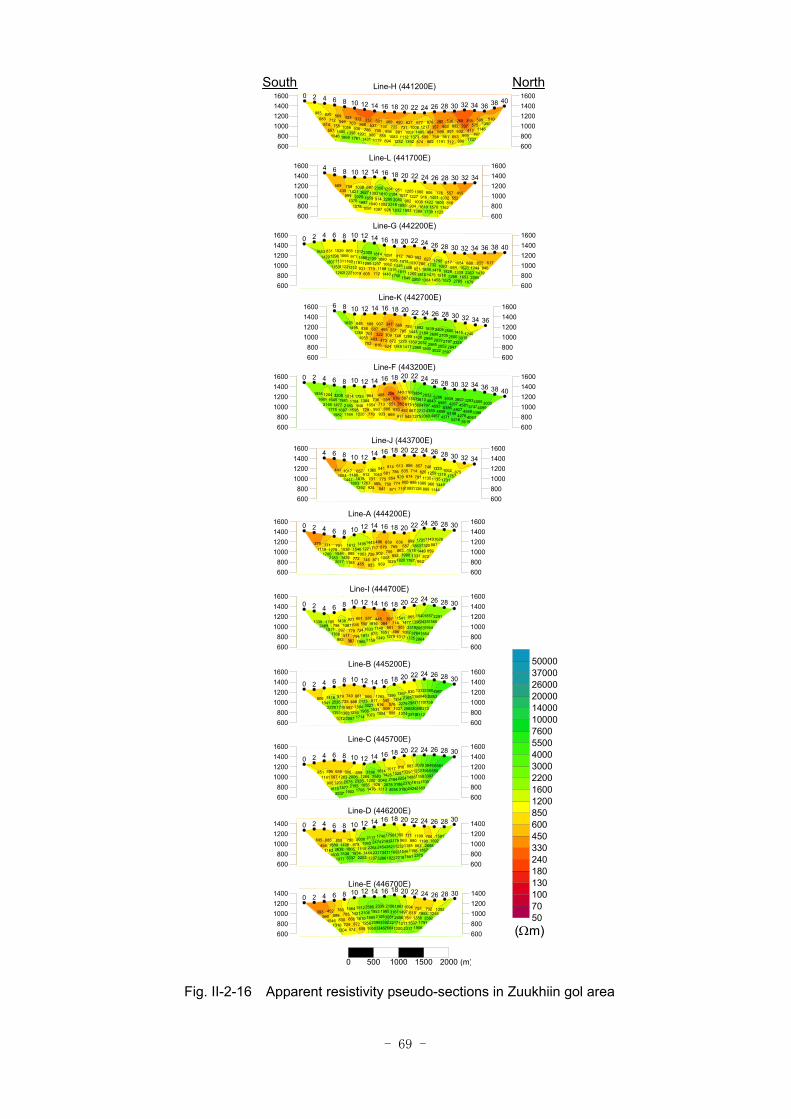
- 69 -
Fig. II-2-16 Apparent resistivity pseudo-sections in Zuukhiin gol area
13927321248
7531853
2582
1094615
13561791
18611497
7511507
1906
21563161
24061211
2317
23391965
30512217
1200
25801953
21053392
2684
15122106
16652099
3246
15641421
16101256
1650
780785
666872
658
452899
830729
974
393560
10461316
1204
0 2 4 6 8 10 12 14 16 18 20 22 24 26 28 30Line-E (446700E)
600800
100012001400
600800100012001400
15917041592
11991190
2668
771890
8831857
1350963
11851198
2575
17562179
12321546
1551
17462183
28211693
2218
21172474
24543471
1922
20081992
22642217
3266
790975
11151444
1287
8581496
18051934
2202
6851889
26383138
3337
695454
11621600
1977
0 2 4 6 8 10 12 14 16 18 20 22 24 26 28 30Line-D (446200E)
600800
100012001400
600800100012001400
658138486550
20292355
3397
8831123
11581700
8101329
14881613
2183
10171529
22542370
2424
16141425
21643188
3180
31862583
20402875
4055
8991264
1200928
1313
9062006
23261855
1476
6581283
20752193
1708
895567
12011877
1903
8511141
9061818
2537
0 2 4 6 8 10 12 14 16 18 20 22 24 26 28 30
Line-C (445700E)
600800
1000120014001600
6008001000120014001600
498723802853
13321463
1759
8301159
11701273
13672165
29813059
3112
13961354
22792965
2919
1265595
5761027
1374
566917
616509
988
8812123
30271531
1554
740588
13941966
1073
979735
5871236
1714
14162535
17191368
2507
8061341
22281393
1072
0 2 4 6 8 10 12 14 16 18 20 22 24 26 28 30
Line-B (445200E)
600800
1000120014001600
6008001000120014001600
225118571560
15402435
1954
9651396
20831554
15411477
23183764
2864
397714
5831082
1725
445384
601496
1017
5571816
11481651
1279
661590
1633975
1349
921645
7241911
1158
14361387
778794
1966
1195798
897511
367
13352489
15171768
983
0 2 4 6 8 10 12 14 16 18 20 22 24 26 28 30
Line-I (444700E)
600800
1000120014001600
6008001000120014001600
16261143887
17251320
859
8891863
1449872
636657
15181331
862
659769
8631990
1767
408579
709652
1820
1443717
9021008
1029
14951221
726871
959
16121546
1253746
853
7911036
888772
455
7711270
15461425
1185
3791119
17002183
2077
0 2 4 6 8 10 12 14 16 18 20 22 24 26 28 30Line-A (444200E)
600800
1000120014001600
6008001000120014001600
87510621757
13231318
1731
7481259
11351445
857820
1135966
1144
886714
7911080
899
613835
674856
1126
814786
929800
1082
841681
654774
719
13651040
775750
871
657912
731555
541
10171186
16181263
924
4411064
14471883
1392
4 6 8 10 12 14 16 18 20 22 24 26 28 30 32 34
Line-J (443700E)
600800
1000120014001600
6008001000120014001600
300240554099
32933747
3398
39024581
45694043
39394267
49274276
3619
52865591
63866145
5216
29324843
45934856
4371
38543613
47974359
4457
11671503
15602212
2060
740597
875867
1275
256276
282482
545
498554
551570
917
984736
713688
669
17331364
1054993
933
10141194
946728
770
32081981
21801598
1220
12041645
14721687
1184
19341661
21461775
1982
0 2 4 6 8 10 12 14 16 18 20 22 24 26 28 30 32 34 36 38 40
Line-F (443200E)
600800
1000120014001600
6008001000120014001600
124014153015
25002500
3325
24042705
27972941
18392698
28292852
2597
18922184
29882965
3022
7931443
14262032
1890
569785
12891380
2068
347551
7481220
1417
907465
709872
1345
588507
322473
624
848838
701403
616
18261495
12801053
702
6 8 10 12 14 16 18 20 22 24 26 28 30 32 34 36
Line-K (442700E)
600800
1000120014001600
6008001000120014001600
517655845
6901244
1439
10541623
22632395
817984
13091653
1679
17581693
18282268
2765
6231732
14781518
1825
902780
18361475
1458
7801030
8211816
1364
8121413
14081260
2505
10911085
13491811
1540
18141080
10621315
1756
23022150
12371188
1440
13121588
1250713
712
868971
1181931
605
10291066
11601312
1019
8311298
11311122
1222
16531429
18071350
1282
0 2 4 6 8 10 12 14 16 18 20 22 24 26 28 30 32 34 36 38 40
Line-G (442200E)
600800
1000120014001600
6008001000120014001600
459557552
7761032
816
9061451
16061162
1060916
14221570
1125
12051227
10061610
1739
9511037
982904
1389
12942104
20831855
1593
23581810
22902218
1932
6971392
9141003
928
10383627
16581040
1097
7591421
20291682
1091
569435
9991370
1078
4 6 8 10 12 14 16 18 20 22 24 26 28 30 32 34
Line-L (441700E)
600800
1000120014001600
6008001000120014001600
5105091350
358575
1146
268237
417767
536892
632999
1737
292503
891653
990
876357
599981
712
6771217
484758
1191
6271008
1480599
862
490731
10071373
574
489722
8911112
1392
501732
9561083
1252
332537
705855
894
372568
786986
1119
423703
9301201
1431
569549
10561396
1761
920712
7551480
1869
983683
514557
1046
0 2 4 6 8 10 12 14 16 18 20 22 24 26 28 30 32 34 36 38 40
Line-H (441200E)
600800
1000120014001600
6008001000120014001600
50701001301802403304506008501200160022003000400055007600100001400020000260003700050000
0 500 1000 1500 2000
(Ωm)
South North
(m)
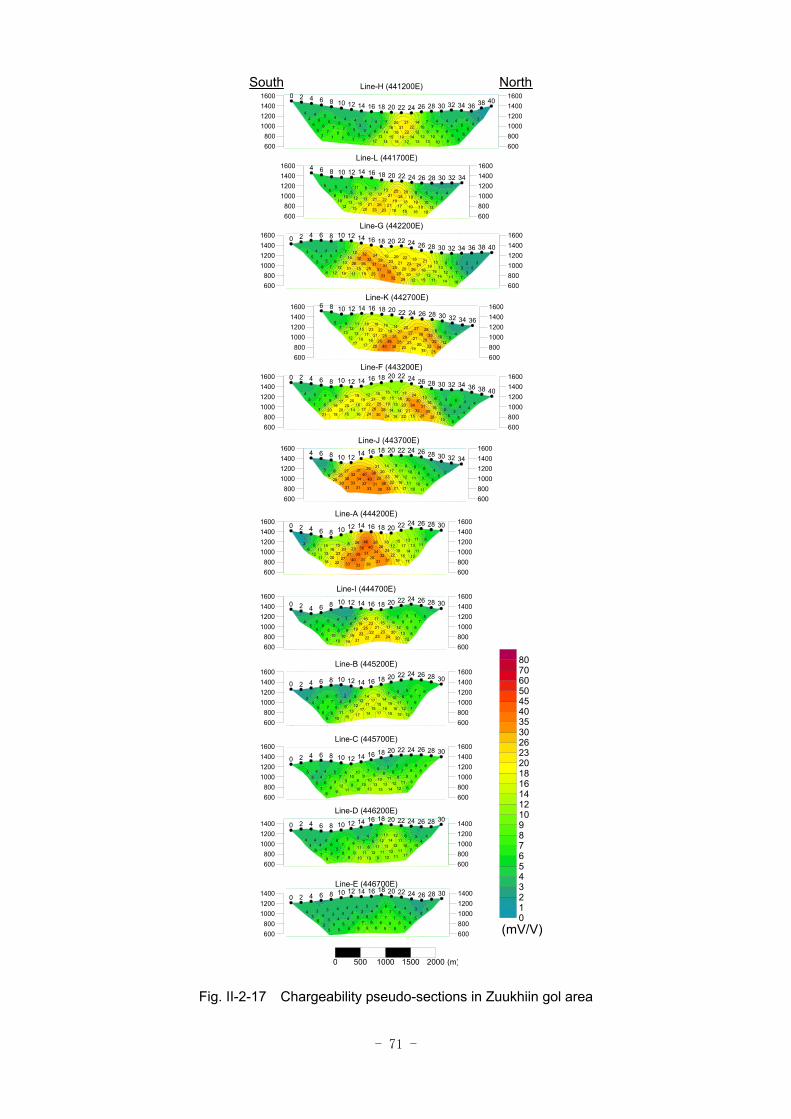
- 71 -
Fig. II-2-17 Chargeability pseudo-sections in Zuukhiin gol area
333
44
5
45
56
67
78
7
46
78
8
34
68
9
43
56
8
44
57
9
44
45
8
33
45
6
34
35
5
43
63
5
0 2 4 6 8 10 12 14 16 18 20 22 24 26 28 30Line-E (446700E)
600800
100012001400
600800100012001400
434
67
10
1211
107
1114
1211
11
612
1312
11
46
1111
12
47
812
9
78
1111
13
67
89
13
46
58
9
44
66
7
44
67
9
0 2 4 6 8 10 12 14 16 18 20 22 24 26 28 30Line-D (446200E)
600800
100012001400
600800100012001400
868
68
8
57
99
36
811
6
58
1112
12
79
1213
14
109
1013
13
810
910
13
57
98
10
47
912
11
44
68
9
53
57
8
0 2 4 6 8 10 12 14 16 18 20 22 24 26 28 30
Line-C (445700E)
600800
1000120014001600
6008001000120014001600
677
56
6
56
77
710
1112
12
1514
1516
15
1417
1516
15
512
1715
17
26
1217
14
54
913
17
67
611
15
46
76
10
24
66
6
0 2 4 6 8 10 12 14 16 18 20 22 24 26 28 30
Line-B (445200E)
600800
1000120014001600
6008001000120014001600
577
88
8
68
98
79
1213
12
1715
1720
20
1623
2123
24
419
2522
23
36
1923
22
44
819
21
55
610
19
56
810
10
45
56
8
0 2 4 6 8 10 12 14 16 18 20 22 24 26 28 30
Line-I (444700E)
600800
1000120014001600
6008001000120014001600
51111
1313
11
1517
1412
1812
1515
17
2826
2322
19
4640
3432
31
2638
3128
31
823
3931
28
1523
3140
33
1516
2327
33
613
1320
22
26
1211
18
0 2 4 6 8 10 12 14 16 18 20 22 24 26 28 30Line-A (444200E)
600800
1000120014001600
6008001000120014001600
345
65
6
68
78
910
1110
11
911
1211
10
1417
1616
17
2120
2322
21
2636
2936
33
3140
4331
30
2732
3432
33
625
3033
31
39
2530
31
4 6 8 10 12 14 16 18 20 22 24 26 28 30 32 34
Line-J (443700E)
600800
1000120014001600
6008001000120014001600
444
64
4
46
35
66
25
6
1316
1615
13
2430
3130
28
1730
3432
28
1116
2021
15
1515
1314
22
1516
1914
15
1221
2528
24
1919
2226
30
1620
1617
24
617
2014
16
88
1920
15
57
820
18
45
77
21
0 2 4 6 8 10 12 14 16 18 20 22 24 26 28 30 32 34 36 38 40
Line-F (443200E)
600800
1000120014001600
6008001000120014001600
455
810
12
2833
3234
2726
2522
25
2027
2120
18
1427
2923
19
1618
3128
22
1822
2538
30
1823
2126
40
1115
1716
25
612
1318
17
57
1312
17
6 8 10 12 14 16 18 20 22 24 26 28 30 32 34 36
Line-K (442700E)
600800
1000120014001600
6008001000120014001600
322
33
3
88
77
1513
1211
10
2119
1614
14
1824
1612
11
2223
2617
15
2021
2020
12
1923
2525
26
2428
3132
32
3232
3131
33
1232
2625
25
714
2818
19
47
1321
11
45
612
19
44
57
12
45
56
8
0 2 4 6 8 10 12 14 16 18 20 22 24 26 28 30 32 34 36 38 40
Line-G (442200E)
600800
1000120014001600
6008001000120014001600
445
56
7
69
1013
2018
1918
18
2524
1819
16
1321
1917
16
717
2221
18
812
2126
23
119
1321
23
43
1215
20
56
1013
15
55
810
12
4 6 8 10 12 14 16 18 20 22 24 26 28 30 32 34
Line-L (441700E)
600800
1000120014001600
6008001000120014001600
244
46
6
44
55
47
66
5
77
89
8
1410
910
10
2122
1212
13
2021
2214
13
716
1619
12
46
1415
18
44
613
14
43
46
12
45
55
7
45
76
7
56
78
7
46
67
7
44
66
7
0 2 4 6 8 10 12 14 16 18 20 22 24 26 28 30 32 34 36 38 40
Line-H (441200E)
600800
1000120014001600
6008001000120014001600
012345678910121416182023263035404550607080
0 500 1000 1500 2000
(mV/V)
South North
(m)
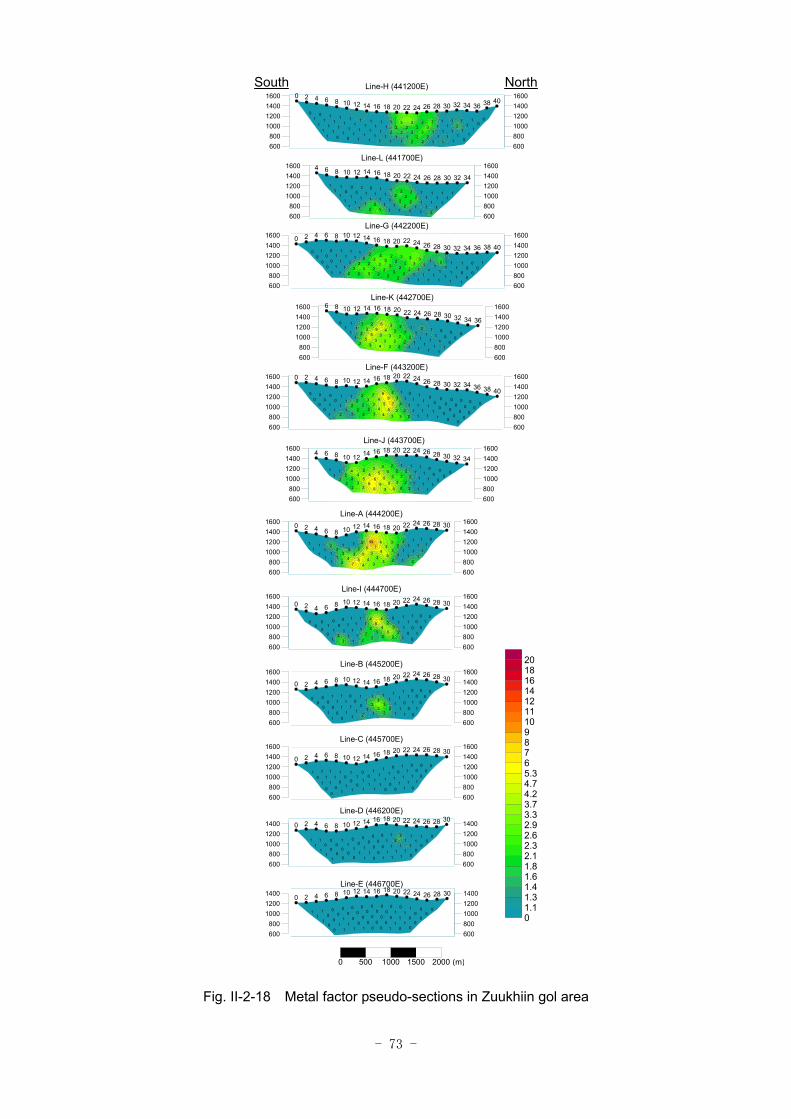
- 73 -
Fig. II-2-18 Metal factor pseudo-sections in Zuukhiin gol area
000
10
0
01
00
01
11
0
00
01
0
00
00
1
00
00
0
00
00
0
00
00
1
00
11
1
10
01
1
11
10
0
0 2 4 6 8 10 12 14 16 18 20 22 24 26 28 30Line-E (446700E)
600800
100012001400
600800100012001400
010
11
0
21
10
12
11
0
01
11
1
00
01
1
00
00
1
00
11
0
11
11
1
00
00
0
10
00
0
11
11
1
0 2 4 6 8 10 12 14 16 18 20 22 24 26 28 30Line-D (446200E)
600800
100012001400
600800100012001400
000
00
0
11
11
00
11
0
11
11
1
11
10
0
00
11
0
11
11
1
10
00
1
11
01
1
11
10
1
10
10
0
0 2 4 6 8 10 12 14 16 18 20 22 24 26 28 30
Line-C (445700E)
600800
1000120014001600
6008001000120014001600
000
00
0
11
11
11
00
0
11
11
1
13
32
1
11
33
2
00
01
1
11
11
2
11
11
1
00
00
0
00
01
1
0 2 4 6 8 10 12 14 16 18 20 22 24 26 28 30
Line-B (445200E)
600800
1000120014001600
6008001000120014001600
001
10
0
11
01
01
10
0
42
32
1
46
45
2
11
21
2
11
12
2
01
11
2
00
11
1
01
12
3
00
00
1
0 2 4 6 8 10 12 14 16 18 20 22 24 26 28 30
Line-I (444700E)
600800
1000120014001600
6008001000120014001600
011
11
1
21
11
32
11
2
43
31
1
117
55
2
25
33
3
12
54
3
12
35
4
22
34
7
11
11
2
11
11
1
0 2 4 6 8 10 12 14 16 18 20 22 24 26 28 30Line-A (444200E)
600800
1000120014001600
6008001000120014001600
000
00
0
11
11
11
11
1
12
21
1
22
22
2
33
23
2
35
55
5
24
64
3
44
56
6
12
23
3
11
22
2
4 6 8 10 12 14 16 18 20 22 24 26 28 30 32 34
Line-J (443700E)
600800
1000120014001600
6008001000120014001600
000
00
0
00
00
00
00
0
00
00
0
11
11
1
01
11
1
11
11
1
23
12
2
66
73
3
24
55
3
23
34
4
12
22
3
11
22
2
00
11
1
00
11
2
00
00
1
0 2 4 6 8 10 12 14 16 18 20 22 24 26 28 30 32 34 36 38 40
Line-F (443200E)
600800
1000120014001600
6008001000120014001600
000
00
0
11
11
21
11
1
11
11
1
22
21
1
32
22
1
54
33
2
25
33
3
23
53
4
11
25
3
01
11
2
6 8 10 12 14 16 18 20 22 24 26 28 30 32 34 36
Line-K (442700E)
600800
1000120014001600
6008001000120014001600
100
10
0
11
00
21
11
1
11
11
1
31
11
1
33
11
1
32
21
1
22
22
1
23
22
2
23
32
2
12
22
2
11
23
3
11
12
2
01
11
2
10
01
1
00
00
1
0 2 4 6 8 10 12 14 16 18 20 22 24 26 28 30 32 34 36 38 40
Line-G (442200E)
600800
1000120014001600
6008001000120014001600
111
11
1
11
11
22
11
2
22
21
1
12
22
1
11
11
1
01
11
1
21
12
3
00
11
2
10
11
1
11
11
1
4 6 8 10 12 14 16 18 20 22 24 26 28 30 32 34
Line-L (441700E)
600800
1000120014001600
6008001000120014001600
010
11
1
12
11
11
11
0
31
11
1
23
11
1
32
32
1
32
22
2
12
21
2
11
21
1
11
11
1
11
11
1
11
11
1
11
11
1
11
11
0
01
11
0
01
11
1
0 2 4 6 8 10 12 14 16 18 20 22 24 26 28 30 32 34 36 38 40
Line-H (441200E)
600800
1000120014001600
6008001000120014001600
01.11.31.41.61.82.12.32.62.93.33.74.24.75.3678910111214161820
0 500 1000 1500 2000
South North
(m)
- 75 -
Fig. II-2-19 TDIP plane map for n=1 in Zuukhiin gol area
0
10
20
30
40
4
10
20
30
34
0
10
20
30
40
6
10
20
30
36
0
10
20
30
40
4
10
20
30
34
0
10
20
30
0
10
20
30
0
10
20
30
0
10
20
30
0
10
20
30
0
10
20
30
H
L
G
K
F
J
A I B C D E
Apparent resistivity
50701001301802403304506008501200160022003000400055007600100001400020000260003700050000
0
10
20
30
40
4
10
20
30
34
0
10
20
30
40
6
10
20
30
36
0
10
20
30
40
4
10
20
30
34
0
10
20
30
0
10
20
30
0
10
20
30
0
10
20
30
0
10
20
30
0
10
20
30
H
L
G
K
F
J
A I B C D E
Chargeability
012345678910121416182023263035404550607080
0
10
20
30
40
4
10
20
30
34
0
10
20
30
40
6
10
20
30
36
0
10
20
30
40
4
10
20
30
34
0
10
20
30
0
10
20
30
0
10
20
30
0
10
20
30
0
10
20
30
0
10
20
30
H
L
G
K
F
J
A I B C D E
Metal factor
01.11.31.41.61.82.12.32.62.93.33.74.24.75.3678910111214161820
0 1000 2000 3000 4000
(Ωm)
(mV/V)
(m)
- 77 -
Fig. II-2-20 TDIP plane map for n=2 in Zuukhiin gol area
0
10
20
30
40
4
10
20
30
34
0
10
20
30
40
6
10
20
30
36
0
10
20
30
40
4
10
20
30
34
0
10
20
30
0
10
20
30
0
10
20
30
0
10
20
30
0
10
20
30
0
10
20
30
H
L
G
K
F
J
A I B C D E
Metal factor
01.11.31.41.61.82.12.32.62.93.33.74.24.75.3678910111214161820
0
10
20
30
40
4
10
20
30
34
0
10
20
30
40
6
10
20
30
36
0
10
20
30
40
4
10
20
30
34
0
10
20
30
0
10
20
30
0
10
20
30
0
10
20
30
0
10
20
30
0
10
20
30
H
L
G
K
F
J
A I B C D E
Chargeability
012345678910121416182023263035404550607080
0
10
20
30
40
4
10
20
30
34
0
10
20
30
40
6
10
20
30
36
0
10
20
30
40
4
10
20
30
34
0
10
20
30
0
10
20
30
0
10
20
30
0
10
20
30
0
10
20
30
0
10
20
30
H
L
G
K
F
J
A I B C D E
Apparent resistivity
50701001301802403304506008501200160022003000400055007600100001400020000260003700050000
0 1000 2000 3000 4000
(Ωm)
(mV/V)
(m)
- 79 -
Fig. II-2-21 TDIP plane map for n=3 in Zuukhiin gol area
0
10
20
30
40
4
10
20
30
34
0
10
20
30
40
6
10
20
30
36
0
10
20
30
40
4
10
20
30
34
0
10
20
30
0
10
20
30
0
10
20
30
0
10
20
30
0
10
20
30
0
10
20
30
H
L
G
K
F
J
A I B C D E
Metal factor
01.11.31.41.61.82.12.32.62.93.33.74.24.75.3678910111214161820
0
10
20
30
40
4
10
20
30
34
0
10
20
30
40
6
10
20
30
36
0
10
20
30
40
4
10
20
30
34
0
10
20
30
0
10
20
30
0
10
20
30
0
10
20
30
0
10
20
30
0
10
20
30
H
L
G
K
F
J
A I B C D E
Chargeability
012345678910121416182023263035404550607080
0
10
20
30
40
4
10
20
30
34
0
10
20
30
40
6
10
20
30
36
0
10
20
30
40
4
10
20
30
34
0
10
20
30
0
10
20
30
0
10
20
30
0
10
20
30
0
10
20
30
0
10
20
30
H
L
G
K
F
J
A I B C D E
Apparent resistivity
50701001301802403304506008501200160022003000400055007600100001400020000260003700050000
0 1000 2000 3000 4000
(Ωm)
(mV/V)
(m)
- 81 -
Fig. II-2-22 TDIP plane map for n=4 in Zuukhiin gol area
0
10
20
30
40
4
10
20
30
34
0
10
20
30
40
6
10
20
30
36
0
10
20
30
40
4
10
20
30
34
0
10
20
30
0
10
20
30
0
10
20
30
0
10
20
30
0
10
20
30
0
10
20
30
H
L
G
K
F
J
A I B C D E
Metal factor
01.11.31.41.61.82.12.32.62.93.33.74.24.75.3678910111214161820
0
10
20
30
40
4
10
20
30
34
0
10
20
30
40
6
10
20
30
36
0
10
20
30
40
4
10
20
30
34
0
10
20
30
0
10
20
30
0
10
20
30
0
10
20
30
0
10
20
30
0
10
20
30
H
L
G
K
F
J
A I B C D E
Chargeability
012345678910121416182023263035404550607080
0
10
20
30
40
4
10
20
30
34
0
10
20
30
40
6
10
20
30
36
0
10
20
30
40
4
10
20
30
34
0
10
20
30
0
10
20
30
0
10
20
30
0
10
20
30
0
10
20
30
0
10
20
30
H
L
G
K
F
J
A I B C D E
Apparent resistivity
50701001301802403304506008501200160022003000400055007600100001400020000260003700050000
0 1000 2000 3000 4000
(Ωm)
(mV/V)
(m)
- 83 -
Fig. II-2-23 TDIP plane map for n=5 in Zuukhiin gol area
0
10
20
30
40
4
10
20
30
34
0
10
20
30
40
6
10
20
30
36
0
10
20
30
40
4
10
20
30
34
0
10
20
30
0
10
20
30
0
10
20
30
0
10
20
30
0
10
20
30
0
10
20
30
H
L
G
K
F
J
A I B C D E
Metal factor
01.11.31.41.61.82.12.32.62.93.33.74.24.75.3678910111214161820
0
10
20
30
40
4
10
20
30
34
0
10
20
30
40
6
10
20
30
36
0
10
20
30
40
4
10
20
30
34
0
10
20
30
0
10
20
30
0
10
20
30
0
10
20
30
0
10
20
30
0
10
20
30
H
L
G
K
F
J
A I B C D E
Chargeability
012345678910121416182023263035404550607080
0
10
20
30
40
4
10
20
30
34
0
10
20
30
40
6
10
20
30
36
0
10
20
30
40
4
10
20
30
34
0
10
20
30
0
10
20
30
0
10
20
30
0
10
20
30
0
10
20
30
0
10
20
30
H
L
G
K
F
J
A I B C D E
Apparent resistivity
50701001301802403304506008501200160022003000400055007600100001400020000260003700050000
0 1000 2000 3000 4000
(Ωm)
(mV/V)
(m)
- 85 -
Fig. II-2-24 2D analysis sections for resistivity in Zuukhiin gol area
0 2 4 6 8 10 12 14 16 18 20 22 24 26 28 30Line-E (446700E)
600800
100012001400
600800100012001400
0 2 4 6 8 10 12 14 16 18 20 22 24 26 28 30Line-D (446200E)
600800
100012001400
600800100012001400
0 2 4 6 8 10 12 14 16 18 20 22 24 26 28 30
Line-C (445700E)
600800
1000120014001600
6008001000120014001600
0 2 4 6 8 10 12 14 16 18 20 22 24 26 28 30
Line-B (445200E)
600800
1000120014001600
6008001000120014001600
0 2 4 6 8 10 12 14 16 18 20 22 24 26 28 30
Line-I (444700E)
600800
1000120014001600
6008001000120014001600
0 2 4 6 8 10 12 14 16 18 20 22 24 26 28 30Line-A (444200E)
600800
1000120014001600
6008001000120014001600
4 6 8 10 12 14 16 18 20 22 24 26 28 30 32 34
Line-J (443700E)
600800
1000120014001600
6008001000120014001600
0 2 4 6 8 10 12 14 16 18 20 22 24 26 28 30 32 34 36 38 40
Line-F (443200E)
600800
1000120014001600
6008001000120014001600
6 8 10 12 14 16 18 20 22 24 26 28 30 32 34 36
Line-K (442700E)
600800
1000120014001600
6008001000120014001600
0 2 4 6 8 10 12 14 16 18 20 22 24 26 28 30 32 34 36 38 40
Line-G (442200E)
600800
1000120014001600
6008001000120014001600
4 6 8 10 12 14 16 18 20 22 24 26 28 30 32 34
Line-L (441700E)
600800
1000120014001600
6008001000120014001600
0 2 4 6 8 10 12 14 16 18 20 22 24 26 28 30 32 34 36 38 40
Line-H (441200E)
600800
1000120014001600
6008001000120014001600
50701001301802403304506008501200160022003000400055007600100001400020000260003700050000
0 500 1000 1500 2000
(Ωm)
South North
(m)
- 87 -
Fig. II-2-25 2D analysis sections for chargeability in Zuukhiin gol area
0 2 4 6 8 10 12 14 16 18 20 22 24 26 28 30Line-E (446700E)
600800
100012001400
600800100012001400
0 2 4 6 8 10 12 14 16 18 20 22 24 26 28 30Line-D (446200E)
600800
100012001400
600800100012001400
0 2 4 6 8 10 12 14 16 18 20 22 24 26 28 30
Line-C (445700E)
600800
1000120014001600
6008001000120014001600
0 2 4 6 8 10 12 14 16 18 20 22 24 26 28 30
Line-B (445200E)
600800
1000120014001600
6008001000120014001600
0 2 4 6 8 10 12 14 16 18 20 22 24 26 28 30
Line-I (444700E)
600800
1000120014001600
6008001000120014001600
0 2 4 6 8 10 12 14 16 18 20 22 24 26 28 30Line-A (444200E)
600800
1000120014001600
6008001000120014001600
6 8 10 12 14 16 18 20 22 24 26 28 30 32 34
Line-J (443700E)
600800
1000120014001600
6008001000120014001600
0 2 4 6 8 10 12 14 16 18 20 22 24 26 28 30 32 34 36 38 40
Line-F (443200E)
600800
1000120014001600
6008001000120014001600
6 8 10 12 14 16 18 20 22 24 26 28 30 32 34 36
Line-K (442700E)
600800
1000120014001600
6008001000120014001600
0 2 4 6 8 10 12 14 16 18 20 22 24 26 28 30 32 34 36 38 40
Line-G (442200E)
600800
1000120014001600
6008001000120014001600
4 6 8 10 12 14 16 18 20 22 24 26 28 30 32 34
Line-L (441700E)
600800
1000120014001600
6008001000120014001600
0 2 4 6 8 10 12 14 16 18 20 22 24 26 28 30 32 34 36 38 40
Line-H (441200E)
600800
1000120014001600
6008001000120014001600
012345678910121416182023263035404550607080
0 500 1000 1500 2000
(mV/V)
South North
(m)
- 89 -
Fig. II-2-26 2D analysis sections for metal factor in Zuukhiin gol area
0 2 4 6 8 10 12 14 16 18 20 22 24 26 28 30Line-E (446700E)
600800
100012001400
600800100012001400
0 2 4 6 8 10 12 14 16 18 20 22 24 26 28 30Line-D (446200E)
600800
100012001400
600800100012001400
0 2 4 6 8 10 12 14 16 18 20 22 24 26 28 30
Line-C (445700E)
600800
1000120014001600
6008001000120014001600
0 2 4 6 8 10 12 14 16 18 20 22 24 26 28 30
Line-B (445200E)
600800
1000120014001600
6008001000120014001600
0 2 4 6 8 10 12 14 16 18 20 22 24 26 28 30
Line-I (444700E)
600800
1000120014001600
6008001000120014001600
0 2 4 6 8 10 12 14 16 18 20 22 24 26 28 30Line-A (444200E)
600800
1000120014001600
6008001000120014001600
4 6 8 10 12 14 16 18 20 22 24 26 28 30 32 34
Line-J (443700E)
600800
1000120014001600
6008001000120014001600
0 2 4 6 8 10 12 14 16 18 20 22 24 26 28 30 32 34 36 38 40
Line-F (443200E)
600800
1000120014001600
6008001000120014001600
6 8 10 12 14 16 18 20 22 24 26 28 30 32 34 36
Line-K (442700E)
600800
1000120014001600
6008001000120014001600
0 2 4 6 8 10 12 14 16 18 20 22 24 26 28 30 32 34 36 38 40
Line-G (442200E)
600800
1000120014001600
6008001000120014001600
4 6 8 10 12 14 16 18 20 22 24 26 28 30 32 34
Line-L (441700E)
600800
1000120014001600
6008001000120014001600
0 2 4 6 8 10 12 14 16 18 20 22 24 26 28 30 32 34 36 38 40
Line-H (441200E)
600800
1000120014001600
6008001000120014001600
01.11.31.41.61.82.12.32.62.93.33.74.24.75.3678910111214161820
0 500 1000 1500 2000
South North
(m)
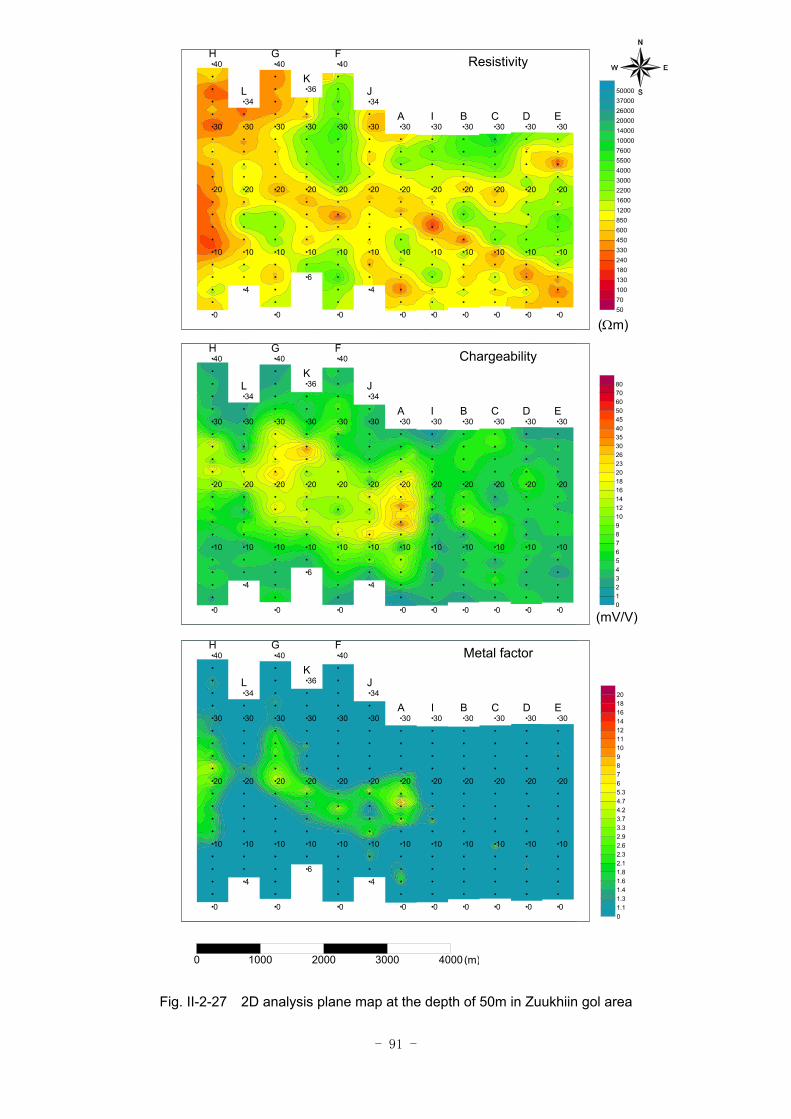
- 91 -
Fig. II-2-27 2D analysis plane map at the depth of 50m in Zuukhiin gol area
0
10
20
30
40
4
10
20
30
34
0
10
20
30
40
6
10
20
30
36
0
10
20
30
40
4
10
20
30
34
0
10
20
30
0
10
20
30
0
10
20
30
0
10
20
30
0
10
20
30
0
10
20
30
H
L
G
K
F
J
A I B C D E
Metal factor
01.11.31.41.61.82.12.32.62.93.33.74.24.75.3678910111214161820
0
10
20
30
40
4
10
20
30
34
0
10
20
30
40
6
10
20
30
36
0
10
20
30
40
4
10
20
30
34
0
10
20
30
0
10
20
30
0
10
20
30
0
10
20
30
0
10
20
30
0
10
20
30
H
L
G
K
F
J
A I B C D E
Chargeability
012345678910121416182023263035404550607080
0
10
20
30
40
4
10
20
30
34
0
10
20
30
40
6
10
20
30
36
0
10
20
30
40
4
10
20
30
34
0
10
20
30
0
10
20
30
0
10
20
30
0
10
20
30
0
10
20
30
0
10
20
30
H
L
G
K
F
J
A I B C D E
Resistivity
50701001301802403304506008501200160022003000400055007600100001400020000260003700050000
0 1000 2000 3000 4000
(Ωm)
(mV/V)
(m)
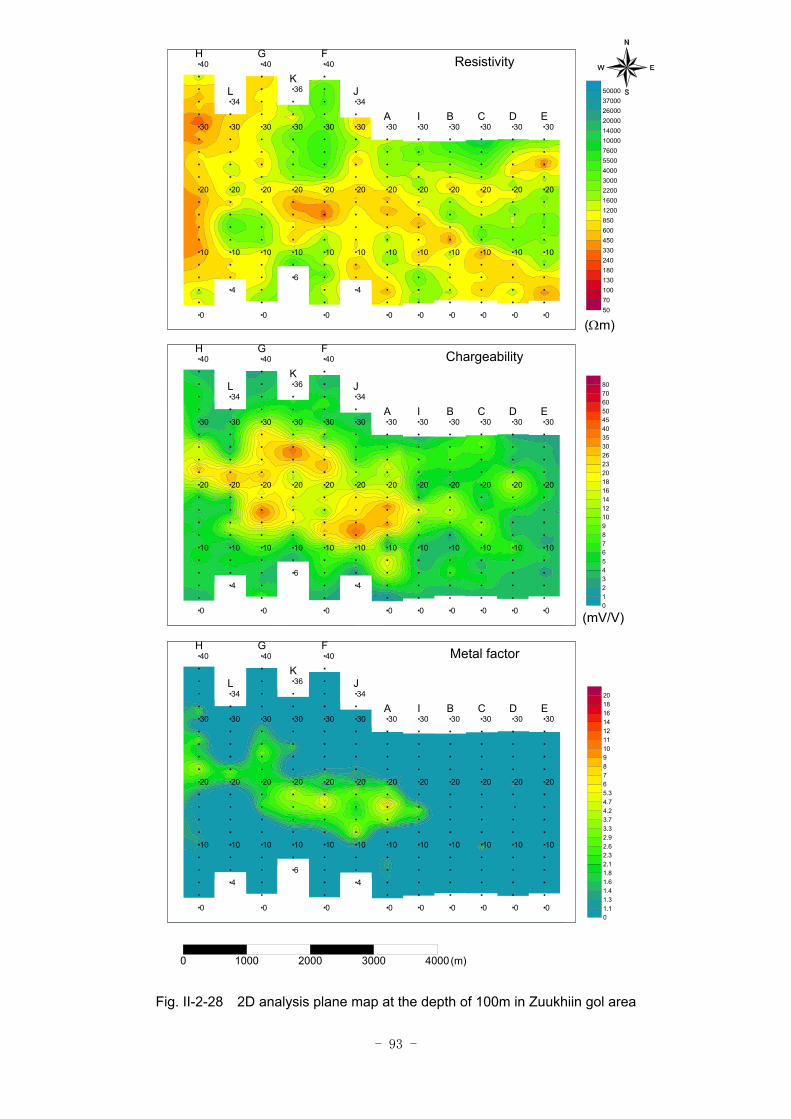
- 93 -
Fig. II-2-28 2D analysis plane map at the depth of 100m in Zuukhiin gol area
0
10
20
30
40
4
10
20
30
34
0
10
20
30
40
6
10
20
30
36
0
10
20
30
40
4
10
20
30
34
0
10
20
30
0
10
20
30
0
10
20
30
0
10
20
30
0
10
20
30
0
10
20
30
H
L
G
K
F
J
A I B C D E
Metal factor
01.11.31.41.61.82.12.32.62.93.33.74.24.75.3678910111214161820
0
10
20
30
40
4
10
20
30
34
0
10
20
30
40
6
10
20
30
36
0
10
20
30
40
4
10
20
30
34
0
10
20
30
0
10
20
30
0
10
20
30
0
10
20
30
0
10
20
30
0
10
20
30
H
L
G
K
F
J
A I B C D E
Chargeability
012345678910121416182023263035404550607080
0
10
20
30
40
4
10
20
30
34
0
10
20
30
40
6
10
20
30
36
0
10
20
30
40
4
10
20
30
34
0
10
20
30
0
10
20
30
0
10
20
30
0
10
20
30
0
10
20
30
0
10
20
30
H
L
G
K
F
J
A I B C D E
Resistivity
50701001301802403304506008501200160022003000400055007600100001400020000260003700050000
0 1000 2000 3000 4000
(Ωm)
(mV/V)
(m)
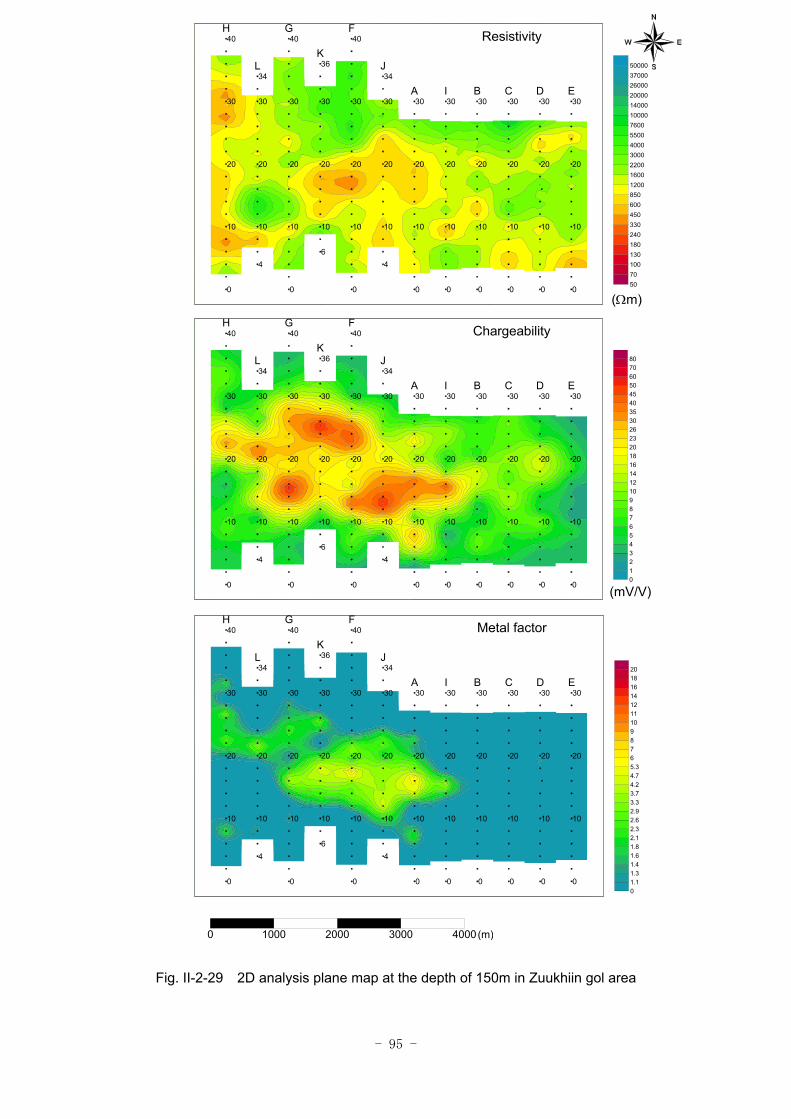
- 95 -
Fig. II-2-29 2D analysis plane map at the depth of 150m in Zuukhiin gol area
0
10
20
30
40
4
10
20
30
34
0
10
20
30
40
6
10
20
30
36
0
10
20
30
40
4
10
20
30
34
0
10
20
30
0
10
20
30
0
10
20
30
0
10
20
30
0
10
20
30
0
10
20
30
H
L
G
K
F
J
A I B C D E
Metal factor
01.11.31.41.61.82.12.32.62.93.33.74.24.75.3678910111214161820
0
10
20
30
40
4
10
20
30
34
0
10
20
30
40
6
10
20
30
36
0
10
20
30
40
4
10
20
30
34
0
10
20
30
0
10
20
30
0
10
20
30
0
10
20
30
0
10
20
30
0
10
20
30
H
L
G
K
F
J
A I B C D E
Chargeability
012345678910121416182023263035404550607080
0
10
20
30
40
4
10
20
30
34
0
10
20
30
40
6
10
20
30
36
0
10
20
30
40
4
10
20
30
34
0
10
20
30
0
10
20
30
0
10
20
30
0
10
20
30
0
10
20
30
0
10
20
30
H
L
G
K
F
J
A I B C D E
Resistivity
50701001301802403304506008501200160022003000400055007600100001400020000260003700050000
0 1000 2000 3000 4000
(Ωm)
(mV/V)
(m)
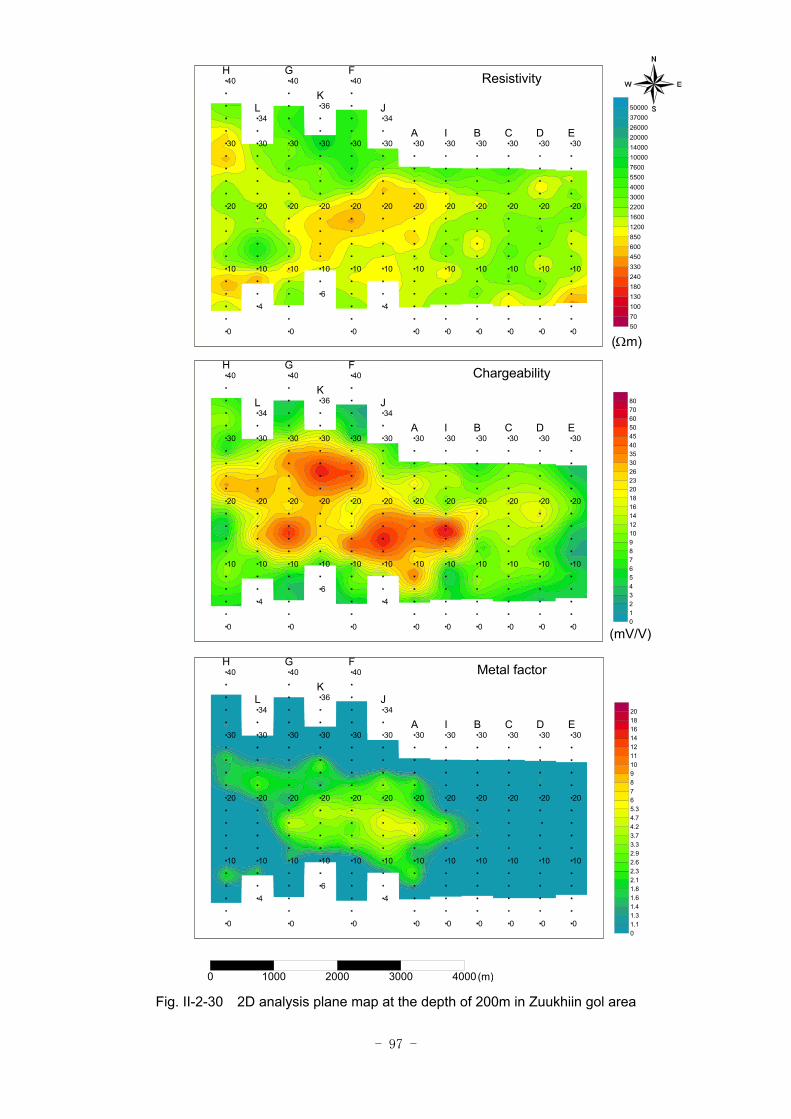
- 97 -
Fig. II-2-30 2D analysis plane map at the depth of 200m in Zuukhiin gol area
0
10
20
30
40
4
10
20
30
34
0
10
20
30
40
6
10
20
30
36
0
10
20
30
40
4
10
20
30
34
0
10
20
30
0
10
20
30
0
10
20
30
0
10
20
30
0
10
20
30
0
10
20
30
H
L
G
K
F
J
A I B C D E
Metal factor
01.11.31.41.61.82.12.32.62.93.33.74.24.75.3678910111214161820
0
10
20
30
40
4
10
20
30
34
0
10
20
30
40
6
10
20
30
36
0
10
20
30
40
4
10
20
30
34
0
10
20
30
0
10
20
30
0
10
20
30
0
10
20
30
0
10
20
30
0
10
20
30
H
L
G
K
F
J
A I B C D E
Chargeability
012345678910121416182023263035404550607080
0
10
20
30
40
4
10
20
30
34
0
10
20
30
40
6
10
20
30
36
0
10
20
30
40
4
10
20
30
34
0
10
20
30
0
10
20
30
0
10
20
30
0
10
20
30
0
10
20
30
0
10
20
30
H
L
G
K
F
J
A I B C D E
Resistivity
50701001301802403304506008501200160022003000400055007600100001400020000260003700050000
0 1000 2000 3000 4000
(Ωm)
(mV/V)
(m)
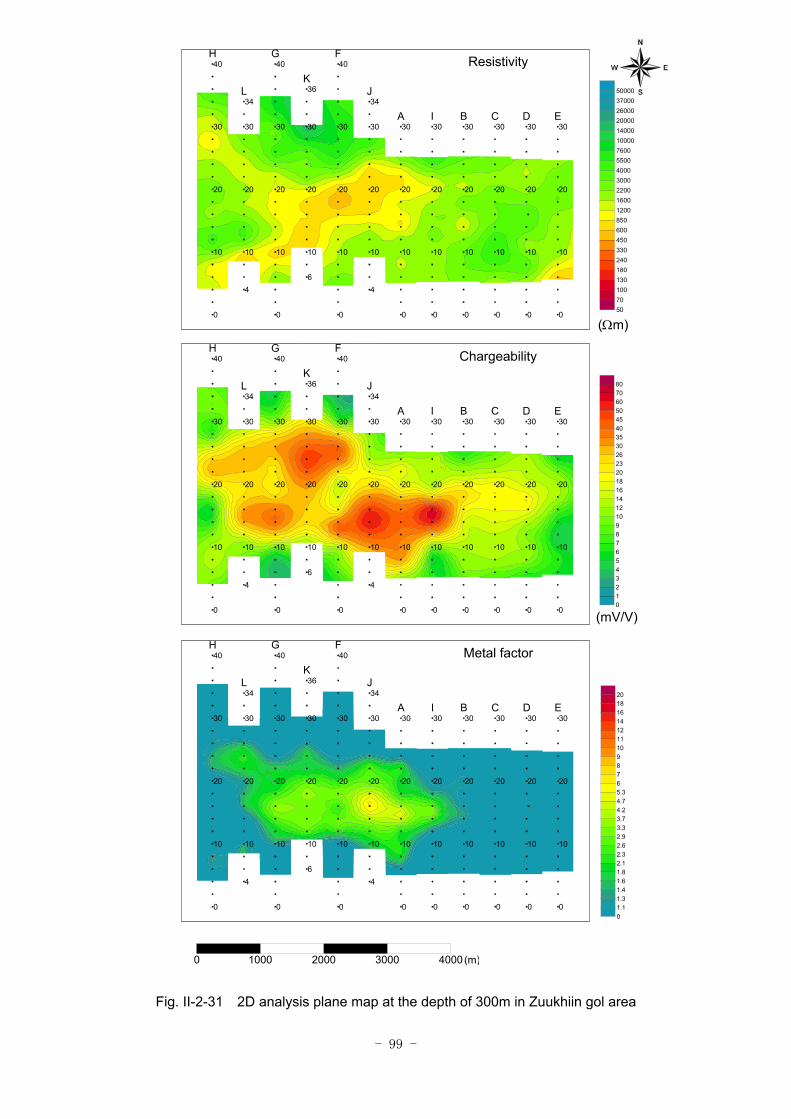
- 99 -
Fig. II-2-31 2D analysis plane map at the depth of 300m in Zuukhiin gol area
0
10
20
30
40
4
10
20
30
34
0
10
20
30
40
6
10
20
30
36
0
10
20
30
40
4
10
20
30
34
0
10
20
30
0
10
20
30
0
10
20
30
0
10
20
30
0
10
20
30
0
10
20
30
H
L
G
K
F
J
A I B C D E
Metal factor
01.11.31.41.61.82.12.32.62.93.33.74.24.75.3678910111214161820
0
10
20
30
40
4
10
20
30
34
0
10
20
30
40
6
10
20
30
36
0
10
20
30
40
4
10
20
30
34
0
10
20
30
0
10
20
30
0
10
20
30
0
10
20
30
0
10
20
30
0
10
20
30
H
L
G
K
F
J
A I B C D E
Chargeability
012345678910121416182023263035404550607080
0
10
20
30
40
4
10
20
30
34
0
10
20
30
40
6
10
20
30
36
0
10
20
30
40
4
10
20
30
34
0
10
20
30
0
10
20
30
0
10
20
30
0
10
20
30
0
10
20
30
0
10
20
30
H
L
G
K
F
J
A I B C D E
Resistivity
50701001301802403304506008501200160022003000400055007600100001400020000260003700050000
0 1000 2000 3000 4000
(Ωm)
(mV/V)
(m)
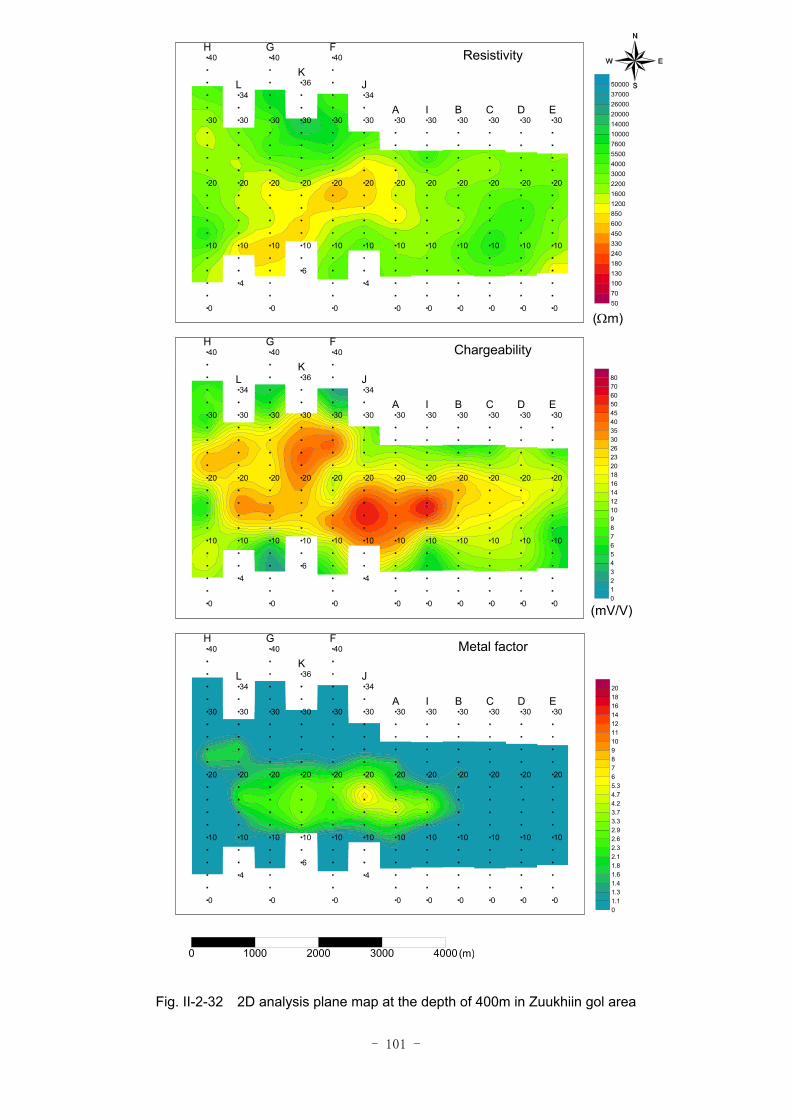
- 101 -
Fig. II-2-32 2D analysis plane map at the depth of 400m in Zuukhiin gol area
0
10
20
30
40
4
10
20
30
34
0
10
20
30
40
6
10
20
30
36
0
10
20
30
40
4
10
20
30
34
0
10
20
30
0
10
20
30
0
10
20
30
0
10
20
30
0
10
20
30
0
10
20
30
H
L
G
K
F
J
A I B C D E
Metal factor
01.11.31.41.61.82.12.32.62.93.33.74.24.75.3678910111214161820
0
10
20
30
40
4
10
20
30
34
0
10
20
30
40
6
10
20
30
36
0
10
20
30
40
4
10
20
30
34
0
10
20
30
0
10
20
30
0
10
20
30
0
10
20
30
0
10
20
30
0
10
20
30
H
L
G
K
F
J
A I B C D E
Chargeability
012345678910121416182023263035404550607080
0
10
20
30
40
4
10
20
30
34
0
10
20
30
40
6
10
20
30
36
0
10
20
30
40
4
10
20
30
34
0
10
20
30
0
10
20
30
0
10
20
30
0
10
20
30
0
10
20
30
0
10
20
30
H
L
G
K
F
J
A I B C D E
Resistivity
50701001301802403304506008501200160022003000400055007600100001400020000260003700050000
0 1000 2000 3000 4000
(Ωm)
(mV/V)
(m)
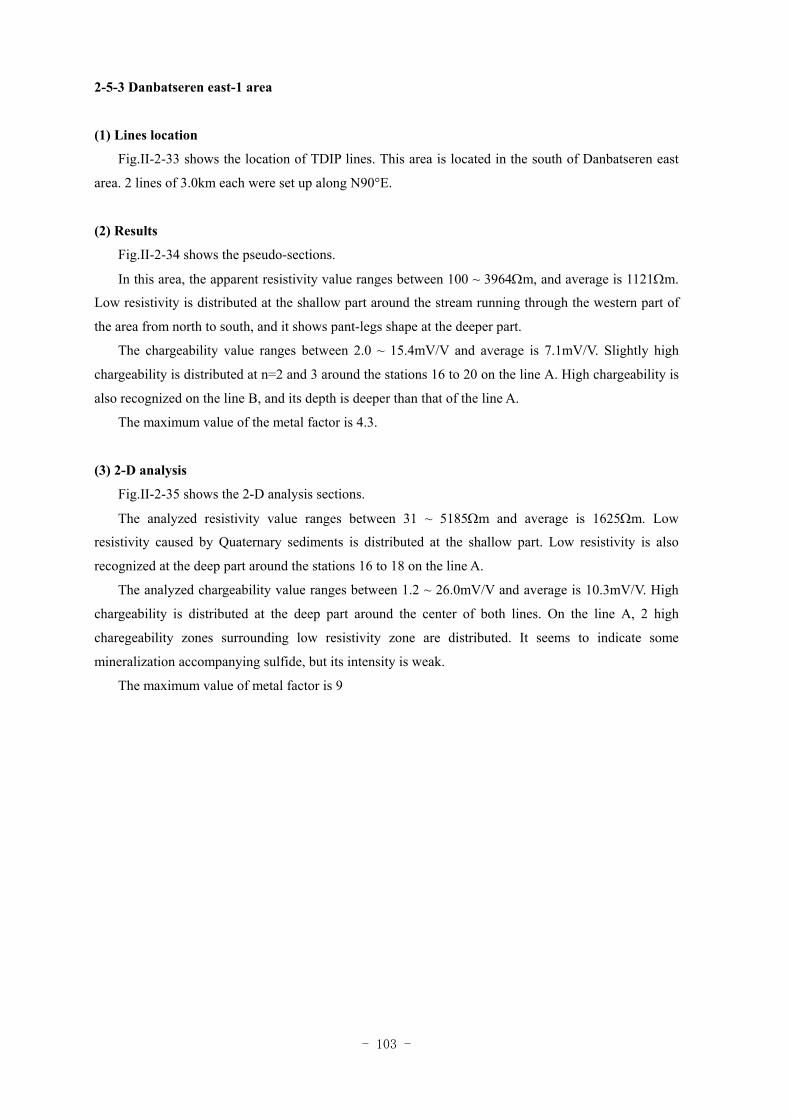
- 103 -
2-5-3 Danbatseren east-1 area
(1) Lines location
Fig.II-2-33 shows the location of TDIP lines. This area is located in the south of Danbatseren east
area. 2 lines of 3.0km each were set up along N90°E.
(2) Results
Fig.II-2-34 shows the pseudo-sections.
In this area, the apparent resistivity value ranges between 100 ~ 3964Ωm, and average is 1121Ωm.
Low resistivity is distributed at the shallow part around the stream running through the western part of
the area from north to south, and it shows pant-legs shape at the deeper part.
The chargeability value ranges between 2.0 ~ 15.4mV/V and average is 7.1mV/V. Slightly high
chargeability is distributed at n=2 and 3 around the stations 16 to 20 on the line A. High chargeability is
also recognized on the line B, and its depth is deeper than that of the line A.
The maximum value of the metal factor is 4.3.
(3) 2-D analysis
Fig.II-2-35 shows the 2-D analysis sections.
The analyzed resistivity value ranges between 31 ~ 5185Ωm and average is 1625Ωm. Low
resistivity caused by Quaternary sediments is distributed at the shallow part. Low resistivity is also
recognized at the deep part around the stations 16 to 18 on the line A.
The analyzed chargeability value ranges between 1.2 ~ 26.0mV/V and average is 10.3mV/V. High
chargeability is distributed at the deep part around the center of both lines. On the line A, 2 high
charegeability zones surrounding low resistivity zone are distributed. It seems to indicate some
mineralization accompanying sulfide, but its intensity is weak.
The maximum value of metal factor is 9
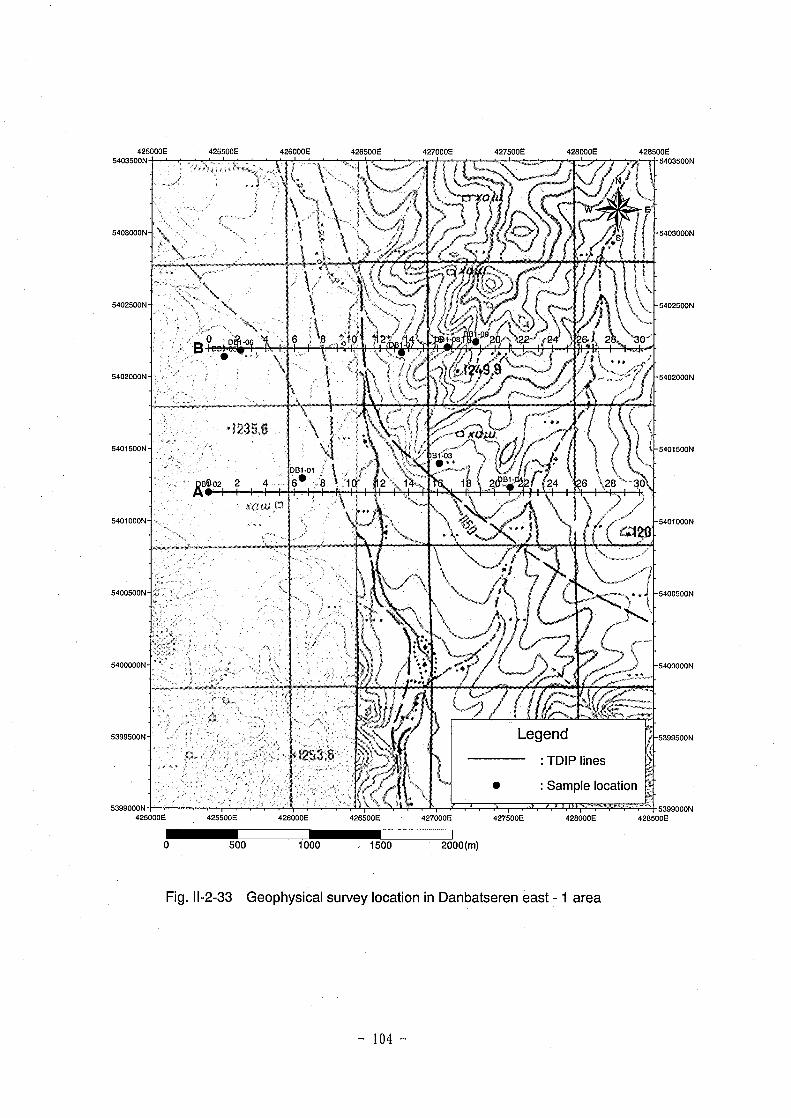
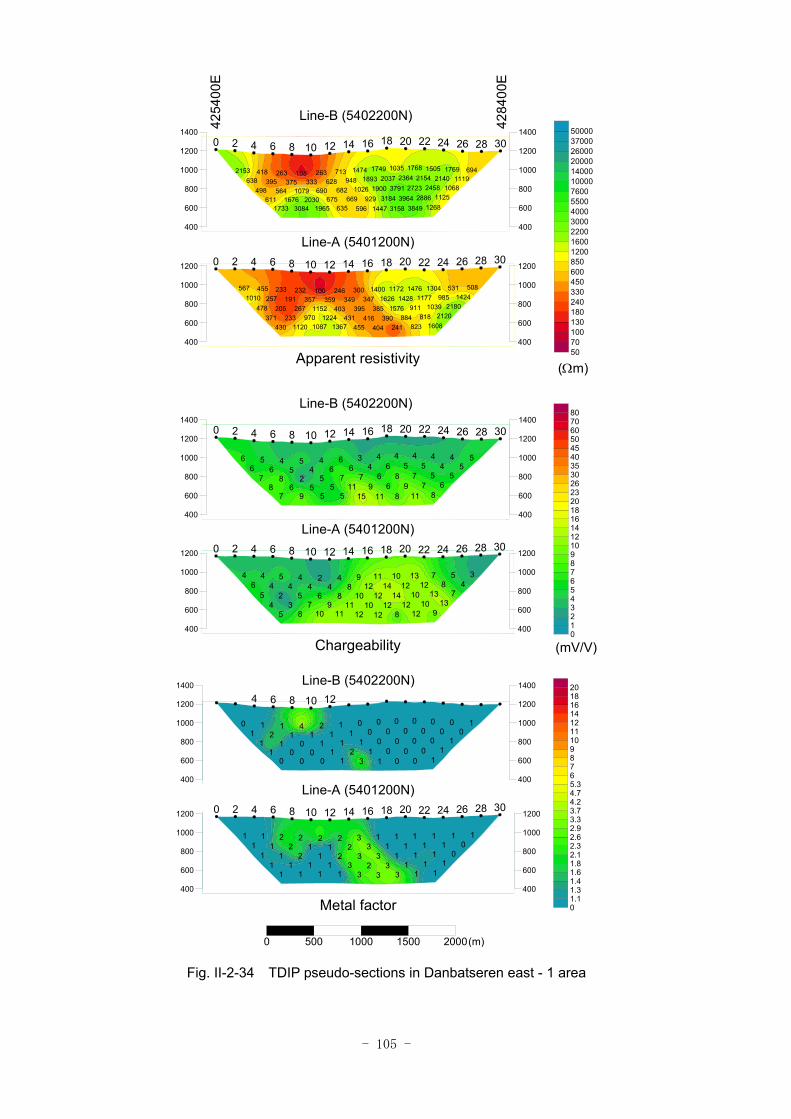
- 105 -
Fig. II-2-34 TDIP pseudo-sections in Danbatseren east - 1 area
5085311424
1304985
2180
14761177
10392120
11721428
911818
1608
14001626
1576884
823
300347
385390
241
246349
395416
404
100359
403431
455
232357
11521224
1367
233191
267970
1087
455257
205233
1120
5671010
478371
430
0 2 4 6 8 10 12 14 16 18 20 22 24 26 28 30
Apparent resistivity
Line-A (5401200N)
400
600
800
1000
1200
400
600
800
1000
1200
354
78
7
1312
1313
1012
1010
9
1114
1412
12
912
1212
8
48
1010
12
24
811
12
44
69
11
54
57
10
44
23
8
46
54
5
0 2 4 6 8 10 12 14 16 18 20 22 24 26 28 30
Chargeability
Line-A (5401200N)
400
600
800
1000
1200
400
600
800
1000
1200
100
00
1
00
01
00
00
1
00
00
0
00
00
0
11
11
1
21
12
3
41
11
1
11
00
0
12
10
0
01
11
0
4 6 8 10 12
Line-B (5402200N)
400
600
800
1000
1200
1400
400
600
800
1000
1200
1400
110
11
0
11
11
11
11
1
11
11
1
33
33
3
22
32
3
21
23
3
21
11
1
22
21
1
11
11
1
11
11
1
0 2 4 6 8 10 12 14 16 18 20 22 24 26 28 30
Metal factor
Line-A (5401200N)
400
600
800
1000
1200
400
600
800
1000
1200
50701001301802403304506008501200160022003000400055007600100001400020000260003700050000
012345678910121416182023263035404550607080
01.11.31.41.61.82.12.32.62.93.33.74.24.75.3678910111214161820
0 500 1000 1500 2000
(Ωm)
(mV/V)
4254
00E
4284
00E
69417691119
15052140
1068
17682154
24581125
10352364
27232886
1268
17492037
37913964
3849
14741893
19003184
3158
713948
1026929
1447
263628
682669
596
108333
690675
635
263375
10792030
1965
418395
5641676
3084
2153638
498611
1733
0 2 4 6 8 10 12 14 16 18 20 22 24 26 28 30
Line-B (5402200N)
400
600
800
1000
1200
1400
400
600
800
1000
1200
1400
545
44
5
45
56
45
77
8
46
89
11
34
66
8
66
79
11
46
711
15
54
55
5
45
25
5
56
86
9
66
78
7
0 2 4 6 8 10 12 14 16 18 20 22 24 26 28 30
Line-B (5402200N)
400
600
800
1000
1200
1400
400
600
800
1000
1200
1400
(m)
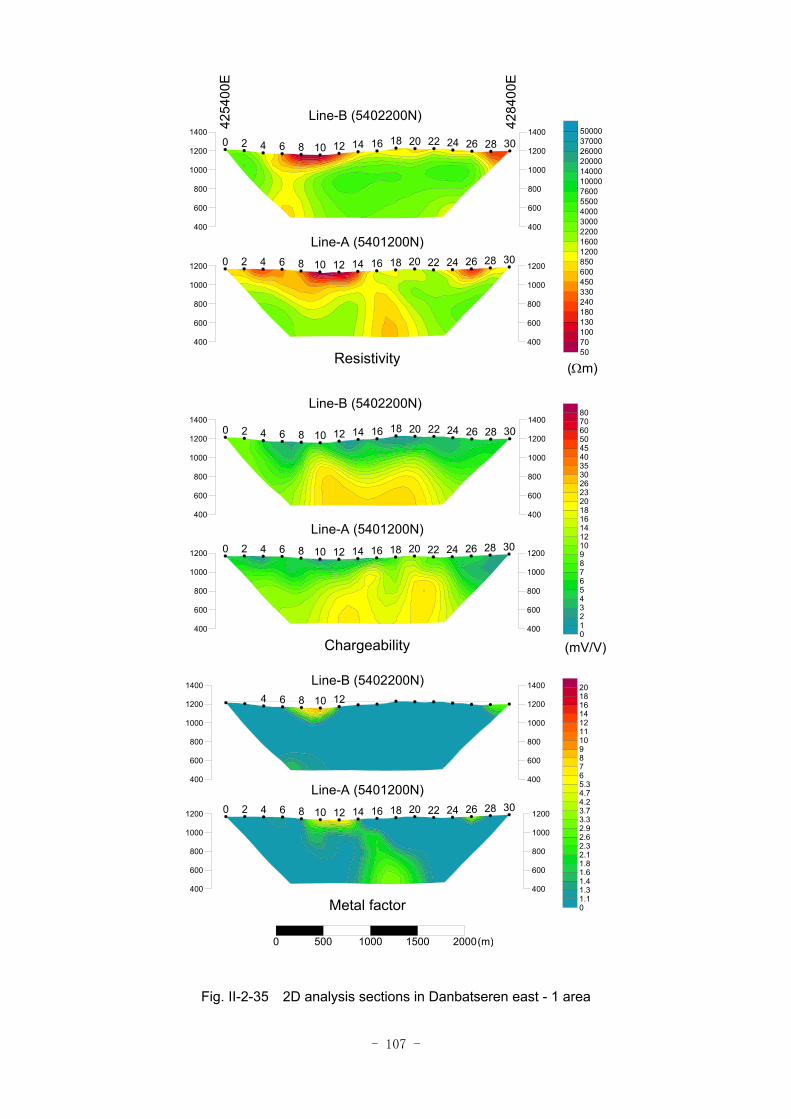
- 107 -
Fig. II-2-35 2D analysis sections in Danbatseren east - 1 area
50701001301802403304506008501200160022003000400055007600100001400020000260003700050000
012345678910121416182023263035404550607080
01.11.31.41.61.82.12.32.62.93.33.74.24.75.3678910111214161820
0 500 1000 1500 2000
(Ωm)
(mV/V)
4254
00E
4284
00E
4 6 8 10 12
Line-B (5402200N)
400
600
800
1000
1200
1400
400
600
800
1000
1200
1400
0 2 4 6 8 10 12 14 16 18 20 22 24 26 28 30
Metal factor
Line-A (5401200N)
400
600
800
1000
1200
400
600
800
1000
1200
0 2 4 6 8 10 12 14 16 18 20 22 24 26 28 30
Chargeability
Line-A (5401200N)
400
600
800
1000
1200
400
600
800
1000
1200
0 2 4 6 8 10 12 14 16 18 20 22 24 26 28 30
Line-B (5402200N)
400
600
800
1000
1200
1400
400
600
800
1000
1200
1400
0 2 4 6 8 10 12 14 16 18 20 22 24 26 28 30
Resistivity
Line-A (5401200N)
400
600
800
1000
1200
400
600
800
1000
1200
0 2 4 6 8 10 12 14 16 18 20 22 24 26 28 30
Line-B (5402200N)
400
600
800
1000
1200
1400
400
600
800
1000
1200
1400
(m)
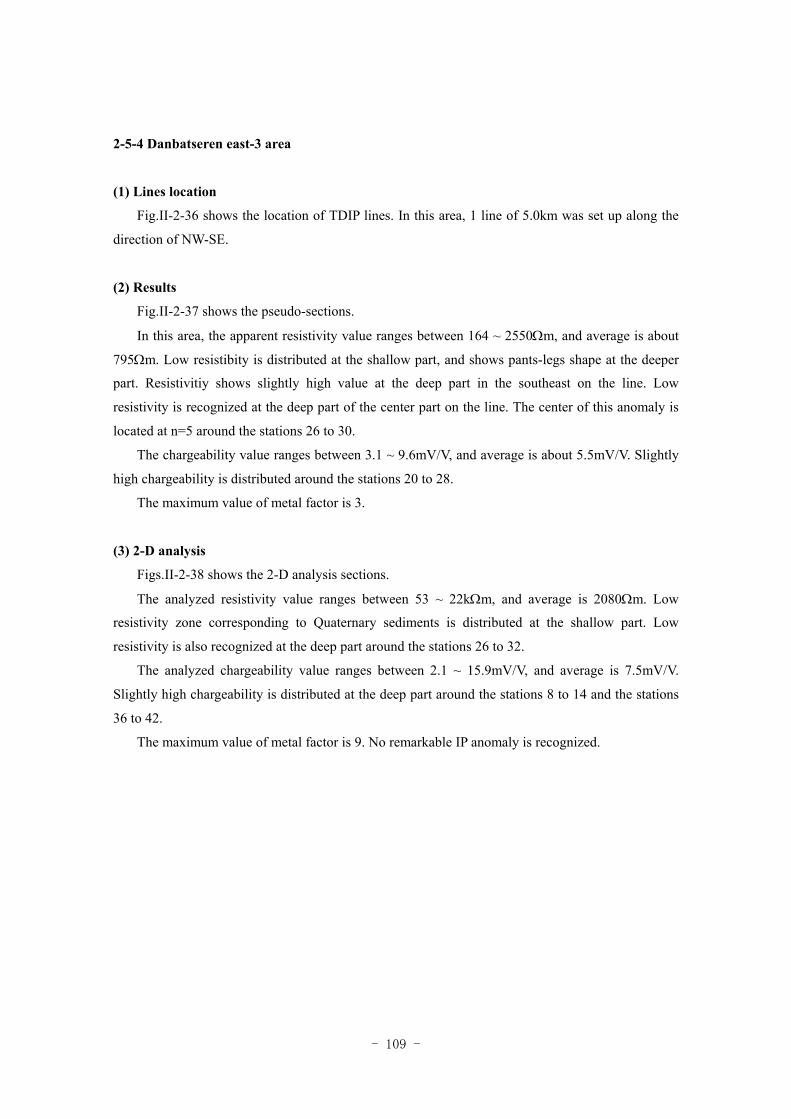
- 109 -
2-5-4 Danbatseren east-3 area
(1) Lines location
Fig.II-2-36 shows the location of TDIP lines. In this area, 1 line of 5.0km was set up along the
direction of NW-SE.
(2) Results
Fig.II-2-37 shows the pseudo-sections.
In this area, the apparent resistivity value ranges between 164 ~ 2550Ωm, and average is about
795Ωm. Low resistibity is distributed at the shallow part, and shows pants-legs shape at the deeper
part. Resistivitiy shows slightly high value at the deep part in the southeast on the line. Low
resistivity is recognized at the deep part of the center part on the line. The center of this anomaly is
located at n=5 around the stations 26 to 30.
The chargeability value ranges between 3.1 ~ 9.6mV/V, and average is about 5.5mV/V. Slightly
high chargeability is distributed around the stations 20 to 28.
The maximum value of metal factor is 3.
(3) 2-D analysis
Figs.II-2-38 shows the 2-D analysis sections.
The analyzed resistivity value ranges between 53 ~ 22kΩm, and average is 2080Ωm. Low
resistivity zone corresponding to Quaternary sediments is distributed at the shallow part. Low
resistivity is also recognized at the deep part around the stations 26 to 32.
The analyzed chargeability value ranges between 2.1 ~ 15.9mV/V, and average is 7.5mV/V.
Slightly high chargeability is distributed at the deep part around the stations 8 to 14 and the stations
36 to 42.
The maximum value of metal factor is 9. No remarkable IP anomaly is recognized.
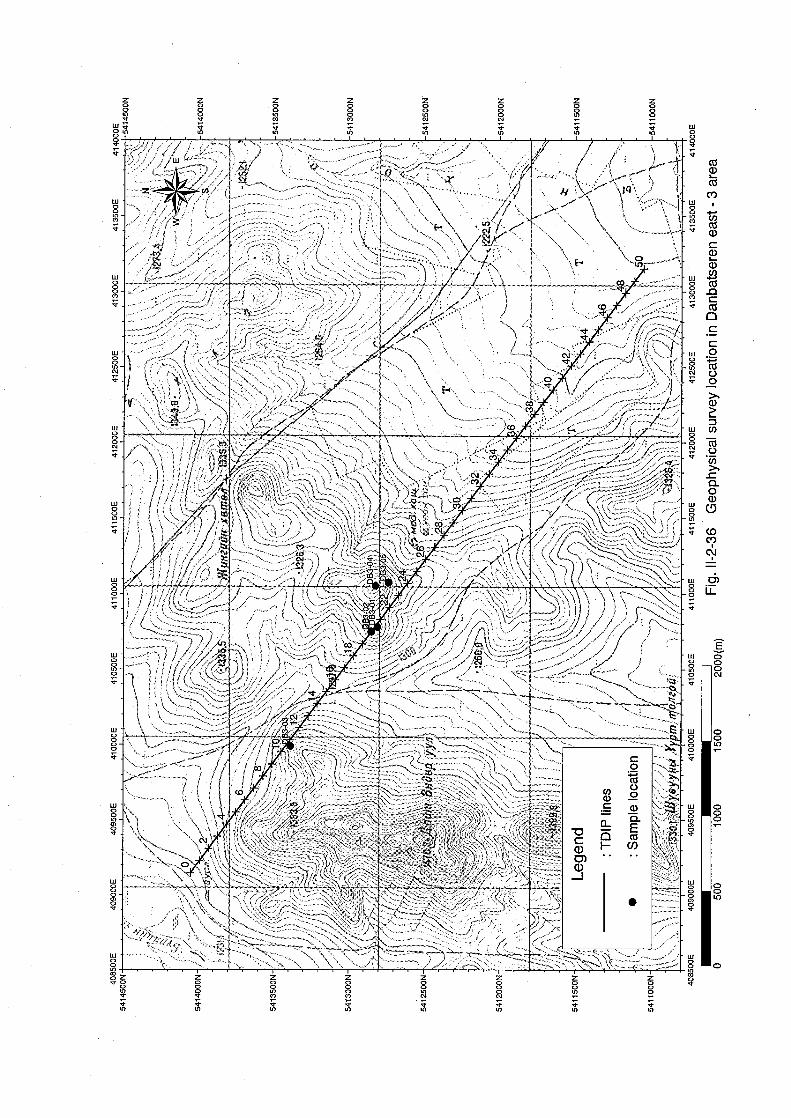
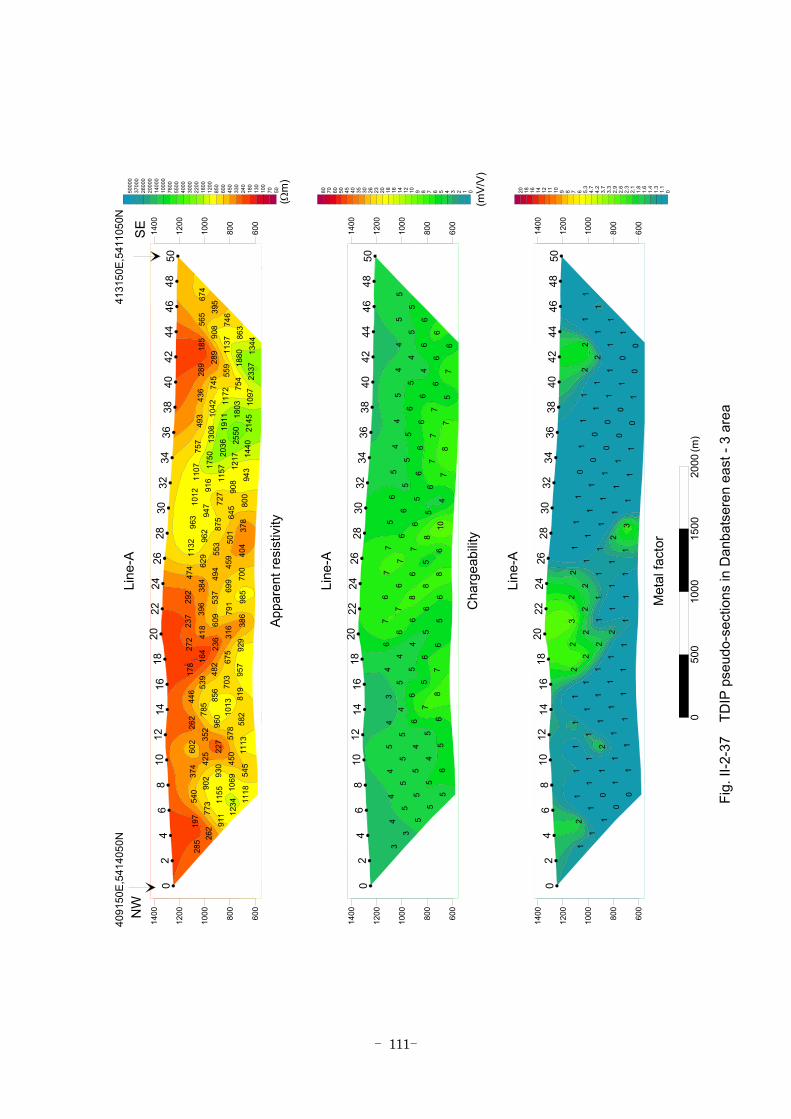
- 111 -
674
565 39
518
5 908 74
6
289 28
9 1137
863
436 74
5 559 18
80 1344
493 10
42 1172
754 23
37
757 13
08 1911 18
03 1097
1107 17
50 2036 25
50 2145
1012 91
6 1157 12
17 1440
963 94
7 727 90
8 943
1132 96
2 875 64
5 800
474 62
9 553 50
1 378
292 38
4 494 45
9 404
237 39
6 537 69
9 700
272 41
8 609 79
1 985
178 16
4 236 31
6 386
446 53
9 482 67
5 929
262 78
5 856 70
3 957
602 35
2 960 10
1381
9
374 42
5 227 57
8 582
540 90
2 930 45
0 1113
197 77
3 1155 10
6954
5
285 26
2 911 12
34 1118
02
46
810
1214
1618
2022
2426
2830
3234
3638
4042
4446
4850
Appa
rent
resi
stiv
ity
Line
-A
600
800
1000
1200
1400
600
800
1000
1200
1400
55
54
56
44
66
55
46
6
46
66
7
45
67
5
5
56
77
65
67
8
5
65
67
76
65
4
7
77
810
6
6
65
6
77
8
88
66
6
6
6
44
45
5
35
56
6
44
65
7
55
67
8
45
45
6
45
54
5
45
55
6
33
55
5
02
46
810
1214
1618
2022
2426
2830
3234
3638
4042
4446
4850
Cha
rgea
bilit
y
Line
-A
600
800
1000
1200
1400
600
800
1000
1200
1400
11
12
11
22
11
11
10
0
11
11
0
10
00
1
00
00
0
11
11
1
1
11
11
11
11
1
2
11
23
2
2
11
1
32
1
11
22
1
1
1
22
22
1
11
11
1
11
11
1
11
11
1
11
21
1
11
11
1
21
01
1
11
10
0
02
46
810
1214
1618
2022
2426
2830
3234
3638
4042
4446
4850
Met
al fa
ctor
Line
-A
600
800
1000
1200
1400
600
800
1000
1200
1400
5070100
130
180
240
330
450
600
850
1200
1600
2200
3000
4000
5500
7600
1000
014
000
2000
026
000
3700
050
000
012345678910121416182023263035404550607080 01.1
1.3
1.4
1.6
1.8
2.1
2.3
2.6
2.9
3.3
3.7
4.2
4.7
5.3
678910111214161820
(Ωm
)
(mV/
V)
050
010
0015
0020
00
4091
50E
,541
4050
N41
3150
E,54
1105
0N
SE
NW
(m)
Fig.
II-2
-37
TD
IP p
seud
o-se
ctio
ns in
Dan
bats
eren
eas
t - 3
are
a
- 111-
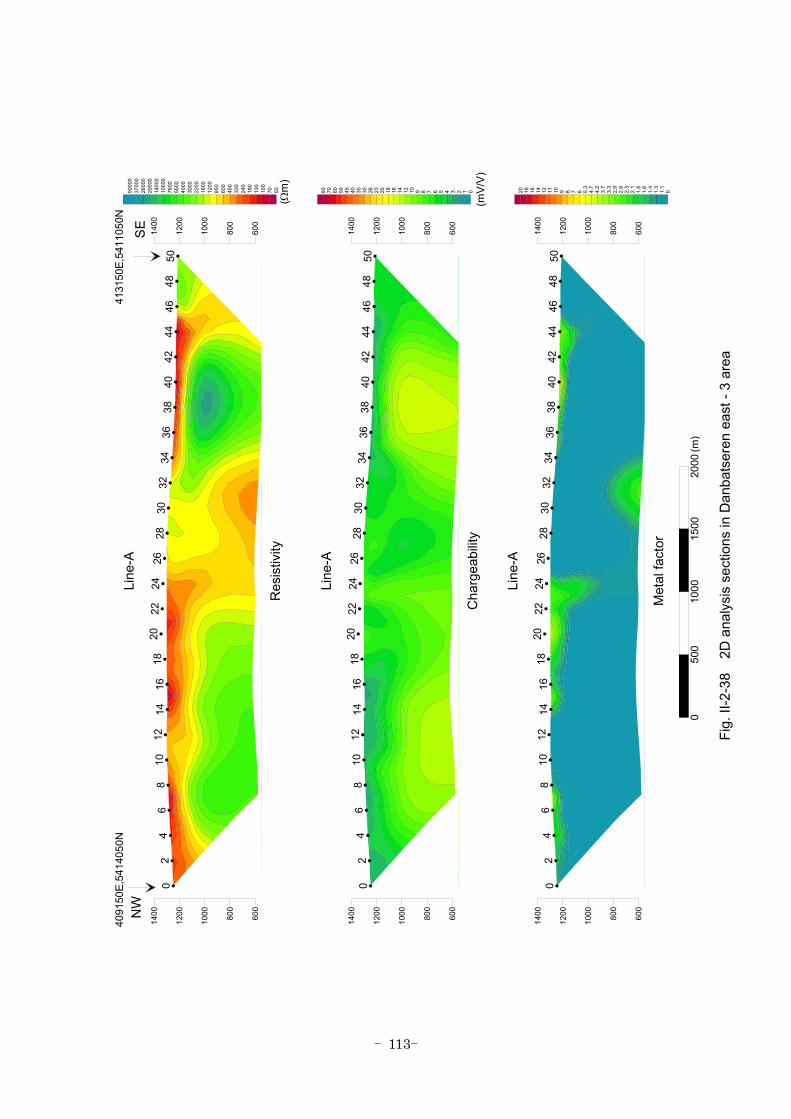
- 113 -
02
46
810
1214
1618
2022
2426
2830
3234
3638
4042
4446
4850
Res
istiv
ity
Line
-A
600
800
1000
1200
1400
600
800
1000
1200
1400
02
46
810
1214
1618
2022
2426
2830
3234
3638
4042
4446
4850
Cha
rgea
bilit
y
Line
-A
600
800
1000
1200
1400
600
800
1000
1200
1400
02
46
810
1214
1618
2022
2426
2830
3234
3638
4042
4446
4850
Met
al fa
ctor
Line
-A
600
800
1000
1200
1400
600
800
1000
1200
1400
5070100
130
180
240
330
450
600
850
1200
1600
2200
3000
4000
5500
7600
1000
014
000
2000
026
000
3700
050
000
012345678910121416182023263035404550607080 01.1
1.3
1.4
1.6
1.8
2.1
2.3
2.6
2.9
3.3
3.7
4.2
4.7
5.3
678910111214161820
(Ωm
)
(mV/
V)
050
010
0015
0020
00
4091
50E
,541
4050
N41
3150
E,54
1105
0N
SE
NW
(m)
Fig.
II-2
-38
2D
ana
lysi
s se
ctio
ns in
Dan
bats
eren
eas
t - 3
are
a
- 113-
- 115 -
2-5-5 Danbatseren east-4 area
(1) Lines location
Fig.II-2-39 shows the location of TDIP lines. In this area, 2 lines of 3.0km were set up along
N90°E.
(2) Results
Fig.II-2-40 shows the pseudo-sections.
In this area, the apparent resistivity value ranges between 78 ~ 3034Ωm, and average is about
607Ωm. Low resistibity is distributed in the west of the line A and in allover the line B. High
resistivity is recognized in the east of the line A.
The chargeability value ranges between 1.6 ~ 7.6mV/V, and average is about 4.0mV/V. No
remarkable chargeability anomaly is recognized.
The maximum value of metal factor is 6.
(3) 2-D analysis
Fig.II-2-41 shows the 2-D analysis sections.
The analyzed resistivity value ranges between 13 ~ 16kΩm, and average is 2379Ωm. Low
resistivity zone corresponding to Quaternary sediments is distributed at the shallow part. Most part
of this area is occupied by a farm, therefore, the value of resistivity at the shallow part is less than
that of the other area. Low resistivity is also recognized at the deep part in the west of the area.
The analyzed chargeability value ranges between 0.2 ~ 7.0mV/V and average is 4.0mV/V. No
remarkable high chargeability such as to indicate mineralization is recognized.
The maximum value of metal factor is 18. High metal factor zone is distributed limitedly at the
shallow part. It is considered to be caused by extremely low resistivity.
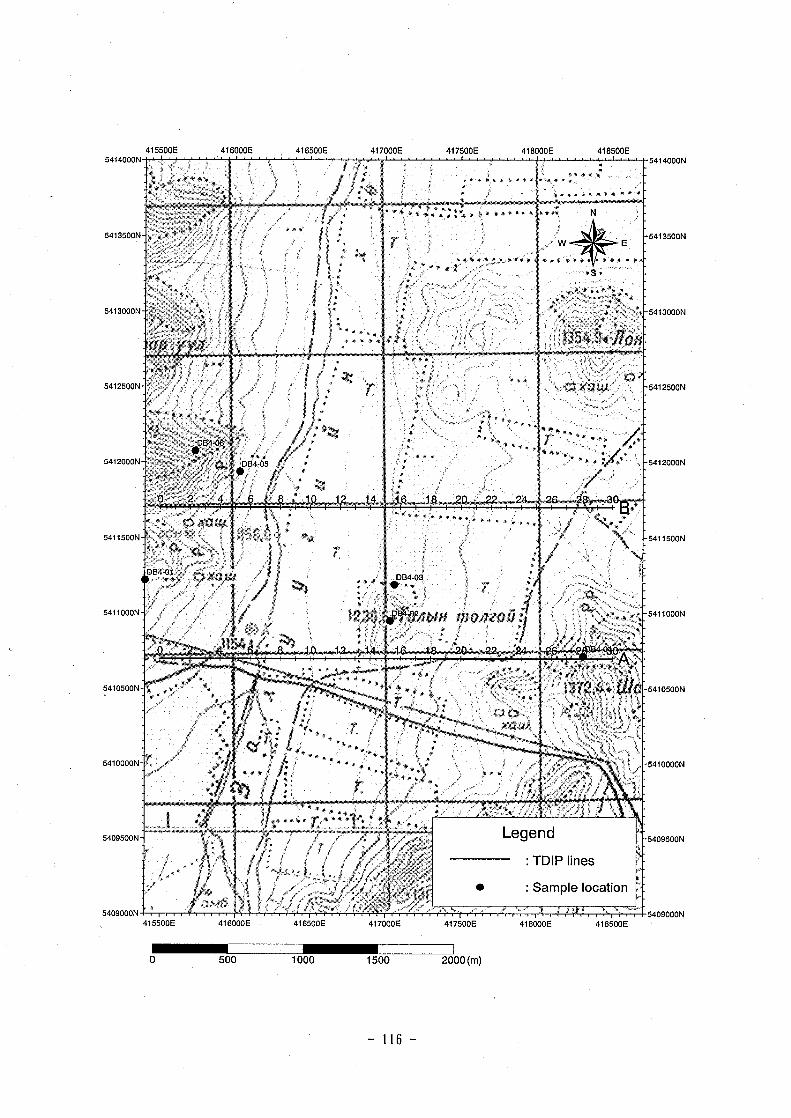
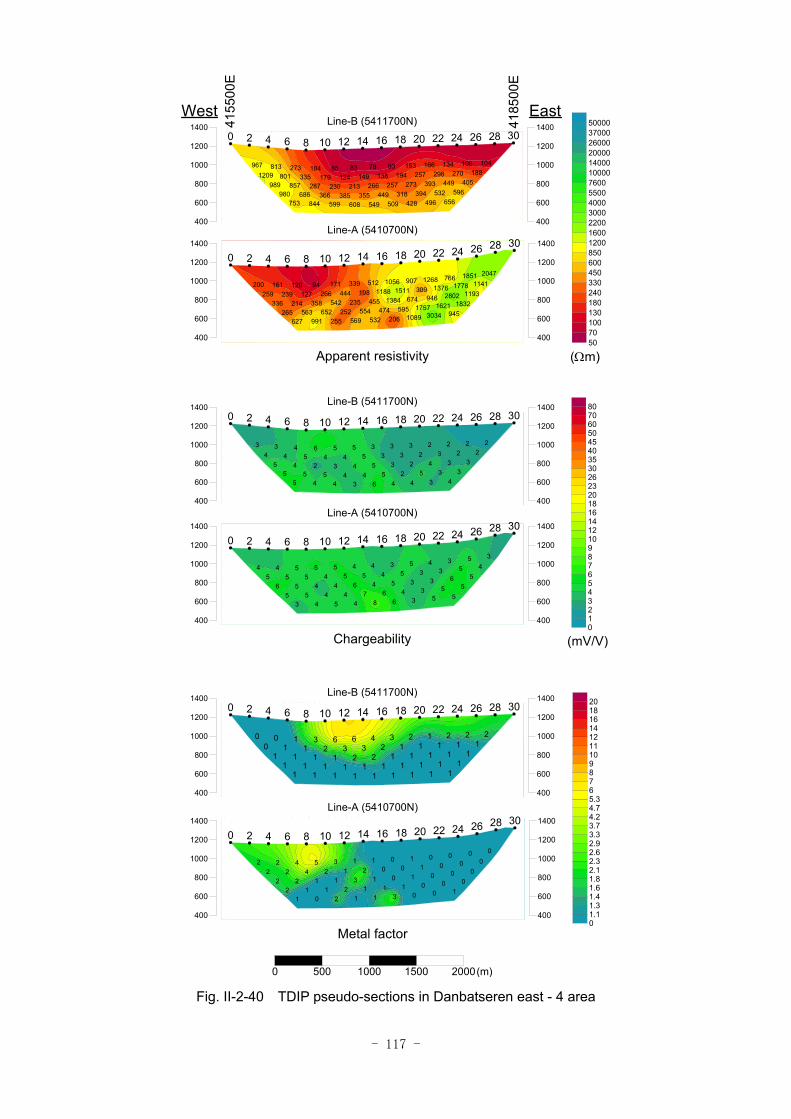
- 117 -
Fig. II-2-40 TDIP pseudo-sections in Danbatseren east - 4 area
50701001301802403304506008501200160022003000400055007600100001400020000260003700050000
012345678910121416182023263035404550607080
01.11.31.41.61.82.12.32.62.93.33.74.24.75.3678910111214161820
0 500 1000 1500 2000
(Ωm)
(mV/V)
West East
4155
00E
4185
00E
104108188
134270
405
166298
449596
153257
393532
656
93194
273394
496
78138
257318
428
83149
266449
509
85124
213355
549
184179
230385
608
273335
287366
599
813801
857686
844
9671209
989980
753
0 2 4 6 8 10 12 14 16 18 20 22 24 26 28 30Line-B (5411700N)
400
600
800
1000
1200
1400
400
600
800
1000
1200
1400
204718511141
7661778
1193
12681376
28021832
907309
9461621
945
10561511
6741757
3034
5121188
1384595
1089
339198
455474
206
171444
235554
532
94266
542252
569
120127
358652
255
161239
214563
991
200259
336265
627
0 2 4 6 8 10 12 14 16 18 20 22 24 26 28 30
Apparent resistivity
Line-A (5410700N)
400
600
800
1000
1200
1400
400
600
800
1000
1200
1400
222
22
3
23
33
32
43
4
33
25
3
33
32
4
55
55
4
54
44
6
64
34
3
45
25
4
34
45
4
34
55
5
0 2 4 6 8 10 12 14 16 18 20 22 24 26 28 30Line-B (5411700N)
400
600
800
1000
1200
1400
400
600
800
1000
1200
1400
354
35
5
43
65
53
35
5
35
33
5
44
54
3
45
46
6
55
67
8
54
44
4
55
44
5
45
55
4
45
65
3
0 2 4 6 8 10 12 14 16 18 20 22 24 26 28 30
Chargeability
Line-A (5410700N)
400
600
800
1000
1200
1400
400
600
800
1000
1200
1400
221
21
1
11
11
21
11
1
31
11
1
42
11
1
63
21
1
63
21
1
32
11
1
11
11
1
01
11
1
00
11
1
0 2 4 6 8 10 12 14 16 18 20 22 24 26 28 30Line-B (5411700N)
400
600
800
1000
1200
1400
400
600
800
1000
1200
1400
000
00
0
00
00
11
00
1
00
10
0
10
01
0
12
11
3
31
31
1
52
12
1
44
11
2
22
21
0
22
22
1
0 2 4 6 8 10 12 14 16 18 20 22 24 26 28 30
Metal factor
Line-A (5410700N)
400
600
800
1000
1200
1400
400
600
800
1000
1200
1400
(m)
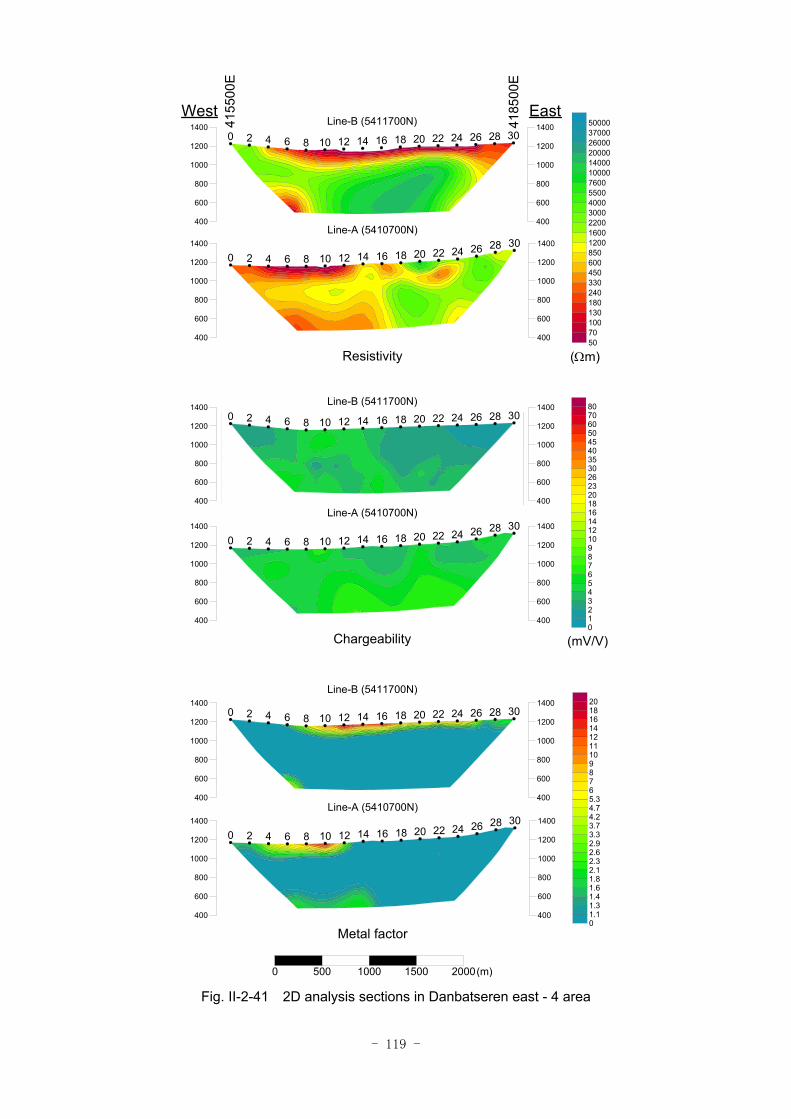
- 119 -
Fig. II-2-41 2D analysis sections in Danbatseren east - 4 area
50701001301802403304506008501200160022003000400055007600100001400020000260003700050000
012345678910121416182023263035404550607080
01.11.31.41.61.82.12.32.62.93.33.74.24.75.3678910111214161820
0 500 1000 1500 2000
(Ωm)
(mV/V)
West East
4155
00E
4185
00E
0 2 4 6 8 10 12 14 16 18 20 22 24 26 28 30Line-B (5411700N)
400
600
800
1000
1200
1400
400
600
800
1000
1200
1400
0 2 4 6 8 10 12 14 16 18 20 22 24 26 28 30
Resistivity
Line-A (5410700N)
400
600
800
1000
1200
1400
400
600
800
1000
1200
1400
0 2 4 6 8 10 12 14 16 18 20 22 24 26 28 30Line-B (5411700N)
400
600
800
1000
1200
1400
400
600
800
1000
1200
1400
0 2 4 6 8 10 12 14 16 18 20 22 24 26 28 30
Chargeability
Line-A (5410700N)
400
600
800
1000
1200
1400
400
600
800
1000
1200
1400
0 2 4 6 8 10 12 14 16 18 20 22 24 26 28 30
Line-B (5411700N)
400
600
800
1000
1200
1400
400
600
800
1000
1200
1400
0 2 4 6 8 10 12 14 16 18 20 22 24 26 28 30
Metal factor
Line-A (5410700N)
400
600
800
1000
1200
1400
400
600
800
1000
1200
1400
(m)
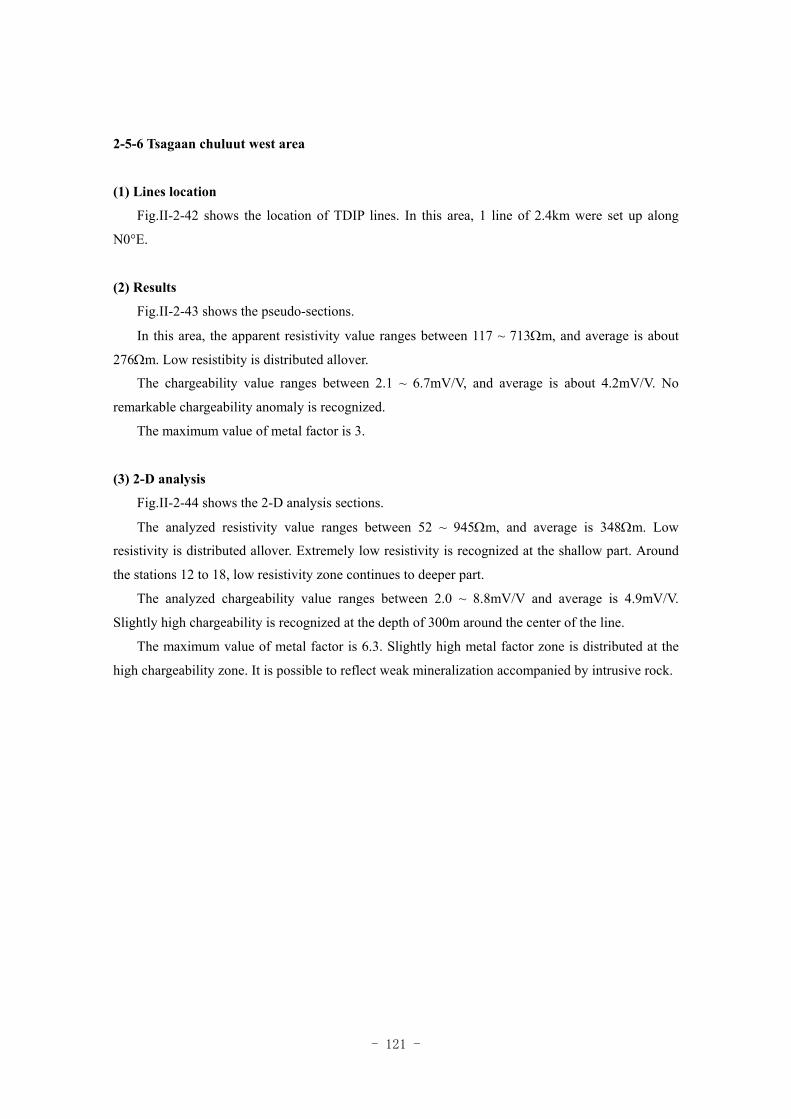
- 121 -
2-5-6 Tsagaan chuluut west area
(1) Lines location
Fig.II-2-42 shows the location of TDIP lines. In this area, 1 line of 2.4km were set up along
N0°E.
(2) Results
Fig.II-2-43 shows the pseudo-sections.
In this area, the apparent resistivity value ranges between 117 ~ 713Ωm, and average is about
276Ωm. Low resistibity is distributed allover.
The chargeability value ranges between 2.1 ~ 6.7mV/V, and average is about 4.2mV/V. No
remarkable chargeability anomaly is recognized.
The maximum value of metal factor is 3.
(3) 2-D analysis
Fig.II-2-44 shows the 2-D analysis sections.
The analyzed resistivity value ranges between 52 ~ 945Ωm, and average is 348Ωm. Low
resistivity is distributed allover. Extremely low resistivity is recognized at the shallow part. Around
the stations 12 to 18, low resistivity zone continues to deeper part.
The analyzed chargeability value ranges between 2.0 ~ 8.8mV/V and average is 4.9mV/V.
Slightly high chargeability is recognized at the depth of 300m around the center of the line.
The maximum value of metal factor is 6.3. Slightly high metal factor zone is distributed at the
high chargeability zone. It is possible to reflect weak mineralization accompanied by intrusive rock.
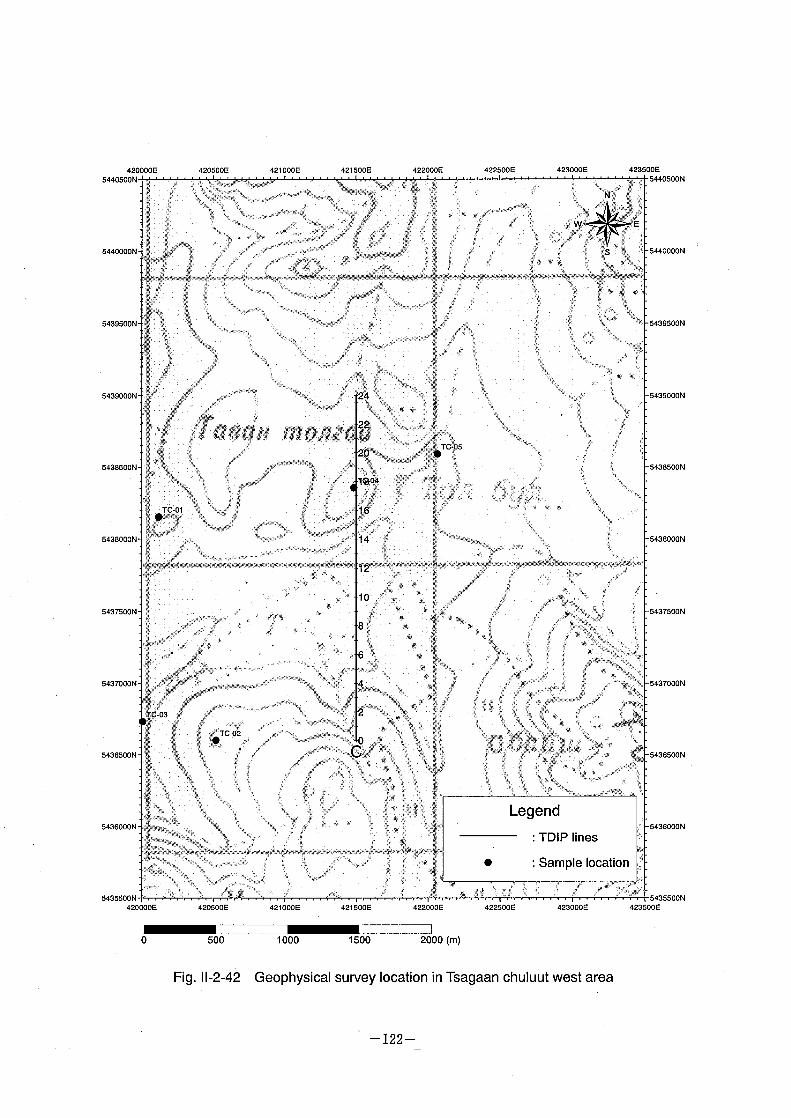
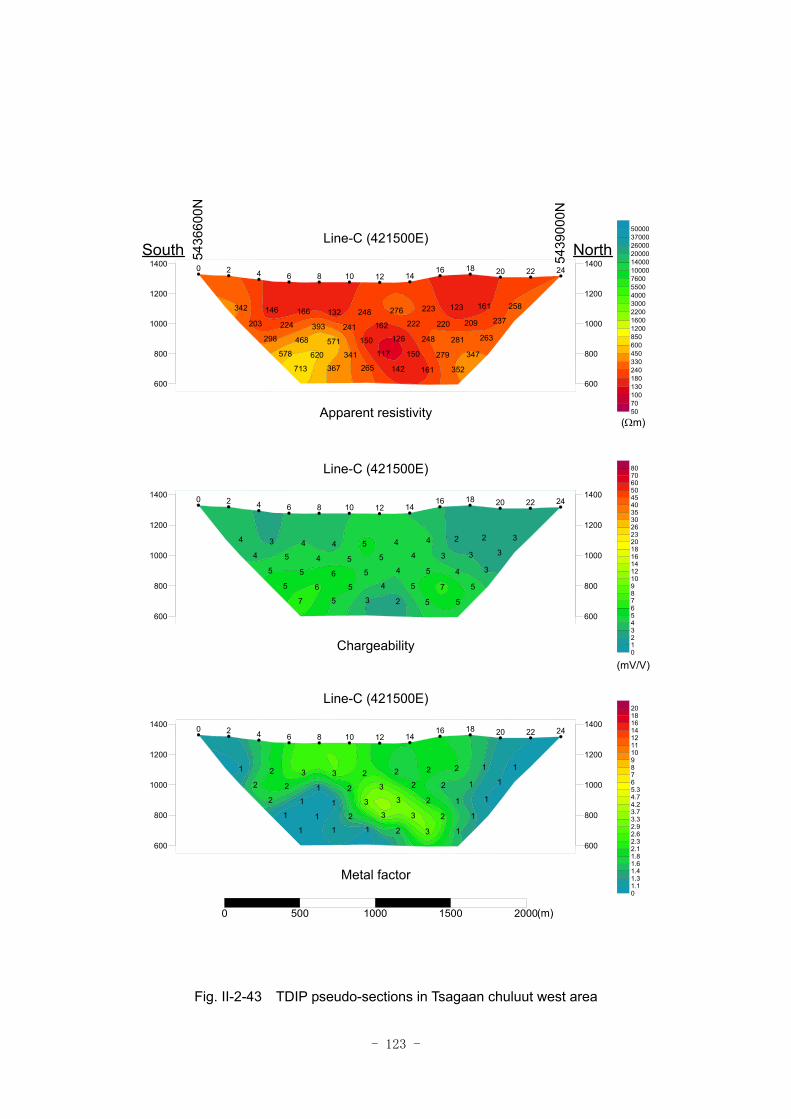
- 123 -
Fig. II-2-43 TDIP pseudo-sections in Tsagaan chuluut west area
258161
237
123
209
263
223
220
281
347
276222
248
279
352
248
162126
150
161
132
241
150117
142
166
393
571
341265
146
224
468
620
367
342
203
298
578
713
0 2 4 6 8 10 12 1416 18 20 22 24
Apparent resistivity
Line-C (421500E)
600
800
1000
1200
1400
600
800
1000
1200
1400
11
1
2
1
1
2
2
1
1
22
2
2
1
2
33
3
3
3
2
33
2
3
1
1
21
2
2
1
1
1
1
2
2
1
1
0 2 4 6 8 10 12 1416 18 20 22 24
Metal factor
Line-C (421500E)
600
800
1000
1200
1400
600
800
1000
1200
1400
32
3
2
3
3
4
3
4
5
44
5
7
5
5
54
5
5
4
5
54
2
4
4
6
53
3
5
5
6
5
4
4
5
5
7
0 2 4 6 8 10 12 1416 18 20 22 24
Chargeability
Line-C (421500E)
600
800
1000
1200
1400
600
800
1000
1200
1400
50701001301802403304506008501200160022003000400055007600100001400020000260003700050000
012345678910121416182023263035404550607080
01.11.31.41.61.82.12.32.62.93.33.74.24.75.3678910111214161820
5439
000N
5436
600N
NorthSouth
(Ωm)
(mV/V)
0 500 1000 1500 2000(m)
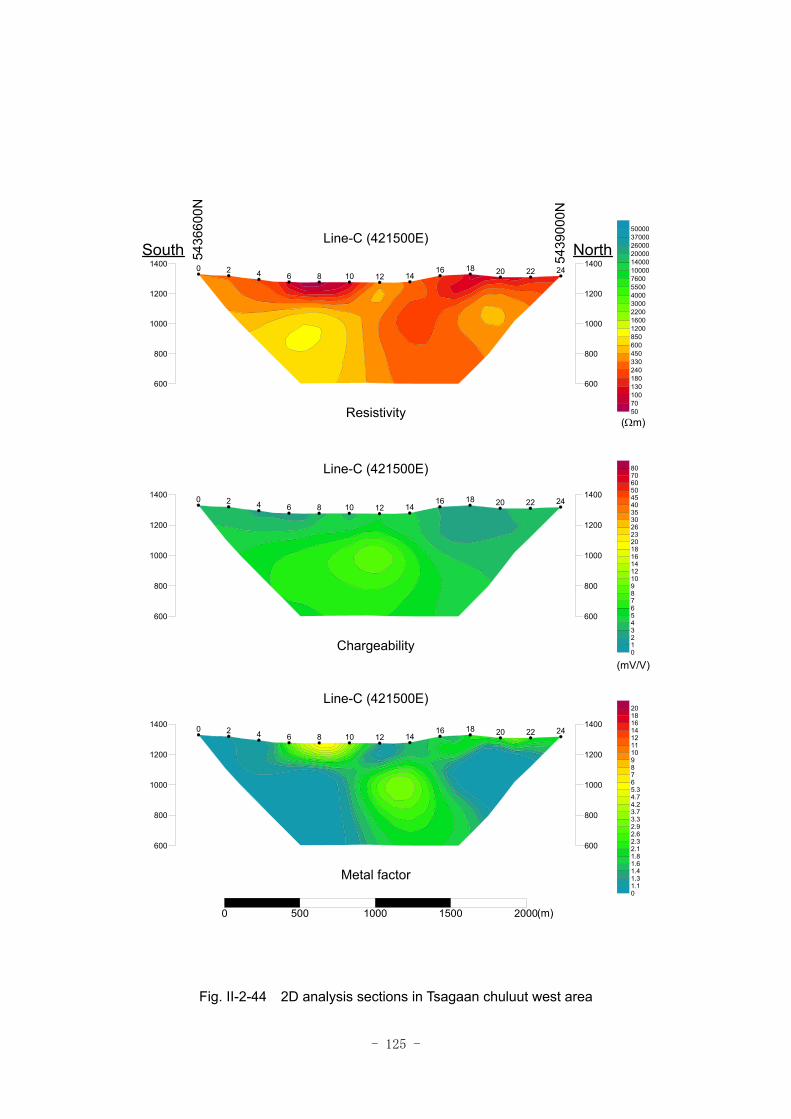
- 125 -
Fig. II-2-44 2D analysis sections in Tsagaan chuluut west area
0 2 4 6 8 10 12 1416 18 20 22 24
Resistivity
Line-C (421500E)
600
800
1000
1200
1400
600
800
1000
1200
1400
0 2 4 6 8 10 12 1416 18 20 22 24
Metal factor
Line-C (421500E)
600
800
1000
1200
1400
600
800
1000
1200
1400
0 2 4 6 8 10 12 1416 18 20 22 24
Chargeability
Line-C (421500E)
600
800
1000
1200
1400
600
800
1000
1200
1400
50701001301802403304506008501200160022003000400055007600100001400020000260003700050000
012345678910121416182023263035404550607080
01.11.31.41.61.82.12.32.62.93.33.74.24.75.3678910111214161820
5439
000N
5436
600N
NorthSouth
(Ωm)
(mV/V)
0 500 1000 1500 2000(m)
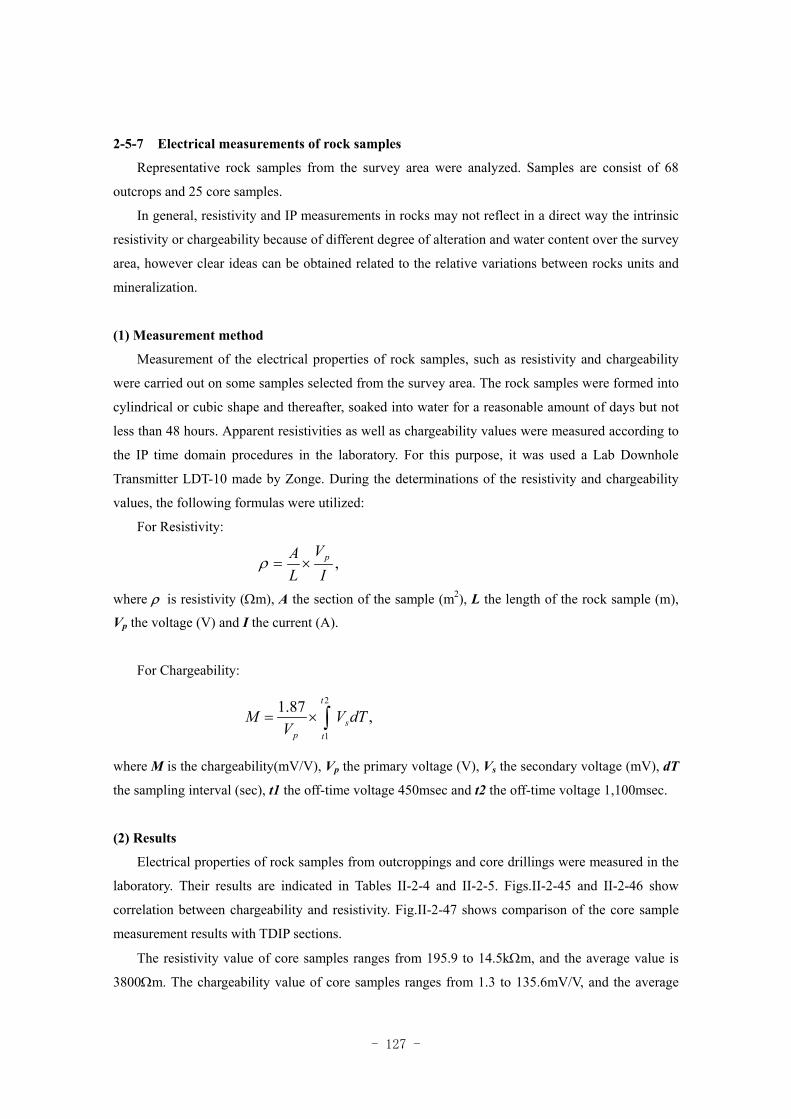
- 127 -
2-5-7 Electrical measurements of rock samples
Representative rock samples from the survey area were analyzed. Samples are consist of 68
outcrops and 25 core samples.
In general, resistivity and IP measurements in rocks may not reflect in a direct way the intrinsic
resistivity or chargeability because of different degree of alteration and water content over the survey
area, however clear ideas can be obtained related to the relative variations between rocks units and
mineralization.
(1) Measurement method
Measurement of the electrical properties of rock samples, such as resistivity and chargeability
were carried out on some samples selected from the survey area. The rock samples were formed into
cylindrical or cubic shape and thereafter, soaked into water for a reasonable amount of days but not
less than 48 hours. Apparent resistivities as well as chargeability values were measured according to
the IP time domain procedures in the laboratory. For this purpose, it was used a Lab Downhole
Transmitter LDT-10 made by Zonge. During the determinations of the resistivity and chargeability
values, the following formulas were utilized:
For Resistivity:
,I
VLA p×=ρ
where ρ is resistivity (Ωm), A the section of the sample (m2), L the length of the rock sample (m),
Vp the voltage (V) and I the current (A).
For Chargeability:
,87.1 2
1
dTVV
M s
t
tp∫×=
where M is the chargeability(mV/V), Vp the primary voltage (V), Vs the secondary voltage (mV), dT
the sampling interval (sec), t1 the off-time voltage 450msec and t2 the off-time voltage 1,100msec.
(2) Results
Electrical properties of rock samples from outcroppings and core drillings were measured in the
laboratory. Their results are indicated in Tables II-2-4 and II-2-5. Figs.II-2-45 and II-2-46 show
correlation between chargeability and resistivity. Fig.II-2-47 shows comparison of the core sample
measurement results with TDIP sections.
The resistivity value of core samples ranges from 195.9 to 14.5kΩm, and the average value is
3800Ωm. The chargeability value of core samples ranges from 1.3 to 135.6mV/V, and the average
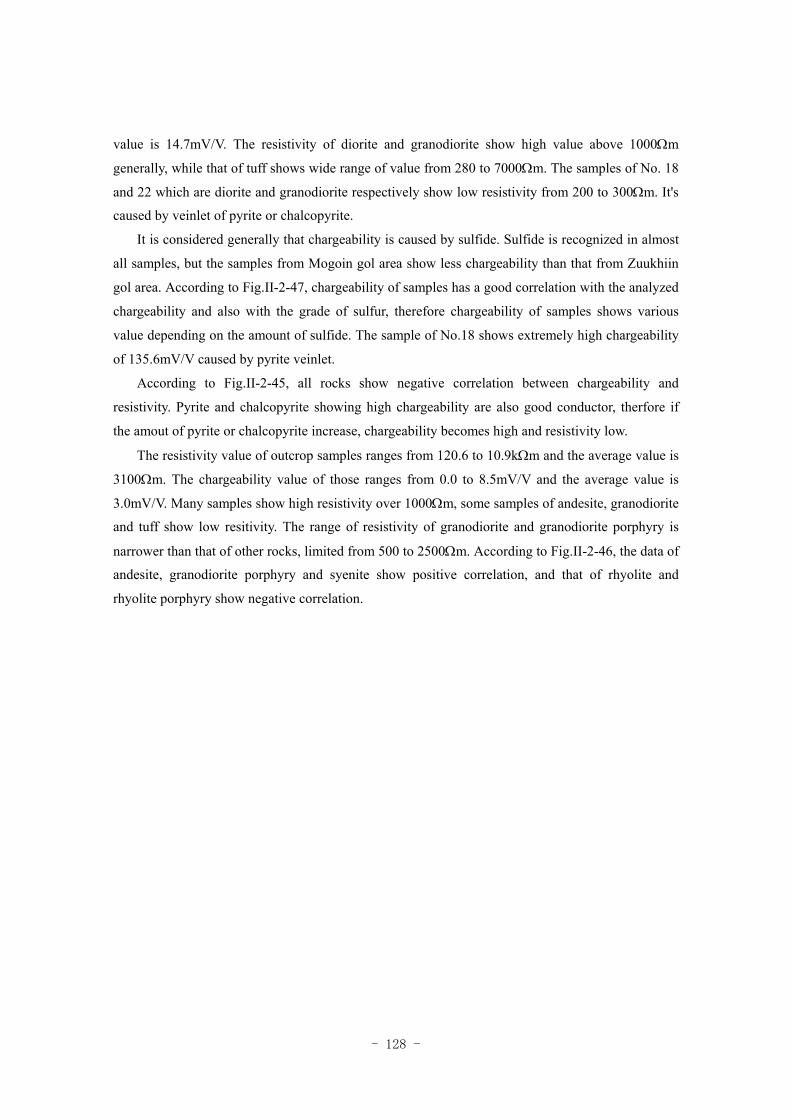
- 128 -
value is 14.7mV/V. The resistivity of diorite and granodiorite show high value above 1000Ωm
generally, while that of tuff shows wide range of value from 280 to 7000Ωm. The samples of No. 18
and 22 which are diorite and granodiorite respectively show low resistivity from 200 to 300Ωm. It's
caused by veinlet of pyrite or chalcopyrite.
It is considered generally that chargeability is caused by sulfide. Sulfide is recognized in almost
all samples, but the samples from Mogoin gol area show less chargeability than that from Zuukhiin
gol area. According to Fig.II-2-47, chargeability of samples has a good correlation with the analyzed
chargeability and also with the grade of sulfur, therefore chargeability of samples shows various
value depending on the amount of sulfide. The sample of No.18 shows extremely high chargeability
of 135.6mV/V caused by pyrite veinlet.
According to Fig.II-2-45, all rocks show negative correlation between chargeability and
resistivity. Pyrite and chalcopyrite showing high chargeability are also good conductor, therfore if
the amout of pyrite or chalcopyrite increase, chargeability becomes high and resistivity low.
The resistivity value of outcrop samples ranges from 120.6 to 10.9kΩm and the average value is
3100Ωm. The chargeability value of those ranges from 0.0 to 8.5mV/V and the average value is
3.0mV/V. Many samples show high resistivity over 1000Ωm, some samples of andesite, granodiorite
and tuff show low resitivity. The range of resistivity of granodiorite and granodiorite porphyry is
narrower than that of other rocks, limited from 500 to 2500Ωm. According to Fig.II-2-46, the data of
andesite, granodiorite porphyry and syenite show positive correlation, and that of rhyolite and
rhyolite porphyry show negative correlation.
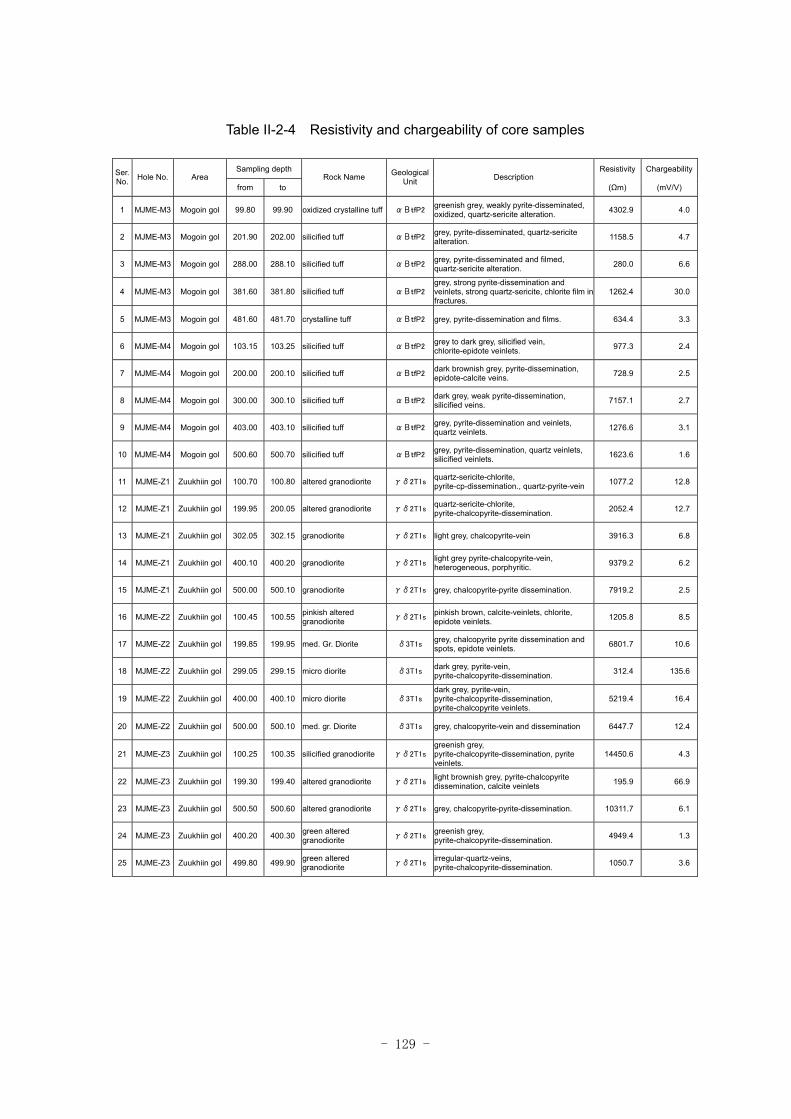
- 129 -
Table II-2-4 Resistivity and chargeability of core samples
Sampling depth Resistivity ChargeabilitySer.
No. Hole No. Area from to
Rock Name GeologicalUnit Description
(Ωm) (mV/V)
1 MJME-M3 Mogoin gol 99.80 99.90 oxidized crystalline tuff αΒtfP2greenish grey, weakly pyrite-disseminated, oxidized, quartz-sericite alteration. 4302.9 4.0
2 MJME-M3 Mogoin gol 201.90 202.00 silicified tuff αΒtfP2grey, pyrite-disseminated, quartz-sericite alteration. 1158.5 4.7
3 MJME-M3 Mogoin gol 288.00 288.10 silicified tuff αΒtfP2grey, pyrite-disseminated and filmed, quartz-sericite alteration. 280.0 6.6
4 MJME-M3 Mogoin gol 381.60 381.80 silicified tuff αΒtfP2grey, strong pyrite-dissemination and veinlets, strong quartz-sericite, chlorite film in fractures.
1262.4 30.0
5 MJME-M3 Mogoin gol 481.60 481.70 crystalline tuff αΒtfP2 grey, pyrite-dissemination and films. 634.4 3.3
6 MJME-M4 Mogoin gol 103.15 103.25 silicified tuff αΒtfP2grey to dark grey, silicified vein, chlorite-epidote veinlets. 977.3 2.4
7 MJME-M4 Mogoin gol 200.00 200.10 silicified tuff αΒtfP2dark brownish grey, pyrite-dissemination, epidote-calcite veins. 728.9 2.5
8 MJME-M4 Mogoin gol 300.00 300.10 silicified tuff αΒtfP2dark grey, weak pyrite-dissemination, silicified veins. 7157.1 2.7
9 MJME-M4 Mogoin gol 403.00 403.10 silicified tuff αΒtfP2grey, pyrite-dissemination and veinlets, quartz veinlets. 1276.6 3.1
10 MJME-M4 Mogoin gol 500.60 500.70 silicified tuff αΒtfP2grey, pyrite-dissemination, quartz veinlets, silicified veinlets. 1623.6 1.6
11 MJME-Z1 Zuukhiin gol 100.70 100.80 altered granodiorite γδ2T1squartz-sericite-chlorite, pyrite-cp-dissemination., quartz-pyrite-vein 1077.2 12.8
12 MJME-Z1 Zuukhiin gol 199.95 200.05 altered granodiorite γδ2T1squartz-sericite-chlorite, pyrite-chalcopyrite-dissemination. 2052.4 12.7
13 MJME-Z1 Zuukhiin gol 302.05 302.15 granodiorite γδ2T1s light grey, chalcopyrite-vein 3916.3 6.8
14 MJME-Z1 Zuukhiin gol 400.10 400.20 granodiorite γδ2T1slight grey pyrite-chalcopyrite-vein, heterogeneous, porphyritic. 9379.2 6.2
15 MJME-Z1 Zuukhiin gol 500.00 500.10 granodiorite γδ2T1s grey, chalcopyrite-pyrite dissemination. 7919.2 2.5
16 MJME-Z2 Zuukhiin gol 100.45 100.55 pinkish altered granodiorite γδ2T1s
pinkish brown, calcite-veinlets, chlorite, epidote veinlets. 1205.8 8.5
17 MJME-Z2 Zuukhiin gol 199.85 199.95 med. Gr. Diorite δ3T1sgrey, chalcopyrite pyrite dissemination and spots, epidote veinlets. 6801.7 10.6
18 MJME-Z2 Zuukhiin gol 299.05 299.15 micro diorite δ3T1sdark grey, pyrite-vein, pyrite-chalcopyrite-dissemination. 312.4 135.6
19 MJME-Z2 Zuukhiin gol 400.00 400.10 micro diorite δ3T1sdark grey, pyrite-vein, pyrite-chalcopyrite-dissemination, pyrite-chalcopyrite veinlets.
5219.4 16.4
20 MJME-Z2 Zuukhiin gol 500.00 500.10 med. gr. Diorite δ3T1s grey, chalcopyrite-vein and dissemination 6447.7 12.4
21 MJME-Z3 Zuukhiin gol 100.25 100.35 silicified granodiorite γδ2T1sgreenish grey, pyrite-chalcopyrite-dissemination, pyrite veinlets.
14450.6 4.3
22 MJME-Z3 Zuukhiin gol 199.30 199.40 altered granodiorite γδ2T1slight brownish grey, pyrite-chalcopyrite dissemination, calcite veinlets 195.9 66.9
23 MJME-Z3 Zuukhiin gol 500.50 500.60 altered granodiorite γδ2T1s grey, chalcopyrite-pyrite-dissemination. 10311.7 6.1
24 MJME-Z3 Zuukhiin gol 400.20 400.30 green altered granodiorite γδ2T1s
greenish grey, pyrite-chalcopyrite-dissemination. 4949.4 1.3
25 MJME-Z3 Zuukhiin gol 499.80 499.90 green altered granodiorite γδ2T1s
irregular-quartz-veins, pyrite-chalcopyrite-dissemination. 1050.7 3.6
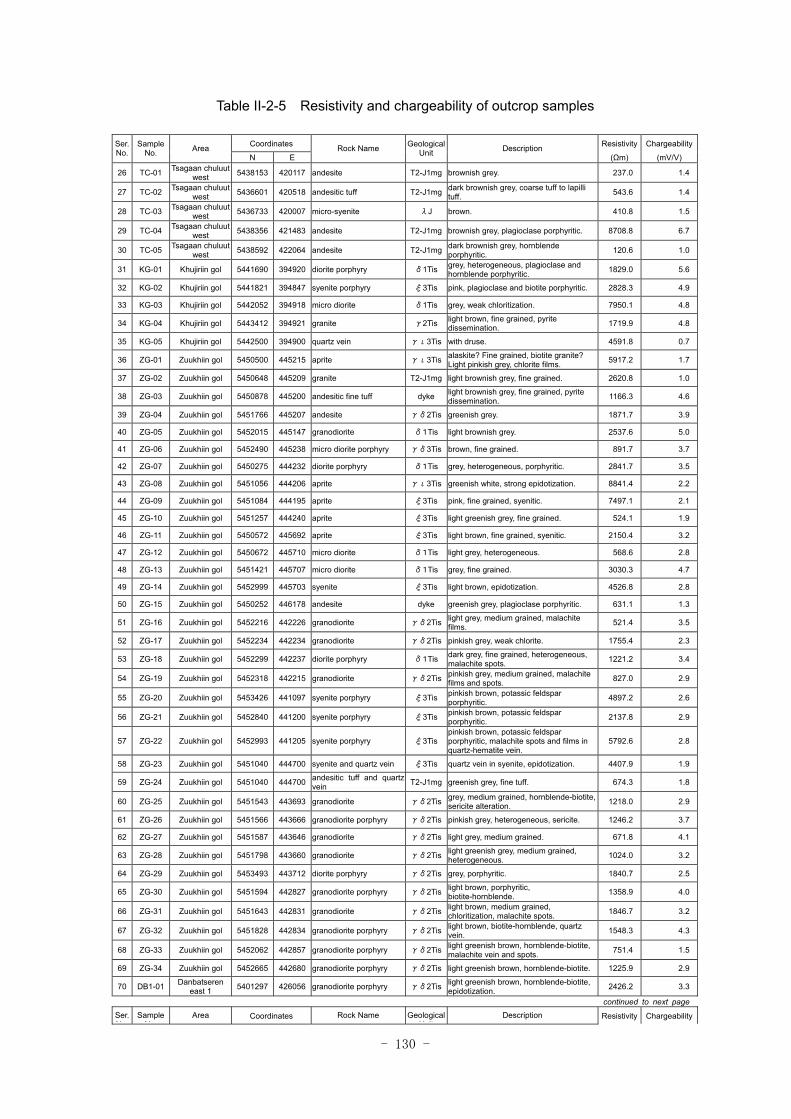
- 130 -
Table II-2-5 Resistivity and chargeability of outcrop samples
Coordinates Resistivity ChargeabilitySer. No.
Sample No. Area
N E Rock Name Geological
Unit Description (Ωm) (mV/V)
26 TC-01 Tsagaan chuluut west 5438153 420117 andesite T2-J1mg brownish grey. 237.0 1.4
27 TC-02 Tsagaan chuluut west 5436601 420518 andesitic tuff T2-J1mg dark brownish grey, coarse tuff to lapilli
tuff. 543.6 1.4
28 TC-03 Tsagaan chuluut west 5436733 420007 micro-syenite λJ brown. 410.8 1.5
29 TC-04 Tsagaan chuluut west 5438356 421483 andesite T2-J1mg brownish grey, plagioclase porphyritic. 8708.8 6.7
30 TC-05 Tsagaan chuluut west 5438592 422064 andesite T2-J1mg dark brownish grey, hornblende
porphyritic. 120.6 1.0
31 KG-01 Khujiriin gol 5441690 394920 diorite porphyry δ1Tis grey, heterogeneous, plagioclase and hornblende porphyritic. 1829.0 5.6
32 KG-02 Khujiriin gol 5441821 394847 syenite porphyry ξ3Tis pink, plagioclase and biotite porphyritic. 2828.3 4.9
33 KG-03 Khujiriin gol 5442052 394918 micro diorite δ1Tis grey, weak chloritization. 7950.1 4.8
34 KG-04 Khujiriin gol 5443412 394921 granite γ2Tis light brown, fine grained, pyrite dissemination. 1719.9 4.8
35 KG-05 Khujiriin gol 5442500 394900 quartz vein γι3Tis with druse. 4591.8 0.7
36 ZG-01 Zuukhiin gol 5450500 445215 aprite γι3Tis alaskite? Fine grained, biotite granite? Light pinkish grey, chlorite films. 5917.2 1.7
37 ZG-02 Zuukhiin gol 5450648 445209 granite T2-J1mg light brownish grey, fine grained. 2620.8 1.0
38 ZG-03 Zuukhiin gol 5450878 445200 andesitic fine tuff dyke light brownish grey, fine grained, pyrite dissemination. 1166.3 4.6
39 ZG-04 Zuukhiin gol 5451766 445207 andesite γδ2Tis greenish grey. 1871.7 3.9
40 ZG-05 Zuukhiin gol 5452015 445147 granodiorite δ1Tis light brownish grey. 2537.6 5.0
41 ZG-06 Zuukhiin gol 5452490 445238 micro diorite porphyry γδ3Tis brown, fine grained. 891.7 3.7
42 ZG-07 Zuukhiin gol 5450275 444232 diorite porphyry δ1Tis grey, heterogeneous, porphyritic. 2841.7 3.5
43 ZG-08 Zuukhiin gol 5451056 444206 aprite γι3Tis greenish white, strong epidotization. 8841.4 2.2
44 ZG-09 Zuukhiin gol 5451084 444195 aprite ξ3Tis pink, fine grained, syenitic. 7497.1 2.1
45 ZG-10 Zuukhiin gol 5451257 444240 aprite ξ3Tis light greenish grey, fine grained. 524.1 1.9
46 ZG-11 Zuukhiin gol 5450572 445692 aprite ξ3Tis light brown, fine grained, syenitic. 2150.4 3.2
47 ZG-12 Zuukhiin gol 5450672 445710 micro diorite δ1Tis light grey, heterogeneous. 568.6 2.8
48 ZG-13 Zuukhiin gol 5451421 445707 micro diorite δ1Tis grey, fine grained. 3030.3 4.7
49 ZG-14 Zuukhiin gol 5452999 445703 syenite ξ3Tis light brown, epidotization. 4526.8 2.8
50 ZG-15 Zuukhiin gol 5450252 446178 andesite dyke greenish grey, plagioclase porphyritic. 631.1 1.3
51 ZG-16 Zuukhiin gol 5452216 442226 granodiorite γδ2Tis light grey, medium grained, malachite films. 521.4 3.5
52 ZG-17 Zuukhiin gol 5452234 442234 granodiorite γδ2Tis pinkish grey, weak chlorite. 1755.4 2.3
53 ZG-18 Zuukhiin gol 5452299 442237 diorite porphyry δ1Tis dark grey, fine grained, heterogeneous, malachite spots. 1221.2 3.4
54 ZG-19 Zuukhiin gol 5452318 442215 granodiorite γδ2Tis pinkish grey, medium grained, malachite films and spots. 827.0 2.9
55 ZG-20 Zuukhiin gol 5453426 441097 syenite porphyry ξ3Tis pinkish brown, potassic feldspar porphyritic. 4897.2 2.6
56 ZG-21 Zuukhiin gol 5452840 441200 syenite porphyry ξ3Tis pinkish brown, potassic feldspar porphyritic. 2137.8 2.9
57 ZG-22 Zuukhiin gol 5452993 441205 syenite porphyry ξ3Tis pinkish brown, potassic feldspar porphyritic, malachite spots and films in quartz-hematite vein.
5792.6 2.8
58 ZG-23 Zuukhiin gol 5451040 444700 syenite and quartz vein ξ3Tis quartz vein in syenite, epidotization. 4407.9 1.9
59 ZG-24 Zuukhiin gol 5451040 444700 andesitic tuff and quartz vein T2-J1mg greenish grey, fine tuff. 674.3 1.8
60 ZG-25 Zuukhiin gol 5451543 443693 granodiorite γδ2Tis grey, medium grained, hornblende-biotite, sericite alteration. 1218.0 2.9
61 ZG-26 Zuukhiin gol 5451566 443666 granodiorite porphyry γδ2Tis pinkish grey, heterogeneous, sericite. 1246.2 3.7
62 ZG-27 Zuukhiin gol 5451587 443646 granodiorite γδ2Tis light grey, medium grained. 671.8 4.1
63 ZG-28 Zuukhiin gol 5451798 443660 granodiorite γδ2Tis light greenish grey, medium grained, heterogeneous. 1024.0 3.2
64 ZG-29 Zuukhiin gol 5453493 443712 diorite porphyry γδ2Tis grey, porphyritic. 1840.7 2.5
65 ZG-30 Zuukhiin gol 5451594 442827 granodiorite porphyry γδ2Tis light brown, porphyritic, biotite-hornblende. 1358.9 4.0
66 ZG-31 Zuukhiin gol 5451643 442831 granodiorite γδ2Tis light brown, medium grained, chloritization, malachite spots. 1846.7 3.2
67 ZG-32 Zuukhiin gol 5451828 442834 granodiorite porphyry γδ2Tis light brown, biotite-hornblende, quartz vein. 1548.3 4.3
68 ZG-33 Zuukhiin gol 5452062 442857 granodiorite porphyry γδ2Tis light greenish brown, hornblende-biotite, malachite vein and spots. 751.4 1.5
69 ZG-34 Zuukhiin gol 5452665 442680 granodiorite porphyry γδ2Tis light greenish brown, hornblende-biotite. 1225.9 2.9
70 DB1-01 Danbatseren east 1 5401297 426056 granodiorite porphyry γδ2Tis light greenish brown, hornblende-biotite,
epidotization. 2426.2 3.3
continued to next page
Ser. N
Sample N
Area Coordinates Rock Name GeologicalU it
Description Resistivity Chargeability
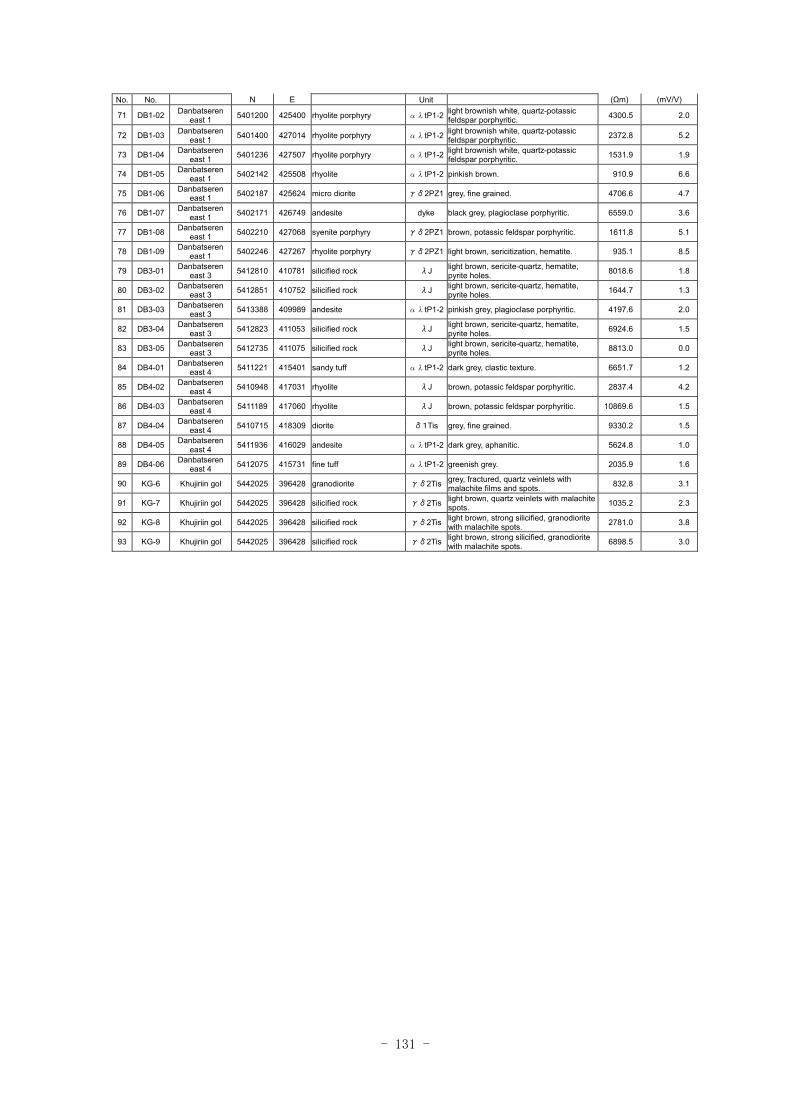
- 131 -
No. No. N E Unit (Ωm) (mV/V)
71 DB1-02 Danbatseren east 1 5401200 425400 rhyolite porphyry αλtP1-2 light brownish white, quartz-potassic
feldspar porphyritic. 4300.5 2.0
72 DB1-03 Danbatseren east 1 5401400 427014 rhyolite porphyry αλtP1-2 light brownish white, quartz-potassic
feldspar porphyritic. 2372.8 5.2
73 DB1-04 Danbatseren east 1 5401236 427507 rhyolite porphyry αλtP1-2 light brownish white, quartz-potassic
feldspar porphyritic. 1531.9 1.9
74 DB1-05 Danbatseren east 1 5402142 425508 rhyolite αλtP1-2 pinkish brown. 910.9 6.6
75 DB1-06 Danbatseren east 1 5402187 425624 micro diorite γδ2PZ1 grey, fine grained. 4706.6 4.7
76 DB1-07 Danbatseren east 1 5402171 426749 andesite dyke black grey, plagioclase porphyritic. 6559.0 3.6
77 DB1-08 Danbatseren east 1 5402210 427068 syenite porphyry γδ2PZ1 brown, potassic feldspar porphyritic. 1611.8 5.1
78 DB1-09 Danbatseren east 1 5402246 427267 rhyolite porphyry γδ2PZ1 light brown, sericitization, hematite. 935.1 8.5
79 DB3-01 Danbatseren east 3 5412810 410781 silicified rock λJ light brown, sericite-quartz, hematite,
pyrite holes. 8018.6 1.8
80 DB3-02 Danbatseren east 3 5412851 410752 silicified rock λJ light brown, sericite-quartz, hematite,
pyrite holes. 1644.7 1.3
81 DB3-03 Danbatseren east 3 5413388 409989 andesite αλtP1-2 pinkish grey, plagioclase porphyritic. 4197.6 2.0
82 DB3-04 Danbatseren east 3 5412823 411053 silicified rock λJ light brown, sericite-quartz, hematite,
pyrite holes. 6924.6 1.5
83 DB3-05 Danbatseren east 3 5412735 411075 silicified rock λJ light brown, sericite-quartz, hematite,
pyrite holes. 8813.0 0.0
84 DB4-01 Danbatseren east 4 5411221 415401 sandy tuff αλtP1-2 dark grey, clastic texture. 6651.7 1.2
85 DB4-02 Danbatseren east 4 5410948 417031 rhyolite λJ brown, potassic feldspar porphyritic. 2837.4 4.2
86 DB4-03 Danbatseren east 4 5411189 417060 rhyolite λJ brown, potassic feldspar porphyritic. 10869.6 1.5
87 DB4-04 Danbatseren east 4 5410715 418309 diorite δ1Tis grey, fine grained. 9330.2 1.5
88 DB4-05 Danbatseren east 4 5411936 416029 andesite αλtP1-2 dark grey, aphanitic. 5624.8 1.0
89 DB4-06 Danbatseren east 4 5412075 415731 fine tuff αλtP1-2 greenish grey. 2035.9 1.6
90 KG-6 Khujiriin gol 5442025 396428 granodiorite γδ2Tis grey, fractured, quartz veinlets with malachite films and spots. 832.8 3.1
91 KG-7 Khujiriin gol 5442025 396428 silicified rock γδ2Tis light brown, quartz veinlets with malachite spots. 1035.2 2.3
92 KG-8 Khujiriin gol 5442025 396428 silicified rock γδ2Tis light brown, strong silicified, granodiorite with malachite spots. 2781.0 3.8
93 KG-9 Khujiriin gol 5442025 396428 silicified rock γδ2Tis light brown, strong silicified, granodiorite with malachite spots. 6898.5 3.0
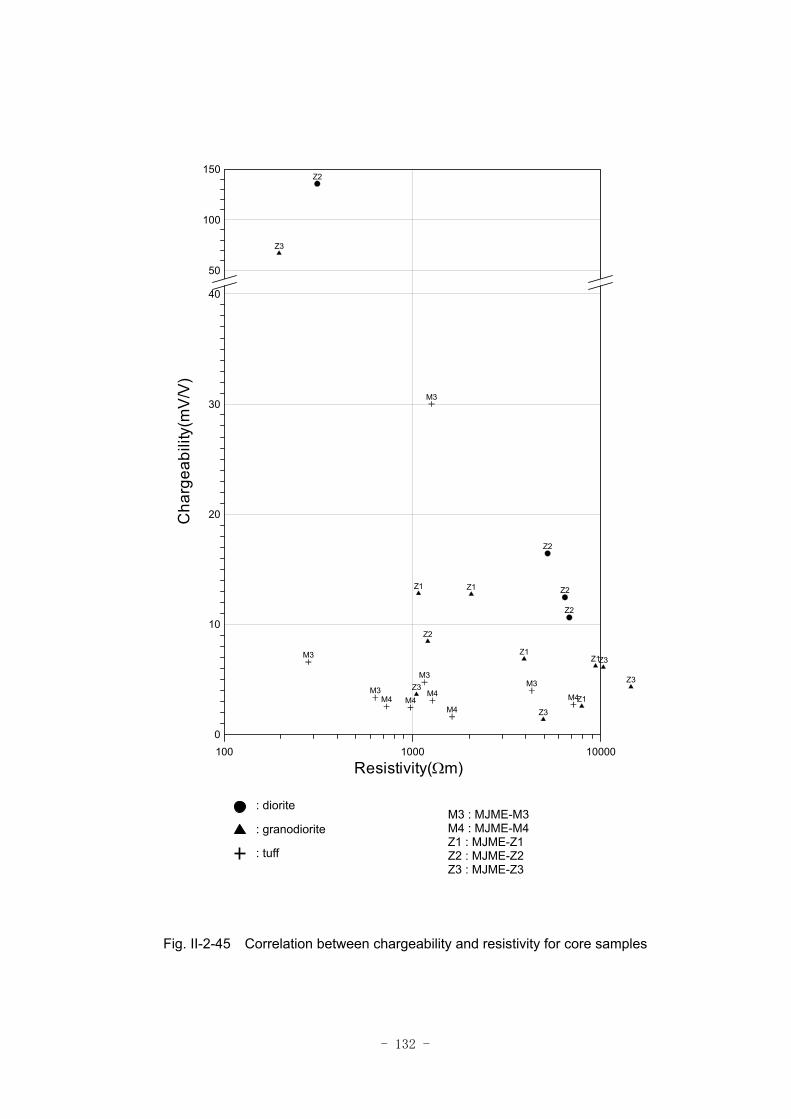
- 132 -
Fig. II-2-45 Correlation between chargeability and resistivity for core samples
100 1000 10000
Resistivity(Ωm)
0
10
20
30
40
50
100
150C
harg
eabi
lity(
mV
/V)
Z2
Z2
Z2
Z2Z1 Z1
Z1Z1
Z1
Z2
Z3
Z3
Z3
Z3
Z3 M3M3
M3
M3
M3M4M4 M4M4
M4
: diorite
: granodiorite
: tuff
M3 : MJME-M3 M4 : MJME-M4 Z1 : MJME-Z1 Z2 : MJME-Z2 Z3 : MJME-Z3
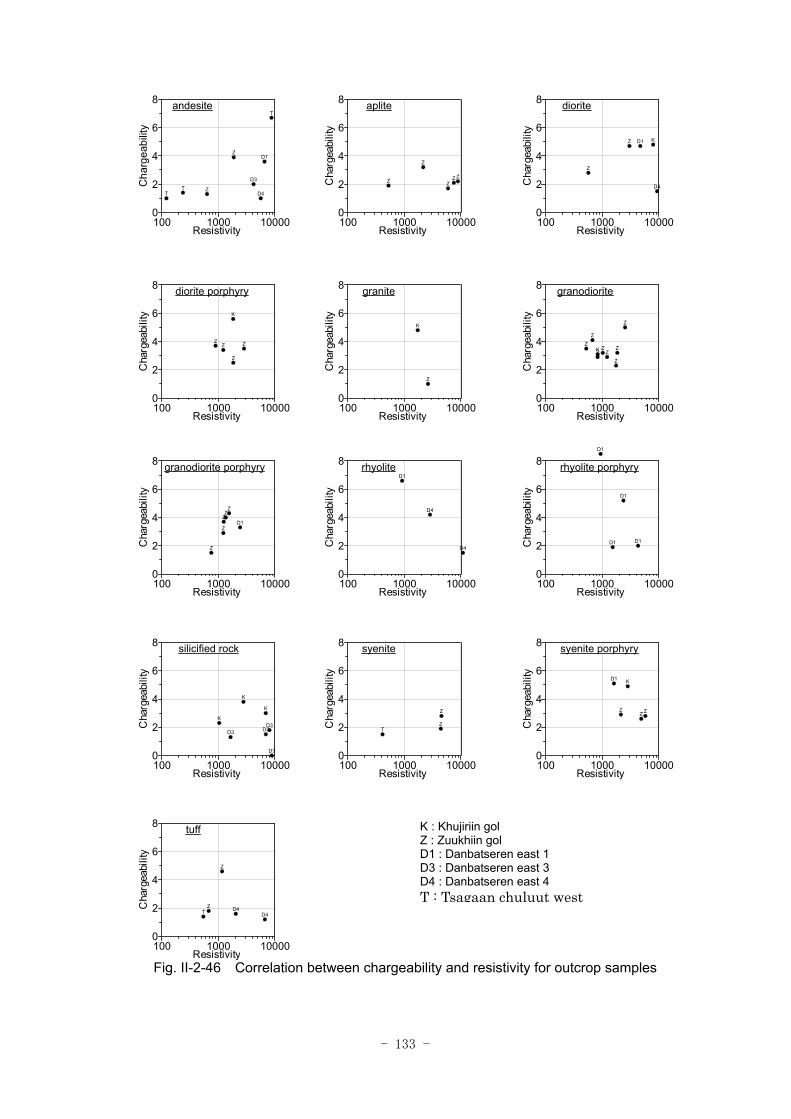
- 133 -
Fig. II-2-46 Correlation between chargeability and resistivity for outcrop samples
100 1000 10000Resistivity
0
2
4
6
8
Cha
rgea
bilit
y
T
T
T
Z
Z
D1
D3
D4
andesite
100 1000 10000Resistivity
0
2
4
6
8
Cha
rgea
bilit
y
ZZZZ
Z
aplite
100 1000 10000Resistivity
0
2
4
6
8
Cha
rgea
bilit
y
K
Z
Z D1
D4
diorite
100 1000 10000Resistivity
0
2
4
6
8
Cha
rgea
bilit
y K
Z ZZ
Z
diorite porphyry
100 1000 10000Resistivity
0
2
4
6
8
Cha
rgea
bilit
yK
Z
granite
100 1000 10000Resistivity
0
2
4
6
8
Cha
rgea
bilit
y
Z
Z
ZZ Z
Z
Z ZK
granodiorite
100 1000 10000Resistivity
0
2
4
6
8
Cha
rgea
bilit
y
ZZ
Z
Z
ZD1
granodiorite porphyry
100 1000 10000Resistivity
0
2
4
6
8
Cha
rgea
bilit
y
D1
D4
D4
rhyolite
100 1000 10000Resistivity
0
2
4
6
8
Cha
rgea
bilit
yD1
D1
D1
D1
rhyolite porphyry
100 1000 10000Resistivity
0
2
4
6
8
Cha
rgea
bilit
y
D3D3 D3
D3
K
K
K
silicified rock
100 1000 10000Resistivity
0
2
4
6
8
Cha
rgea
bilit
y
TZ
Z
syenite
100 1000 10000Resistivity
0
2
4
6
8
Cha
rgea
bilit
y
ZZ Z
D1 K
syenite porphyry
100 1000 10000Resistivity
0
2
4
6
8
Cha
rgea
bilit
y
T
Z
ZD4
D4
tuff K : Khujiriin gol Z : Zuukhiin gol D1 : Danbatseren east 1 D3 : Danbatseren east 3 D4 : Danbatseren east 4 T : Tsagaan chuluut west
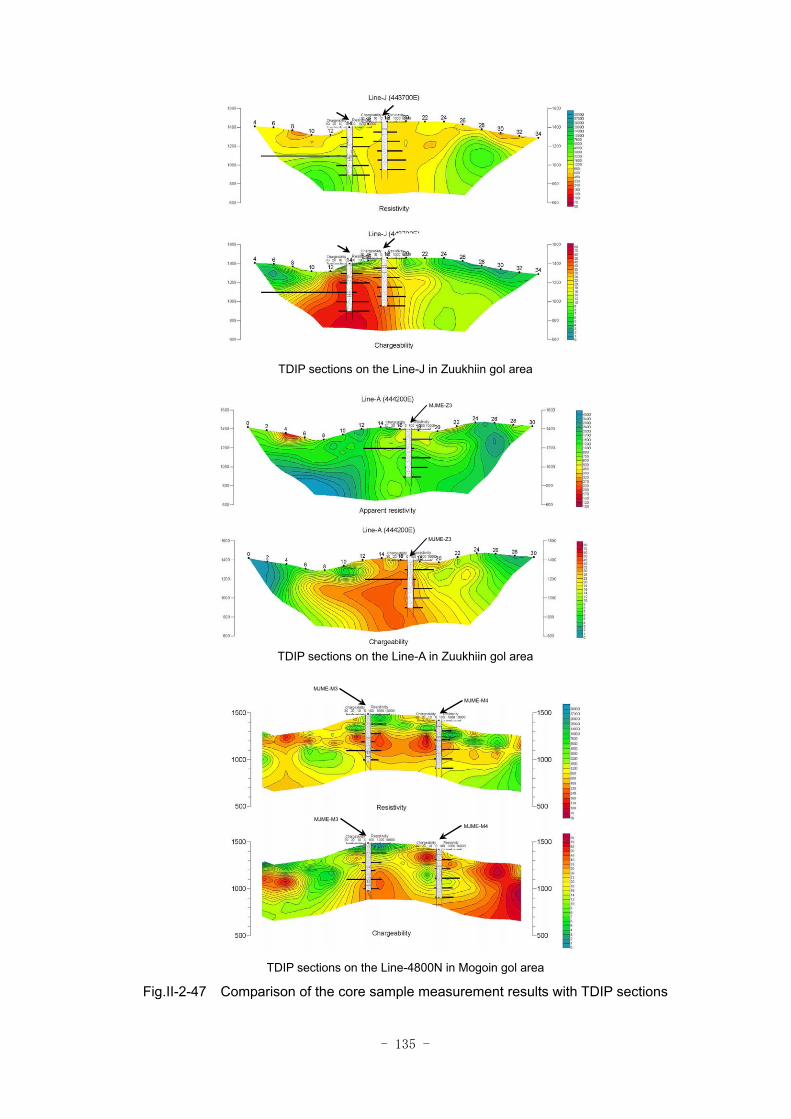
- 135 -
TDIP sections on the Line-J in Zuukhiin gol area
TDIP sections on the Line-A in Zuukhiin gol area
TDIP sections on the Line-4800N in Mogoin gol area
Fig.II-2-47 Comparison of the core sample measurement results with TDIP sections
MJME-Z3
MJME-Z3
MJME-M3
MJME-M4
MJME-M3MJME-M4
- 137 -
2-6 Further Considerations
The results of the geophysical survey at Khujiriin gol area and Zuukhiin gol area are considered as
follows.
2-6-1 Khujiriin gol area
Fig.II-2-48 shows compiled map of geophysical survey in Khujiriin gol area, indicating high
resistivity zone over 1000Ωm, high chargeability zone over 6mV/V at the depth of 100m and low
magnetic anomaly zone under 59700nT detected by the airborne magnetic survey. Judging from the
chargeability value, there is little possibility of existence of porphyry copper ore in this area. According
to fig.II-2-48, high resistivity is distributed around the quartz veinlet with copper recognized in the
southern part of the area. Slightly high chargeability is distributed partially in this high resistivity zone.
It is considered to reflect that some sulfide is accompanied by the quartz veinlet. This high resistibity
zone shifts to north in deeper part, therefore the quartz veinlet is estimated to incline northward. High
resistivity and high chargeability is also recognized in the northwestern part (northern edge of the line
E) and in the northeastern part ( station 22 to 24 on the line C).
The IP anomaly corresponding to the quartz veinlet is not clear because the dipole length is too long
to detect veinlet with suitable resolution. It is considered generally that a range of anomaly distribution
caused by veinlet is smaller than that by porphyry copper ore. Therefore, a detailed survey using shorter
length dipole is effective to detect veinlet clearly.
Below the depth of 150m, high resistivity is dominant in the eastern part of the area, and resistivity
structure changes on the east and west of the stream running through the eastern part of the area from
north to south along the line B.
There is no clear relation between the IP anomaly and the low magnetic anomaly zone.
2-6-2 Zuukhiin gol area
Fig.II-2-49 shows compiled map of geophysical survey in Zuukhiin gol area, indicating low
resistivity zone under 700Ωm, high chargeability zone over 20mV/V at the depth of 200m and low
magnetic anomaly zone under 59400nT detected by the airborne magnetic survey.
In this area, geological, geophysical and drilling survey had been conducted previous to this project,
and IP anomaly and mineralization had been recognized. In this survey, TDIP survey was carried out on
12 lines set up inside and outside of previous survey area in order to grasp the whole feature of the IP
anomaly.
As the result of the survey, it was found that the IP anomaly extends eastward widely. At the depth
of 200m, the range of high chargeability zone over 20mV/V extends 4km in E-W direction and 2km in
N-S, and it is considered to reflect large scale mineralization. It seems that this high chargeability zone
consists of three parts. According to the plane map at the depth of 200m, high chargeability zones over
30mV/V are recognized around the stations 10 to 18 on the lines F to I, the stations 20 to 28 on the lines
G to F and the stations 12 to 18 on the lines L to K. Low resistivity zone is recognized surrounded by
these high chargeability zones. According to the 2D analysis sections of lines K, F, J and A, low
- 138 -
resistivity is distributed continuously from shallow to deep part. Outcrop samples for electrical
measurements gathered within this low resistivity zone are granodiorite and granodiorite porphyry, and
some samples show low resistivity below 1000Ωm. The high chargeability zone corresponds to the area
underlain by granite of Selenge Complex.
Drilling survey was conducted at the stations 14 and 18 on the line J and the station 17 on the line A.
Fig.II-2-50 shows S, Fe and Cu grade of core samples corresponding to 2D analysis sections. There is a
positive correlation between the grade of sulfur and chargeability, and it is considered that high
chargeability reflects large amount of sulfide in this area. Metallic mineral such as iron and copper is
thought to be a factor to decrease resistivity, but there is no remarkable correlation between the grade of
iron or copper and resistivity. Not only metallic mineral but also water content, argillization and
alteration can be a factor to decrease resistivity. Therefore, it is difficult to compare resistivity with the
amount of metallic mineral simply.
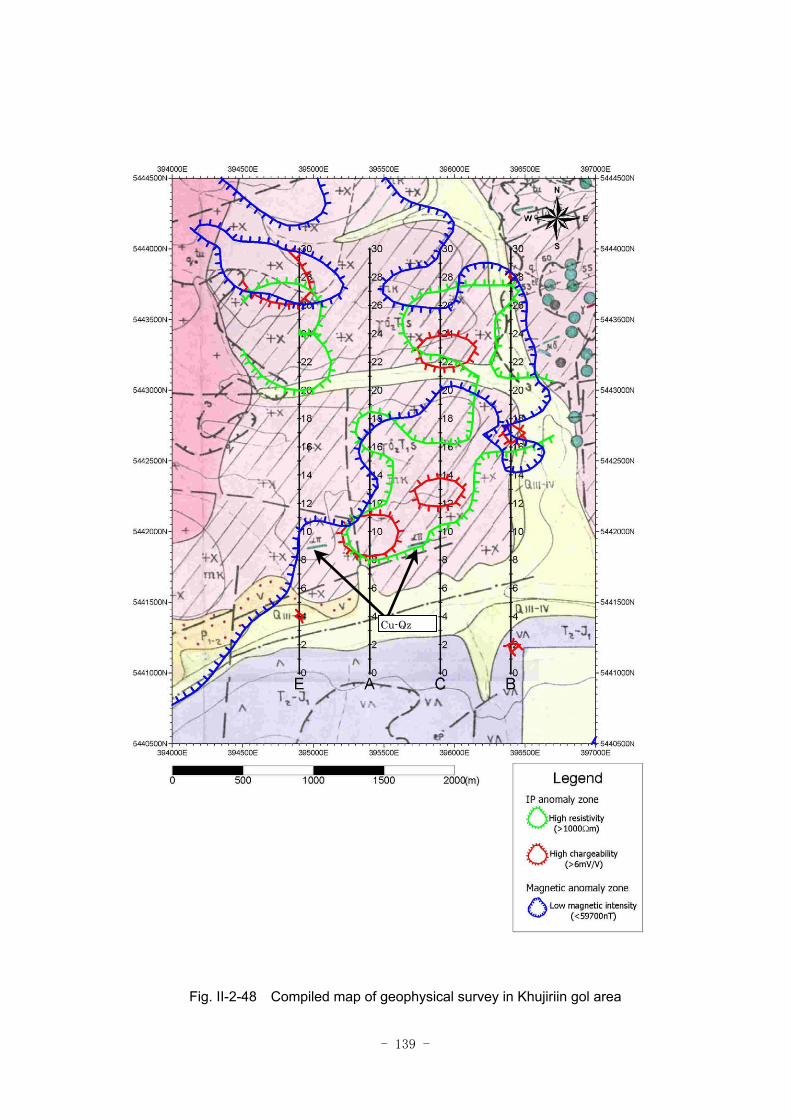
- 139 -
Fig. II-2-48 Compiled map of geophysical survey in Khujiriin gol area
Cu-Qz
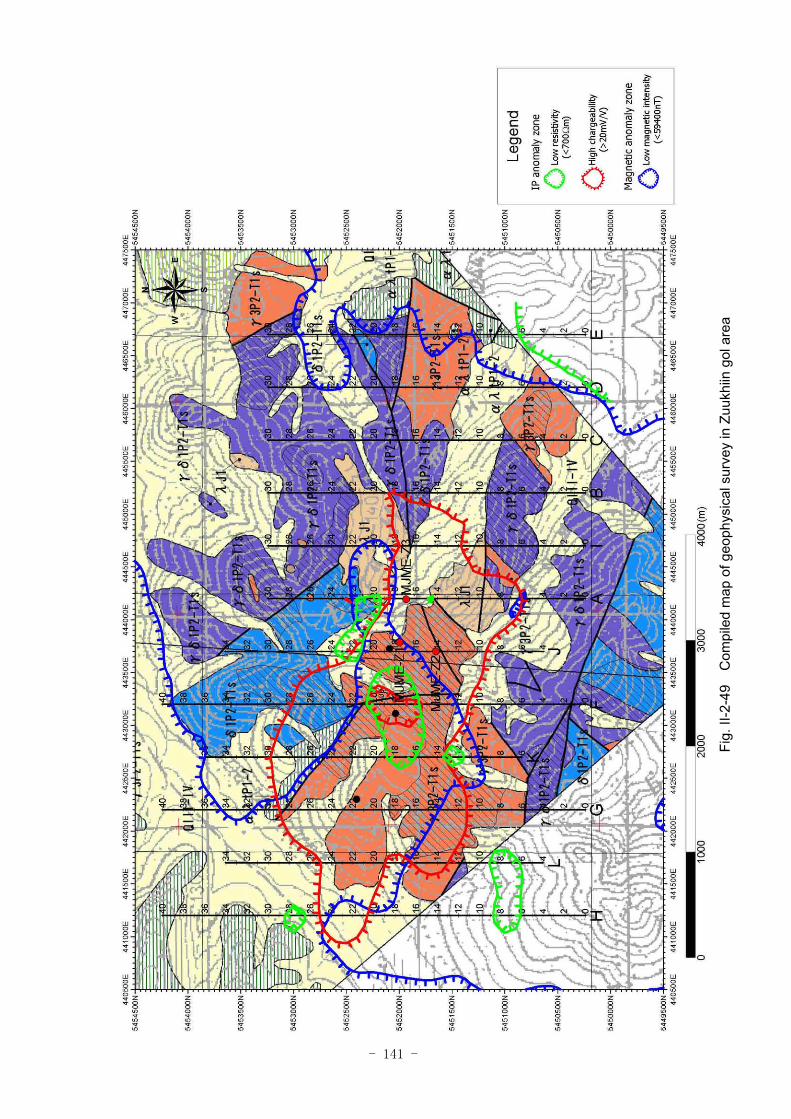
- 141 -
Fig.
II-2
-49
Com
pile
d m
ap o
f geo
phys
ical
sur
vey
in Z
uukh
iin g
ol a
rea
- 141 -
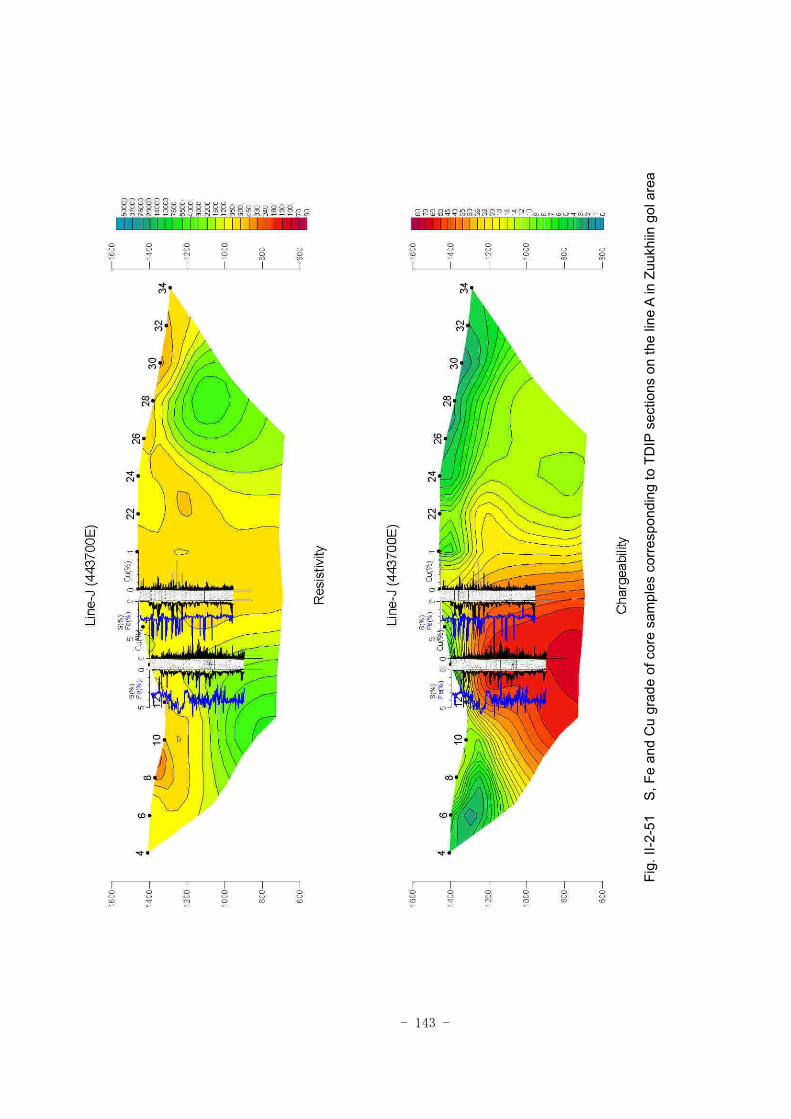
- 142 -
Fig.
II-2
-51
S, F
e an
d C
u gr
ade
of c
ore
sam
ples
cor
resp
ondi
ng to
TD
IP s
ectio
ns o
n th
e lin
e A
in Z
uukh
iin g
ol a
rea
- 143 -
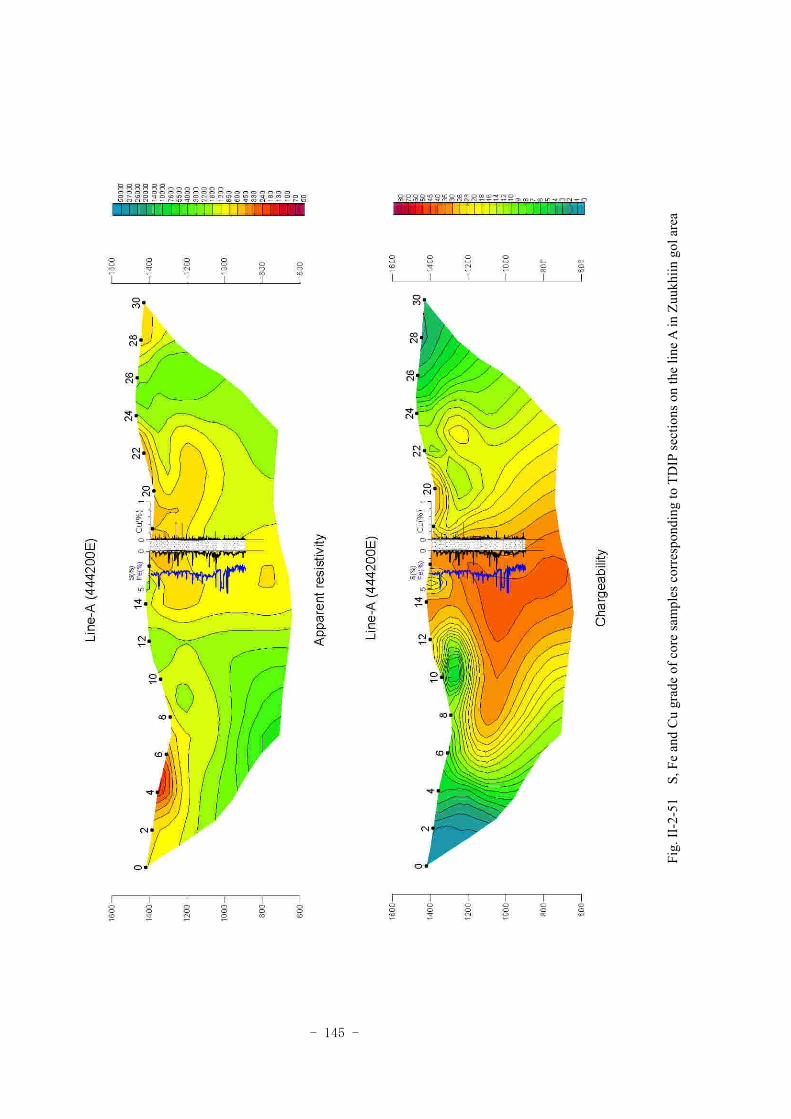
- 142 -
Fig.
II-2
-51
S, F
e an
d C
u gr
ade
of c
ore
sam
ples
cor
resp
ondi
ng to
TD
IP se
ctio
ns o
n th
e lin
e A in
Zuu
khiin
gol
are
a
- 145 -