Chapter 2 Sources, Types & Distribution of Air Pollution.
163
-
date post
19-Dec-2015 -
Category
Documents
-
view
228 -
download
1
Transcript of Chapter 2 Sources, Types & Distribution of Air Pollution.

Chapter 2
Sources, Types & Distribution of Air Pollution
Major Sources of Air Pollution
• The number of different types of pollution sources in modern society is almost endless.
• We look at only the most significant sources of air pollutants.
• Mobile (50 - 70%), and stationary sources. • 15-25% from heavy industrial stationary sources
and as much as 25% from other stationary sources.

Major Sources of Air Pollution
Emissions (106 tonnes / year)
Source CO Particles H/C’s NOx SOx Total %
Transport 40.7 1.4 6.0 8.4 0.9 57.4 44.9
Stationary fuel combustion
7.2 1.8 2.3 10.3 16.4 38.0 29.7
Industrial Processes
4.7 2.5 8.3 0.6 3.1 19.2 15.0
Solid waste disposal
1.7 0.3 0.6 0.1 0 2.6 2.0
Miscellaneous 7.1 1.0 2.4 0.1 0 10.6 8.3
Total 61.4 7.0 19.6 19.5 20.4 127.8
% 48.0 5.5 15.3 15.3 15.9 100

Major Sources of Air Pollution
• The table is from USA. The total amount emitted in Australia will be far less
• A significant reduction in the amounts of CO and H/C’s when compared to the previous decade
• levels of other pollutants has been steady or shown only a slight increase
Transportation Combustion Sources
• The most important transportation sources at present are major polluters
• Motor vehicles CO, CO2 H/C’s, NOx and small amounts of SOx
• Motor vehicle exhaust accounts for 40% of all H/C air pollutants and 90% of all NO2

Transportation Combustion Sources
• Motor vehicles pollutants react to form more reactive (and dangerous) pollutants such as photochemical smog.
• diesel fuel = a source of very dangerous H/C’s (PAH’s).
• Pb has decreased in significance, and according to the latest national SoE report, is no longer considered a problem
• vehicles running on unleaded fuels emit lower levels of NOx and SOx

Transportation Combustion Sources
• Aircraft and trains are less significant sources of pollution compared with road transport vehicles.
• Aircraft run on kerosene, burnt efficiently, but they fly very high in the atmosphere the pollutants – most of which are H/C’s – are spread and diluted in the upper atmosphere. DISCUSS NEW PROBLEM
• Trains mostly run on electricity = contribute very little to air pollution (except CO2 & some ozone)

Stationary Combustion Sources
• Some of the more important sources include– furnaces - and their combustion of
carbonaceous fuels– boilers– ovens and dryers– process systems which produce volatile
chemicals, gases, etc.
Stationary Combustion Sources
• Solvent evaporation (fugitive) from;– solvent-based materials– leaking pipe joints– maintenance work– spills, unloading /loading procedures
• an important part of photochemical pollution
Stack Emissions
• Emission of waste gases, fumes, vapours and smokes to the atmosphere are usually by the use of a smoke stack or chimney.
• stack emission becomes a plume in the atmosphere.
• The plume is an area of concentrated waste emissions that slowly become diluted with the other atmospheric gases.

Stack Emissions
How dilution happens depends on many factors • Nature of the waste emission
– Toxic emissions need to be very dilute • Volume of the waste
– Is emission constant or only at certain times in the process. • Local topography
– Many cities located in areas surrounded by hills or mountains. – low wind and cooler temperatures = photochemical smog.

Stack Emissions
• Prevailing climate– direction of prevailing winds – e.g. Queenstown, Tasmania
• The Existing Atmosphere – In very polluted cities, more stack emissions
not desirable. – e.g. build power stations in the country away
from NOx from cars

Plume Behaviour
• Effects of plumes are considered local within 500 metres of the stack, and regional beyond this.
• Mixing or dispersion of the waste gases and products into the atmosphere = plume behaviour.
Types of Plumes
• Fanning plumes
• Looping plumes
• Coning plumes
• Fumigating
• Lofting
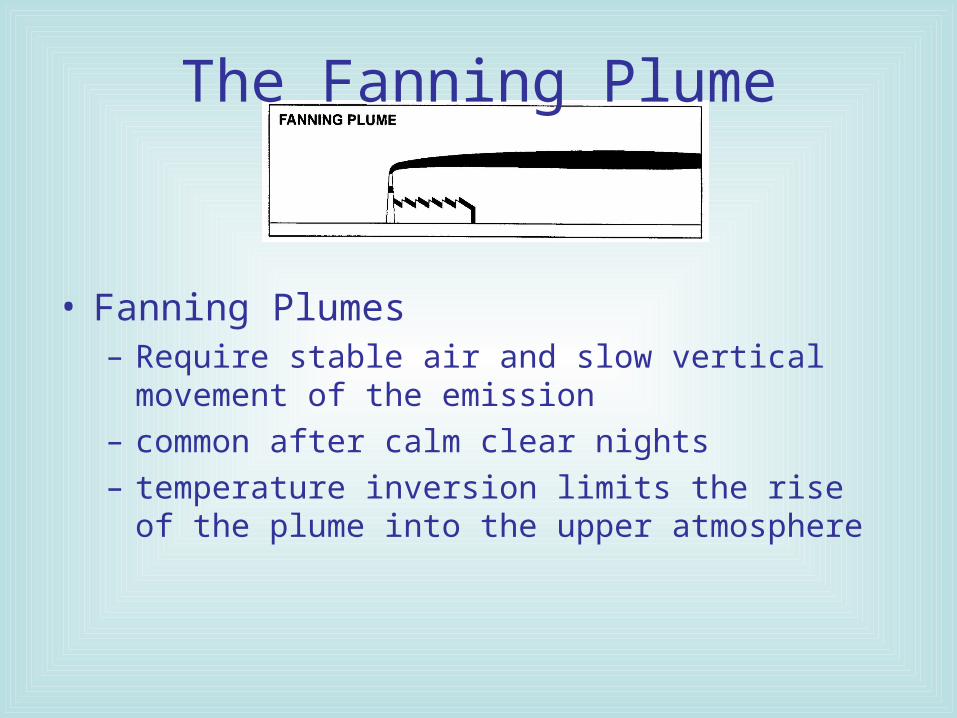
The Fanning Plume
• Fanning Plumes– Require stable air and slow vertical movement of the
emission– common after calm clear nights– temperature inversion limits the rise of the plume into
the upper atmosphere

The Fanning Plume
– creates a higher conc. of polluted air at lower levels – exists for several hours– Commonly seen from Eraring Power station
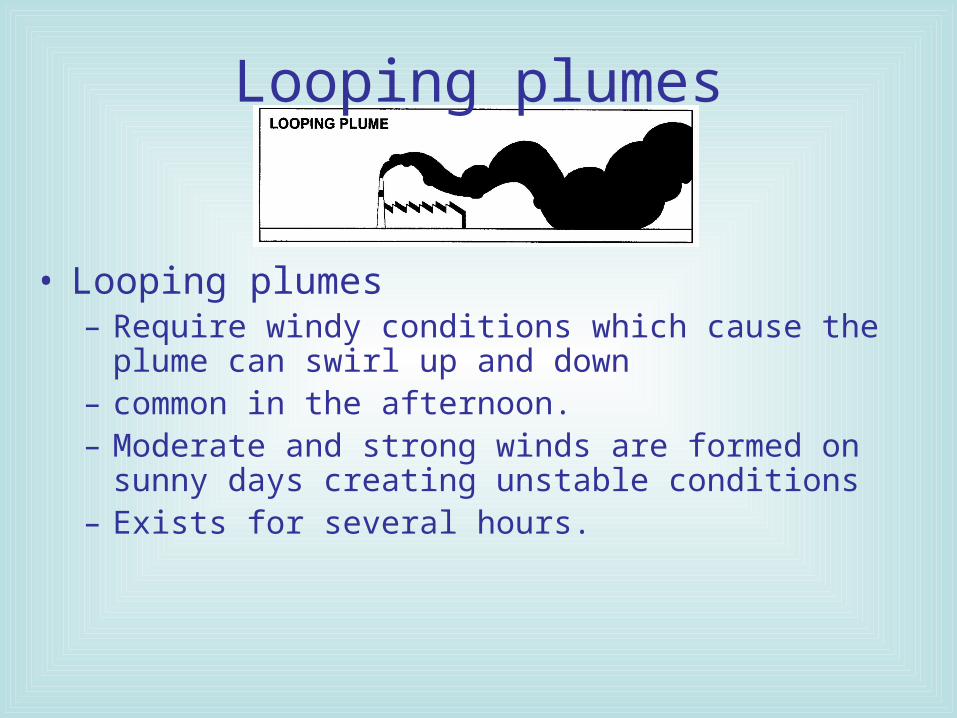
Looping plumes
• Looping plumes– Require windy conditions which cause the plume can
swirl up and down – common in the afternoon. – Moderate and strong winds are formed on sunny days
creating unstable conditions– Exists for several hours.
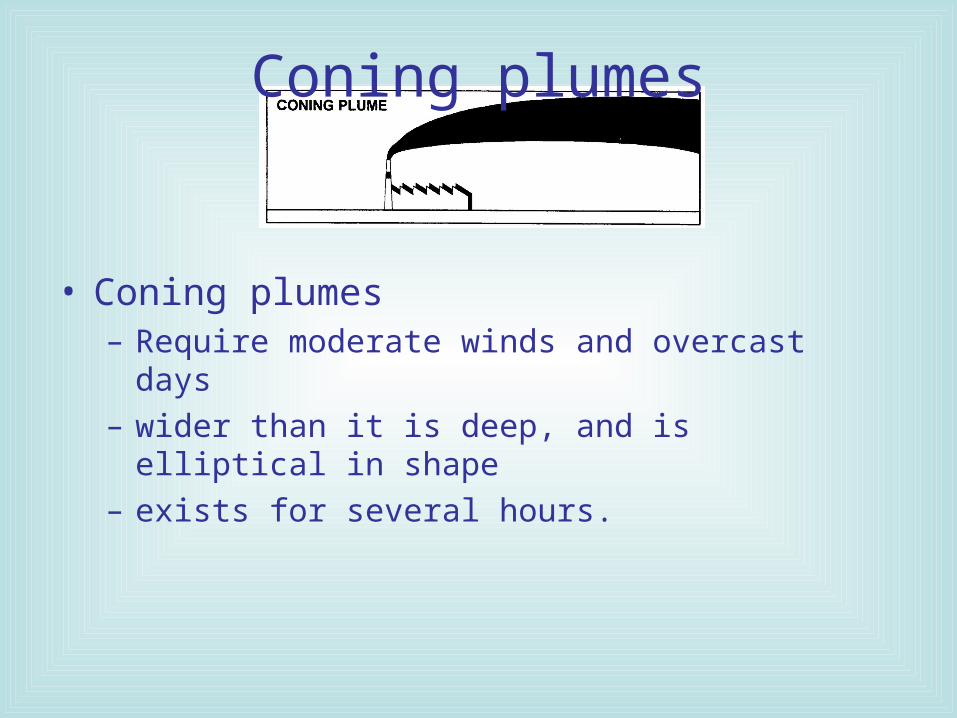
Coning plumes
• Coning plumes– Require moderate winds and overcast days – wider than it is deep, and is elliptical in shape – exists for several hours.

Fumigating plume
• Fumigating plume– Is short-lived (fraction of an hour), but reaches the earth's
surface.– occur when the conditions move from stable to unstable– A fanning plume develops overnight under stable
conditions but as the day heats up, unstable air is produced

Fumigating Plume
• Fumigating plume (cont)– unstable air causes the plume to move up and down -
can cause localised pollution. – become looping or coning plumes as the air conditions
stabilise.

Lofting plume
• Lofting plume– When plume is above the inversion layer (or there is
no inversion), it becomes a lofting plume. – Normal wind direction and speed will disperse the
plume into the atmosphere without effect from ground warming or cooling.

Stack emissions
• factors used to establish the amount of stack emission allowed, and its conc. to the atmosphere include:– smoke stack (chimney) height,
– local topography,
– temperature,
– emission rates,
– chemical reactivity, and
– existing air pollution problems
– wind allow rapid dispersal of pollutants.
Fugitive Emissions
• Fugitive emissions are emissions which escape from a process rather than being discharged
• They often have serious consequences because their levels are not monitored and they are untreated when entering the atmosphere

Fugitive Emissions
• There are many sources of fugitive emissions including:– industrial sources (particulate fluorides from
aluminium smelters)– small business (e.g. dry cleaning solvents)– agriculture (e.g. dust from ploughing)– natural sources (e.g. volcanoes, forest fires)
Fugitive emissions
• Often the result of poor maintenance of plant and equipment
• Can be eliminated by SOP’s that involve timed maintenance and quality control checks
• Some are almost impossible to control (e.g. natural sources)

Types of air pollutants
• There are four types of air pollutants;– particulate pollutants and – gaseous pollutants, – odour and – noise.
Primary vs Secondary pollutants
• Not all of the pollutants found in the atmosphere are the direct result of emissions.
• Many pollutants arise from chemical reactions in the atmosphere with other substances or light (photochemical reactions).
1° vs 2° pollutants
• Pollutant substances that are directly emitted into the atmosphere = primary pollutants.
• Substances not directly emitted into the atmosphere, formed by chemical reactions in the atmosphere = secondary pollutants.
Particulate Pollutants
• Very small solid or liquid particles
• Individual particles may vary in size, geometry, chemical composition and physical properties
• May be of natural origin (pollen or sea spray) or man made (dust, fume and soot)

Particulate Pollutants
• Provide a reactive surface for gases and vapours in the formation of secondary pollutants
• Particles also diffuse light reducing visibility
• Come from stack emissions, dusty processes, unsealed roads, construction work and many other sources
Particulate Pollutants
• Dusts– large solid particles
• Fume– solid particles (metallic oxides) formed by
condensation of vapours from a chemical reaction process or physical separation process
Particulate Pollutants• Mist
– liquid particles formed by condensation of vapours or chemical reaction.
SO3 + H2O H2SO4
• Smoke– solid particles formed as a result of incomplete
combustion of carbonaceous materials. • Spray
– a liquid particle formed by the atomisation of a parent liquid.
Particle Size
• Particles range in size from 0.005 - 500m.
• Smallest of these are clusters of molecules whilst the largest are easily visible with the naked eye.
• Sizes given are not the physical size, but rather the aerodynamic equivalent diameter which relates the particle to the behaviour of an equivalent spherical particle.

Particle Size
• Particles less than 1m in diameter behave like gases (remain suspended, may coalesce, move in fluid streams),
• Larger particles act like solids (affected by gravity, don’t stay suspended long, don’t coalesce).
• Smaller particles generally derive from chemical reactions, whereas the larger particles (10m or greater) are usually generated mechanically and tend to be basic.

Particle Size
• Smaller particles most dangerous to health, • In urban areas there is an approx. even
distribution between fine and coarse particles, this is weather dependent.
• Calm conditions more fine particles than coarse, • Fine particulate matter spread over much
greater distances
Particle behaviour in the atmosphere
• Particles can undergo many physical and chemical changes;– grow in size, – absorb or desorb gases from their surfaces, – change electrical charge,

Particle behaviour in the atmosphere
• Particles can undergo many physical and chemical changes;– collide or adhere with other particles, – absorb water. – changes the particle size and affect its
atmospheric lifetime.
Total Suspended Particles (TSP)
• Most particles concentrated into three main size groups
• Larger particles around 10m in size
• Smaller particles in size groups centred around 0.2 and 0.02m.
TSP
• Only particles of <10m penetrate into the human lung
• Analyse air for only this fraction to estimate its potential danger to human health = PM10 sampling.
• Particles <2.5m in size can penetrate deep into the lung tissue and are especially dangerous = PM2.5 sampling
Organic Particulates
• PAH most significant• Found on soot and dust particles, and are
formed from smaller H/C’s at high temperatures (coal furnace effluent may contain 1mg/m3 of PAH cigarette smoke 0.1mg/m3)
• Urban atmospheres PAH levels ~20 ug/m3 but is highly variable

Lead Particulates
• Was the most serious atmospheric heavy-metal pollutant, but is no longer
• primary source was exhaust from vehicles
Gaseous Pollutants
• CO, H/C’s, H2S, NOx, O3 and other oxidants, and SOx
• Measured in micrograms per cubic meter (ug/m3) or parts per million (ppm).
• 1 ppm = 1 volume of gaseous pollutant
• 106 volumes of (pollutant + air)
Gaseous Particulates
• At 25°C and 101.3 kPa the relationship between ppm and ug/m3 is;
ug/m3 = ppm x molecular weight x 103
24.5
Carbon Monoxide
• a colourless, odourless and tasteless gas. • atmosphere has an avg. burden of around 530
million tonnes (about 0.00001%), • avg. residence time of 36 to 100 days. • Much of the CO in the atmosphere occurs
naturally from volcanic eruptions, photolysis of methane and terpenes, decomposition of chlorophyll, forest fires and microbial action in oceans.

Carbon Monoxide
• Anthropogenic sources = transportation, solid waste disposal, agricultural burning, steel production, etc.
• emitted directly into the atmosphere through the inefficient combustion of fossil fuels.
• removed by reactions in the atmosphere which change it to CO2 and by absorption by plants and soil micro-organisms.

Carbon Monoxide
• It is removed by reactions in the atmosphere which change it to CO2 and by absorption by plants and soil micro-organisms.
• In combustion, carbon is oxidised to CO2 in a two step process.
2C + O2 2CO
2CO + O2 2CO2

Carbon Monoxide
• Typical conc's– Background levels of CO tend to vary greatly
depending on location. – avg. global levels = 0.2ppm. – Peak conc's during autumn months when large
volumes are generated by the decomposition of chlorophyll in leaves.
– In urban areas = diurnal conc. pattern


Carbon Monoxide
• The internal combustion engine contributes much of the anthropogenic CO (up to 90% in the Sydney region)
• Maximum levels of this gas tend to occur in congested urban areas at times when the maximum number of people are exposed, such as during rush hours.
• At such times, CO levels in the atmosphere may become as high as 50-100ppm.
Carbon Dioxide
• Since the Clean Air Act in NSW in 1972 (and subsequent acts), the levels of CO in Sydney have dropped from an avg. of 25ppm to around 10ppm
• The accepted standard is 9ppm over an eight-hour period
http://www.environment.nsw.gov.au/air/24hr.htm
Carbon Monoxide
• Sinks– CO is removed from the air mostly by
conversion to CO2
– This may occur through aerial oxidation or through the action of soil micro-organisms
– The reason for very high conc's occurring in urban areas is that high emission rates are combined with a lack of soil
Carbon Dioxide
• Carbon dioxide is produced when organic matter is;– combusted – weathered – biologically decomposed
• It is removed from the atmosphere by plants in photosynthesis and released by biological reactions

• Over hundreds of millions of years CO2 has been withdrawn from the atmosphere and stored in coal, oil and natural gas.
• The intensive use of these fuels has resulted in significant CO2 emissions and an increase of atmospheric conc's
• Since 1958, CO2 values measured at Mauna Loa Observatory in Hawaii have increased from 310 to more than 350ppm.
Carbon Dioxide

Carbon Dioxide
• Significant seasonal variations are also observed to occur in CO2 levels
• This seasonal variability appears to be associated with growing season photosynthetic needs and metabolic releases of CO2 in excess of plant uptake at the end of the growing season.
Carbon Dioxide
• Not all CO2 emitted to the atmosphere from anthropogenic sources contributes to increased atmospheric levels.
• Because of its solubility in water, the oceans are a major sink for CO2, absorbing 50% of all man made emissions.
• The world's forests, particularly tropical forests, also serve as a sink.

Carbon Dioxide
• As a thermal absorber (read greenhouse gas), CO2 prevents some IR emissions from the Earth being radiated back to space
• Greenhouse Effect.
Sulfur Compounds
• A variety of sulfur compounds are released to the atmosphere from both natural and anthropogenic sources
• The most important of these are the sulfur oxides (SOx) and hydrogen sulfide (H2S)
• Significant SOx emissions may occur from volcanic eruptions and other natural sources
• Man made emissions are responsible for much of the atmospheric emissions

Sulfur Oxides
• These are produced by roasting metal sulfide ores and by combustion of fossil fuels containing appreciable inorganic sulfides and organic sulfur
• Of the four known sulfur oxides, only SO2 is found at appreciable levels in the atmosphere.

Sulfur Oxides
• Sulfur trioxide (SO3) is emitted directly into the atmosphere in ore smelting and fossil fuel combustion and is produced by the oxidation of SO2.
• Because it has a high affinity for water, it is rapidly converted to sulfuric acid.
Sulfur Oxides
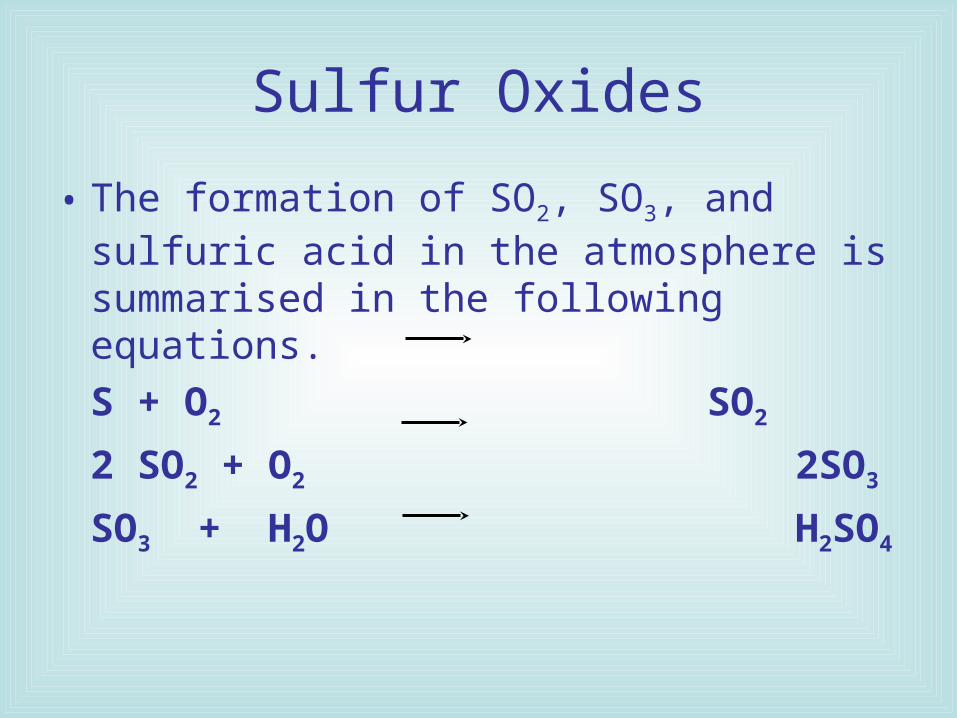
• The formation of SO2, SO3, and sulfuric acid in the atmosphere is summarised in the following equations.
S + O2 SO2
2 SO2 + O2 2SO3
SO3 + H2O H2SO4
Sulfur Dioxide
• Sulfur dioxide may be directly absorbed by water bodies such as the oceans to form sulfurous acid.
• This is one of the sources of acid rain, which has dramatically affected the environment in Europe and North America.

Sulfur Dioxide
• SO2 is an acidic colourless gas which may remain in the atmosphere for periods up to several weeks
• It can be detected by taste and odour in the conc. range of 0.38 - 1.15ppm
• Above 3 ppm, it has a pungent, irritating odour

Sulfur Dioxide
• It is estimated that 65 million tonnes of SO2 per year enter the atmosphere as a result of man's activities, primarily from the combustion of fossil fuels.
• Of these, coal (and oil) is by far the greatest contributor, even in Australia
Sulfur Dioxide
• Background levels of SO2 are very low, about 1ppb
• In urban areas maximum hourly conc's vary from less than 0.1 to more than 0.5ppm.
Sulfur Dioxide
Sinks• SO2 is removed from the atmosphere by both
dry and wet deposition processes. • It is believed that plants are responsible for most
SO2 removal that occurs by dry deposition. • SO2 can also dissolve in water to form a dilute
solution of sulfurous acid (H2SO3). This water can be in clouds, in rain droplets, or at the surface.
Sulfur Dioxide
• A major sink process for SO2 is its gas-phase oxidation to H2SO4 and subsequent aerosol formation by nucleation or condensation
• Sulfuric acid will react with ammonia (NH3) to form a variety of salts
Sulfur Dioxide• About 30% of atmospheric SO2 is converted to
sulfate aerosol • Sulfate aerosols are removed from the atmosphere
by dry and wet deposition processes. – In dry deposition, aerosol particles settle out or impact on
surfaces. – In wet deposition, sulfate aerosol is removed from the
atmosphere by forming rain droplets (in cloud) or being captured by falling rain droplets (below cloud).
• These removal processes are called rainout and washout.
Hydrogen Sulfide
• H2S is a very toxic gas with a characteristic rotten egg odour.
• The principal concerns associated with H2S are its smell (foul) & toxicity (same as HCN)
Hydrogen Sulfide
• Background levels of H2S are approx. 0.05ppb
• Natural sources, which include anaerobic decomposition of organic matter, natural hot springs and volcanoes
• Anthropogenic sources include oil and gas extraction, petroleum refining, paper mills, rayon manufacture, and coke ovens

Hydrogen Sulfide
• The major sink process for H2S is its atmospheric conversion to SO2.
• This SO2 is then removed from the atmosphere in the gas phase or as an aerosol by wet or dry deposition processes.

Nitrogen Compounds
• There are five major gaseous forms of nitrogen in the atmosphere.
• These include – molecular nitrogen (N2), – ammonia (NH3), – nitrous oxide (N2O), – nitric oxide (NO), and – nitrogen dioxide (NO2).
Nitrogen Compounds
• N2 the major gas in the atmosphere.
• N2O present in unpolluted air due to microbial action
• NO and NO2 significant air pollutants
• NH3 not considered a significant man made pollutant, but enormous quantities generated through natural emissions.
Elemental Nitrogen (N2)
• ~78% of the air we breathe
• Relatively inert (unlike O2)
• Significant biological use by microbes
Nitrous Oxide (N2O)• colourless, slightly sweet, non-toxic gas.
• natural part of the atmosphere avg. conc. 0.30ppm.
• used as anaesthetic in medicine and dentistry (laughing gas)
• product of natural soil processes, produced by anaerobic bacteria.
• photolytically dissociates in stratosphere to NO.

Nitric Oxide (NO)
• colourless, odourless, tasteless, relatively non-toxic gas.
• produced naturally by;– anaerobic biological processes in soil and
water, – combustion processes and by photochemical
destruction of N compounds in stratosphere.
Nitric Oxide (NO)
• Major anthropogenic sources include; – automobile exhaust – fossil fuel-fired electric generating stations– industrial boilers – incinerators – home space heaters

Nitric Oxide
• Nitric oxide is a product of high-temperature combustion.
N2 + O2 2NO
Nitrogen Dioxide (NO2)
• light yellow to orange colour at low conc’s and brown at high conc’s.
• pungent, irritating odour , and extremely corrosive especially in wet environments
• toxic - can cause anoxia

Nitrogen Dioxide (NO2)
• Some of the NO2 in air produced by direct oxidation of NO
2NO + O2 2NO2
Nitrogen Dioxide (NO2)
• At low atmospheric NO levels, oxidation is slow, accounts for <25% of NO conversion
• Photochemical reactions involving O3, peroxy radical (RO2) and reactive hydrogen species such as OH, HO2, H2O2, are primary means by which NO is converted to NO2 in the atmosphere.

Nitrogen Dioxide (NO2)
• Other NO2 formation mechanisms
NO + O3 NO2 + O2
RO2 + NO NO2 + RO
HO2 + NO NO2 + OH

Nitrogen Dioxide
• Background conc’s of NO and NO2 are approx. 0.5 and 1ppb respectively
• In urban areas, 1 hour avg. conc’s of NO may reach 1-2ppm, with max NO2 levels of approx. 0.5ppm.
• decay of NO rapid as polluted air moves from urban to rural areas, with conc’s dropping to near background levels.
Nitrogen Dioxide
• Atmospheric NO level related to transport/work cycle.
• Peak conc's observed in early morning hours, with a second smaller peak late in the day (See Figure 2.8).
• Peak morning NO conc's followed several hours later by peak levels of NO2 produced by the chemical and photochemical oxidation of NO.

Nitrogen Dioxide
• Atmospheric levels of NO and NO2 also show seasonal trends
• Emissions of NO greater during winter when there is increased use of heating fuels
• Since the conversion of NO to NO2 is related to solar intensity, higher NO2 levels occur on warm sunny days.

Nitrogen Dioxide
• NOx in vehicle exhausts controlled by legislation as with CO
• catalytic converter in the exhaust system increases reduction of NOx to N2.
• Australian Design Rules limit emission of NOx from exhausts to 1.9g/km
• to maintain the levels in Sydney below the recommended standard of 0.16ppm (1 hour avg.).
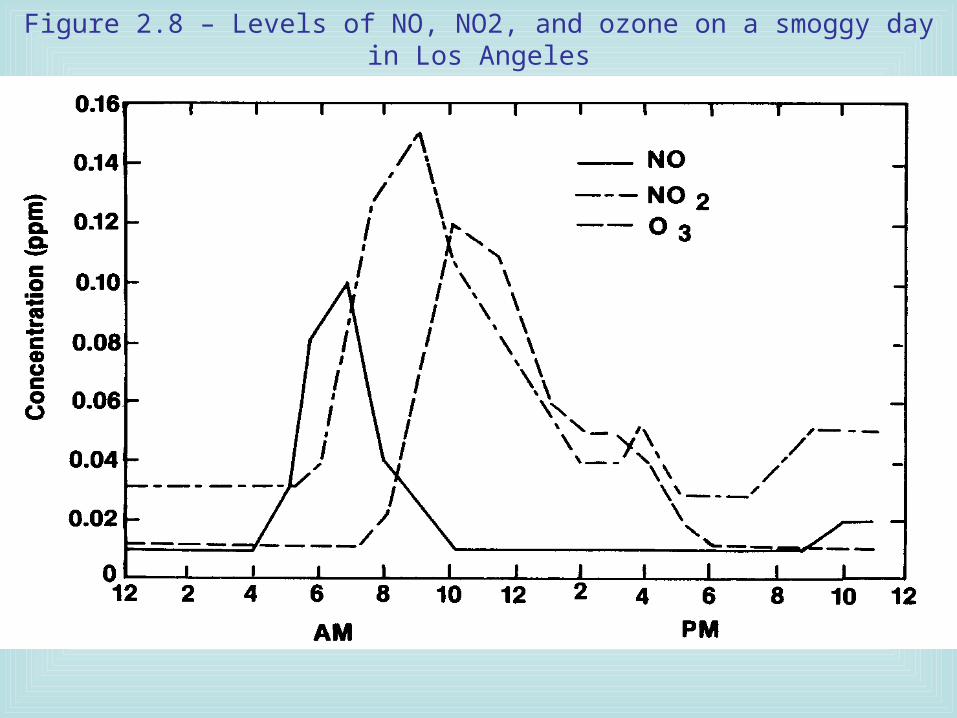
Figure 2.8 – Levels of NO, NO2, and ozone on a smoggy day in Los Angeles
Nitrogen oxides (NOx)
Sinks
• most significant sink for NO is conversion by both direct oxidation and photochemical processes to NO2
• A major sink process for NO2 is its conversion to nitric acid

Nitrogen Oxides (NOx)
OH + NO2 + M HNO3 + MM is an energy-absorbing species (generally O2 or N2). NO2 is also converted to nitric acid
by night-time chemical reactions involving O3.
NO2 + O3 NO3 + O2
NO2+ NO3 N2O5
N2O5 + H2O 2HNO3
Nitrogen Oxides (NOx)
• NO3 is nitrate free radical
• key factor in night-time chemistry
• reaction product of NO2 and NO3 is dinitrogen pentoxide (N2O5) - reacts with water rapidly to produce HNO3

Nitrogen Oxides (NOx)
• Some of the HNO3 in the atmosphere reacts with ammonia (NH3) or other alkaline species to form salts such as NH4NO3
• Nitrate aerosol is generally removed by the dry and wet deposition processes in much the same way as sulfate aerosol
Ammonia (NH3)
• relatively unimportant man made pollutant • Most comes from biological decomposition• Background conc's vary from 1 to 20ppb• The avg. atmospheric residence time is
approx. 7 days
Organic Nitrates
• produced in the atmosphere by reaction of NOx and hydrocarbons
• Examples are peroxyacyl nitrates (PAN’s) and peroxybutylnitrates (PBN’s).
• discussed in detail in photochemical smog section
Hydrocarbons
• organic materials in the atmosphere. • In the atmosphere simple hydrocarbons react
with substances containing – oxygen,
– nitrogen,
– sulfur,
– chlorine
– bromine
– even some metals (Pb)
Hydrocarbons
• Atmospheric hydrocarbons exist in gas, liquid and solid phases
• gases and volatile liquids the most significant pollutants
• Solid hydrocarbons generally of higher MW and exist as condensed particles in atmospheric aerosols

Hydrocarbons
• Methane (CH4) most common hydrocarbon in the atmosphere - formed from many natural sources; – termites, – cows– decomposition of organic matter
• It and the other alkanes found in the atmosphere are fairly un-reactive
Hydrocarbons
• atmospheric hydrocarbons of most significance in terms of chemical reactivity are the alkenes
• highly reactive alkene hydrocarbons are formed naturally by plants (e.g. terpenes from citrus plants and eucalyptus haze)
Hydrocarbons
• greatest source of non-methane hydrocarbons are motor vehicles and petroleum processing
• Alkenes are the major air pollutant responsible for photochemical smog and other gross oxidants in the atmosphere
Hydrocarbons
• Once in the atmosphere non-methane H/C’s combine with O2 to form many different oxygenated H/C’s including;– alkanones
– alkanals
– alkanoic acids
– alkanols
– ethers
Hydrocarbons
• Aromatic H/C’s not very reactive, but can react with other very reactive chemical oxidants to form toxic substances, such as;– benzo[]pyrene – poly-aromatic hydrocarbons (PAH’s)
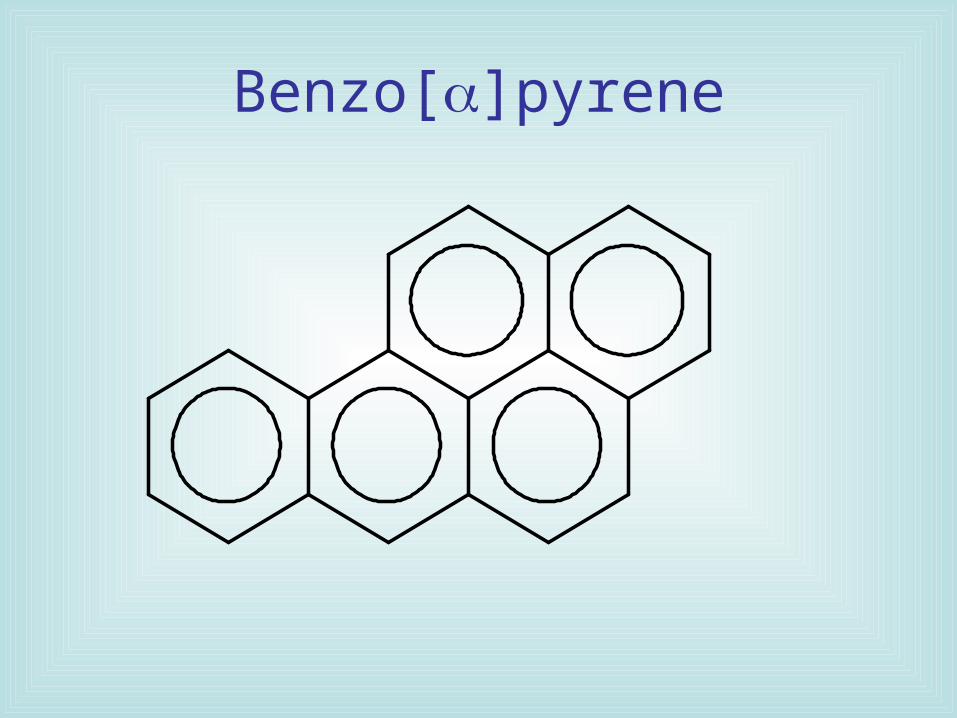
Benzo[]pyrene
Hydrocarbons
• H/C’s emitted from a variety of natural and man made sources
• important pollutants because of their role in atmospheric photochemistry
• biological and geological processes release hydrocarbon compounds naturally
Hydrocarbons
Sources include;– plant and animal metabolism– vaporisation of volatile oils from plant surfaces– biological decomposition – emission of volatiles from fossil fuel deposits
Hydrocarbons
Sinks• most important sink processes are;
– photochemical conversion of hydrocarbons to CO2 and H2O or
– to soluble or condensable products such as dicarboxylic acids - a major component of photochemical aerosol.
• aerosols are removed from the atmosphere by both dry and wet deposition processes.
Methane
• was initially considered an unimportant H/C
• Measurements of total H/C subtracted the conc. of CH4
• Hence ambient air quality standard for H/C’s is a non-methane hydrocarbons standard

Methane
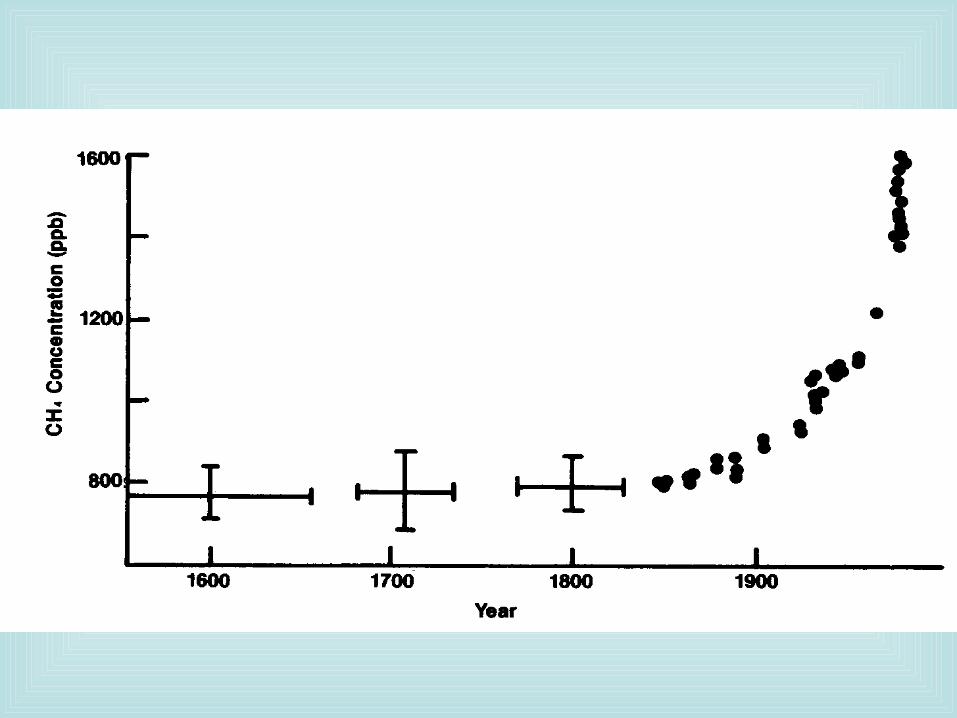
• recognised as one of the trace gases that may have significant greenhouse effect on global climate

Methane
• by far the most abundant H/C in the atmosphere, with a 1980 conc. of 1.65ppm.
• It has been increasing at a rate of 1.2-1.9% per year. The rate itself is also increasing.
Methane

Ozone & Photochemical Smog
• O3 a normal component of the atmosphere
• mostly in the middle stratosphere where it controls UV light reaching the planet’s surface
• here depletion of the substance results in air pollution – loss of ozone is causing deterioration in quality of life
Ozone
• not listed as a major primary air pollutant in the lower atmosphere
• high toxicity and involvement in production of other pollutants - very important atmospheric pollutant
• Over 90% of photochemical smog is ozone

Ozone
Sources
• Electrical discharges, e.g. lightning and electrical devices
• Light driven upper atmospheric chemical reactions e.g. reaction of molecular oxygen with oxygen atoms

Ozone
O2 + O + M O3 + M• In this reaction M is any third substance (usually O2 or N2) that removes the
energy of the reaction and stabilises O. In the lower atmosphere (troposphere) the only significant source of atomic oxygen is the photolysis
of NO2.
NO2 + h NO + O*• The reaction of O* with O2 produces O3, which reacts immediately with NO
to regenerate NO2.
NO + O3 NO2 + O2

Ozone
• All reactions proceed rapidly with approx. conc. of 20ppb
• atmospheric NO2/NO conc. ratios can be equal to 1
• Hence conc's of ozone remain low unless imbalances in the levels of NO2 or other alternate chemical reactants are available

Oh dear! The chemistry!
• We need to look closely at the chemistry we have seen thus far.
•
Photochemical Smog
• refers to an atmosphere laden with secondary pollutants that form in the presence of sunlight as a result of chemical reactions in the atmosphere
• arises in urban areas, where there is a heavy build-up of vehicle exhausts
• greatly exacerbated by weather conditions
Photochemical Smog
• normally primary air pollutants are dispersed over a large region or to the upper atmosphere
• A good prevailing wind is important for cities and large urban areas to reduce smog
• At certain times of the year, when wind is very still, primary pollutants build up over cities.
• Autumn worst for photochemical smog

Photochemical Smog
Photochemical Smog
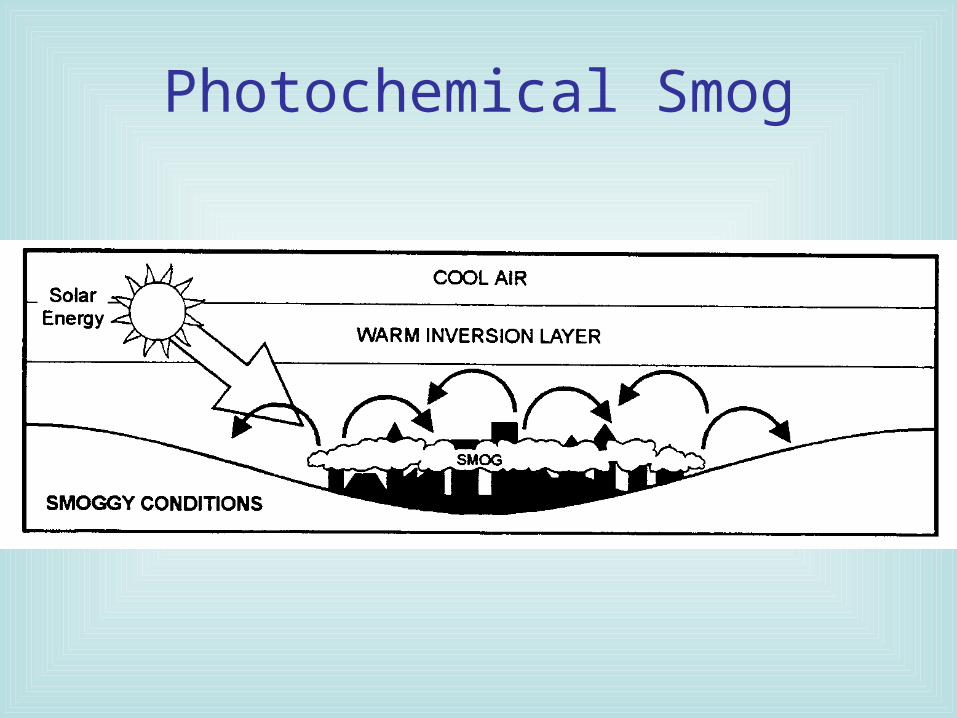
• In autumn, days are sunny and warm, with cool nights
• Under still conditions, a warm inversion layer forms under a layer of higher cooler ai
• Large urban areas store heat, which provides the warmth for the inversion layer
• The inversion layer limits air mixing and dispersal trapping primary pollutants at lower altitudes over urban areas
Photochemical Smog
Photochemical Smog
• primary pollutants (NOx), and H/C’s trapped in the lower atmosphere are subjected to UV radiation from the sun – photochemical smog forms.
Photochemical Smog
• products called gross photochemical oxidants, defined by their ability to oxidise I- to I2.
• They include – ozone (O3)
– hydrogen peroxide (H2O2)
– organic peroxides (ROOR')
– organic hydroperoxides (ROOH) and
– by far the most serious to health, peroxyacyl nitrates (RCO3NO2), known as PAN's.

Photochemical Smog
• The key chemical reactants in the formation of photochemical smog are NOx and hydrocarbons.
• The reactions undergone by these substances in the atmosphere are many and varied.
• Many of the reaction mechanisms are not well understood.
Photochemical Smog
• In the lower atmosphere O3 conc's are often much higher than those that occur from NO2 photolysis alone.
• This is because there are chemical reactions that convert NO to NO2 without consuming O3.
• In polluted atmospheres, these changes in O3 chemistry can be attributed to peroxy radicals (RO2) and other species produced by the oxidation of hydrocarbons as shown in the reactions below.

Photochemical Smog
RO2 + NO NO2 + RO
NO2 + h NO + O*
O* + O2 + M O3 + M
Net: RO2 + O2 + h RO + O3

Photochemical Smog

Photochemical Smog
• The rate of O3 formation is closely related to the conc. of RO2.
• Peroxy radicals are produced when hydroxy radicals OH and HOx react with hydrocarbons.
• Hydroxy radicals are produced by reactions involving the photolysis of O3, carbonyl compounds (mostly alkanals), and nitrous acid.

Photochemical Smog
• In polluted atmospheres, O3 conc's are directly related to;– the intensity of sunlight,
– NO2/NO ratios,
– the hydrocarbon type and conc's, – and other pollutants, such as alkanals and CO, which
react photochemically to produce RO2.
• The increase in NO2/NO ratios caused by atmospheric reactions involving RO2 results in significant increases in lower atmosphere O3 levels.

Photochemical Smog
• summary of reactions in smog formation can be compressed into 4 stages.
• explains time variations in levels of H/Cs, ozone, NO2 and NO (see Figure 2.13).
Photochemical Smog
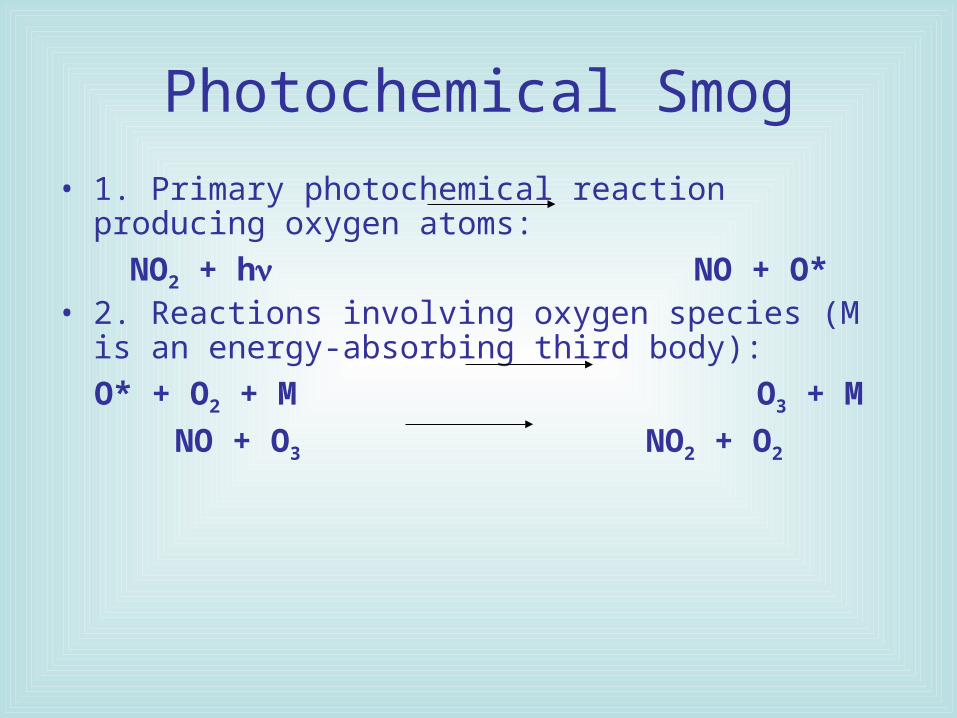
• 1. Primary photochemical reaction producing oxygen atoms:
NO2 + h NO + O*• 2. Reactions involving oxygen species (M is an energy-
absorbing third body):
O* + O2 + M O3 + M
NO + O3 NO2 + O2
Photochemical Smog
• Because last reaction is rapid, the conc. of O3 remains low until that of NO falls to a low value.
• Automotive emissions of NO tend to keep O3 conc's low along freeways.
Photochemical Smog
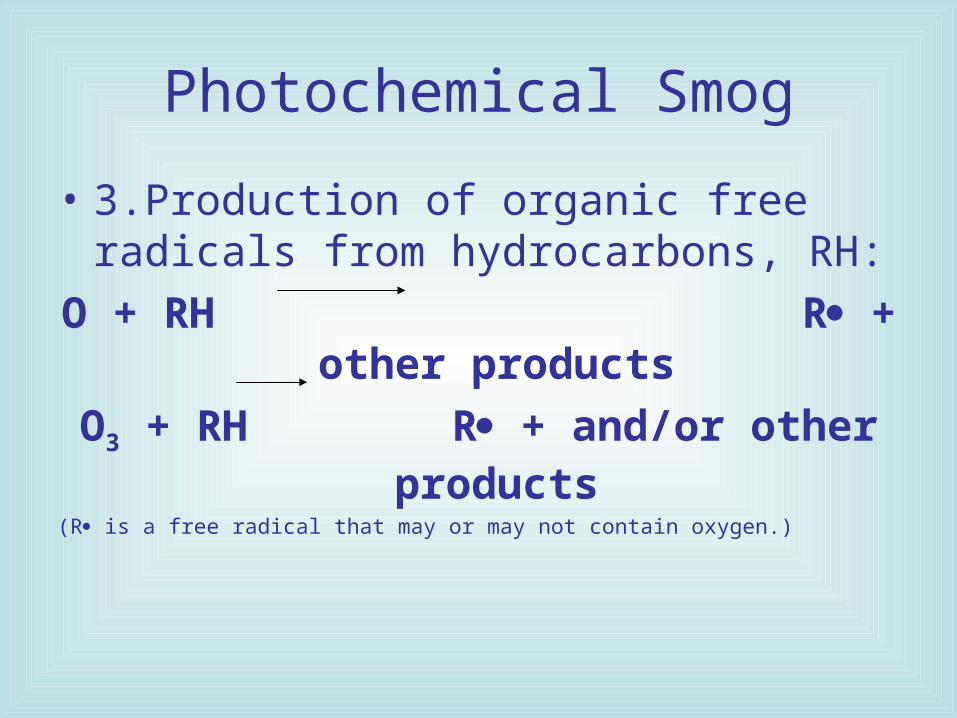
• 3.Production of organic free radicals from hydrocarbons, RH:
O + RH R + other products
O3 + RH R + and/or other products(R is a free radical that may or may not contain oxygen.)
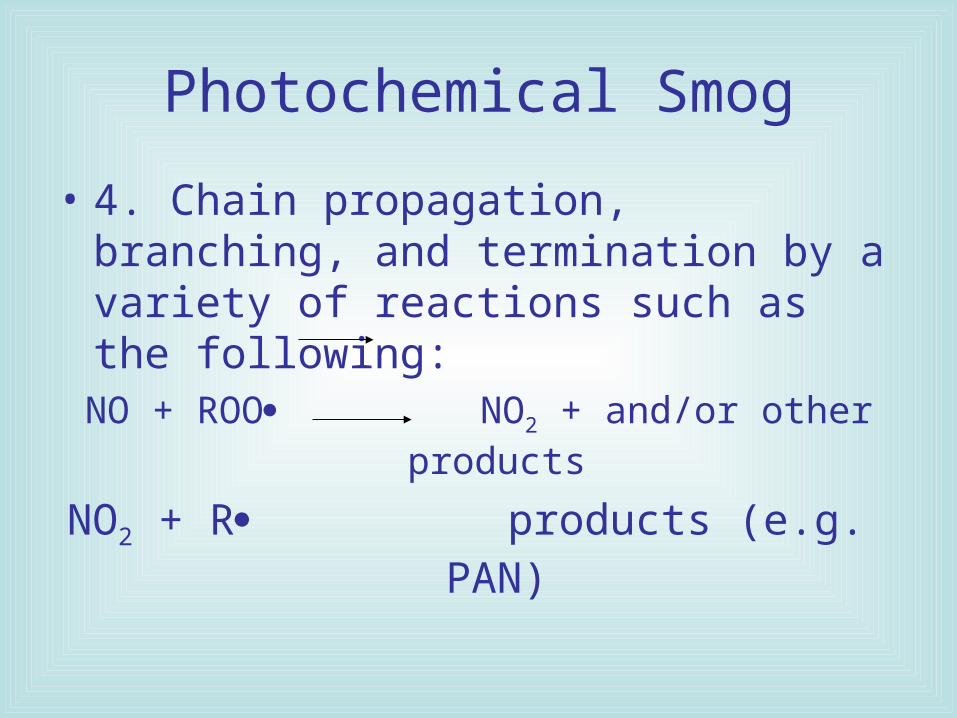
Photochemical Smog
• 4. Chain propagation, branching, and termination by a variety of reactions such as the following:NO + ROO NO2 + and/or other products
NO2 + R products (e.g. PAN)
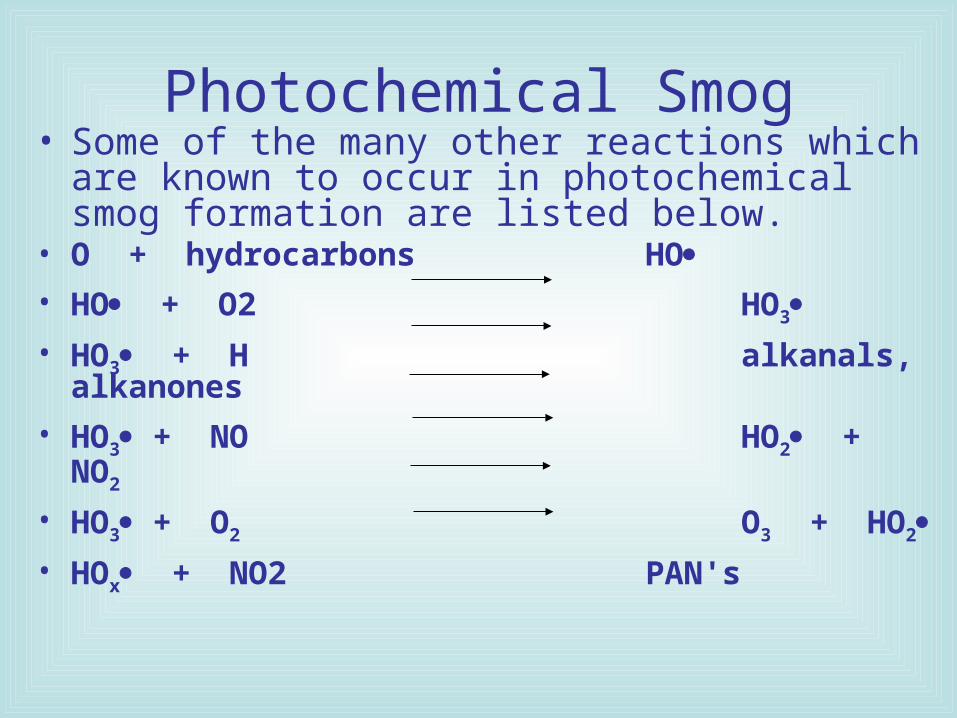
Photochemical Smog• Some of the many other reactions which are known
to occur in photochemical smog formation are listed below.
• O + hydrocarbons HO• HO + O2 HO3• HO3 + H alkanals, alkanones
• HO3 + NO HO2 + NO2
• HO3 + O2 O3 + HO2• HOx + NO2 PAN's

Photochemical Smog• all H/C’s may form smog, but there are
considerable differences in their reactivities• methane, very slow to react, having an approx.
atmospheric lifetime of more than 10 days• branched alkenes and aromatic compounds the
most reactive• naturally-occurring alkenes (d-limonene) the most
reactive compounds
Photochemical Smog
• With complex reactions and changing vehicle emissions during a day, conc's of the major components vary considerably over a 24-hour period.
• typical pattern of variations shown in fig2.13.


Photochemical Smog• morning rush hour begins, NO rises rapidly,
followed by NO2.
• NO2 reacts with sunlight giving ozone and other oxidants
• H/C level increases in the morning, then decreases as compounds are oxidised to form PAN's and other species.
Photochemical Smog
• air mass moves toward an urban center, picks up NO, and H/C’s.
• OH begins to degrade H/C’s, producing RO2
while O3 precursors peak and then decline with increasing downwind distance.
• Ozone conc's increase and are sustained over a period of 1-5 hours as more reactive alkene and aromatic H/C’s are depleted by photochemical reactions.
Photochemical Smog
• After 5-10 hours, moderately reactive H/C’s play a more important role in O3 production
• O3 levels decrease due to dilution, conversion of NO2 to HNO3, and surface adsorption
• At night no O3 produced
Photochemical Smog
• Under inversion layer, O3 may persist for 80 hrs.
• allows O3 to be transported over long distances
• At sunrise, inversion breaks up, bringing O3 and other products to the ground, where they mix with the pollutants held in by the inversion layer, and begin cycle all over again

Photochemical Smog
• In unpolluted atmospheres O3 conc's near ground are 10-20ppb (0.01-0.02ppm) during the warm months
• O3 conc's over landmasses with large motor vehicle numbers often well above this even at remote sites
• Los Angeles basin 1 hour conc's are 0.20-0.40ppm

Photochemical Smog
• warm, sunny NSW central coast means Sydney Basin has high photochemical smog production
• (NHMRC) ozone standard of 0.12ppm (1hr avg.) should not be exceeded on more than one day per year.
Photochemical Smog
• Ozone removed from the atmosphere by reactions with plants, soil, and man made materials (rubber)
• O3 produced in the atmosphere removed by chemical processes involving NOx
• principal scavenger of O3 is NO – Night reactions with NO2 destroy O3

Chlorofluorocarbons (CFC’s)
What are they?
• halogenated H/C compounds used as refrigerant gases and propellants in aerosol cans
Chlorofluorocarbons (CFC’s)
• unique because of their environmental persistence
• examples– DDT, Chlordane, Dieldrin, and Aldrin (pesticides)
– polyhalogenated biphenyls (PCB’s, PBB’s) solvents and fire retardants
– dichloromethane, trichloroethene, perchloroethene, tetrachloroethene, and tetrachloromethane (solvents)
– CFC’s - refrigerants, degreasing agents, foaming agents, aerosol propellants

Chlorofluorocarbons (CFC’s)
• serious atmospheric threat because of their great stability - leads to damage the O3 layer
• Also absorb IR energy and are greenhouse gases
Chlorofluorocarbons (CFC’s)
• most commonly used (most common atmospheric contaminants) are;– Trichlorofluoromethane (CFC13)– Dichlorodifluoromethane (CF2C12),– Trichlorotrifluoroethane (C2C13F3).
Chlorofluorocarbons (CFC’s)
• no sink in the lower atmosphere - CFC conc's increase with time
• For CFC-11 and CFC-12, atmospheric lifetimes are 75 and 111 years, respectively
Chlorofluorocarbons (CFC’s)
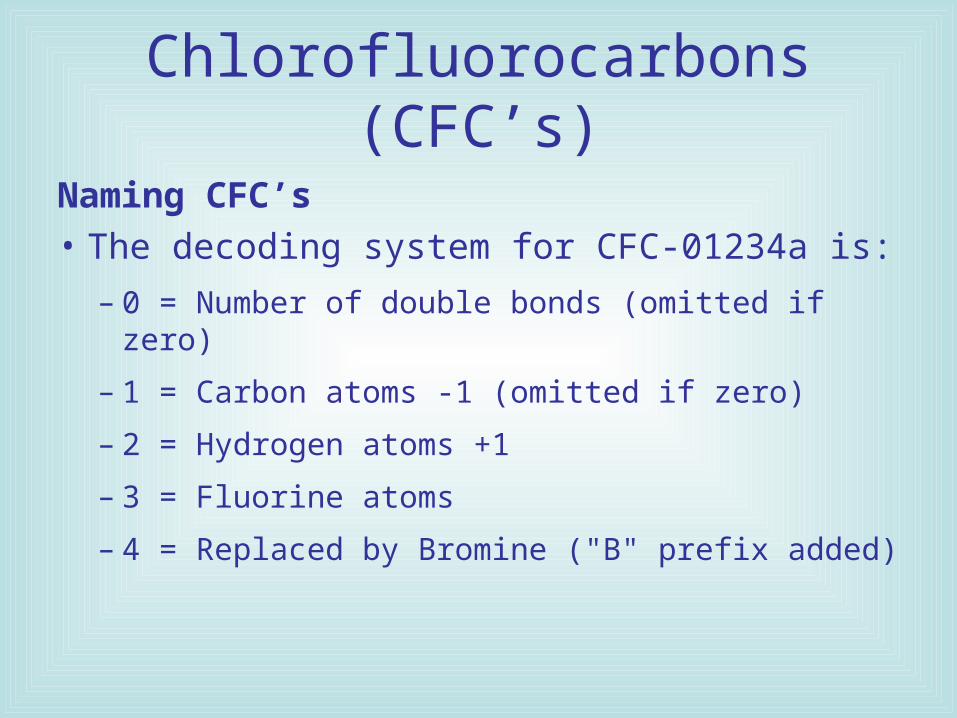
Naming CFC’s
• The decoding system for CFC-01234a is:
– 0 = Number of double bonds (omitted if zero)
– 1 = Carbon atoms -1 (omitted if zero)
– 2 = Hydrogen atoms +1
– 3 = Fluorine atoms
– 4 = Replaced by Bromine ("B" prefix added)
Fluoride
• Aluminium smelters major source of both gaseous and particulate fluorides, as are; – brick and glass works
– some smelters
– steel plants and
– coal fired power stations
• Fluoride is a localised problem
Minor Gaseous Pollutants
• Hydrogen sulfide
• odour
• noise
Odour as air pollution
• odour pollution increasing importance
• from a regulatory point of view, seen as a welfare not a health issue – this is changing
Odour as air pollution
• odour is response to the inhalation of a chemical substance - cannot yet be reliably measured by chemically
• sensory attributes of odours measured by exposing individuals under controlled conditions
Odour as air pollution
• Elements of odour subject to measurement are:– detectability– intensity– character (quality) – hedonic tone (pleasantness, unpleasantness)
Odour as air pollution
• limit of detection = odour threshold characterized in 2 ways;– detectable difference from the background – first conc. at which an observer can positively
identify quality of odour
Odour as air pollution
• characters of a variety of selected chemicals summarised in Table 2.2
• For example, dimethylamine is described as fishy, phenol as medicinal, 1,4-dihydroxybenzene (paracresol) as tar-like.
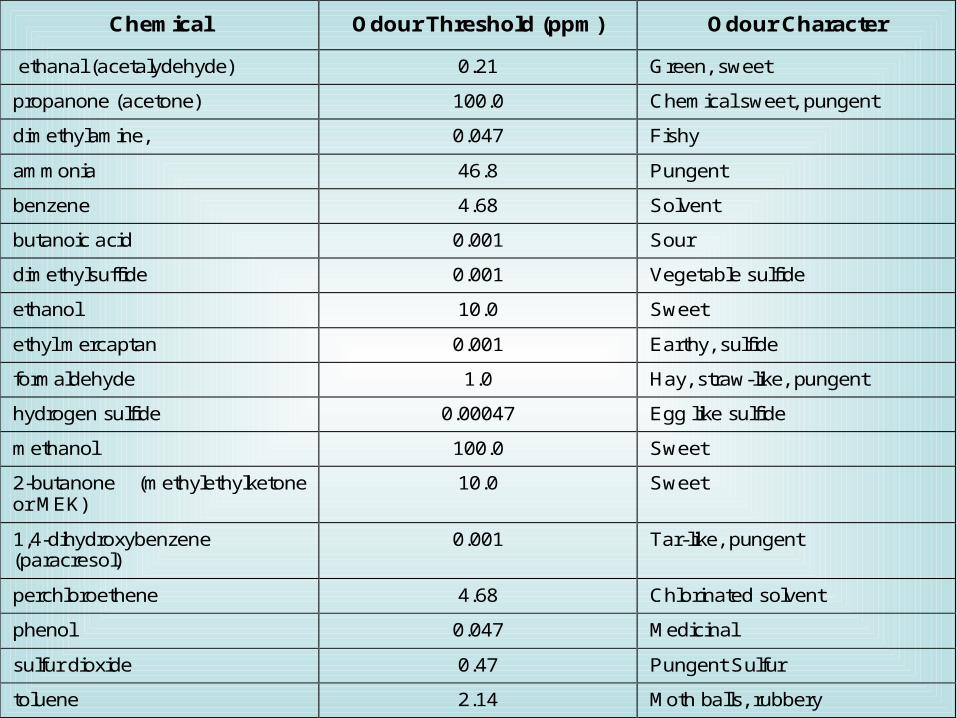
Chemical Odour Threshold (ppm) Odour Character
ethanal (acetalydehyde) 0.21 Green, sweet
propanone (acetone) 100.0 Chemical sweet, pungent
dimethylamine, 0.047 Fishy
ammonia 46.8 Pungent
benzene 4.68 Solvent
butanoic acid 0.001 Sour
dimethylsuffide 0.001 Vegetable sulfide
ethanol 10.0 Sweet
ethyl mercaptan 0.001 Earthy, sulfide
formaldehyde 1.0 Hay, straw-like, pungent
hydrogen sulfide 0.00047 Egg like sulfide
methanol 100.0 Sweet
2-butanone (methylethylketone or MEK)
10.0 Sweet
1,4-dihydroxybenzene (paracresol)
0.001 Tar-like, pungent
perchloroethene 4.68 Chlorinated solvent
phenol 0.047 Medicinal
sulfur dioxide 0.47 Pungent Sulfur
toluene 2.14 Moth balls, rubbery

Odour as air pollution
• olfactory response to an odourant decreases as the odourant conc. decreases (nonlinear)
• responses to malodours include; – Nausea and vomiting
– Headaches and other sensory disturbance
– Coughing respiratory ailments
– Depression
Odour as air pollution
• Odour Problems– Bad odours generate complaints to regulatory
agencies more than any other form of air pollution
– A new area of management that deals with odour and noise is called modelling

Odour as air pollution
Odour Problems• Likely sources of bad odours include;
– soap-making facilities
– petrochemical plants and refineries
– pulp and paper mills
– food-processing plants
– sewage treatment plants
– abattoirs
Odour as air pollution
• Bad odours associated with;– amines
– sulfur gases (e.g. H2S)
– phenol, ammonia etc
– Hydrocarbons
– And many more…

Odour and the Law
• Legal/Regulated aspects of odour
• Local Council