Chapter 2: Alternatives July 2016 2-1 Chapter 2: Alternatives ... for detailed study. Chapter 3...
54
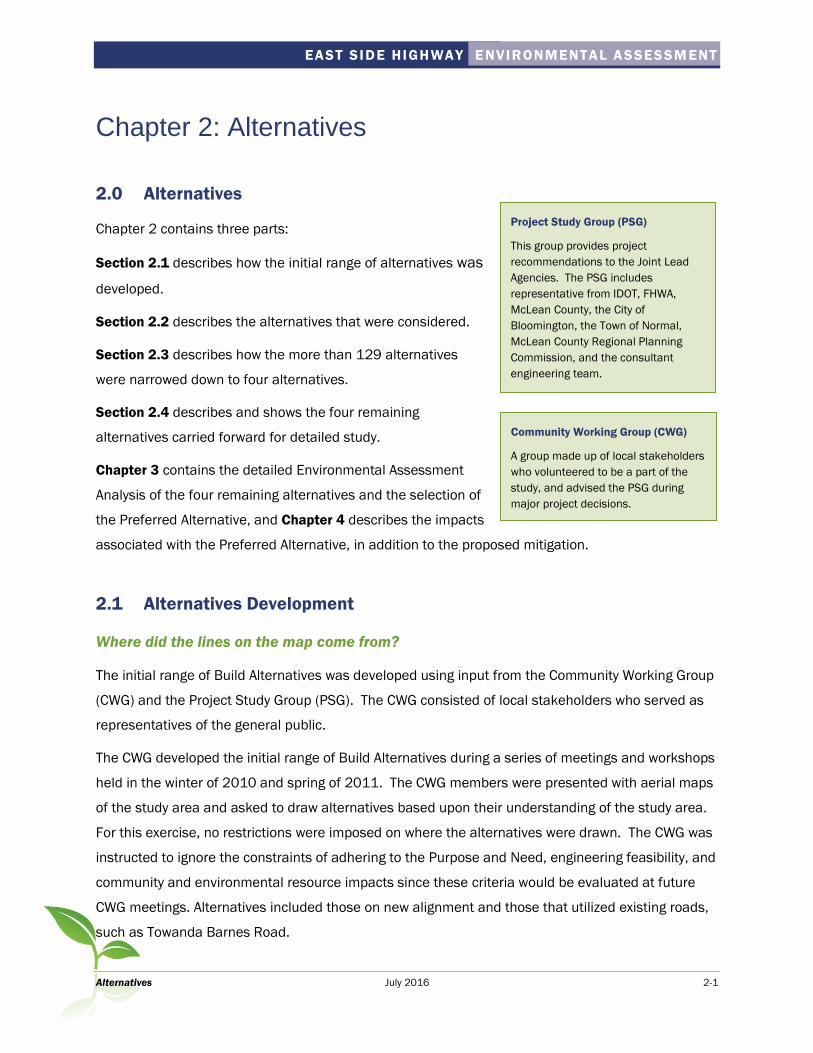
EAST SIDE HIGHWAY ENVIRONMENTAL ASSESSMENT Alternatives July 2016 2-1 Chapter 2: Alternatives 2.0 Alternatives Chapter 2 contains three parts: Section 2.1 describes how the initial range of alternatives was developed. Section 2.2 describes the alternatives that were considered. Section 2.3 describes how the more than 129 alternatives were narrowed down to four alternatives. Section 2.4 describes and shows the four remaining alternatives carried forward for detailed study. Chapter 3 contains the detailed Environmental Assessment Analysis of the four remaining alternatives and the selection of the Preferred Alternative, and Chapter 4 describes the impacts associated with the Preferred Alternative, in addition to the proposed mitigation. 2.1 Alternatives Development Where did the lines on the map come from? The initial range of Build Alternatives was developed using input from the Community Working Group (CWG) and the Project Study Group (PSG). The CWG consisted of local stakeholders who served as representatives of the general public. The CWG developed the initial range of Build Alternatives during a series of meetings and workshops held in the winter of 2010 and spring of 2011. The CWG members were presented with aerial maps of the study area and asked to draw alternatives based upon their understanding of the study area. For this exercise, no restrictions were imposed on where the alternatives were drawn. The CWG was instructed to ignore the constraints of adhering to the Purpose and Need, engineering feasibility, and community and environmental resource impacts since these criteria would be evaluated at future CWG meetings. Alternatives included those on new alignment and those that utilized existing roads, such as Towanda Barnes Road. Community Working Group (CWG) A group made up of local stakeholders who volunteered to be a part of the study, and advised the PSG during major project decisions. Project Study Group (PSG) This group provides project recommendations to the Joint Lead Agencies. The PSG includes representative from IDOT, FHWA, McLean County, the City of Bloomington, the Town of Normal, McLean County Regional Planning Commission, and the consultant engineering team.
Transcript of Chapter 2: Alternatives July 2016 2-1 Chapter 2: Alternatives ... for detailed study. Chapter 3...
EAST SIDE HIGHWAY ENVIRONMENTAL ASSESSM ENT
Alternatives July 2016 2-1
Chapter 2: Alternatives
2.0 Alternatives
Chapter 2 contains three parts:
Section 2.1 describes how the initial range of alternatives was
developed.
Section 2.2 describes the alternatives that were considered.
Section 2.3 describes how the more than 129 alternatives
were narrowed down to four alternatives.
Section 2.4 describes and shows the four remaining
alternatives carried forward for detailed study.
Chapter 3 contains the detailed Environmental Assessment
Analysis of the four remaining alternatives and the selection of
the Preferred Alternative, and Chapter 4 describes the impacts
associated with the Preferred Alternative, in addition to the proposed mitigation.
2.1 Alternatives Development
Where did the lines on the map come from?
The initial range of Build Alternatives was developed using input from the Community Working Group
(CWG) and the Project Study Group (PSG). The CWG consisted of local stakeholders who served as
representatives of the general public.
The CWG developed the initial range of Build Alternatives during a series of meetings and workshops
held in the winter of 2010 and spring of 2011. The CWG members were presented with aerial maps
of the study area and asked to draw alternatives based upon their understanding of the study area.
For this exercise, no restrictions were imposed on where the alternatives were drawn. The CWG was
instructed to ignore the constraints of adhering to the Purpose and Need, engineering feasibility, and
community and environmental resource impacts since these criteria would be evaluated at future
CWG meetings. Alternatives included those on new alignment and those that utilized existing roads,
such as Towanda Barnes Road.
Community Working Group (CWG)
A group made up of local stakeholders
who volunteered to be a part of the
study, and advised the PSG during
major project decisions.
Project Study Group (PSG)
This group provides project
recommendations to the Joint Lead
Agencies. The PSG includes
representative from IDOT, FHWA,
McLean County, the City of
Bloomington, the Town of Normal,
McLean County Regional Planning
Commission, and the consultant
engineering team.

ENVIRONMENTAL ASSESSMENT EAST SIDE HIGH WAY
2-2 July 2016 Alternatives
After the CWG developed the initial range of alternatives, the PSG reviewed the maps and added
several additional alternatives to ensure that a full range of alternatives was considered. The range
of alternatives included the Preferred Corridor from the 2009 ESH Corridor Study.
The alternative refinement process was ongoing. The alternatives were refined by the CWG and the
PSG. As an example, alternatives were shifted to avoid impacts such as residences. At the first few
CWG meetings, the alternatives did not include interchanges. Interchange development occurred
later in the process and the type and location of interchanges were refined using input from the CWG
members. The CWG meetings are discussed in detail in Chapter 6.
How was the public involved in the alternative development process?
Stakeholders who were not members of the CWG had an opportunity to review and provide comment
on the alternatives during the Public Information Meetings (PIMs) held in August 2009, January
2012 and June 2013. The preliminary alternatives and a summary of the advisory group meetings
were available for viewing on the project website. The public could comment at the PIM’s, via the
project mailing address, the project comment line, or the project email address.
The original alternatives were modified based upon public input and environmental resource
information received. Comments and recommendations received from the public were reviewed and
taken into consideration. As an example, information obtained at PIMs included the location of new
residences and businesses, and information on farming operations. Based on that information, the
alternatives were modified where feasible.
Additionally, Focus Working Groups (FWG) were established to
further refine and enhance the alternatives. There were three
separate FWGs: Land Use and Access Management,
Sustainability, and Alternative Modes. Each group focused on
different aspects of the ESH project. For example, information from the Land Use FWG helped shape
the proposed interchange at I-74.
2.2 Range of Alternatives Considered
What types of Build Alternatives were considered?
One hundred and twenty nine (129) north-south Build Alternatives that connect I-55 and I-74 on the
east side of Bloomington-Normal as developed by the advisory groups and the PSG were considered
(see Figure 2.2-1).
Focus Working Groups (FWGs)
A group made up of local stakeholders
with specific interests or knowledge,
who volunteered to be a part of the
study, and advised the PSG during
major project decisions.
EAST SIDE HIGHWAY ENVIRONMENTAL ASSESSM ENT
Alternatives July 2016 2-3
Three different facility type options were considered for the north-south Build Alternatives: Freeway,
Expressway, and Arterial. Freeway and Expressway Options consist of four travel lanes (two in each
direction) and Arterial Options consist of four travel lanes (for new alignment alternatives) and six
travel lanes (for alternatives that widen existing Towanda Barnes Road).
How were the north-south Build Alternatives named and numbered?
The preliminary alternatives are combinations of northern (T), middle (BN), and southern (D)
sections. The northern (T) sections consisted of the various I-55 interchange connections in the
Towanda area. The southern (D) sections consisted of the various I-74 interchange connections in
the Downs area. The middle (BN) sections were those north-south sections that connected the
northern and southern sections.
Since all of the north-south Build Alternatives had an I-55 connection, an I-74 connection, and a
middle section, each possible combination of the three sections was developed into one alternative
and then assigned a number. For example, Alternative 1 is a combination of sections T1, T5, BN1,
D11 and D1. Figure 2.2-1 shows the locations of all of these sections. The total of all the
alternative combinations equaled one hundred and twenty nine.
In addition to the original Build Alternatives, a “No Build” Alternative was introduced.
What is the No Build Alternative?
The No Build Alternative includes all improvements from the Long Range Transportation Plan 2035
for the Bloomington-Normal Urbanized Area (2007 LRTP), Bloomington-Normal Bicycle Pedestrian
Plan (1997 BPP), Transportation Improvement Program – Fiscal Years 2011-2015 (2010 TIP) and
other local planning documents, excluding the ESH project. The
No Build Alternative assumes that the planned or programmed
projects and improvements would be completed and operating
within the McLean County transportation system prior to the
design year for this project, Year 2035. The No Build
Alternative does not meet the project’s Purpose and Need
Statement, but is carried through to the end of the study and
serves as a basis for comparison.
No Build Alternative
Assumes all planned or programmed
transportation projects and
improvements would be completed
and operating prior to the design year.
It does NOT include building the East
Side Highway.

ENVIRONMENTAL ASSESSMENT EAST SIDE HIGH WAY
2-4 July 2016 Alternatives
Figure 2.2-1: Initial Range of North-South Build Alternatives
EAST SIDE HIGHWAY ENVIRONMENTAL ASSESSM ENT
Alternatives July 2016 2-5
What other alternatives were considered?
In addition to the north-south Build Alternatives and the No Build Alternative, a Transportation
System Management /Travel Demand Management alternative, a Transit Alternative and a Multiple
East-West Arterial Expansion Alternative were considered. A summary of these alternatives is
provided below.
What is the Transportation System Management/Travel Demand Management
Alternative?
Transportation Systems Management (TSM) strategies are
typically small improvements to the existing transportation
system, such as the installation of dedicated turn lanes,
construction of spot geometric changes, or the adjustment of
signal timing implemented to create a more efficient use of
existing facilities and vehicle operation without adding capacity.
Some of the strategies would require new ordinances, new
transportation studies, and the cooperation of the local
municipality, the state, and FHWA when considering changes to
state-owned roads and the National Highway System.
Travel Demand Management (TDM) strategies are policy changes
implemented to influence travel behavior, spread travel demand
across peak periods, and reduce the demand for single-occupancy
vehicle trips. Examples include alternative work times, ride-
sharing, or bicycle incentives. Some strategies may already be in
use while others may be planned for future use.
Numerous TSM/TDM strategies are available, however, this
alternative only included those specifically identified to be part of
a goal, objective, policy, or strategy presented in the McLean
County Regional Comprehensive Plan (November 2009), the 2007
and 2012 LRTPs, the City of Bloomington Comprehensive Plan
(October 2005), or the Town of Normal Comprehensive Plan
(February 2006).
Transportation System Management
(TSM) Alternative
TSM strategies typically include minor
improvements to the existing
transportation system, such as
adjusting lane width or improving
intersections.
Travel Demand Management (TDM)
Alternative
TDM strategies are policy changes
implemented to influence travel
behavior, spread travel demand
across peak periods, and reduce the
demand for single-occupancy vehicle
trips.
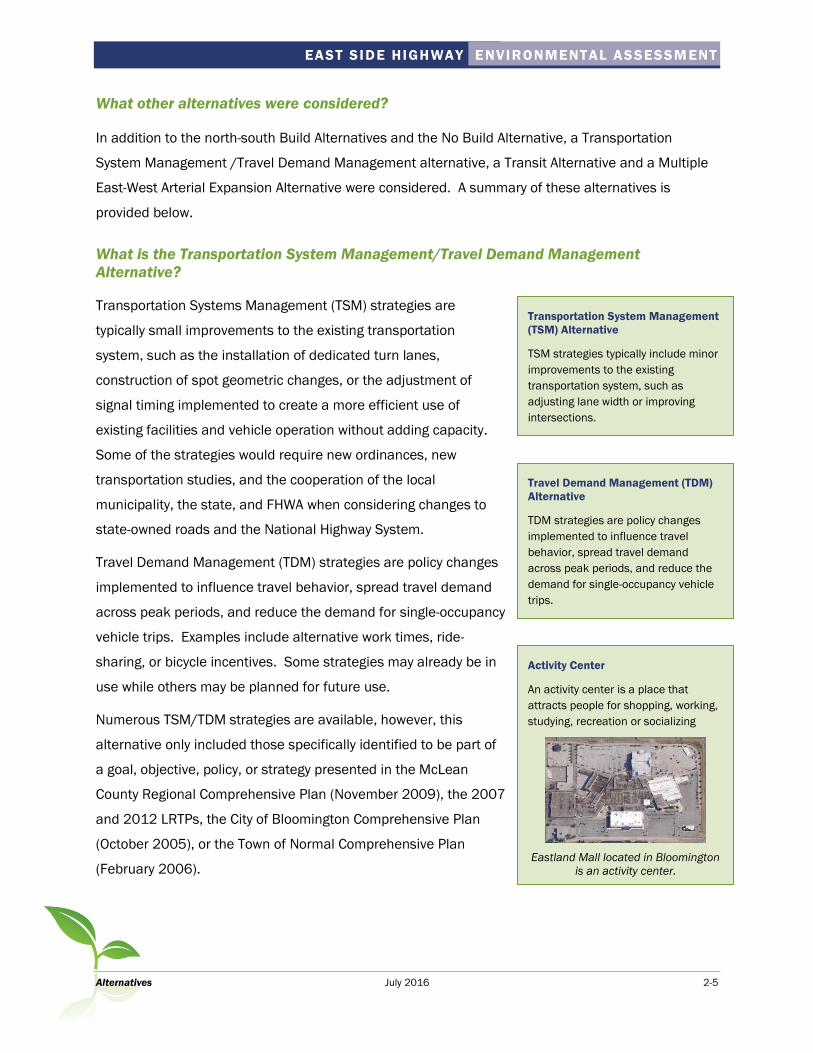
Activity Center
An activity center is a place that
attracts people for shopping, working,
studying, recreation or socializing
Eastland Mall located in Bloomington
is an activity center.
ENVIRONMENTAL ASSESSMENT EAST SIDE HIGH WAY
2-6 July 2016 Alternatives
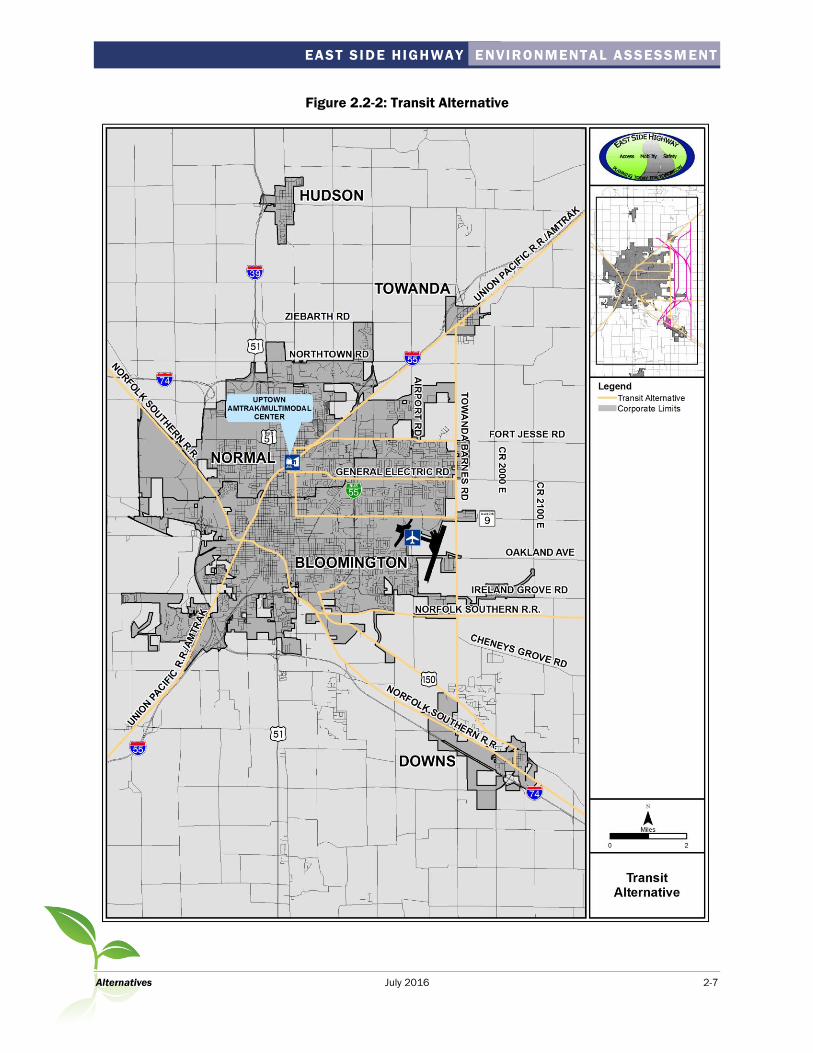
What is the Transit Alternative?
The Transit Alternative (shown in Figure 2.2-2) consists of dedicated transit corridors along the
existing Union Pacific/Amtrak rail line, the Norfolk Southern rail lines, Towanda Barnes Road, US
150, Empire Street/IL Rte. 9, General Electric Road, and Fort Jesse Road. These corridors would
connect the east side to the various existing and future activity
centers, existing bus routes, and the Uptown Amtrak/multi-modal
center. Each of these routes could contain a variety of transit types
(such as commuter rail, light rail transit, bus rapid transit,
streetcar/trolley, and local bus service) and would also include
improved pedestrian and bicycle accommodations. The service
would run frequently during the peak hours in order to capture as
many riders as possible. Automobile park-and-ride lots would be
strategically located to congregate riders, with possible locations at
the existing I-55 Towanda and I-74 Downs interchanges.
Connections with existing local bus service would occur at Eastland
Mall and the Uptown Amtrak/multi-modal center. The existing
Constitution Trail network would be expanded east of Towanda
Barnes Road to provide access between Towanda, Downs and
Bloomington-Normal.
This alternative assumed implementation of improvements contained in the No Build Alternative,
transit improvements, improvements to Constitution Trail contained in the 2035 LRTP,
implementation of planned 110 mph high-speed passenger rail service, and the establishment of
commuter rail service between Peoria and Bloomington-Normal on existing Norfolk Southern tracks,
which is currently under study by the Tri-County Regional Planning Commission.
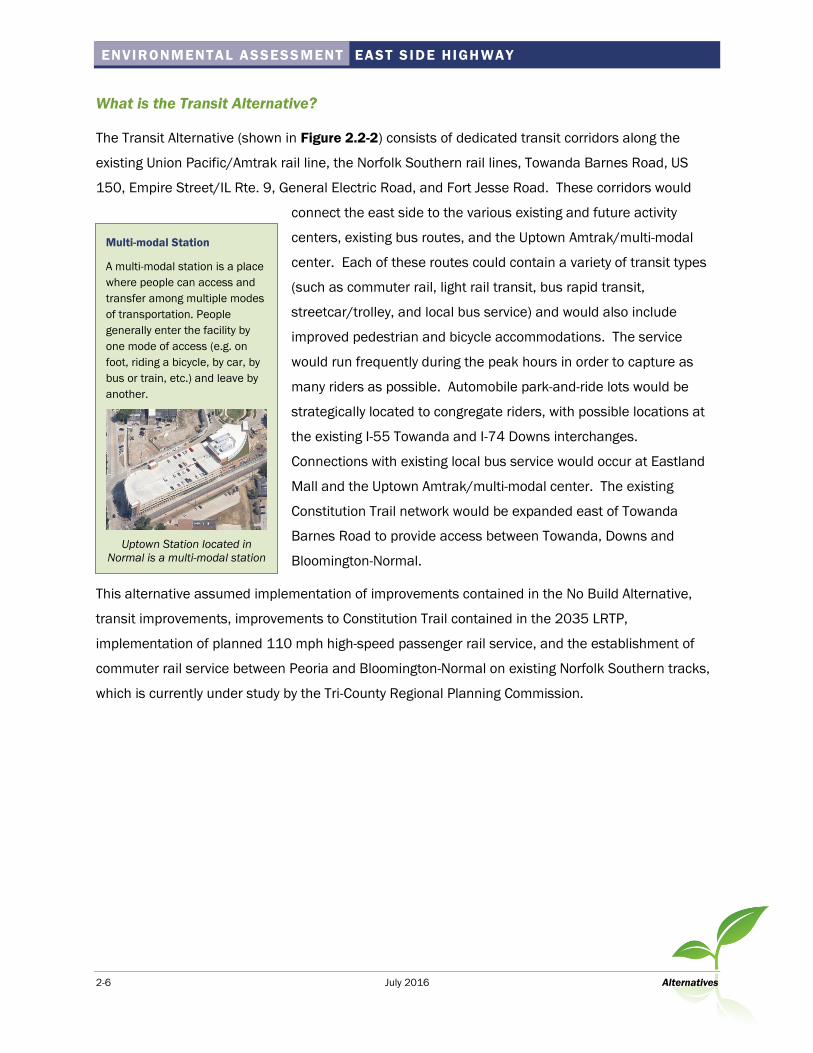
Multi-modal Station
A multi-modal station is a place
where people can access and
transfer among multiple modes
of transportation. People
generally enter the facility by
one mode of access (e.g. on
foot, riding a bicycle, by car, by
bus or train, etc.) and leave by
another.
Uptown Station located in
Normal is a multi-modal station
EAST SIDE HIGHWAY ENVIRONMENTAL ASSESSM ENT
Alternatives July 2016 2-7
Figure 2.2-2: Transit Alternative

ENVIRONMENTAL ASSESSMENT EAST SIDE HIGH WAY
2-8 July 2016 Alternatives
What is the Multiple East-West Arterial Expansion Alternative?
The study evaluated a Multiple East-West Arterial Expansion Build Alternative. This alternative
consisted of adding one lane in each direction to strategic east-west arterials between I-55 and I-74
on the east side of Bloomington-Normal. East-west improvements for consideration are shown in
Figure 2.2-3 and include:
Widening and improving the existing two-lane US 150 between the future extensions of
Hershey Road (west) and 800 North Road (east) to a four-lane facility.
Widening and improving the existing four-lane Ireland Grove Road between Hershey Road
(west) and Towanda Barnes Road (east) to a six lane facility.
Widening and improving the four-lane existing Empire Street/IL Rte. 9 between Hershey Road
(west) and two blocks East of Towanda Barnes Road (east) to a six-lane facility.
Widening and improving the existing four-lane General Electric Road between Hershey Road
(west) and Towanda Barnes Road (east) to a six-lane facility.
Widening and improving the two-lane existing Old Route 66 between Veterans Parkway
(west) and Airport Road (east) to a four-lane facility.

EAST SIDE HIGHWAY ENVIRONMENTAL ASSESSM ENT
Alternatives July 2016 2-9
Figure 2.2-3: Multiple East-West Arterial Expansion Alternative

ENVIRONMENTAL ASSESSMENT EAST SIDE HIGH WAY
2-10 July 2016 Alternatives
Why were improvements to some existing major north-south roadways not considered?
The range of alternatives did include improvements to Towanda Barnes Road, the major north-south
roadway in the study area. However, other north-south roadways, including Veterans Parkway
(Business I-55), U.S. Route 51 through Bloomington and Normal (Business U.S. 51), and County
Road 2600 East (known locally as Lexington-Leroy Road) were not considered.
Veterans Parkway and U.S. 51/Business U.S. 51 were excluded because they do not serve the
movements within the east side growth area. Both roadways are located in the urban core of
Bloomington-Normal, west of the planned growth area and efficient north/south travel along them is
limited due to the surrounding development.
Therefore it was determined that alternatives
that utilize Veterans Parkway or U.S.
51/Business U.S. 51 did not meet the Purpose
and Need.
The north-south route of Lexington-Leroy Road is
similar to corridors evaluated in the 2009 ESH
Corridor Report. During the Corridor Study, these
corridors were eliminated because they did not
address the Purpose and Need as they were
located too far east of the 2035 Land Use Plan
Boundary to effectively address local access and
mobility. Lexington-Leroy Road is located five
miles east of the limits of the 2035 Land Use
Plan and two miles east of the study area,
therefore it was determined that alternatives that
utilize Lexington-LeRoy Road did not meet the
Purpose and Need.
Figure 2.2-4: Lexington-Leroy Road Location

EAST SIDE HIGHWAY ENVIRONMENTAL ASSESSM ENT
Alternatives July 2016 2-11
2.3 Alternatives Evaluation and Screening
How were the alternatives evaluated?
The initial range of alternatives was evaluated using a five-step process. Each step contained a set
of evaluation criteria that allowed for the most feasible alternatives to be carried through to the next
level of evaluation until one Preferred Alternative remained. The steps in the evaluation process are
shown below.
This Chapter summarizes the first four steps of the alternative evaluation process. Step 5, the
Environmental Assessment Analysis, in addition to selection of the Preferred Alternative, is
documented in Chapter 3.
Is the No Build Alternative included in the evaluation?
The No Build Alternative was not considered in the five-step
evaluation process. Although the No Build Alternative does not
meet the project’s Purpose and Need, it is carried through to
the end of the evaluation process to serve as a basis for
comparison with the remaining alternatives.
What is Step 1 in the evaluation process?
Step 1 in the alternatives evaluation process was the Initial
Screening Evaluation. In this step the initial range of
alternatives was reviewed and non-feasible alternatives were
eliminated. This evaluation consisted of three criteria, as listed
in Table 2.3-1. The measure for each was a Yes or No answer
as to whether the criterion was met or not. If an alternative did
not meet all of the criteria in this level of screening, it was
eliminated from further analysis.
Step 1:
Initial Screening Evaluation
Step 2: Purpose & Need
Evaluation
Step 3:
Macro Analysis
Step 4: Alignment
Analysis
Step 5: Environmental
Assessment Analysis
Community
According to the IDOT Community
Impact Assessment Manual, the FHWA
has identified a community as “a
distinctive, homogenous, stable, self-
contained unit of a larger spatial area
defined by geographic boundaries,
ethnic, or cultural characteristics of
the inhabitants; a psychological unity
among the residents; and the
concentrated use of the area’s
facilities. A community is an entity
with economic, social and perhaps
political functions. It usually has a
name identity and number of
community service facilities such as
business districts, religious
institutions, schools, health centers,
and fire and police stations. By
contrast, a neighborhood is a small
social unit based on face-to-face
contacts.” The guidelines for
determining neighborhood and
community boundaries contained in
the Manual were consulted for this
criterion.

ENVIRONMENTAL ASSESSMENT EAST SIDE HIGH WAY
2-12 July 2016 Alternatives
Table 2.3-1: Initial Screening Criteria
Criterion Unit of
Measure Processing
Does the alternative directly impact state or
federally protected areas? (Illinois Natural Area
Inventory Sites, Illinois Nature Preserves, State or
Federal Parks)
Yes Eliminate from further
evaluation
No Continue for further
evaluation
Does the alternative meet the horizontal and
vertical clear zone requirements for the Central
Illinois Regional Airport1?
Yes Continue for further
evaluation
No Eliminate from further
evaluation
Does the alternative divide or isolate a
neighborhood or community? (Is the
neighborhood or community divided into 2 or
more sections? Are any sections isolated from
community services?)
Yes Eliminate from further
evaluation
No Continue for further
evaluation
1Clear zone requirements in accordance with expansion/operational initiatives presented in CIRA’s master plan.
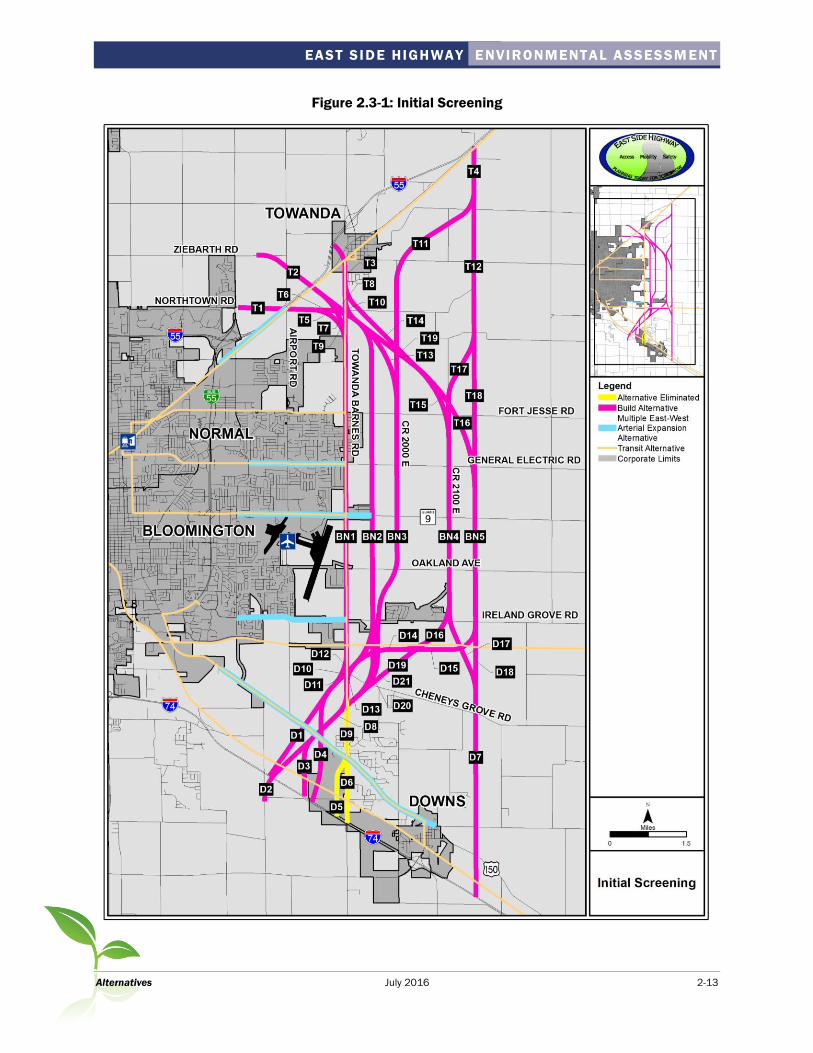
What were the results of the Step 1 evaluation?
Since the study area does not contain any state or federally protected areas, none of the alternatives
were eliminated because of the first criteria. Similarly, all of the alternatives met the horizontal and
vertical clear zone requirements of the airport, so none were eliminated for this reason. However,
three sections (D5, D6, and D9) were determined to divide or isolate a neighborhood or community
in accordance with the IDOT Community Impact Assessment Manual. These sections sever and/or
disrupt access to existing community areas near the Village of Downs. As a result, 36 alternatives
that contained these sections were eliminated. Ninety-three Build Alternatives, in addition to the
Multiple East-West Arterial Expansion Alternative, the TSM/TDM Alternative, the Transit Alternative,
(shown in Figure 2.3-1) and the No Build Alternative were carried forward into Step 2: Purpose and
Need Evaluation.
129 alternatives 93 alternatives
EAST SIDE HIGHWAY ENVIRONMENTAL ASSESSM ENT
Alternatives July 2016 2-13
Figure 2.3-1: Initial Screening

ENVIRONMENTAL ASSESSMENT EAST SIDE HIGH WAY
2-14 July 2016 Alternatives
What is Step 2 of the evaluation process?
Step 2 in the alternative evaluation process was the Purpose and Need Evaluation. In this step the
alternatives were evaluated to assure compliance with the goals established in the project’s Purpose
and Need Statement.
The needs identified in the Purpose and Need Statement were broken down into eight specific
criteria, and measures were developed to determine how well the alternative met the criteria. The
Purpose and Need Evaluation criteria (Table 2.3-2) were applied to the 93 Build Alternatives that
remained after the Initial Screening evaluation in Step 1. If an alternative performed poorly
compared to the No Build Alternative and other Build Alternatives, it was considered to be “less
consistent” with the Purpose and Need and was eliminated. Even though the No Build Alternative
does not meet the Purpose and Need of the project, it was carried forward as a basis for comparison
with the alternatives.
EAST SIDE HIGHWAY ENVIRONMENTAL ASSESSM ENT
Alternatives July 2016 2-15
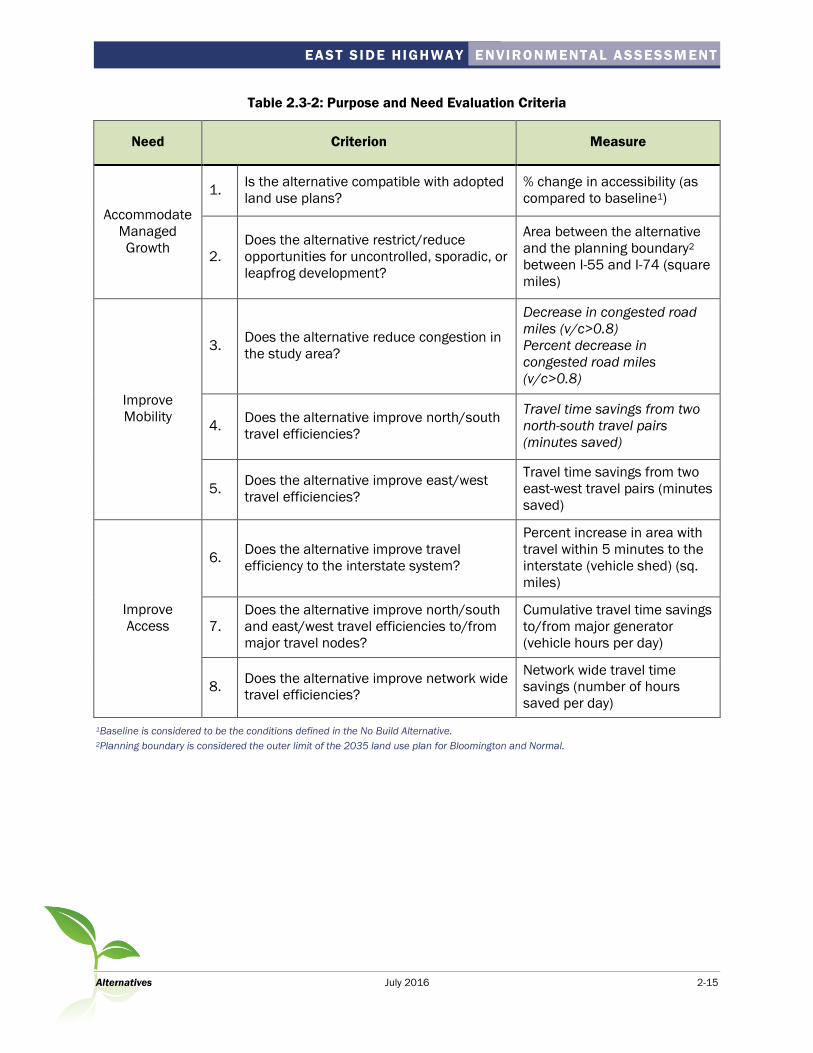
Table 2.3-2: Purpose and Need Evaluation Criteria
Need Criterion Measure
Accommodate
Managed
Growth
1. Is the alternative compatible with adopted
land use plans?
% change in accessibility (as
compared to baseline1)
2.
Does the alternative restrict/reduce
opportunities for uncontrolled, sporadic, or
leapfrog development?
Area between the alternative
and the planning boundary2
between I-55 and I-74 (square
miles)
Improve
Mobility
3. Does the alternative reduce congestion in
the study area?
Decrease in congested road
miles (v/c>0.8)
Percent decrease in
congested road miles
(v/c>0.8)
4. Does the alternative improve north/south
travel efficiencies?
Travel time savings from two
north-south travel pairs
(minutes saved)
5. Does the alternative improve east/west
travel efficiencies?
Travel time savings from two
east-west travel pairs (minutes
saved)
Improve
Access
6. Does the alternative improve travel
efficiency to the interstate system?
Percent increase in area with
travel within 5 minutes to the
interstate (vehicle shed) (sq.
miles)
7.
Does the alternative improve north/south
and east/west travel efficiencies to/from
major travel nodes?
Cumulative travel time savings
to/from major generator
(vehicle hours per day)
8. Does the alternative improve network wide
travel efficiencies?
Network wide travel time
savings (number of hours
saved per day)
1Baseline is considered to be the conditions defined in the No Build Alternative.
2Planning boundary is considered the outer limit of the 2035 land use plan for Bloomington and Normal.
ENVIRONMENTAL ASSESSMENT EAST SIDE HIGH WAY
2-16 July 2016 Alternatives
What were the results of the Step 2 evaluation?
The Step 2: Purpose and Need Evaluation identified three sections (D7, D17, and D18) that were
less consistent with the evaluation criteria described in Table 2.3-2 than other remaining sections.
These three sections were the easternmost southern
interchange connections to I-74 and did not improve congestion
on the roads in the study area. As a result, eight alternatives
that used these sections were eliminated.
The stand-alone TSM/TDM and Transit Alternatives were also
eliminated at this step because they do not accommodate the
future unmet demand, or reduce traffic congestion in the study area to an acceptable level, and
therefore, do not meet the Purpose and Need. However, because they can help reduce congestion,
TSM/TDM and transit elements were considered as part of the remaining roadway Build Alternatives.
The stand-alone Multiple East-West Arterial Expansion Build Alternative would satisfy some elements
of the Purpose and Need of the project, and attendees at the Public Information Meetings expressed
interest in pursuing this alternative. It was carried forward in the analysis.
Eighty-five (85) Build Alternatives, in addition to the Multiple East-West Arterial Expansion Alternative
(shown in Figure 2.3-2), were carried forward into Step 3: Macro Analysis.
93 alternatives 85 alternatives
Unmet Demand
Unmet demand is defined as the
amount of volume reduction required
on the failing roadway segments to
make them operate at an acceptable
level.

EAST SIDE HIGHWAY ENVIRONMENTAL ASSESSM ENT
Alternatives July 2016 2-17
Figure 2.3-2: Purpose and Need Evaluation

ENVIRONMENTAL ASSESSMENT EAST SIDE HIGH WAY
2-18 July 2016 Alternatives
What is Step 3 in the evaluation process?
Step 3, the Macro Analysis, considered the environmental, community and economic, agricultural,
cultural, design, and traffic impacts of each remaining alternative. Impacts to the resources were
calculated for a 500 foot wide corridor for all the remaining
north-south Build Alternatives. For the Multiple East-West
Arterial Expansion Alternative, only a 200 foot wide corridor
was examined, as this dimension represents an approximate
corridor width for a multi-lane arterial. Alternatives with the
greatest resource impacts were eliminated in a stepwise
fashion to avoid the resources or minimize the environmental
effects.
Which resources were evaluated in Step 3, Macro Analysis?
Federal and State laws that protect environmental resources were considered when determining
which resources to evaluate in Step 3, along with input from the CWG. For example, avoiding
wetlands is considered because Federal law states that wetlands must be avoided when practicable.
Although avoiding homes is not mandated by Federal or State law, CWG members indicated that
avoiding homes was important, so number of homes impacted was used to compare and eliminate
alternatives. It is also IDOT policy to consider avoiding homes when possible. Table 2.3-3 identifies
the six categories and 32 criteria used to evaluate potential impacts resulting from the 85 remaining
alternatives.
Table 2.3-3: Macro Analysis Criteria
Criterion Unit of Measure
Environmental
Water Quality/Water Resources
Floodplain (acres affected)
Floodways (acres affected)
Biologically Significant Streams (number of crossings)
Class I Streams (number of crossings)
Streams (number of crossings)
Drinking Water Supplies - Surface Water (number affected)
Wetlands Wetland Areas (acres affected)
Wetland Areas (number affected)
Macro Analysis
This is the third step in the alternative
evaluation process where the impacts
to environmental, community and
economic, agricultural, and cultural
resources as well as design and traffic
considerations for each remaining
alternative were calculated. The
alternatives with disproportionately
high resource impacts are eliminated.

EAST SIDE HIGHWAY ENVIRONMENTAL ASSESSM ENT
Alternatives July 2016 2-19
Special Waste CERCLIS, LUST, RCRA sites (number affected)
Forested Areas Forested Areas (acres affected)
Threatened & Endangered Species Threatened and Endangered Species (number affected)
Community and Economic
Residences Homes, including Farm Homes (number displaced)
Business Commercial Buildings (number displaced)
Public Facilities Public Facilities (number displaced)
Public Facilities with Access Change (number affected)
Section 4(f) Parklands (number affected)
Parklands (acres affected)
Utilities Utility Crossings (number of conflicts)
Utility Infrastructure (number affected)
Noise Noise Receptors (number within 500 feet of corridor)
Agricultural
Prime and Important Farmland Prime and Important Farmland (acres affected)
Farmsteads Farm Outbuildings (number affected)
Tracts Tract Severances (number affected)
Tracts with Access Change (number affected)
Farms Centennial/Sesquicentennial Farms (number affected)
Farms Otherwise Affected (number affected)
Cultural
Cultural
Historic Sites (number affected)
Cemeteries (number affected)
High Probability Archaeological Sites (number affected)
Design
Right-of-Way Right-of-Way Acquisition (acres)
Length of Roadway Length (miles)
Traffic
Safety Analysis Percent Change in Total Crashes
Not Impacted
Impacted within same range or preliminary data
Impacted with wide range, differentiating criteria

ENVIRONMENTAL ASSESSMENT EAST SIDE HIGH WAY
2-20 July 2016 Alternatives
Where did the resource information used in the evaluations come from?
Information for some of the environmental and agricultural resources came from existing data.
Numerous Federal, State, and local agencies along with non-governmental organizations were
contacted for their available data. For example, the floodplain
information came from the Federal Emergency Management
Agency (FEMA), who maintains an inventory of floodplain data
for the country. Other resources with existing data included
wells, Illinois Natural Area Inventory (INAI) sites, parks, prime
and important farmland, and Centennial and Sesquicentennial
Farms.
Some of the data was supplemented with information received
through public involvement activities. For example, although
much of the Centennial Farm information was obtained from
the Illinois Department of Agriculture (IDOA), in several
instances the public would notify the project team when they
thought that the data collected from IDOA was missing a
registered Centennial Farm. The project team would then verify
the information and add it to the data set.
Some of the environmental, cultural, and community resource information was gathered specifically
for the ESH project. A team of state biologists and scientists from the Illinois Natural History Survey
(INHS) conducted field surveys in the study area in 2012 and 2013. The INHS collected field data on
wetlands, high-quality woodlands, threatened and endangered species, and important habitat areas.
Other state agencies conducted field surveys to obtain information on special waste sites, cultural
information, and historic sites. The project team gathered some of the community information
specifically for the project. The project team reviewed existing maps and performed field reviews to
document the locations of homes, businesses, commercial buildings, public buildings, and
cemeteries. The information was refined based upon public input.
At the second set of CWG meetings, exhibits were displayed consisting of collected data overlain on
aerial photographs. Attendees were asked to review the data and to mark up the maps to show any
observed discrepancies. The exact location of the features was verified and entered into the data
set. New information was received from the public throughout the course of this project as new
attendees came to meetings and shared their knowledge of the community. The information was
updated throughout the duration of the project.
Sensitive Receptor
IDOT defines a sensitive receptor as a
land use where frequent outdoor
human activity occurs and where a low
traffic noise level would be of benefit.
Sensitive receptors typically include
homes, schools, hospitals, nursing
homes, and parks.
Illinois Natural Area Inventory (INAI)
Site
An INAI site is a high quality natural
area, habitat of endangered species,
or other significant natural feature as
identified by the Illinois Department of
Natural Resources.

EAST SIDE HIGHWAY ENVIRONMENTAL ASSESSM ENT
Alternatives July 2016 2-21
How were the impacts used to eliminate alternatives?
Impacts were calculated for each resource listed in Table 2.3-3. The resources shown in yellow were
not impacted by any remaining alternatives. The resources shown in orange were impacted similarly
by all of the alternatives; or the data was incomplete, so they
were not used to eliminate alternatives.
Only the resources shown in green, where the magnitude of
impacts varied widely, were identified as differentiating criteria
and were used to eliminate alternatives. The primary resources
used to eliminate alternatives include number of homes
displaced and acres of prime and important farmland affected.
How were home and farmland impacts used to eliminate alternatives?
For these resources, the range of impacts of the alternatives was graphed and a threshold value was
selected based upon the range. The threshold value was established in order to eliminate
alternatives with disproportionately high impacts. Alternatives with impacts equal to or greater than
the threshold value were eliminated. The threshold values were reviewed by the CWG and PSG for
reasonableness and agreed upon.
Residential Displacements: Residential displacements ranged
from 4 to 106 homes, with the higher number of impacts
concentrating along Towanda Barnes Road and the Multiple
East-West Arterial Expansion Alternative. Based on this range,
the threshold was determined to be 39 displacements (see
Figure 2.3-3). Therefore, alternatives with 39 or more
displacements were eliminated.
Differentiating Criteria
Differentiating criteria are criteria
where the impacts varied widely
among the remaining alternatives.
The differentiating criteria were used
to eliminate alternatives in the Macro
Analysis.
Displacement
A displacement is a direct impact to a
home, business, or other building.
Impacts to driveways, detached
garages, and parking lots are not
displacements, nor are visual or noise
impacts.

ENVIRONMENTAL ASSESSMENT EAST SIDE HIGH WAY
2-22 July 2016 Alternatives
Figure 2.3-3: Macro Analysis Residential Elimination
Thirteen alternatives, including the Multiple East-West Arterial Expansion Alternative (which would
displace over 100 residences), were eliminated. Of note, all alternatives that included the widening
of Towanda Barnes Road (also called BN1), were eliminated at this step in the process. See Figure
2.3-5 for the location of BN1. A total of 73 alternatives remained.
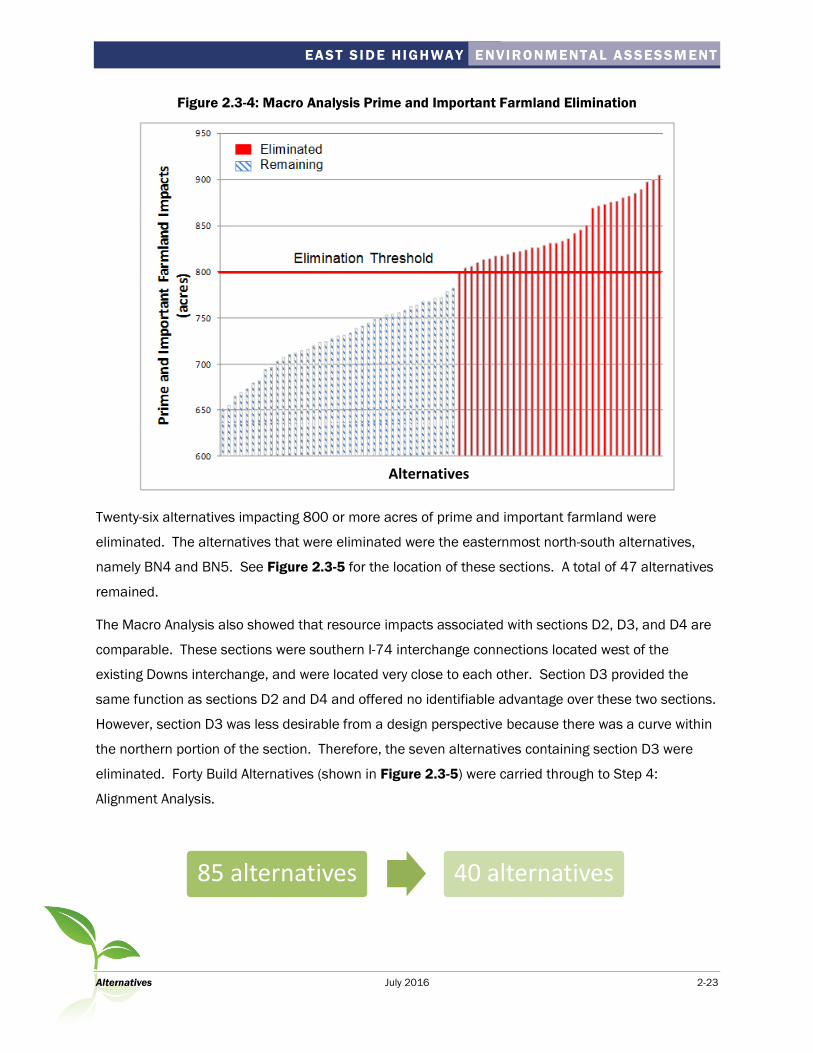
Prime and Important Farmland: The second differentiating
criterion was acres of prime and important farmland. The 73
remaining alternatives impacted between 651 and 905 acres
of prime and important farmland. Based on this range, a
threshold value of 800 acres was established (see Figure 2.3-
4).
Prime and Important Farmland
Prime farmland is land that has the
best combination of physical and
chemical characteristics for producing
food, feed, forage, fiber, and oilseed
crops and is also available for these
uses. Prime farmland does not have
to be cleared; however, it cannot be
urbanized, paved, or permanently
under water.
Alternatives
EAST SIDE HIGHWAY ENVIRONMENTAL ASSESSM ENT
Alternatives July 2016 2-23
Figure 2.3-4: Macro Analysis Prime and Important Farmland Elimination
Twenty-six alternatives impacting 800 or more acres of prime and important farmland were
eliminated. The alternatives that were eliminated were the easternmost north-south alternatives,
namely BN4 and BN5. See Figure 2.3-5 for the location of these sections. A total of 47 alternatives
remained.
The Macro Analysis also showed that resource impacts associated with sections D2, D3, and D4 are
comparable. These sections were southern I-74 interchange connections located west of the
existing Downs interchange, and were located very close to each other. Section D3 provided the
same function as sections D2 and D4 and offered no identifiable advantage over these two sections.
However, section D3 was less desirable from a design perspective because there was a curve within
the northern portion of the section. Therefore, the seven alternatives containing section D3 were
eliminated. Forty Build Alternatives (shown in Figure 2.3-5) were carried through to Step 4:
Alignment Analysis.
85 alternatives 40 alternatives
Alternatives

ENVIRONMENTAL ASSESSMENT EAST SIDE HIGH WAY
2-24 July 2016 Alternatives
Figure 2.3-5: Macro Analysis

EAST SIDE HIGHWAY ENVIRONMENTAL ASSESSM ENT
Alternatives July 2016 2-25
What is Step 4 of the evaluation process?
Step 4, the Alignment Analysis, further refined the impacts to environmental, community and
economic, agricultural, and cultural resources, in addition to design, sustainability and traffic. The
alternatives with disproportionately high impacts were eliminated.
This step followed an identical process as Step 3, comparing impacts and eliminating alternatives
based on these impacts. However, Step 4 used a refined right-of-way width of 250 feet, assuming
geometric standard for a four lane facility. Step 4 also added an additional resource category
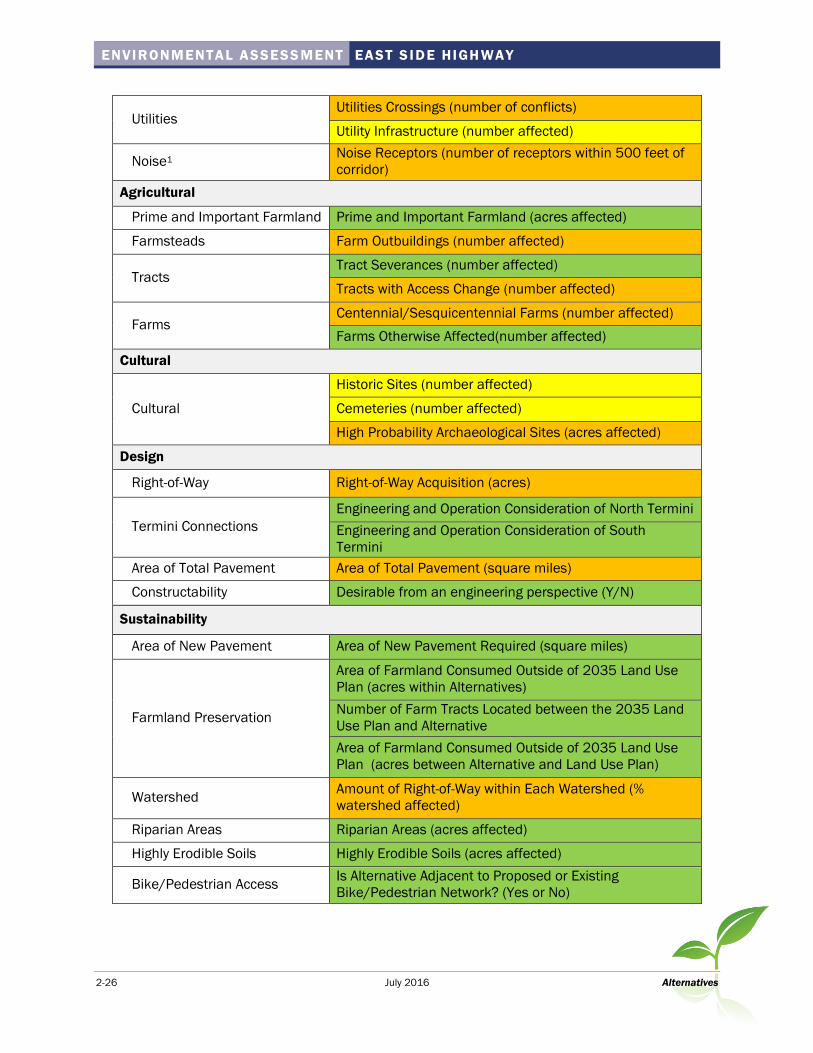
(Sustainability) to the evaluation. Table 2.3-4 identifies the seven categories and 44 criteria used to
evaluate environmental resources and potential impacts resulting from the 40 remaining
alternatives.
Table 2.3-4: Alignment Analysis Criteria
Criterion Unit of Measure
Environmental
Water Quality/Water
Resources
Floodplain (acres affected)
Floodways (acres affected)
Biologically Significant Streams (number of crossings)
Class 1 Streams (number of crossings)
Streams – Main stems (number of crossings)
Streams – Tributaries (number of crossings)
Drinking Water Supplies – Surface Water (number
affected)
Wetlands Wetland Areas (acres affected)
Wetland Areas (number affected)
Special Waste CERCLIS, LUST, RCRA Sites (number affected)
Forested Area Forested Area (acre affected)
Threatened & Endangered
Species Threatened & Endangered Species (number of species)
Community and Economic
Residences Homes, including Farm Homes (number displaced)
Business Commercial Buildings (number displaced)
Public Facilities Public Facilities (number displaced)
Public Facilities with Access Change (number affected)
Section 4(f) & 6(f) Impacts Parklands (acres affected)
Parklands (number affected)
ENVIRONMENTAL ASSESSMENT EAST SIDE HIGH WAY
2-26 July 2016 Alternatives
Utilities Utilities Crossings (number of conflicts)
Utility Infrastructure (number affected)
Noise1 Noise Receptors (number of receptors within 500 feet of
corridor)
Agricultural
Prime and Important Farmland Prime and Important Farmland (acres affected)
Farmsteads Farm Outbuildings (number affected)
Tracts Tract Severances (number affected)
Tracts with Access Change (number affected)
Farms Centennial/Sesquicentennial Farms (number affected)
Farms Otherwise Affected(number affected)
Cultural
Cultural
Historic Sites (number affected)
Cemeteries (number affected)
High Probability Archaeological Sites (acres affected)
Design
Right-of-Way Right-of-Way Acquisition (acres)
Termini Connections
Engineering and Operation Consideration of North Termini
Engineering and Operation Consideration of South
Termini
Area of Total Pavement Area of Total Pavement (square miles)
Constructability Desirable from an engineering perspective (Y/N)
Sustainability
Area of New Pavement Area of New Pavement Required (square miles)
Farmland Preservation
Area of Farmland Consumed Outside of 2035 Land Use
Plan (acres within Alternatives)
Number of Farm Tracts Located between the 2035 Land
Use Plan and Alternative
Area of Farmland Consumed Outside of 2035 Land Use
Plan (acres between Alternative and Land Use Plan)
Watershed Amount of Right-of-Way within Each Watershed (%
watershed affected)
Riparian Areas Riparian Areas (acres affected)
Highly Erodible Soils Highly Erodible Soils (acres affected)
Bike/Pedestrian Access Is Alternative Adjacent to Proposed or Existing
Bike/Pedestrian Network? (Yes or No)

EAST SIDE HIGHWAY ENVIRONMENTAL ASSESSM ENT
Alternatives July 2016 2-27
Traffic
Safety Analysis Percent Change in Total Crashes
Not Impacted
Impacted within same range or preliminary data
Impacted with wide range, differentiating criteria
1IDOT defines a sensitive receptor as a land use where frequent outdoor human activity occurs and where a low traffic noise level
would be of benefit. Sensitive receptors typically include homes, schools, hospitals, nursing homes, and parks.
How were the impacts used to eliminate alternatives?
As with Step 3, the resources and the threshold values used for eliminating alternatives were
reviewed by the CWG and PSG to assure consensus with the process. Table 2.3-4 shows the
impacts and their corresponding categories. The differentiating criteria are shown in green and were
used to eliminate alternatives. These criteria included termini
connections (interchanges), constructability, residential
displacements, farmland, and several of the sustainability
criteria.
Termini Connections: The first differentiating criterion was
termini (I-55 and I-74 interchange) connections. The
complexity and engineering feasibility of the interchanges at I-
55 and I-74 were evaluated. Termini interchange complexity
was determined through an inventory of interchange ramp
length, total auxiliary and Collector-Distributor (CD) lane miles,
the number of conflict points, and the number of bridge
structures on skew or on a curve. The termini were given a
rating of High, Medium, or Low complexity, relative to the alternative being evaluated. The
alternatives with a High complexity rating, indicating a high inventory number, were eliminated.
Based on this analysis, the 16 alternatives containing sections T3 or T19 (see Figure 2.2-1) were
eliminated. Twenty-four alternatives remained.
40 alternatives 24 alternatives
Collector-Distributor Road
A Collector-Distributor road is a
parallel, controlled-access roadway
that separates through traffic from
local traffic that is entering and exiting
the freeway or interstate system.
Auxiliary Lane
An auxiliary lane is the portion of a
roadway adjoining the traveled way to
help facilitate traffic movements: by
providing for parking, speed change,
turning, storage for turning, weaving,
truck climbing, or for other purposes.

ENVIRONMENTAL ASSESSMENT EAST SIDE HIGH WAY
2-28 July 2016 Alternatives
Constructability: The second differentiating criterion was constructability. Alternatives that contained
a skewed crossing at Towanda Barnes Road (sections D8 and D13 in Figure 2.2-1) were eliminated.
These alternatives would require a bridge over Towanda Barnes Road at a steeply skewed angle and
would not be desirable from a design, constructability, or maintenance perspective. Six alternatives
containing sections D8 and D13 were eliminated. Eighteen alternatives remained.
Next, alternatives that did not provide access to Cheneys Grove Road from Towanda Barnes Road
(sections D4 and D10 in Figure 2.2-1) were eliminated. Maintaining access from Towanda Barnes
Road would require a skewed intersection of the ESH, Towanda Barnes Road, and Cheneys Grove
Road and would not be desirable from a design, constructability, or maintenance perspective. Six
alternatives containing sections D4 and D10 were eliminated. Twelve alternatives remained.
Residential Displacements: Residential displacements ranged from 9 to 24 homes for the 12
remaining alternatives. (See Figure 2.3-6)
Figure 2.3-6: Alignment Analysis Residential Elimination
24 alternatives 18 alternatives
18 alternatives 12 alternatives
Alternatives
EAST SIDE HIGHWAY ENVIRONMENTAL ASSESSM ENT
Alternatives July 2016 2-29
Two alternatives with impacts of 24 or more displacements were eliminated, as these demonstrated
disproportionately high impacts when compared to the remaining alternatives.
Residential displacements for the remaining ten alternatives ranged from 9 to 19 homes. Four
alternatives containing section D1 had the highest residential displacements (ranging from 17 to 19)
because they would displace a cluster of homes within a proposed interchange footprint at US 150.
This interchange also resulted in the displacement of a place of worship. The interchange could not
be shifted to avoid the displacements because it would impact an electrical substation to the west or
would replicate other alternatives to the east. For these reasons, the four alternatives that contain
section D1 and resulted in the displacement of the cluster of homes at US 150 and the place of
worship were eliminated. Six alternatives remained (see Figure 2.3-7).
Sensitivity analysis was conducted for this step of the elimination process. When the order of the
criteria used in Step 4 was switched (e.g., agricultural impacts were measured first instead of
residential displacements), the analysis resulted in the same six alternatives remaining.
12 alternatives 6 alternatives
ENVIRONMENTAL ASSESSMENT EAST SIDE HIGH WAY
2-30 July 2016 Alternatives
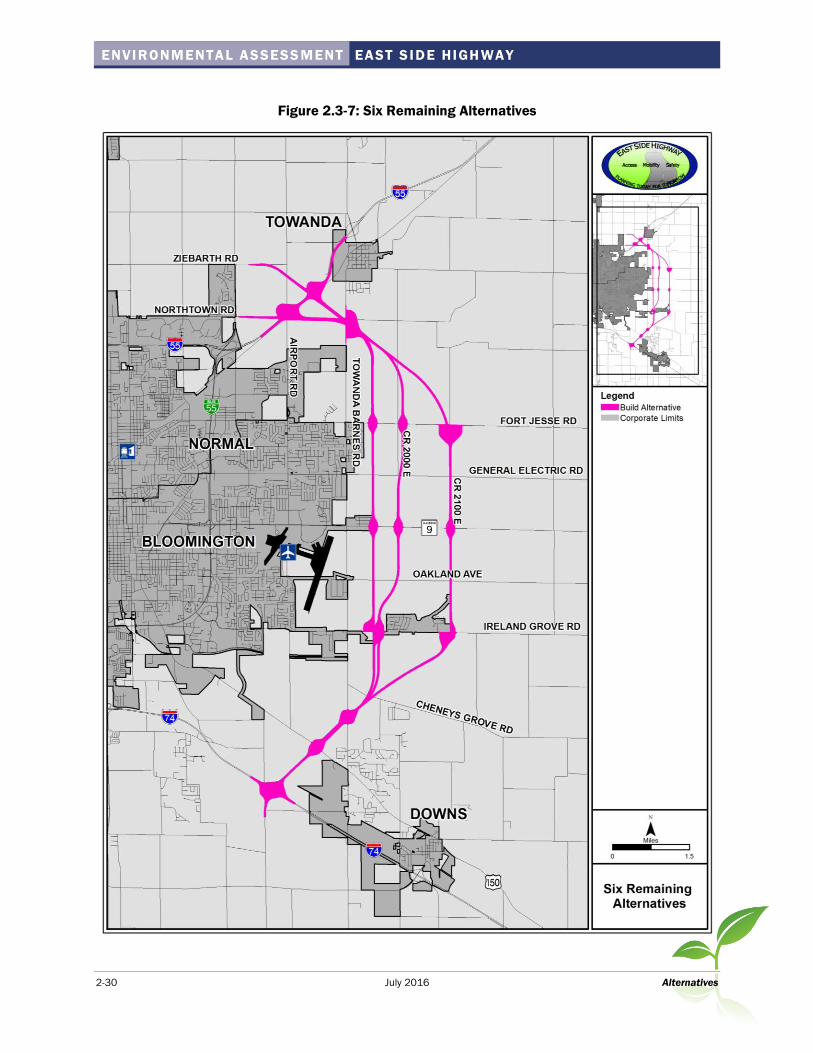
Figure 2.3-7: Six Remaining Alternatives

EAST SIDE HIGHWAY ENVIRONMENTAL ASSESSM ENT
Alternatives July 2016 2-31
The remaining six alternatives were further evaluated for
consistency with local and regional planning goals, impacts to
resources identified as, important to the general public, or
having differing levels of impact among the proposed
alternatives. These resources included agriculture and
resources related to sustainability.
Agriculture Impacts
Agriculture impacts were measured according to the amount of
prime and important farmland acres that would be acquired for
the roadway, the number of farm tracts severed, and farms
otherwise affected. The greatest loss of prime and important
farmland in acres is associated with Alternatives 121 and 122,
the two alternatives that use section BN4, which is the farthest
east of the remaining alternatives. Figure 2.3-8 shows the
range of prime and important farmland impacts for the six remaining alternatives.
Figure 2.3-8: Prime and Important Farmland Impacts for the Six Remaining Alternatives
600
650
700
750
800
850
900
121 122 124 125 126 127
Pri
me
an
d I
mp
ort
an
t Fa
rmla
nd
Im
pa
cts
(acr
es)
Alternatives
Other measures of impacts to agriculture were the severing of farm tracts and the number of
otherwise affected farms. When these two measures are combined to represent the disturbance to
farm tracts, Alternatives 121 and 122 represent the greatest impact to overall farm tracts (total of
77 farm tracts affected) when compared to the other four remaining alternatives where the impact is
71 tracts affected for each of the alternatives.
Farm Tract Severance
Severed farm operations occur when a
new roadway divides a farm either
laterally or diagonally, and separates
one or more tract from others within a
single farm operation. If an alignment
takes farm land on the edge or
perimeter of a farm tract, this is not a
severance.
Farms Otherwise Affected
Farms otherwise affected are tracts
that are either total acquisitions by a
proposed alignment or less than a 1/3
of a tract was acquired by a proposed
alignment. Farms otherwise affected
also included severed tracts where the
resulting farmable area was less than
5 acres (uneconomical remnant).

ENVIRONMENTAL ASSESSMENT EAST SIDE HIGH WAY
2-32 July 2016 Alternatives
Sustainability Criteria
Eight sustainability criteria were used to evaluate the six
remaining alternatives. (See Table 2.3-4). Of these criteria,
the proposed right-of-way (ROW) within each watershed was not
considered a differentiating criterion as the impacts resulting
from each alternative were similar. The remaining
sustainability criteria represented environmental impacts and
planning factors that varied among the six alternatives.
Farmland Preservation Criteria: The proposed alternatives’ compatibility with the land use plans
contained in the McLean County Regional Comprehensive Plan, the City of Bloomington
Comprehensive Plan, and the Town of Normal Comprehensive Plan were used as a measure of
sustainability. This evaluation demonstrated “potential” land development effects due to the
location of the proposed ESH (including leapfrog development, other unplanned growth outside the
2035 Land Use Plan Boundary, and associated infrastructure extension demand). The Farmland
Preservation Criteria was evaluated in three ways that considered immediate and potential impacts
of compatibility with the 2035 land use designated in the plans:
Area of Farmland Consumed Outside of 2035 Land Use Plan (acres within Alternative): Each
alternative was examined to determine how many acres of farmland in 2035 would be used
for ESH ROW. Alternative 121 and 122, which used Section BN4, were farthest from the
areas representing development and had the greatest disparity with the planning
boundaries. These alternatives utilized the greatest amount of farmland for ROW purposes
compared to the other four alternatives.
Number of Farm Tracts Located between the 2035 Land Use Plan and Alternative: The
second analysis measured the number of farm tracts between the 2035 Land Use Plan
boundaries for Bloomington & Normal (per their comprehensive plans) and each proposed
alternative. The greater the number of farm tracts between the proposed alternatives and
the planning boundary for development, the greater the potential for leapfrog development,
unplanned growth (and unplanned loss of agricultural production) and inconsistency with
local and regional planning goals. Alternatives 124, 125, 126 and 127 potentially affect
fewer farm tracts.
Sustainability
Sustainability creates and maintains
the conditions under which humans
and nature can exist in productive
harmony and that permit fulfilling the
social, economic and other
requirements of present and future
generations.

EAST SIDE HIGHWAY ENVIRONMENTAL ASSESSM ENT
Alternatives July 2016 2-33
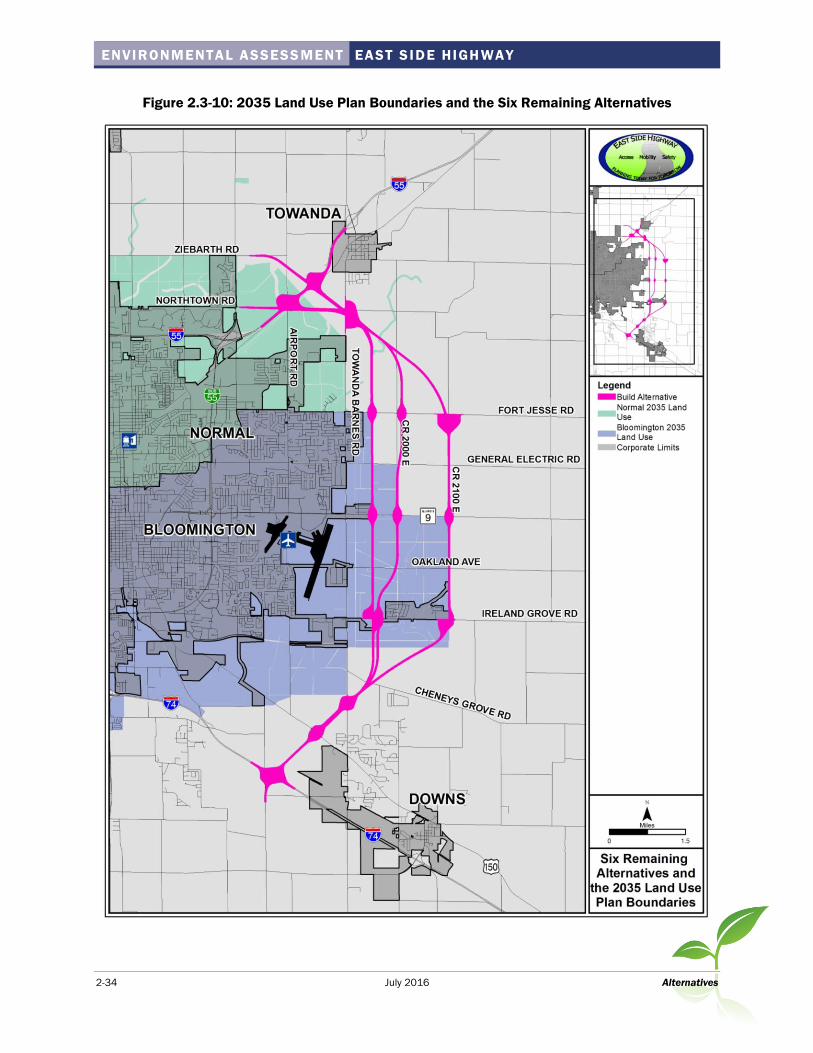
Area of Farmland Consumed Outside of 2035 Land Use Plan (acres between Alternative and
Land Use Plan): The third analysis measured the area of farmland between the 2035 Land
Use Plan boundaries and each alternative. The greater the separation distance between an
alternative and the planning boundary for development,
the greater the potential for leapfrog development,
unplanned growth (and unplanned loss of agricultural
production) and inconsistency with local and regional
planning goals.
Figure 2.3-9 depicts this range of primary agriculture
area potentially affected for the six remaining
alternatives. Alternative 122 was separated from the
edge of the Land Use Plan by 5,200 acres of primary agriculture land, followed by Alternative
121 at 5,000 acres. The other four alternatives were in closer proximity to the edge of the
Land Use Plan and thus the range of area was 2,200 acres (Alternative 124) to 3,400 acres
(Alternative 127). Figure 2.3-10 illustrates the 2035 Land Use Plan boundaries for
Bloomington & Normal (per their comprehensive plans) relative to the six remaining
alternatives.
Figure 2.3-9: Area of Primary Agriculture Land between 2035 Land Use
Plan Boundaries and the Six Remaining Alternatives
1300
1800
2300
2800
3300
3800
4300
4800
5300
5800
121 122 124 125 126 127
Farm
Land
(ac
res)
Alternatives
Leapfrog Development
Leapfrog development (also referred
to as urban sprawl) is the
development of lands in a manner
requiring the extension of public
facilities and services on the periphery
of an existing urbanized area where
such extension is not provided for in
the existing plans of the local
governing body.
ENVIRONMENTAL ASSESSMENT EAST SIDE HIGH WAY
2-34 July 2016 Alternatives
Figure 2.3-10: 2035 Land Use Plan Boundaries and the Six Remaining Alternatives

EAST SIDE HIGHWAY ENVIRONMENTAL ASSESSM ENT
Alternatives July 2016 2-35
Riparian Areas: Riparian areas were another sustainability
measure used to evaluate sustainability of the remaining
alternatives.
There are no lakes in the study area, so riparian impacts were
limited to streams. The three alternatives 121, 124, and 125
all utilize the section T1 interchange at I-55 that is associated
with eight acres of riparian impacts. Table 2.3-5 presents the
range of riparian impacts among the six remaining alternatives.
Table 2.3-5: Riparian Impacts for the Six Remaining Alternatives
Alternative Riparian
Impacts (acres)
121 24.1
124 20.6
125 19.1
122 13.8
126 9.6
127 8.8
Area of New Pavement Required: The area of new pavement required to construct each alternative
was another sustainability criterion used to differentiate between the six remaining alternatives.
Figure 2.3-11 depicts the area of new pavement within each alternative. This comparison
demonstrates that Alternatives 121 and 122 require the most new pavement area. This is attributed
to the length of these alternatives and reduced use of existing roadway systems for their
construction.
Riparian Area
Riparian Areas are transition zones
between land and water ecosystems
(banks and vegetation along streams).
Riparian areas protect water
resources from nonpoint source
pollution and provide bank
stabilization and aquatic and wildlife
habitat.
Highly erodible soils
Soils identified by the U.S. Department
of Agriculture to have a potential for
erosion that exceeds tolerable erosion
rates. Highly erodible soils can affect
storm water quality, require special
erosion control measures, and are
typically found near streams. Highly
erodible soils represent areas
sensitive to the construction and
operational impacts of roadways.
Increased soil erosion reduces soil
quality, suitability for agricultural use,
and soil permeability.

ENVIRONMENTAL ASSESSMENT EAST SIDE HIGH WAY
2-36 July 2016 Alternatives
Figure 2.3-11: Area of New Pavement Required for the Six Remaining Alternatives
0.20
0.22
0.24
0.26
0.28
0.30
0.32
0.34
121 122 124 125 126 127
Area
of N
ew P
avem
ent (
squa
re
mile
s)
Alternatives
Highly Erodible Soils: Highly erodible soil was a fourth measure used to evaluate sustainability of the
remaining six alternatives. Alternatives 121 and 122 result in greater impacts to highly erodible soils
compared to Alternatives 124, 125, 126, and 127.
Table 2.3-6: Highly Erodible Soil Impacts for the Six Remaining Alternatives
Alternative Highly Erodible Soil
Impacts (acres)
122 44.7
121 40.7
127 30.7
125 26.7
126 26.5
124 22.6
Proximity to Existing Bicycle/Pedestrian Network: Bicycle/pedestrian access was the final measure
used to evaluate sustainability of the remaining alternatives. The existing and proposed
bicycle/pedestrian network was reviewed to determine the proximity of the remaining alternatives to
this network. Alternatives farther from the bicycle/pedestrian network would have reduced
opportunities for multimodal use. Alternatives 121 and 122 are two miles from a proposed bicycle
route on Towanda Barnes Road. The other four alternatives were less than one mile from this route.
EAST SIDE HIGHWAY ENVIRONMENTAL ASSESSM ENT
Alternatives July 2016 2-37
Summary of Sustainability Criteria: The cumulative impacts of the environmental and planning
factors were considered in determining reasonable alternatives to carry forward into Step 5, the
Environmental Assessment Analysis. The location of Alternatives 121 and 122, with portions outside
the 2035 Land Use Plan Boundary, results in greater impacts to farmland and primary agriculture,
greater likelihood of unplanned urban development (and associated infrastructure extensions),
higher riparian impacts, and greater distances from planned bicycle/pedestrian routes. In
accordance with the objectives of the McLean County Regional Comprehensive Plan (November
2009), Alternatives 121 and 122 were removed given their consistently greater impact on these
resources. Four Build Alternatives (shown in Figure 2.3-12) were carried through to Step 5:
Environmental Assessment (EA) Analysis.
6 alternatives 4 alternatives

ENVIRONMENTAL ASSESSMENT EAST SIDE HIGH WAY
2-38 July 2016 Alternatives
Figure 2.3-12: Alignment Analysis
EAST SIDE HIGHWAY ENVIRONMENTAL ASSESSM ENT
Alternatives July 2016 2-39
2.4 Remaining Alternatives
What are the remaining alternatives?
The four ESH alternatives (shown in Figure 2.4-1 and individually in Figures 2.4-2 to 2.4-5) are four-
lane freeways (two lanes in each direction) with full access control. However, if the project were to
be constructed in phases, an expressway could be considered as an interim facility for either part or
all of the proposed ESH. The four remaining alternatives consist of parallel north-south sections
located approximately 2,250 feet apart. There are two interchange options at I-55 and one
interchange option at I-74. The alternatives include interchanges at the major east-west cross roads.
The impacts resulting from the alternatives are evaluated in Step 5 of the analysis.

ENVIRONMENTAL ASSESSMENT EAST SIDE HIGH WAY
2-40 July 2016 Alternatives
Figure 2.4-1: Four Remaining Alternatives
EAST SIDE HIGHWAY ENVIRONMENTAL ASSESSM ENT
Alternatives July 2016 2-41
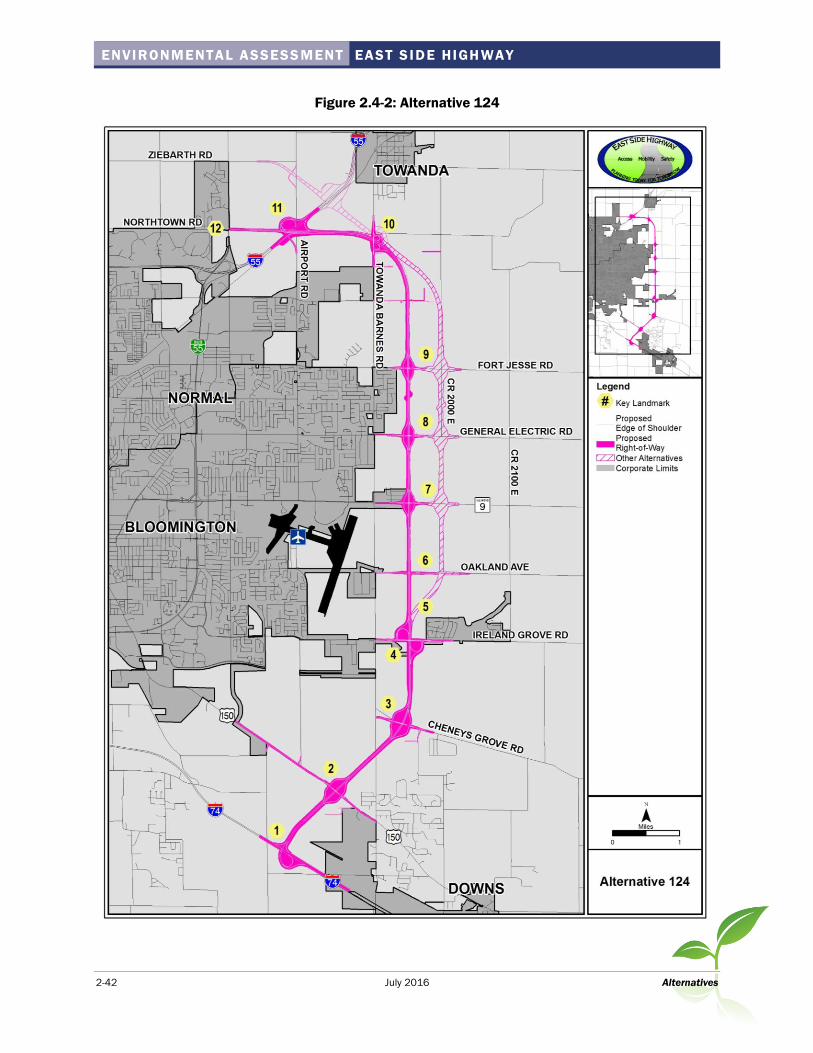
Alternative 124
At the southern limit, the alternative intersects with I-74 via a trumpet interchange (1). From there,
the alternative traverses northeast intersecting U.S. Route 150 (2) and Cheneys Grove Road (3) via
diamond interchanges and then curves north. The alternative then intersects with Ireland Grove
Road via a partial cloverleaf interchange (4). From there, the alternative traverses west of The Grove
subdivision and continues north on new alignment (5) crossing under Oakland Avenue via a grade-
separation (6). The alternative intersects Illinois Route 9 (Empire Street) (7), General Electric Road
(8), and Fort Jesse Road (9), via diamond interchanges and then curves west to intersect with
Towanda Barnes Road via a partial cloverleaf interchange (10). The alternative continues west along
Northtown Road and intersects I-55 via a modified trumpet interchange (11). The northern limit is
along existing Northtown Road west of I-55 (12).
ENVIRONMENTAL ASSESSMENT EAST SIDE HIGH WAY
2-42 July 2016 Alternatives
Figure 2.4-2: Alternative 124

EAST SIDE HIGHWAY ENVIRONMENTAL ASSESSM ENT
Alternatives July 2016 2-43
Alternative 125
At the southern limit, the alternative intersects with I-74 via a trumpet interchange (1). From there,
the alternative traverses northeast intersecting U.S. Route 150 (2) and Cheneys Grove Road (3) via
diamond interchanges and then curves north. The alternative then intersects with Ireland Grove
Road via a partial cloverleaf interchange (4). From there, the alternative curves to the east after
avoiding The Grove subdivision and continues north on new alignment (5) crossing under Oakland
Avenue via a grade-separation (6). The alternative intersects Illinois Route 9 (Empire Street) (7),
General Electric Road (8), and Fort Jesse Road (9), via diamond interchanges, traverses north along
existing CR 2000 East alignment, and then curves west to intersect with Towanda Barnes Road via a
partial cloverleaf interchange (10). The alternative continues west along Northtown Road and
intersects I-55 via a modified trumpet interchange (11). The northern limit is along existing
Northtown Road west of I-55 (12).

ENVIRONMENTAL ASSESSMENT EAST SIDE HIGH WAY
2-44 July 2016 Alternatives
Figure 2.4-3: Alternative 125

EAST SIDE HIGHWAY ENVIRONMENTAL ASSESSM ENT
Alternatives July 2016 2-45
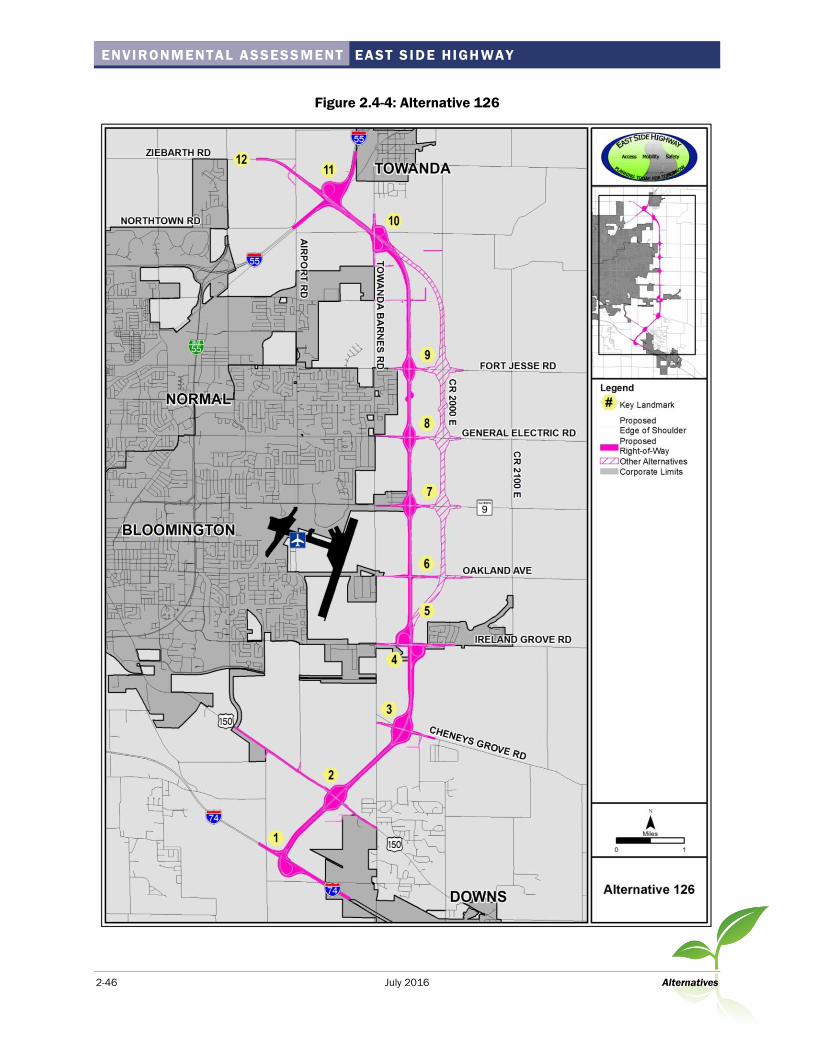
Alternative 126
At the southern limit, the alternative intersects with I-74 via a trumpet interchange (1). From there,
the alternative traverses northeast intersecting U.S. Route 150 (2) and Cheneys Grove Road (3) via
diamond interchanges and then curves north. The alternative then intersects with Ireland Grove
Road via a partial cloverleaf interchange (4). From there, the alternative traverses west of The Grove
subdivision and continues north on new alignment (5) crossing under Oakland Avenue via a grade-
separation (6). The alternative intersects Illinois Route 9 (Empire Street) (7), General Electric Road
(8), and Fort Jesse Road (9), via diamond interchanges and then curves west to intersect with
Towanda Barnes Road via a partial cloverleaf interchange (10). The alternative intersects I-55 via a
modified trumpet interchange (11). The northern limit is along E. Ziebarth Road northwest of I-55
(12).
ENVIRONMENTAL ASSESSMENT EAST SIDE HIGH WAY
2-46 July 2016 Alternatives
Figure 2.4-4: Alternative 126

EAST SIDE HIGHWAY ENVIRONMENTAL ASSESSM ENT
Alternatives July 2016 2-47
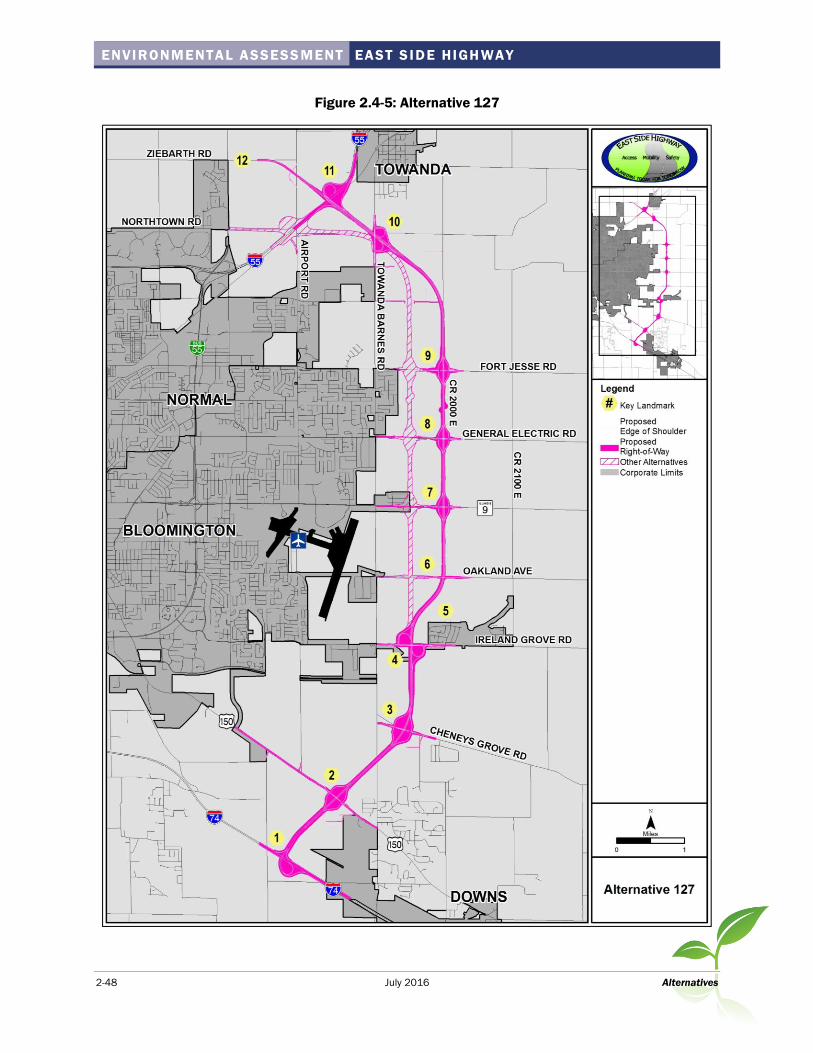
Alternative 127
At the southern limit, the alternative intersects with I-74 via a trumpet interchange (1). From there,
the alternative traverses northeast intersecting U.S. Route 150 (2) and Cheneys Grove Road (3) via
diamond interchanges and then curves north. The alternative then intersects with Ireland Grove
Road via a partial cloverleaf interchange (4). From there, the alternative curves to the east after
avoiding The Grove subdivision and continues north on new alignment (5) crossing under Oakland
Avenue via a grade-separation (6). The alternative intersects Illinois Route 9 (Empire Street) (7),
General Electric Road (8), and Fort Jesse Road (9), via diamond interchanges, traverses north along
existing CR 2000 East alignment, and then curves west to intersect with Towanda Barnes Road via a
partial cloverleaf interchange (10). The alternative intersects I-55 via a modified trumpet
interchange (11). The northern limit is along E. Ziebarth Road northwest of I-55 (12).
ENVIRONMENTAL ASSESSMENT EAST SIDE HIGH WAY
2-48 July 2016 Alternatives
Figure 2.4-5: Alternative 127
EAST SIDE HIGHWAY ENVIRONMENTAL ASSESSM ENT
Alternatives July 2016 2-49
What is Step 5 of the analysis?
Step 5, the Environmental Assessment Analysis, was the last step in the process. In Step 5 the
impacts to environmental, community and economic, agricultural, and cultural resources as well as
design and sustainability considerations, interchanges, access roads, and bicycle facilities were
evaluated for the remaining four alternatives. The analysis is presented in Chapter 3 of this
document.
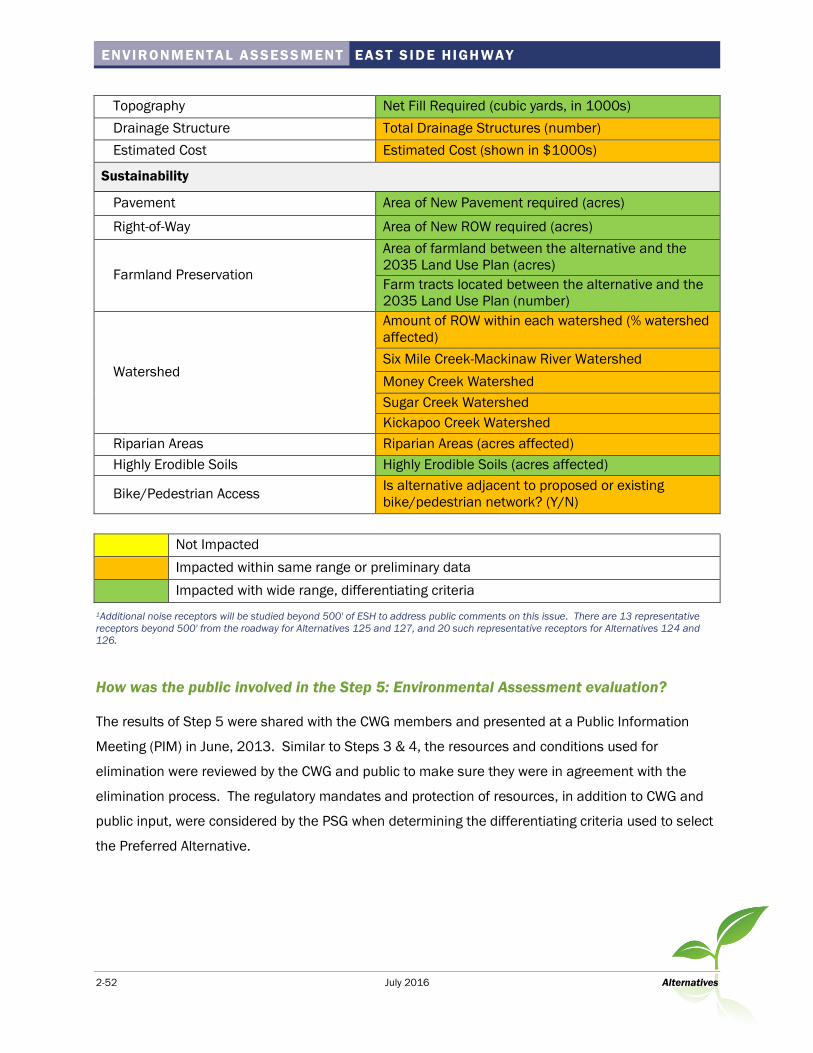
This step followed a similar process as Steps 3 & 4, comparing impacts and eliminating alternatives
based on the greatest impacts. However, Step 5 used a more refined ROW that varied between 250
and 350 feet based on a preliminary engineered right-of-way width. Table 2.3-5 identifies the six
categories and 71 criteria used in the analysis.

ENVIRONMENTAL ASSESSMENT EAST SIDE HIGH WAY
2-50 July 2016 Alternatives
Table 2.3-5: Environmental Assessment Analysis Criteria
Criterion Unit of Measure
Environmental
Water Quality/ Water Resources
Floodplain (acres affected)
Floodways (acres affected)
Biologically Significant Streams (number of
crossings)
Class I Streams (number of crossings)
Streams (number of main branch crossings)
Streams (number of tributary crossings)
Drinking Water Supplies - Private Wells within ROW
(number affected)
Drinking Water Supplies - Private Wells within 200 ft.
setback zone (number affected)
Wellhead Protection Areas (number affected)
Wetlands
Wetland Areas (number affected)
Wetland Areas (acres affected)
High Quality Wetland Areas (number affected)
High Quality Wetland Areas (acres affected)
Special Waste Recognized Environmental Conditions (RECs)
(number affected)
INAI Sites INAI Sites (acres affected)
T&E Species State and Federal Threatened and Endangered
Species (number affected)
Ecologically Sensitive Areas Ecologically Sensitive Areas (number affected)
Community and Economic
Residences Homes, including homes on a farmstead (number
displaced)
Environmental Justice Minority and/or Low Income Population Impacted?
(y/n)
Business Businesses (number displaced)
Parking (number of spaces lost)
Tax Base Change in Tax Revenue (percent)
Public Facilities & Services
Public Facilities (number displaced)
Public Service Facilities with Access Change (number
affected)
Section 4(f) & 6(f) Impacts Parklands (number affected)
Parklands (area affected)
Utilities Utilities Crossings (number of crossings)

EAST SIDE HIGHWAY ENVIRONMENTAL ASSESSM ENT
Alternatives July 2016 2-51
Utility Infrastructure Utility Infrastructure (number affected)
Noise
Representative Receptors within 500' of Each
Alternative1 (number)
Representative Receptors within 200' of Each
Alternative (number)
Representative Receptors within 100' of Each
Alternative (number)
Preferred Alternative Only: Impacted receptors and
anticipated noise levels (number with mitigation
required)
Agricultural
Prime and Important Farmland Prime and Important Farmland (acres affected)
Landlocked Parcels Landlocked Parcels (acres/number)
Farmsteads Farm Residences (number affected)
Farm Outbuildings (number affected)
Severances
Diagonally Severed Tracts (number affected)
Laterally Severed Tracts (number affected)
Severance Management Zones (acres)
Adverse Travel Adverse Travel (miles)
Tracts with Access Change (number affected)
Farms Otherwise Affected Farms Otherwise Affected(acres)
Number of Owners Owners (number affected)
Uneconomical Remnants Uneconomical Farm Remnants (number)
Centennial/ Sesquicentennial Farms Centennial or Sesquicentennial Farms (number
affected, by family)
Cultural
Cultural
Historic Sites (number affected)
Cemeteries (number affected)
High Probability Archaeological Sites (acres affected)
Design
ROW Total ROW (acres)
Termini Connections
I-55 Operational/Connectivity Impacts
Terminus Impacts
Route 66/High Speed Rail Impacts
Existing and Future Land Use Impacts
Operations
Volume to Capacity (congestion reduction)
Intersection Level of Service
Arterial Access
ENVIRONMENTAL ASSESSMENT EAST SIDE HIGH WAY
2-52 July 2016 Alternatives
Topography Net Fill Required (cubic yards, in 1000s)
Drainage Structure Total Drainage Structures (number)
Estimated Cost Estimated Cost (shown in $1000s)
Sustainability
Pavement Area of New Pavement required (acres)
Right-of-Way Area of New ROW required (acres)
Farmland Preservation
Area of farmland between the alternative and the
2035 Land Use Plan (acres)
Farm tracts located between the alternative and the
2035 Land Use Plan (number)
Watershed
Amount of ROW within each watershed (% watershed
affected)
Six Mile Creek-Mackinaw River Watershed
Money Creek Watershed
Sugar Creek Watershed
Kickapoo Creek Watershed
Riparian Areas Riparian Areas (acres affected)
Highly Erodible Soils Highly Erodible Soils (acres affected)
Bike/Pedestrian Access Is alternative adjacent to proposed or existing
bike/pedestrian network? (Y/N)
Not Impacted
Impacted within same range or preliminary data
Impacted with wide range, differentiating criteria
1Additional noise receptors will be studied beyond 500' of ESH to address public comments on this issue. There are 13 representative
receptors beyond 500' from the roadway for Alternatives 125 and 127, and 20 such representative receptors for Alternatives 124 and
126.
How was the public involved in the Step 5: Environmental Assessment evaluation?
The results of Step 5 were shared with the CWG members and presented at a Public Information
Meeting (PIM) in June, 2013. Similar to Steps 3 & 4, the resources and conditions used for
elimination were reviewed by the CWG and public to make sure they were in agreement with the
elimination process. The regulatory mandates and protection of resources, in addition to CWG and
public input, were considered by the PSG when determining the differentiating criteria used to select
the Preferred Alternative.

EAST SIDE HIGHWAY ENVIRONMENTAL ASSESSM ENT
Alternatives July 2016 2-53
How was the Preferred Alternative selected?
The resource impacts resulting from the four remaining alternatives were compared in order to
identify one Preferred Alternative. Generally, the Preferred Alternative is the alternative that meets
the purpose and need and minimizes the impacts to residences, environmental, cultural,
agricultural, and community resources. Public input is considered when selecting the Preferred
Alternative. However, FHWA and IDOT must comply with Federal and State laws that protect
environmental resources.
All of the four remaining Build Alternatives meet the Purpose and Need of the project. Although the
No Build Alternative does not meet the Purpose and Need, it can be selected as the Preferred
Alternative if the impacts resulting from the Build Alternatives are of a magnitude that FHWA, IDOT,
or the Federal and State resource agencies consider to be a greater environmental detriment than
the No Build Alternative’s inability to meet the project’s Purpose and Need.
Discussion of the Preferred Alternative is presented in Chapter 4 of this document, along with a
summary of impacts and ways to compensate for the impacts (also known as mitigation).

ENVIRONMENTAL ASSESSMENT EAST SIDE HIGH WAY
2-54 July 2016 Alternatives