CHAPTER 2 · In this chapter, the theoretical flow ... still overcome the inefficiency by providing...
54
29 CHAPTER 2 PASSIVE NORAMLLY CLOSED MICRO CHECK-VALVES 2.1 Overview Normally closed (NC) micro check-valve is used to stop liquid flow when liquid pressure difference across the membrane is lower than the designed cracking pressure. As shown in Figure 2-1, when the applied pressure P is lower than the designed cracking pressure, P c , the NC check-valve is closed, and vice versa. Generally the cracking pressure can be introduced electrically such as electromagnetic force, mechanically such as MEMS springs, or other physical approaches such as stiction force. Passive check- valves usually use mechanical approaches to reduce complexity and thus no controlling circuit is needed. To mechanically implement controllable cracking pressures onto the NC micro check-valves, many different types of pre-stress technique have been developed, such as cantilever type, diaphragm type, and bivalvular type, etc. [105]. These NC check-valves use deformation of covering materials geometrically designed to provide the desired controlling force based on the requirements of applications. The material selection would also depend on the application of the micro check-valves. For example, if high cracking pressure is necessary, materials with large Young’s modulus are used to provide the required pre-stressed force. Moreover, if the device is for human body implantation use, the biocompatible material such as parylene-C is needed to
Transcript of CHAPTER 2 · In this chapter, the theoretical flow ... still overcome the inefficiency by providing...

29
CHAPTER 2 PASSIVE NORAMLLY CLOSED MICRO CHECK-VALVES
2.1 Overview
Normally closed (NC) micro check-valve is used to stop liquid flow when liquid
pressure difference across the membrane is lower than the designed cracking pressure.
As shown in Figure 2-1, when the applied pressure P is lower than the designed cracking
pressure, Pc, the NC check-valve is closed, and vice versa. Generally the cracking
pressure can be introduced electrically such as electromagnetic force, mechanically such
as MEMS springs, or other physical approaches such as stiction force. Passive check-
valves usually use mechanical approaches to reduce complexity and thus no controlling
circuit is needed. To mechanically implement controllable cracking pressures onto the
NC micro check-valves, many different types of pre-stress technique have been
developed, such as cantilever type, diaphragm type, and bivalvular type, etc. [105].
These NC check-valves use deformation of covering materials geometrically designed to
provide the desired controlling force based on the requirements of applications. The
material selection would also depend on the application of the micro check-valves. For
example, if high cracking pressure is necessary, materials with large Young’s modulus
are used to provide the required pre-stressed force. Moreover, if the device is for human
body implantation use, the biocompatible material such as parylene-C is needed to
30
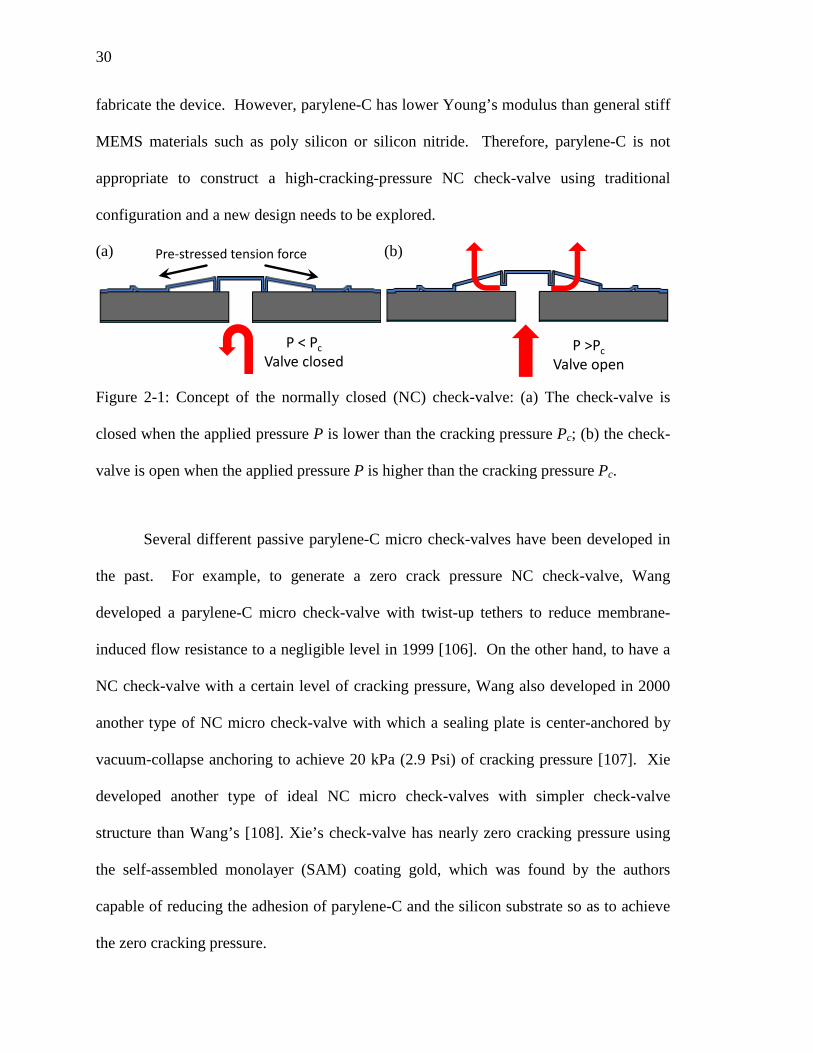
fabricate the device. However, parylene-C has lower Young’s modulus than general stiff
MEMS materials such as poly silicon or silicon nitride. Therefore, parylene-C is not
appropriate to construct a high-cracking-pressure NC check-valve using traditional
configuration and a new design needs to be explored.
Figure 2-1: Concept of the normally closed (NC) check-valve: (a) The check-valve is
closed when the applied pressure P is lower than the cracking pressure Pc; (b) the check-
valve is open when the applied pressure P is higher than the cracking pressure Pc.
Several different passive parylene-C micro check-valves have been developed in
the past. For example, to generate a zero crack pressure NC check-valve, Wang
developed a parylene-C micro check-valve with twist-up tethers to reduce membrane-
induced flow resistance to a negligible level in 1999 [106]. On the other hand, to have a
NC check-valve with a certain level of cracking pressure, Wang also developed in 2000
another type of NC micro check-valve with which a sealing plate is center-anchored by
vacuum-collapse anchoring to achieve 20 kPa (2.9 Psi) of cracking pressure [107]. Xie
developed another type of ideal NC micro check-valves with simpler check-valve
structure than Wang’s [108]. Xie’s check-valve has nearly zero cracking pressure using
the self-assembled monolayer (SAM) coating gold, which was found by the authors
capable of reducing the adhesion of parylene-C and the silicon substrate so as to achieve
the zero cracking pressure.
Pre-stressed tension force
P < PcValve closed
P >PcValve open
(a) (b)
31
Among all the parylene-C NC check-valves mentioned above, only one check-
valve is designed to be capable of providing the necessary cracking pressure, which is
still limited in a certain low pressure range due to parylene-C’s Young’s low modulus of
3-4 GPa. This would restrict the NC check-valve to be used in high pressure
applications. In addition, although the gas permeability of the parylene-C has been found
to be very small, e.g., oxygen permeability of parylene-C is 2.8 cm3·mm·m2·day-1·atm-1
[100], the parylene-C vacuum-collapse anchoring can still be in vein after a long time of
usage as the gas can still permeate through the parylene-C film into the cavity.
In this chapter, the theoretical flow-rate of micro check-valves and the amount of
the necessary pre-stress force are first investigated. Then a simple passive NC check-
valve structure is proposed and developed to be a standard MEMS NC check-valves
paradigm. NC check-valves with different level of cracking pressure are designed,
fabricated and characterized to cover a broad pressure range of applications. With very
similar structures, all of them consume no power, and are made of parylene-C to
guarantee the biocompatibility. The cracking pressure is obtained by stretching the
parylene-C using residual tensile stress introduced after thermal quenching (high pressure
applications), or by stiction and pop-up structure (low pressure applications). Although
with only 3–4 GPa of the parylene-C Young’s modulus, these pre-stress approaches can
still overcome the inefficiency by providing larger strain and thus make high cracking-
pressure parylene NC check-valve possible.
32
2.2 Theoretical Analysis of NC Micro Check-Valves
2.2.1 Thin-film-flow theory of the check-valve
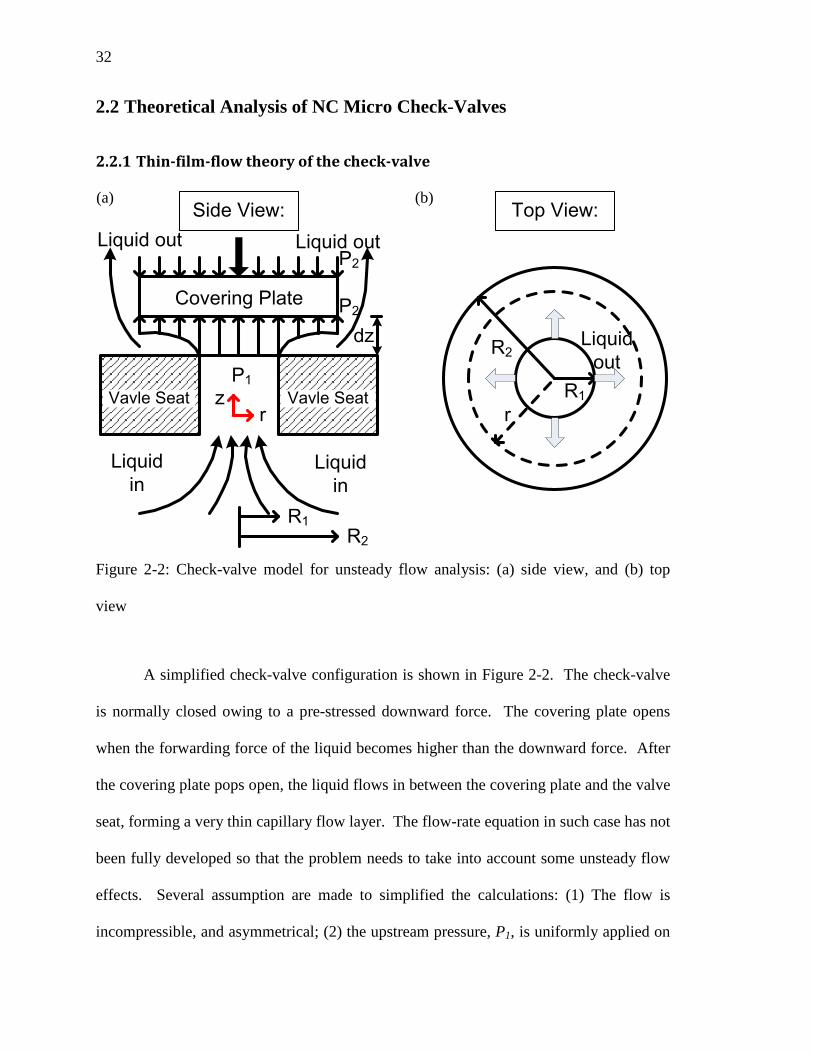
Figure 2-2: Check-valve model for unsteady flow analysis: (a) side view, and (b) top
view
A simplified check-valve configuration is shown in Figure 2-2. The check-valve
is normally closed owing to a pre-stressed downward force. The covering plate opens
when the forwarding force of the liquid becomes higher than the downward force. After
the covering plate pops open, the liquid flows in between the covering plate and the valve
seat, forming a very thin capillary flow layer. The flow-rate equation in such case has not
been fully developed so that the problem needs to take into account some unsteady flow
effects. Several assumption are made to simplified the calculations: (1) The flow is
incompressible, and asymmetrical; (2) the upstream pressure, P1, is uniformly applied on
P1
P2
P2
dz
Liquid out
Liquid in
Liquid in
Liquid out
rz R1
R2
r
Liquid out
Side View: Top View:
Covering Plate
Vavle SeatVavle Seat
R2R1
(a) (b)
33
the covering plate within the range of r ≤ R1, the radius of the opening, and so is the
downstream pressure, P2, which is the pre-stressed downward force; (3) the weight of the
liquid is negligible; (4) the opening gap, g, is much smaller than R1.
At low Reynolds numbers found in this thin film flow, the Navior-Stokes
equation can be reduced into the Reynolds equations of hydrodynamic lubrication as
follows [109]:
𝜕𝑝𝜕𝑧
= 0, 𝑎𝑛𝑑𝜕𝑝𝜕𝑟
= 𝜇𝜕2𝑢𝑟𝜕𝑧2
, (2-1)
where p is the pressure in the liquid film, µ is the dynamic viscosity and ur is the radial
velocity component. From the integration of eqn. (2-1), we can get radial velocity as:
𝑢𝑟(𝑧) =1
2𝜇𝑑𝑝𝑑𝑟
𝑧(𝑧 − 𝑔). (2-2)
Therefore, the volume flow-rate can be represented as:
𝑄(𝑟) = � 𝑢𝑟(𝑧)2𝜋𝑟𝑑𝑧 = −𝜋6𝑟𝜇
𝑔
0
𝑑𝑝𝑑𝑟
𝑔3. (2-3)
By conservation of mass, the volume flow-rate can be also shown as:
𝑄(𝑟) = 𝑄(𝑅1) − 𝜋�𝑟2 − 𝑅12�𝑑𝑔𝑑𝑡
, (2-4)
where 𝜋�𝑟2 − 𝑅12�𝑑𝑔𝑑𝑡
represents the volume increase within R1 and r. Equal eqns. (2-3)
and (2-4), yields
𝑟𝑑𝑝𝑑𝑟
=6𝜇𝑔3
𝑑𝑔𝑑𝑡
�𝑟2 − 𝑅12� + 𝑅1 (𝑑𝑝𝑑𝑟
)�𝑟=𝑅1
. (2-5)
Let 𝑟𝑅1
= 𝜆 and 𝑅2𝑅1
= 𝑀, and integrate equation (2-5) with respect to λ, then yields

34
𝑝 =3𝜇𝑔3
𝑑𝑔𝑑𝑡
𝑅12(𝜆2 − 2𝑙𝑛𝜆) + 𝑙𝑛𝜆 (𝑑𝑝𝑑𝜆
)�𝜆=1
+ 𝐶. (2-6)
To solve the constant C and (𝑑𝑝𝑑𝜆
)�𝜆=1
, substitute the boundary conditions with p=P1 at
λ=1 and p=P2 at λ=M and we can get:
𝐶 = 𝑝1 −3𝜇𝑔3
𝑑𝑔𝑑𝑡
𝑅12, (2-7)
and
(𝑑𝑝𝑑𝜆
)�𝜆=1
=1𝑙𝑛𝛭
�𝑝2 − 𝑝1 +3𝜇𝑔3
𝑑𝑔𝑑𝑡
𝑅12(1 −𝑀2 + 2𝑙𝑛𝑀)�. (2-8)
Substitute eqns. (2-7) and (2-8) into (2-6) and yields
𝑝 = 𝑝2 + (𝑝1 − 𝑝2) �1 −𝑙𝑛𝜆𝑙𝑛𝑀
� +3𝜇𝑔3
𝑑𝑔𝑑𝑡
𝑅12 �𝜆2 − 1 +𝑙𝑛𝜆𝑙𝑛𝑀
(1 −𝑀2)�, (2-9)
and hence the volume flow-rate of eqn.(2-3) becomes
𝑄(𝑟) = (𝑝1 − 𝑝2)𝜋
6𝜇𝑙𝑛𝑀−𝜋𝑟2𝑑𝑔𝑑𝑡
𝑅12 �2𝑟𝑅12
+1 −𝑀2
𝑟𝑙𝑛𝑀�. (2-10)
The total force that the liquid applied on the covering plate can be expressed as:
𝐹𝑇𝑜𝑡𝑎𝑙 = (𝑝1 − 𝑝2)𝜋𝑅12 + 𝐹𝑝𝑙𝑎𝑡𝑒 = (𝑝1 − 𝑝2)𝜋𝑅12 + � 𝑝2𝜋𝑀
1𝑅12𝜆𝑑𝜆
= �(𝑝1 − 𝑝2)𝜋𝑅12 �𝑀2 − 12𝑙𝑛𝑀
��
+𝜇𝑔3
𝑑𝑔𝑑𝑡
3𝜋2𝑅14 �1 −𝑀4 +
1 − 2𝑀2 + 𝑀4
𝑙𝑛𝑀�
= 𝐹𝑠𝑡𝑒𝑎𝑑𝑦 + 𝐹𝑢𝑛𝑠𝑡𝑒𝑎𝑑𝑦,
(2-11)
where Fsteady represents the applied force in steady state flow due to the pressure
difference, P1-P2, while Funsteady represents the unsteady state condition. The second term
35
becomes zero if the covering plate’s gap is fixed, i.e., 𝑑𝑔𝑑𝑡
= 0, or R1=R2, or the dynamic
viscosity, µ, is zero.
2.2.2 Calculation of the necessary pre-stress force
The liquid starts to flow when the upstream force is equivalent or higher than the
downstream force. The force balance at this moment can be used to find the necessary
pre-stress tensile stress and can be mathematically represented as:
𝑝1𝜋𝑅12 ≥ 𝑝2𝜋𝑅22, (2-12)
or
𝑝1 ≥ 𝑀2𝑝2 = 𝑝𝑐, (2-13)
where pc is defined as the cracking pressure of the check-valve. Assume the tensile stress
of the slanted tethers is σt, the tethers’ number, thickness, width, and angle are n, t, w, and
θ, respectively, then the required tensile stress can be derived as
𝜎𝑡 =𝜋𝑅12
𝑡𝑤𝑛𝑠𝑖𝑛𝜃𝑝𝑐. (2-14)
As the tensile stress is generated by annealing the check-valve in high temperature T1 and
quenched to room temperature Tr, 𝜎𝑡 can also be represented as:
𝜎𝑡 = 𝐸𝑝𝛼(𝑇1 − 𝑇𝑟), (2-15)
where Ep and α are the Young’s modulus and the thermal coefficient of expansion of
parylene-C, respectively. The annealing temperature can be determined by eqn. (2-15).
36
2.3 Pre-Stressed Slanted Tether Micro Check-Valves
2.3.1 Slanted tether NC check-valve configuration
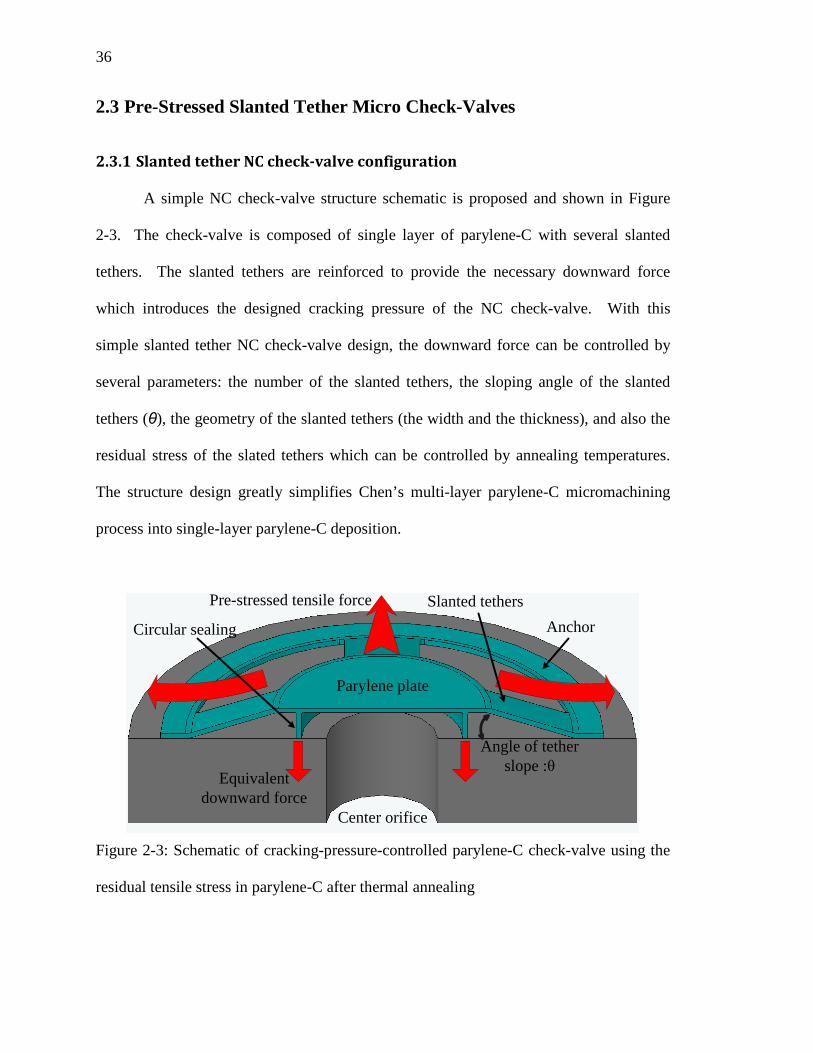
A simple NC check-valve structure schematic is proposed and shown in Figure
2-3. The check-valve is composed of single layer of parylene-C with several slanted
tethers. The slanted tethers are reinforced to provide the necessary downward force
which introduces the designed cracking pressure of the NC check-valve. With this
simple slanted tether NC check-valve design, the downward force can be controlled by
several parameters: the number of the slanted tethers, the sloping angle of the slanted
tethers (θ), the geometry of the slanted tethers (the width and the thickness), and also the
residual stress of the slated tethers which can be controlled by annealing temperatures.
The structure design greatly simplifies Chen’s multi-layer parylene-C micromachining
process into single-layer parylene-C deposition.
Figure 2-3: Schematic of cracking-pressure-controlled parylene-C check-valve using the
residual tensile stress in parylene-C after thermal annealing
Pre-stressed tensile force
Equivalent downward force
Angle of tether slope :θ
Center orifice
Parylene plate
Circular sealing
Slanted tethersAnchor

37
2.3.2 Thermal annealing pre-stressed NC check-valves
With the structure designed as in Figure 2-3, the slanted tethers are thermally
annealed at predetermined temperature after the sacrificial photoresist is released and
quenched down to room temperature afterwards. Since the residual tensile stress of the
thermally annealed parylene-C can be as high as 34 MPa at 250°C [110], this approach
allows the parylene-C tethers to provide a high downward force while it does not require
any post-fabrication manual manipulation.
In order to utilize the residual tensile stress in parylene-C after thermal annealing,
we need to make parylene-C tethers slanted with an angle, θ. After the check-valves are
processed with sacrificial photoresist releasing, they are annealed at a desired temperature
and then quenched quickly to room temperature. Because the thermal expansion
coefficient of parylene-C is much bigger than that of the silicon substrate, this process
generates a residual tensile stress in the slanted tethers. This residual tensile stress then
provides a net downward sealing force on the parylene-C NC check-valve’s covering
plate against the silicon orifice. The final cracking pressure can be mathematically
represented as:
𝑃𝑐 =𝑡 × 𝑤 × 𝑛 × 𝜎𝑡 × 𝑠𝑖𝑛𝜃
𝜋𝑟2, (2-16)
where Pc is the cracking pressure of the valve; t is the thickness of the parylene-C; w is
the width of the tethers; n is the number of the tethers; σt is the residual stress of
thermally annealed parylene-C; and r is the radius of the parylene-C covering plate. With
the thermally annealing residual tensile stress at 250°C as 34 MPa, the cracking pressure
of this check-valve can be achieved as high as several psi even for a small size check-
valve.
38
2.3.3 Sloped photoresist
2.3.3.1 One-time-exposure gray-scale photo-mask
The technique of using one-time-exposure gray-scale lithography to create the
sloped photoresist [111–117] is introduced in this section. The one-time-exposure gray-
scale lithography technique was originally invented to fabricate the diffractive optical
elements (DOE) [113]. Due to its capability of generating sloped photoresist, the
technique has also been used as the etching mask to create the sloped shape MEMS
devices [112, 117]. In this work, the technique is used to make sloped sacrificial
photoresist in the check-valve fabrication process.
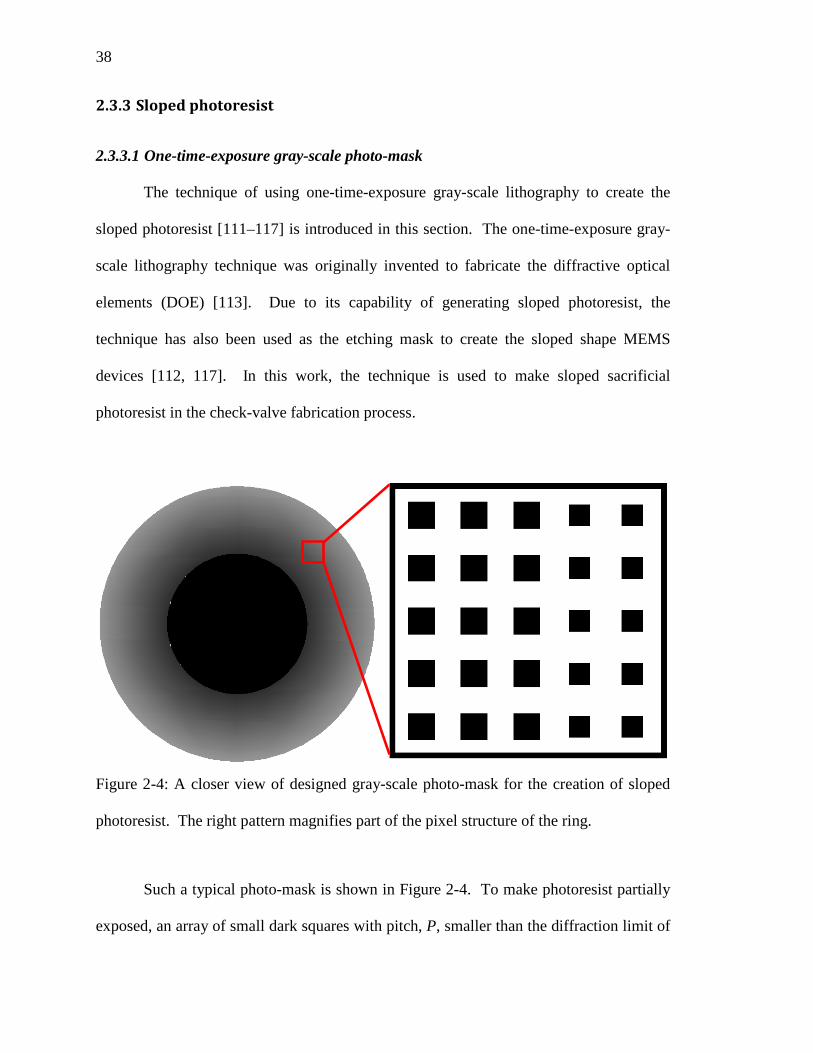
Figure 2-4: A closer view of designed gray-scale photo-mask for the creation of sloped
photoresist. The right pattern magnifies part of the pixel structure of the ring.
Such a typical photo-mask is shown in Figure 2-4. To make photoresist partially
exposed, an array of small dark squares with pitch, P, smaller than the diffraction limit of
39
the UV exposure system, Pc , are designed onto the photo-mask. Dark squares with pitch
smaller than the diffraction limit can actually make the first order diffraction light
blocked by the numerical aperture of the exposure system, making the light transmittance
of the photo-mask proportional to the coverage area of these dark squares [117].
The maximum allowable square pitch size which will not get resolved by the
optical system can be expressed as:
𝑃 ≤ 𝑃𝑐 =1
1 + 𝜎×
𝜆𝑁𝐴
, (2-17)
where σ is the coherence factor of the optical system, λ is the UV wavelength, which is
436 nm in our optical exposure system. NA is the numerical aperture of the optical
exposure system. According to the specification of our exposure stepper, the diffraction
limit is about 1 µm. In the transmittance design, “pulse width modulation” approach is
used, in which a constant square pitch with various dark square sizes as shown in Figure
2-4. With the 10:1 optical image reduction, we can have dark squares > 10 µm on our
photo-mask. Therefore, it is relatively low-cost to perform the gray-scale-mask
lithography using the regular commercially available transparency slides [115].
2.3.3.2 Linearization of the sloped sacrificial photoresist
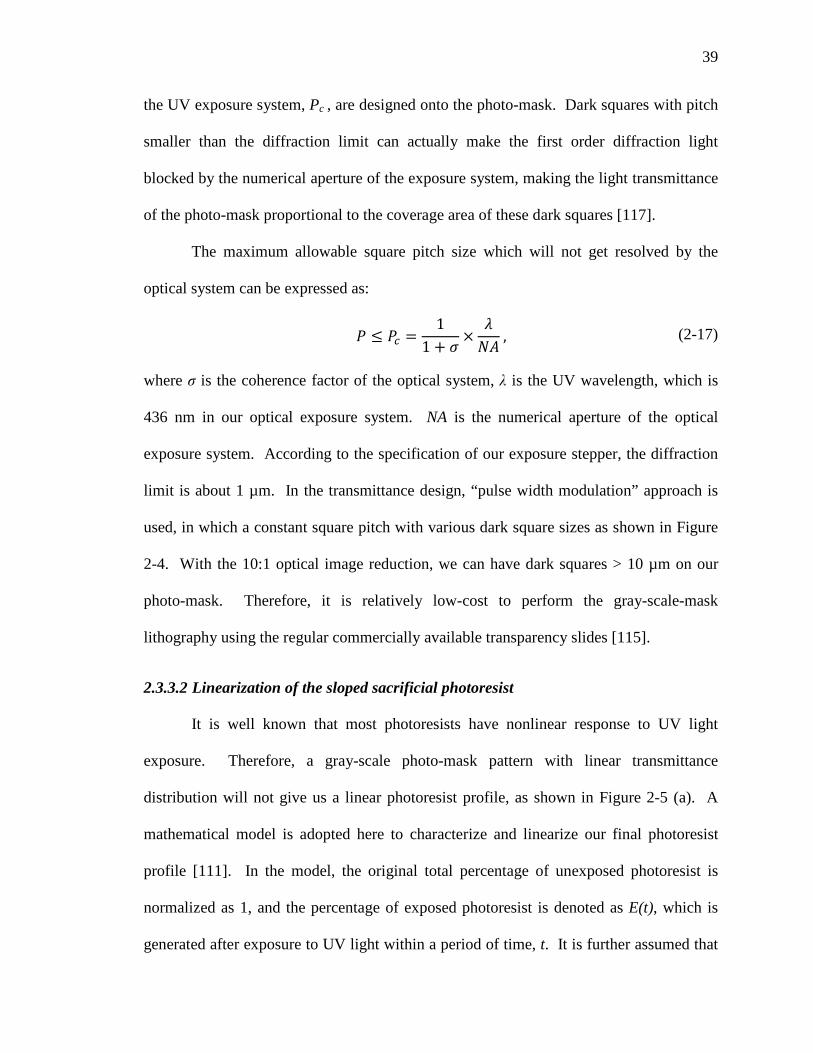
It is well known that most photoresists have nonlinear response to UV light
exposure. Therefore, a gray-scale photo-mask pattern with linear transmittance
distribution will not give us a linear photoresist profile, as shown in Figure 2-5 (a). A
mathematical model is adopted here to characterize and linearize our final photoresist
profile [111]. In the model, the original total percentage of unexposed photoresist is
normalized as 1, and the percentage of exposed photoresist is denoted as E(t), which is
generated after exposure to UV light within a period of time, t. It is further assumed that

40
the changing rate of exposed photoresist, 𝐸(𝑡)̇ , is proportional to the remaining
unexposed photoresist, 1 − 𝐸(𝑡), and the exposed light intensity I0T, where I0 is the
stepper light intensity and T is the transmittance of the photo-mask. Therefore, the
overall exposure system can be represented as an ordinary differential equation with the
initial condition as follows,
𝐸(0) = 0, (2-18)
and
𝑑𝐸(𝑡)𝑑𝑡
= 𝛼[1 − 𝐸(𝑡)]𝐼0𝑇, (2-19)
where α is the proportional constant. The constant is an optical property of the
photoresist’s sensitivity to UV light. The solution of eqns. (2-18) and (2-19) can be
obtained as
𝐸(𝑡) = 1 − 𝑒𝑥𝑝(−𝛼𝐼0𝑇𝑡). (2-20)
Therefore, to have a linear distribution of exposed photoresist, E(t), we can use eqn.
(2-20) to design the corresponding transmittance distribution on the photo-mask. Figure
2-5 (b) shows the scanning result of the characterized and then linearized photoresist
profile.
Figure 2-5 (b), the gray-scale photo-mask is composed of 16 levels with
increasing transmittance from left to the right of the sloping area with each level
translating into a photoresist height proportional to 𝑒𝑥 𝑝(−𝛼𝐼0𝑡). In order to create a true
linear slope, a test photoresist strip was first fabricated for characterization. Then, the
transmittance of each ring is adjusted according to the resulted photoresist height from
41
the test strip. It was shown in literature that larger αI0t produces more reliable results
[111]. In our case, I0 is measured as 200–250 mw/cm2 in the stepper, which is one order
of magnitude higher than the published literature. With t taken as 4 seconds, our
exposure energy is within the right regime suggested in the literature.
Figure 2-5: One-time-exposure gray-scale sacrificial photoresist profile: (a) before
linearization, and (b) after linearization
2.3.4 Fabrication
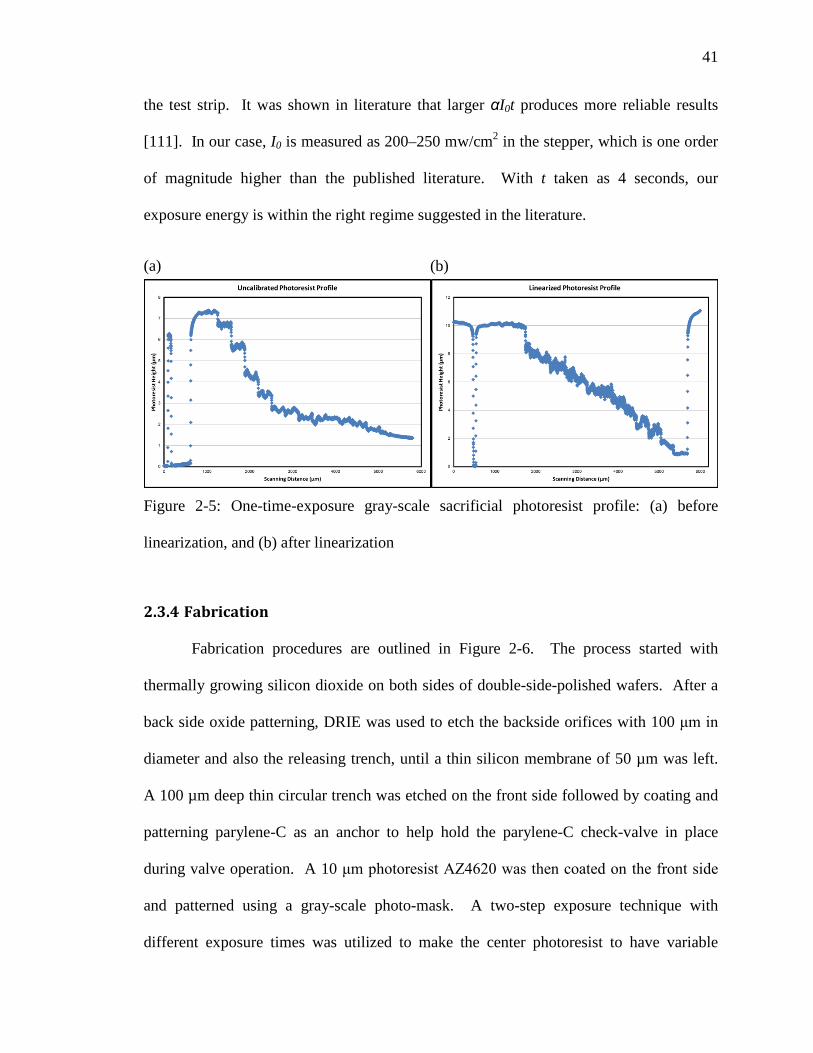
Fabrication procedures are outlined in Figure 2-6. The process started with
thermally growing silicon dioxide on both sides of double-side-polished wafers. After a
back side oxide patterning, DRIE was used to etch the backside orifices with 100 μm in
diameter and also the releasing trench, until a thin silicon membrane of 50 µm was left.
A 100 µm deep thin circular trench was etched on the front side followed by coating and
patterning parylene-C as an anchor to help hold the parylene-C check-valve in place
during valve operation. A 10 μm photoresist AZ4620 was then coated on the front side
and patterned using a gray-scale photo-mask. A two-step exposure technique with
different exposure times was utilized to make the center photoresist to have variable
(a) (b)
42
heights serving the mold of the valve sealing ring. After 10 µm of parylene-C coating
and patterning, the through holes and trenches were completed by DRIE etching. The
sacrificial photoresist was then removed by acetone and IPA.
1. Back-side oxide patterning and DRIE etching (mask #1)2. Front-side oxide patterning and DRIE etching (mask #2)
1. Front-side 2nd layer parylene coating (5 µm)2. Front-side 2nd layer parylene patterning (mask #6)
1. Back-side DRIE to release the valve2. Photoresist stripping3. Annealing in vacuum oven
1st layer ParyleneSilicon Oxide Photoresist
1. Front-side 1st layer parylene coating and patterning (mask #3)2. Slanting sacrificial PR coating (mask#4)3. 2-step sealing trench making (mask#5)
2nd layer Parylene
1. Double-sided polished wafers with 1 µm oxide grown on both sides
Figure 2-6: Fabrication procedures. Slanted sacrificial photoresist is achieved using a
one-time-exposure gray-scale photo-mask photolithography approach.
43
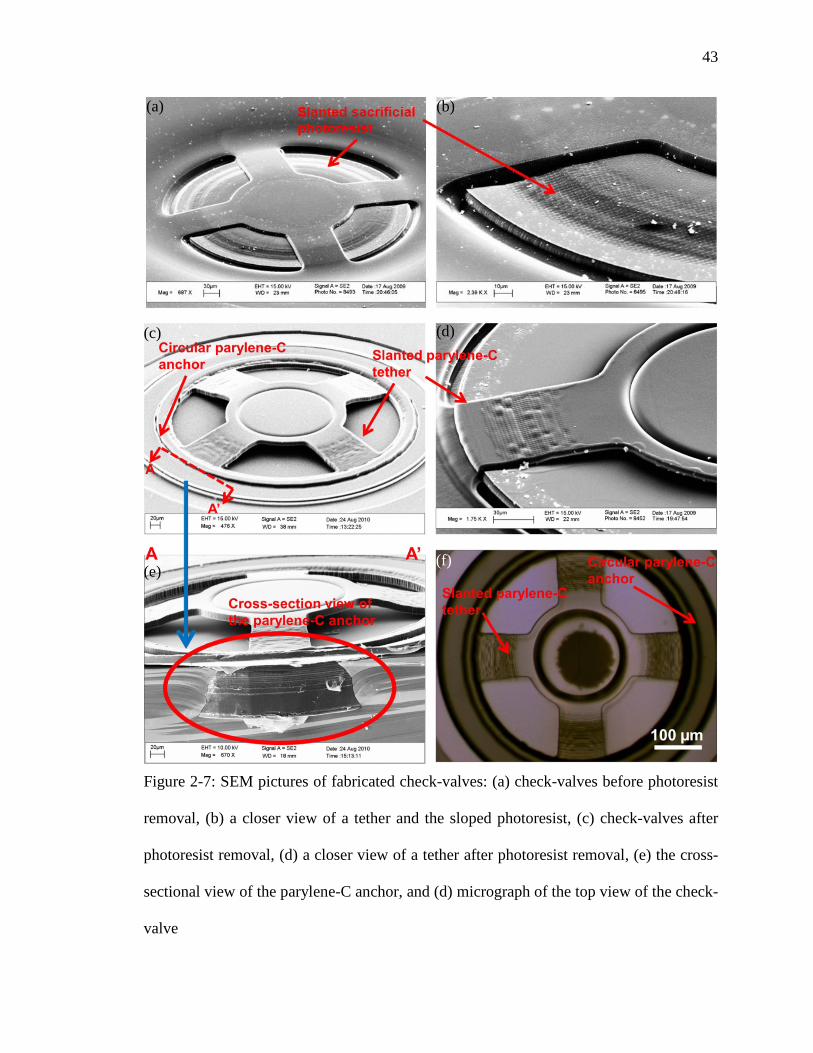
Figure 2-7: SEM pictures of fabricated check-valves: (a) check-valves before photoresist
removal, (b) a closer view of a tether and the sloped photoresist, (c) check-valves after
photoresist removal, (d) a closer view of a tether after photoresist removal, (e) the cross-
sectional view of the parylene-C anchor, and (d) micrograph of the top view of the check-
valve
(a) (b)
(c) (d)
(e) (f)
44
SEM images of fabricated devices before and after photoresist stripping are
shown in Figure 2-6 (a) to (e). Figures 2-6 (a) and (b) illustrate the successful creation of
the slanted sacrificial photoresist profile by the one-time-exposure gray-scale lithography.
Figures 2-6 (c) and (d) demonstrate the resulted linearly slanted parylene-C tethers after
removing the photoresist. Figure 2-6 (e) shows the cross sectional view of the successful
parylene-C anchor. Figure 2-6 (f) is the micrograph of the top view of the check-valve.
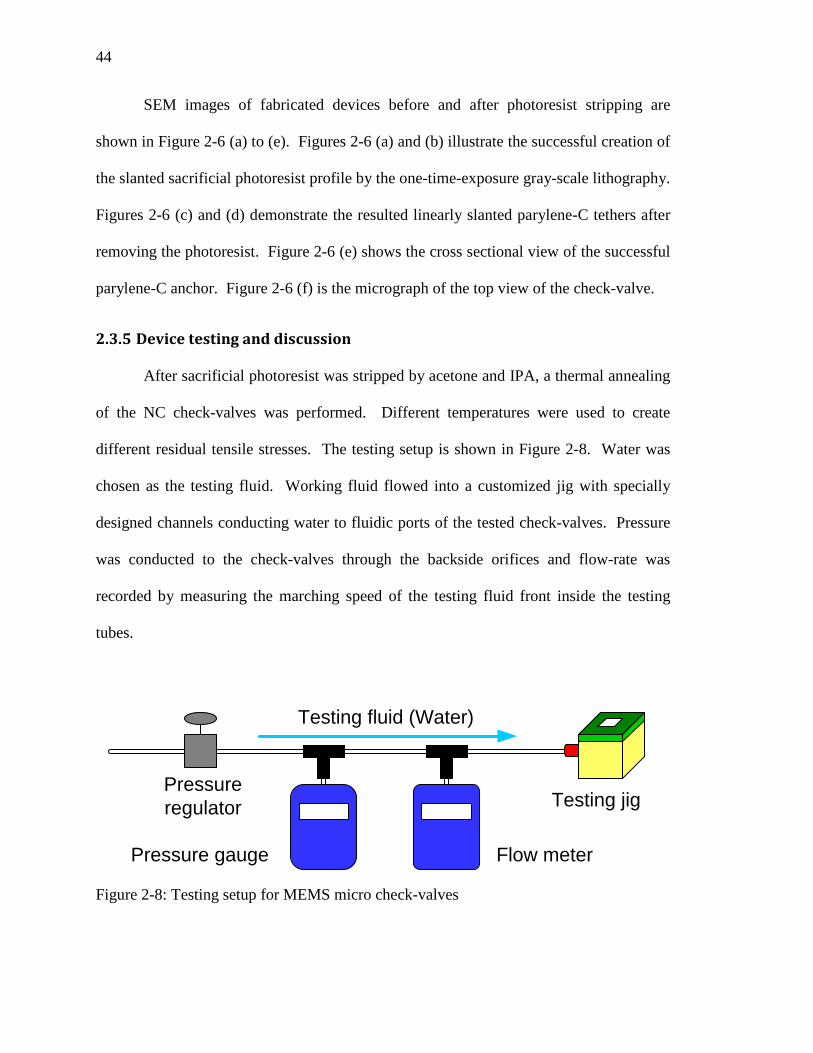
2.3.5 Device testing and discussion
After sacrificial photoresist was stripped by acetone and IPA, a thermal annealing
of the NC check-valves was performed. Different temperatures were used to create
different residual tensile stresses. The testing setup is shown in Figure 2-8. Water was
chosen as the testing fluid. Working fluid flowed into a customized jig with specially
designed channels conducting water to fluidic ports of the tested check-valves. Pressure
was conducted to the check-valves through the backside orifices and flow-rate was
recorded by measuring the marching speed of the testing fluid front inside the testing
tubes.
Pressureregulator
Testing fluid (Water)
Pressure gauge Flow meter
Testing jig
Figure 2-8: Testing setup for MEMS micro check-valves

45
Two cracking pressure controlling factors were considered and tested: parylene-C
tether width and the annealing temperature. To study the influence of the parylene-C
tether width, check-valves with 3 different tether widths (50 μm, 70 μm, 100 μm) were all
annealed at 100°C for 1 hour and then quenched to room temperature to generate the
necessary residual tensile stress. The pre-annealed check-valves were characterized by
the proposed testing setup and the cracking pressures were measured to be 0.3 psi, 1.5
psi, and 2.9 psi, respectively as shown in Figure 2-9. It is shown that the check-valve’s
cracking pressure increases as the tethers widen. This agrees with our expectation
because increased width means increased pre-stressed force.
Figure 2-9: Parylene-C tether width effect of the characterization results of thermally pre-
stressed slanted tether micro check-valves: different tether widths but with the same
annealing temperature at 100°C
0.3 1.5 2.9
46
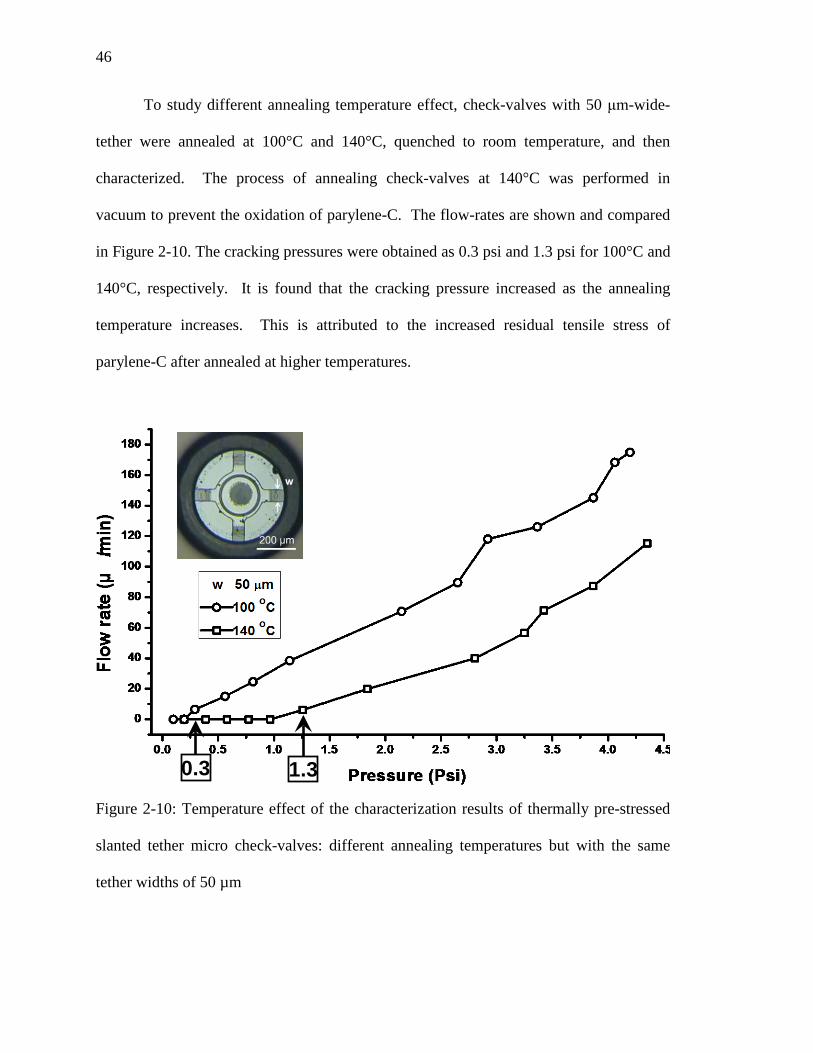
To study different annealing temperature effect, check-valves with 50 μm-wide-
tether were annealed at 100°C and 140°C, quenched to room temperature, and then
characterized. The process of annealing check-valves at 140°C was performed in
vacuum to prevent the oxidation of parylene-C. The flow-rates are shown and compared
in Figure 2-10. The cracking pressures were obtained as 0.3 psi and 1.3 psi for 100°C and
140°C, respectively. It is found that the cracking pressure increased as the annealing
temperature increases. This is attributed to the increased residual tensile stress of
parylene-C after annealed at higher temperatures.
Figure 2-10: Temperature effect of the characterization results of thermally pre-stressed
slanted tether micro check-valves: different annealing temperatures but with the same
tether widths of 50 µm
0.3 1.3

47
To summarize, the cracking pressures of NC check-valves consistently increase
with the increasing tether width and the annealing temperature. However, experimental
data also showed that the cracking pressure could deviate from the theoretical value.
This is likely because the flexibility of the parylene-C covering plate which cannot
provide a strong fixed boundary condition. Therefore, the induced thermal stress cannot
be as high as calculated. In addition, it is also found that, even at the room temperature,
the cracking pressure tends to decrease at the early measuring stage after annealing. This
is due to the stress relaxation of the parylene-C tethers right after annealing. The
phenomenon of stress relaxation of parylene-C will be discussed more in detail in Section
5.8.3.
2.4 Integration of Slanted Tether Check-Valves for High-Pressure
Applications
The thermally pre-stressed slanted-tether micro check-valves has been proved to
be capable of delivering cracking pressures as high as 2.3 psi in Section 2.3. The check-
valves’ tethers are reinforced by quenching check-valves to room temperature after the
stress-relaxation annealing process to induce high residual tensile stress in the tethers.
However, even though the cracking pressure of this slanted tether check-valve can be
adjusted by annealing at different temperature, the maximum cracking pressure
achievable with a single check-valve is still limited by the bonding strength between
parylene-C and silicon in the anchor region, and also the ultimate tensile strength of the
parylene-C tethers.
In this section, multiple slanted tether check-valves are integrated in series to
achieve even higher cracking pressures. In a series construction, each slanted tether

48
check-valve could be modeled as a diode, where pressure and flow-rate are analogous to
voltage and current respectively. Using this model, multiple check-valves can be easily
analyzed and connected in series to achieve a larger total pressure drop even though the
pressure drop across each check-valve is smaller. This situation is similar to using a
series connection of multiple diodes to achieve a higher total voltage drop.
2.4.1 Electrical-equivalent diode model
As shown in Figure 2-2, the volume flow-rate, Q, at r = R2 equals the final exit
flow-rate of the check-valve. Q can be calculated and rearranged from eqn. (2-10) as
𝑄(𝑟)|𝑟=𝑅2 = (𝑝1 − 𝑝2)𝜋
6𝜇𝑙𝑛𝑀−𝑑𝑔𝑑𝑡
�𝜋𝑅22 +𝜋2𝑅12 − 𝑅22
𝑙𝑛𝑀�. (2-21)
Therefore, in order to successfully generate the flow-rate, the applying pressure of
the liquid p1 needs to be higher than the cracking pressure, pc, shown in eqn. (2-13) with
the flow-rate presented eqn. (2-21). The whole system can be equivalently modeled as a
diode shown in Figure 2-11 with cut-in voltage as pc. The flow-rate in eqn. (2-21) can be
modeled as the electrical current after the cut-in voltage.
2.4.2 Multiple check-valve integration
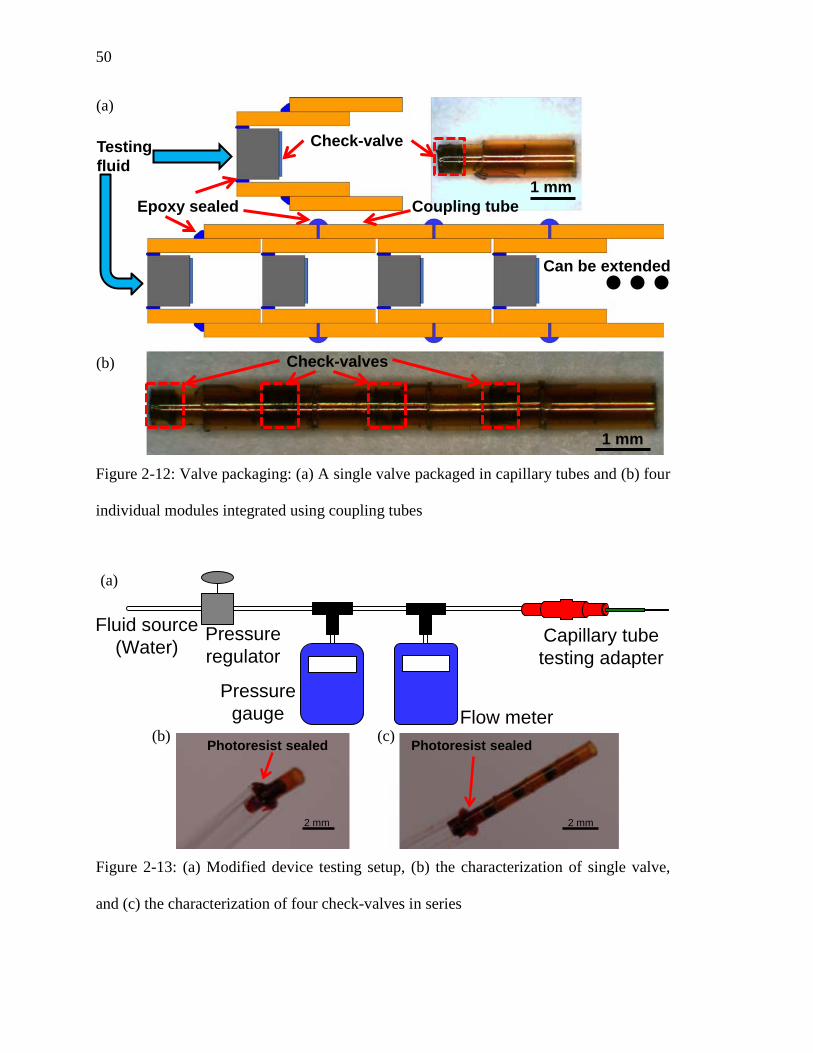
The check-valves were first annealed at 140ºC and quenched to room temperature
to introduce the residual tensile stress in tethers. To assemble the device, each check-
valve was first inserted into a thin glass capillary tube, whose inner diameter is 530 µm,
and sealed with epoxy as shown in Figure 2-12 (a). These individual assemblies were
then characterized to obtain their cracking pressure and flow profile. Photoresist was
used to seal the gap between the assembly and the testing tube so that the assembly can
be released for later integration, as shown in Figure 2-13 (b). Afterwards, each pair of

49
assemblies were coupled together with a wider capillary tube (inner diameter of 660 µm)
to form an assembly of multiple check-valves, as shown in Figure 2-12 (b), then sealed
with epoxy, and tested as shown in Figure 2-13 (c).
Figure 2-11: Equivalent electrical circuit component model of check-valves: (a) one-
diode model of one check-valve. k and dz are the spring constant of the tethers and the
covering plate displacement, respectively. (b) In-series diodes model of in-series check-
valves
Po+ΔP
Po Po
k*dz
dz
Liquid outLiquid
in Equivalent to
Po+ΔP PoΔP
Po+ΔP
Po
Po+ΔP1+ΔP2 Po+ΔP1ΔP1 ΔP2 Po
Po+ΔP1+ΔP2
Po+ΔP1
Po
ΔP2
ΔP1
Liquid in
Liquid out
ΔP
(a)
(b)
50
Figure 2-12: Valve packaging: (a) A single valve packaged in capillary tubes and (b) four
individual modules integrated using coupling tubes
Figure 2-13: (a) Modified device testing setup, (b) the characterization of single valve,
and (c) the characterization of four check-valves in series
Check-valve
1 mm
1 mm
Epoxy sealed
Testingfluid
Coupling tube
Check-valves
Can be extended
Photoresist sealed Photoresist sealed
2 mm 2 mm
Pressureregulator
Fluid source(Water)
Pressuregauge Flow meter
Capillary tube testing adapter
(a)
(b)
(a)
(b) (c)

51
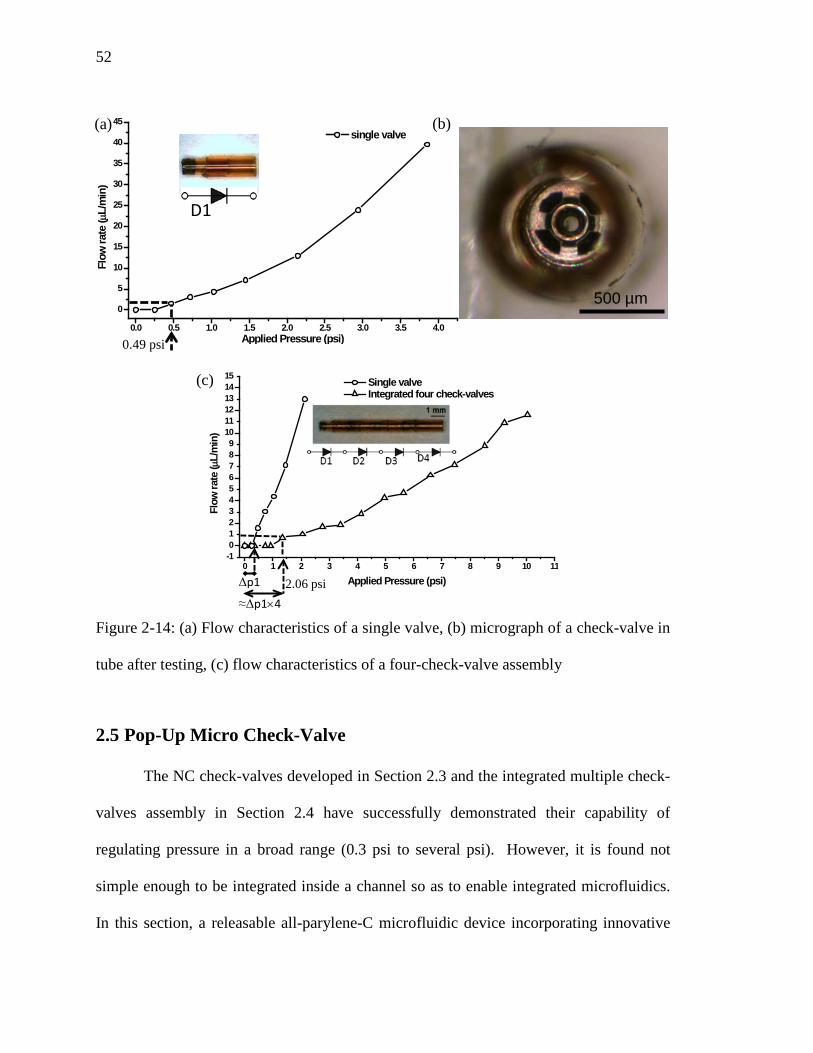
2.4.3 Characterization results and discussion
The measured cracking pressures of each check-valve and the check-valve
assembly are listed in Table 2-1. The flow profiles comparison between a single check-
valve and a four-check-valve assembly is shown in Figure 2-14. The results show that
the cracking pressure of a single valve falls between 0.42 psi and 0.49 and achieves 2.06
psi with four integrated check-valves. The parylene-C check-valves remain intact after
many tests with inspection shown in Figure 2-14 (b). This proves the durability of the
parylene-C anchors of the check-valve, which are to prevent de-bonding due to both the
high tensile stress within the parylene-C layer after annealing process and the high
pressure during the entire characterization process. The results verify the concept of
integrating multiple slanted tether check-valves in series to create a high cracking
pressure device for high-pressure microfluidic applications.
Table 2-1: Measured cracking pressures of four single check-valves and the assemblies of
multiple check-valves
Single valve 1 2 3 4
Cracking pressure 0.49 psi 0.43 psi 0.47 psi 0.42 psi
Multiple valves 2 valves 3 valves 4 valves
Cracking pressure 1.01 psi 1.48 psi 2.06 psi
52
Figure 2-14: (a) Flow characteristics of a single valve, (b) micrograph of a check-valve in
tube after testing, (c) flow characteristics of a four-check-valve assembly
2.5 Pop-Up Micro Check-Valve
The NC check-valves developed in Section 2.3 and the integrated multiple check-
valves assembly in Section 2.4 have successfully demonstrated their capability of
regulating pressure in a broad range (0.3 psi to several psi). However, it is found not
simple enough to be integrated inside a channel so as to enable integrated microfluidics.
In this section, a releasable all-parylene-C microfluidic device incorporating innovative
0.0 0.5 1.0 1.5 2.0 2.5 3.0 3.5 4.0
0
5
10
15
20
25
30
35
40
45 single valve
Flow
rate
(µL/
min
)
Applied Pressure (psi)
D1
0.49 psi
500 µm
Δp10 1 2 3 4 5 6 7 8 9 10 11
-10123456789
101112131415
Single valve Integrated four check-valves
Flow
rate
(µL/
min
)
Applied Pressure (psi)2.06 psi≈Δp1×4
(a) (b)
(c)

53
surface micro-machined NC pop-up check-valve is designed to regulate the cracking
pressure of microfluidic flow. An undercut parylene-C foot is generated by first spin-
coating a layer of LOR30B on silicon surface and then developed to create undercut after
the first layer parylene-C film deposition and patterning. The cracking pressure is created
by residual tensile stress built within the tethers introduced by post-fabrication pop-up
process and can be enhanced by thermal annealing. This newly-designed micro check-
valve can also be encapsulated within the all-parylene channel. The zigzag appearance
along the channel edge makes it easy to anchor in any kind of implantation environments.
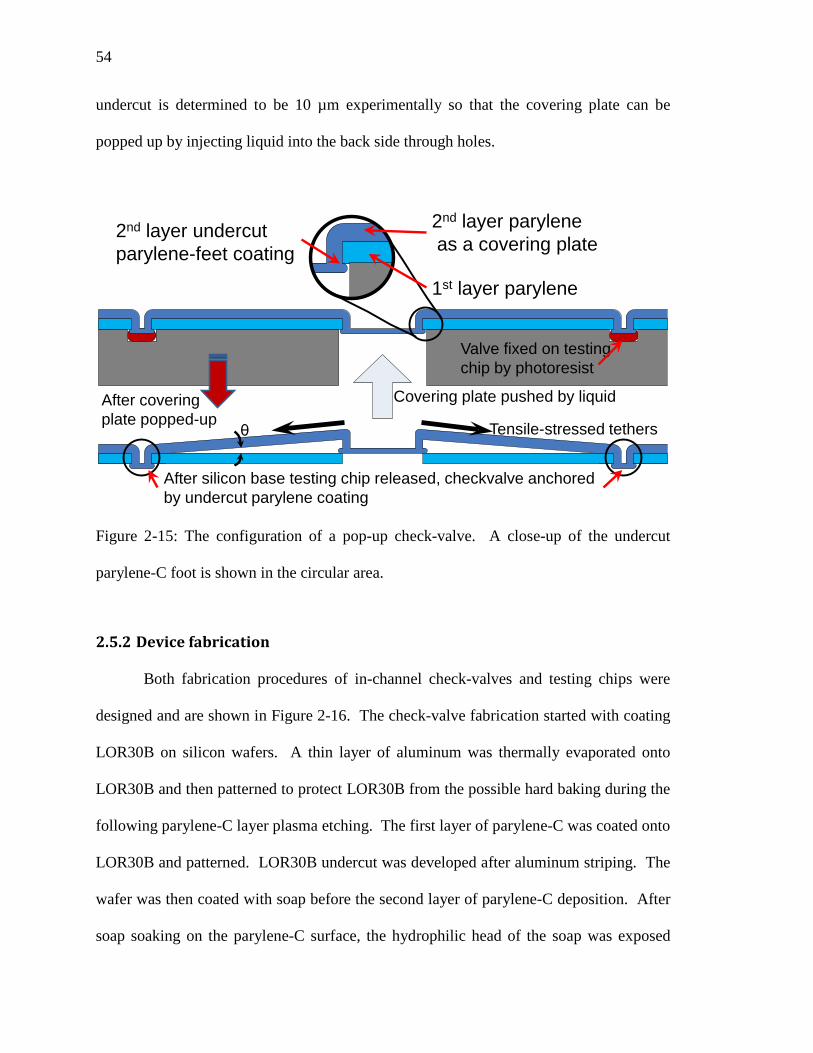
2.5.1 Pop-up micro check-valve device design
The design of the pop-up check-valve is shown in Figure 2-15. The structure
requires an undercut beneath the first layer parylene-C, which is created by developing
LOR30B, using the first parylene-C as the mask. The 2nd layer of parylene-C then fills
into these undercuts during deposition and creates an interlocking structure between the
two parylene-C layers and the covering plate which is made of the second layer of
parylene-C. Before the check-valve’s usage, the covering plate is popped up from the
back side by flowing liquid through the through hole. Once popped, the covering plate
will stay on top of the first layer parylene-C due to the undercut parylene-C foot and will
no longer return to the original interlocked position. The popping first creates an amount
of mechanical tensile stress within the tethers connecting the covering plate and valve’s
anchor because of the extension. The tethers can then be thermally pre-stressed with
thermal tensile stress by annealing/quenching to further control the cracking pressure.
The cracking pressure can still be predicted by eqn. (2-16). The proper length of the
54
undercut is determined to be 10 µm experimentally so that the covering plate can be
popped up by injecting liquid into the back side through holes.
Figure 2-15: The configuration of a pop-up check-valve. A close-up of the undercut
parylene-C foot is shown in the circular area.
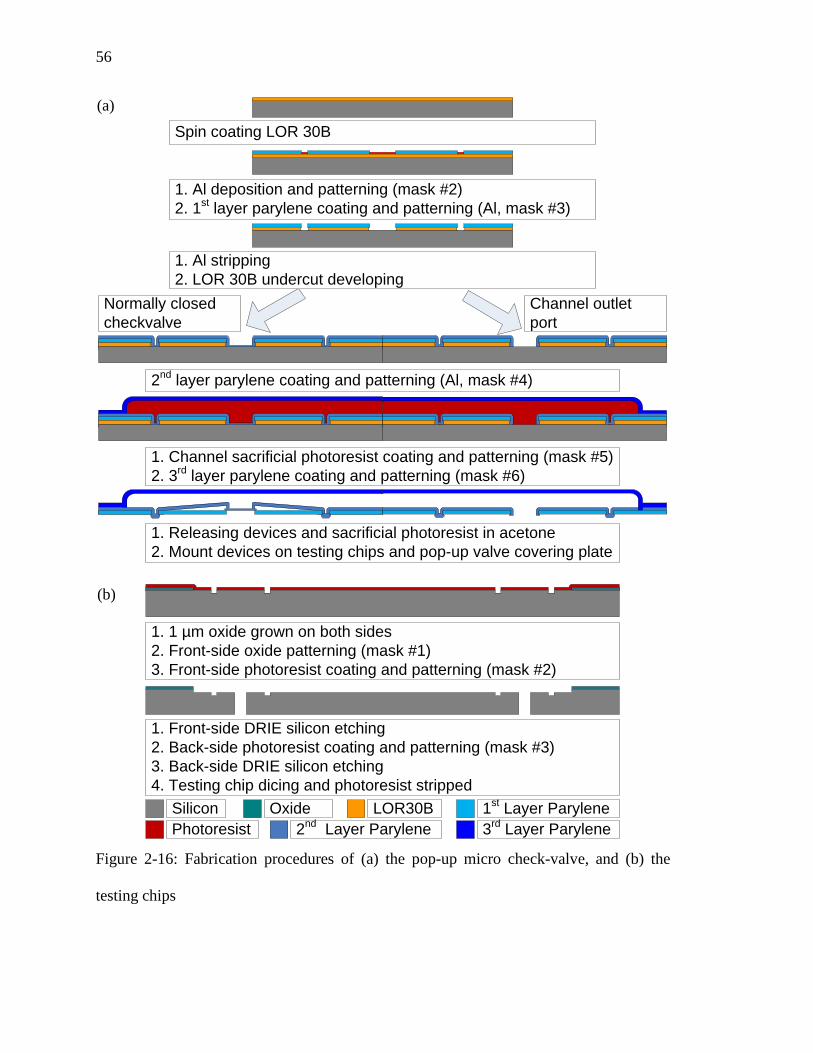
2.5.2 Device fabrication
Both fabrication procedures of in-channel check-valves and testing chips were
designed and are shown in Figure 2-16. The check-valve fabrication started with coating
LOR30B on silicon wafers. A thin layer of aluminum was thermally evaporated onto
LOR30B and then patterned to protect LOR30B from the possible hard baking during the
following parylene-C layer plasma etching. The first layer of parylene-C was coated onto
LOR30B and patterned. LOR30B undercut was developed after aluminum striping. The
wafer was then coated with soap before the second layer of parylene-C deposition. After
soap soaking on the parylene-C surface, the hydrophilic head of the soap was exposed
2nd layer paryleneas a covering plate
1st layer parylene
2nd layer undercutparylene-feet coating
After covering plate popped-up
Covering plate pushed by liquid
After silicon base testing chip released, checkvalve anchored by undercut parylene coating
Valve fixed on testing chip by photoresist
Tensile-stressed tethersθ

55
that changed the parylene-C surface to hydrophilic. This would benefit the popping
process as the parylene-C would be easier to delaminate from the hydrophilic surface.
The second layer of parylene-C was deposited, filling the undercut, and then patterned.
A thick sacrificial layer of photoresist was coated, patterned and encapsulated with the
third layer of protection parylene-C membrane. The whole device was released by
acetone after patterning. On the other side of the parylene-C channel, an outlet port was
fabricated using the same procedures as the check-valve, as shown in Figure 2-16 (a).
The covering plate was etched away to make the through hole of the outlet port.
The testing chip fabrication started with double-side oxide wafers, with front side
first patterned and etched by DRIE twice to create necessary cavities and then the back
side DRIE followed to create through holes, as shown in Figure 2-16 (b).
The fabrication results are shown in Figure 2-17. Figure 2-17 (a) shows the
successful undercut creation of LOR30B under the first layer of parylene-C; Figure 2-17
(b) is the micrograph of the check-valve after the second layer parylene-C patterned;
Figure 2-17 (c) shows the micrograph of the top view of the outlet port after the second
parylene-C patterned, and Figure 2-17 (d) demonstrates the final devices shown in 6 mm
long. The zigzag features along the devices’ sides facilitate the anchoring during the
device implantation.
56
Spin coating LOR 30B
1. Al stripping2. LOR 30B undercut developing
2nd layer parylene coating and patterning (Al, mask #4)
1. Channel sacrificial photoresist coating and patterning (mask #5)2. 3rd layer parylene coating and patterning (mask #6)
1. Releasing devices and sacrificial photoresist in acetone2. Mount devices on testing chips and pop-up valve covering plate
1st Layer ParyleneSiliconPhotoresist 2nd Layer Parylene 3rd Layer Parylene
LOR30B
1. Al deposition and patterning (mask #2)2. 1st layer parylene coating and patterning (Al, mask #3)
Normally closed checkvalve
Channel outlet port
1. 1 µm oxide grown on both sides2. Front-side oxide patterning (mask #1)3. Front-side photoresist coating and patterning (mask #2)
1. Front-side DRIE silicon etching2. Back-side photoresist coating and patterning (mask #3)3. Back-side DRIE silicon etching4. Testing chip dicing and photoresist stripped
Oxide
Figure 2-16: Fabrication procedures of (a) the pop-up micro check-valve, and (b) the
testing chips
(a)
(b)

57
Figure 2-17: Micrograph of (a) 10 µm undercut of the LOR30B, (b) top view of the NC
check-valve, (c) top view of the outlet orifice, and (d) final device appearance
Figure 2-18 shows a series of SEM pictures of the fabricated check-valves.
Figure 2-18 (a) shows the backside view of the check-valve, presenting the successful
undercut parylene-C-foot coating; Figure 2-18 (b) represents a close view of about 10 µm
wide undercut coating; Figure 2-18 (c) is a top view of the check-valve before pop-up,
and (d) is a close view of the tethers after pop-up. As shown in Figures 2-18 (a) and (b),
four undercut parylene-C-foot not only work to anchor the check-valves onto the first
layer parylene-C, but also behave as the posts preventing the device from stiction to the
application surface.
(a) (b)
(c) (d)

58
Figure 2-18: SEM pictures of (a) undercut parylene-C foot coating (back side view), (b)
close view of undercut parylene-C foot coating, (d) normally closed check-valve, and (d)
covering plate after pop-up
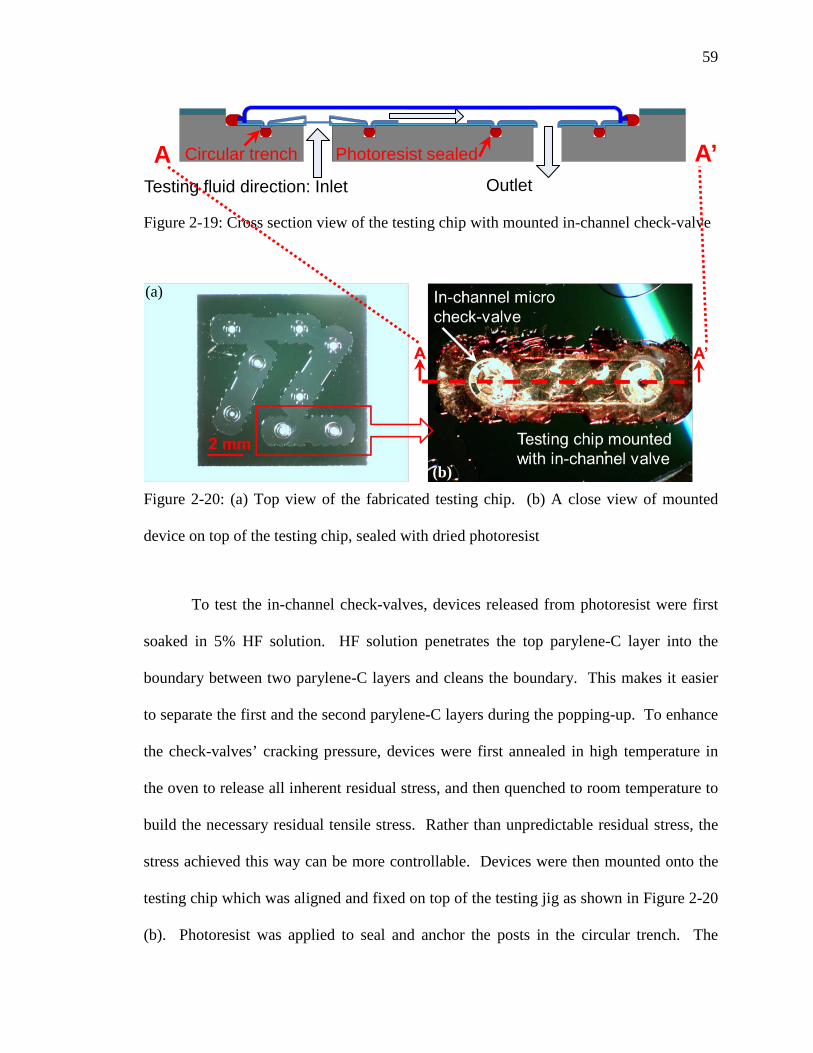
2.5.3 Device characterization setup
A complete testing chip is shown in Figure 2-20 (a). The size of the indentation
on the testing chip is designed a bit larger than the device so that the through holes of the
check-valves can be aligned with the holes of the testing chips. Circular trenches with
the same width as check-valves’ posts are fabricated to accommodate the posts so as to
ensure the flatness of the check-valves and the complete sealing during the testing.
(a) (b)
(c) (d)
59
Figure 2-19: Cross section view of the testing chip with mounted in-channel check-valve
Figure 2-20: (a) Top view of the fabricated testing chip. (b) A close view of mounted
device on top of the testing chip, sealed with dried photoresist
To test the in-channel check-valves, devices released from photoresist were first
soaked in 5% HF solution. HF solution penetrates the top parylene-C layer into the
boundary between two parylene-C layers and cleans the boundary. This makes it easier
to separate the first and the second parylene-C layers during the popping-up. To enhance
the check-valves’ cracking pressure, devices were first annealed in high temperature in
the oven to release all inherent residual stress, and then quenched to room temperature to
build the necessary residual tensile stress. Rather than unpredictable residual stress, the
stress achieved this way can be more controllable. Devices were then mounted onto the
testing chip which was aligned and fixed on top of the testing jig as shown in Figure 2-20
(b). Photoresist was applied to seal and anchor the posts in the circular trench. The
A A’Testing fluid direction: Inlet Outlet
Photoresist sealedCircular trench
(a)
(b)
60
surroundings of the device were also sealed by photoresist to ensure complete sealing.
The testing setup shown in Figure 2-8 was used to characterize single check-valve. The
check-valves were first popped up by pushing water into the back holes, and then
microfluidically characterized. As shown in Figure 2-19, the testing liquid was sent into
left NC check-valve. The liquid flew through the channel and exit to the right outlet port.
The tested and qualified devices were then released in acetone to remove the photoresist
for later implantation applications, as shown in Figure 2-17 (d)
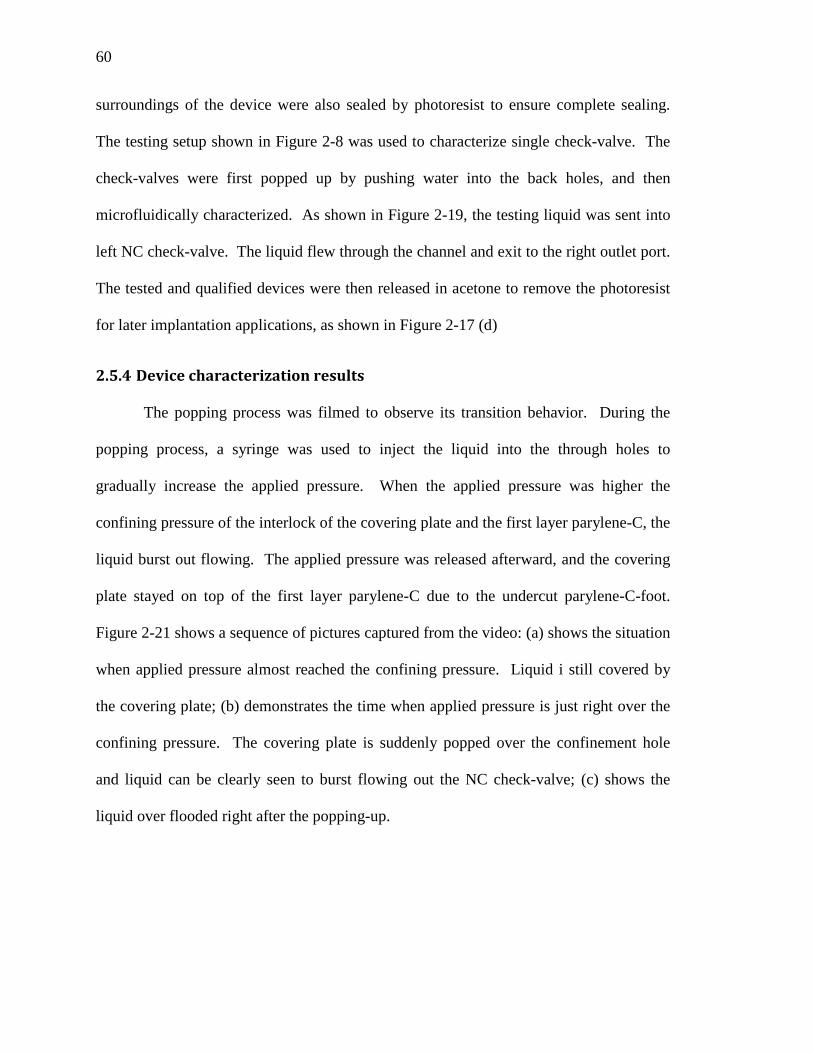
2.5.4 Device characterization results
The popping process was filmed to observe its transition behavior. During the
popping process, a syringe was used to inject the liquid into the through holes to
gradually increase the applied pressure. When the applied pressure was higher the
confining pressure of the interlock of the covering plate and the first layer parylene-C, the
liquid burst out flowing. The applied pressure was released afterward, and the covering
plate stayed on top of the first layer parylene-C due to the undercut parylene-C-foot.
Figure 2-21 shows a sequence of pictures captured from the video: (a) shows the situation
when applied pressure almost reached the confining pressure. Liquid i still covered by
the covering plate; (b) demonstrates the time when applied pressure is just right over the
confining pressure. The covering plate is suddenly popped over the confinement hole
and liquid can be clearly seen to burst flowing out the NC check-valve; (c) shows the
liquid over flooded right after the popping-up.

61
Figure 2-21: Captured pictures of normally closed pop-up check-valve during popping-up
process (shown in arrow): (a) right before pop-up, (b) during pop-up, and (d) after pop-
up. (Top parylene-C membrane is peeled off for clarity.)
Figure 2-22: Testing result of the pop-up check-valve
After the popping process, a check-valve can be further annealed at 140°C to
enhance the pre-stressed parylene-C tethers. Figure 2-22 shows the experimental result.
0.00 0.25 0.50 0.75 1.00 1.25 1.50 1.75 2.00 2.25 2.50-505
101520253035404550
Flow
rate
(µL/
min
)
Applied Pressure (psi)0.35
(a) (b) (c)
62
The cracking pressure of the check-valve is determined by the time when the liquid starts
to flow. The flow characteristic is obtained with cracking pressure of 0.35 psi, verifying
the feasibility of the pop-up check-valve. It is found that the flow-rate is similar to the
check-valve shown in Figure 2-10, but with a lower cracking pressure in the pop-up
check-valve. It is likely that the parylene-C base (the first layer parylene-C) is very
easily damaged during the popping process. Besides, because the 10-µm thick parylene-
C base is still very flexible, the pre-stressed parylene-C tether would cause the parylene-
C base to deform downward after the popping and thermal annealing. This causes
smaller angle of the parylene-C tethers and therefore reduces the check-valve cracking
pressure. Depositing thicker parylene-C base can solve the problem. In addition, coating
a layer of metal would increase the Young’s modulus of the parylene-C base and reduce
the deformation amount caused by the pre-stressed parylene-C tethers.
2.6 Self-Stiction-Bonding Micro NC Check-Valves
2.6.1 Design concept of the self-stiction-bonding NC check-valve
Although the NC check-valve developed in Sections 2.3 to 2.5 has demonstrated
the promising results of their capability of regulating the flow-rate, there still drawbacks
exist in these NC check-valves. For the slanted check-valve utilizing the sloped
sacrificial photoresist, it is more pricy to make the key gray-scale photo-mask. On the
other hand, for the pop-up NC check-valve, the pop-up process might damage the
parylene-C base easily and thus the yield rate is low. In this section, a NC check-valve is
developed by manipulating the stiction phenomenon to create the necessary cracking
pressure.
63
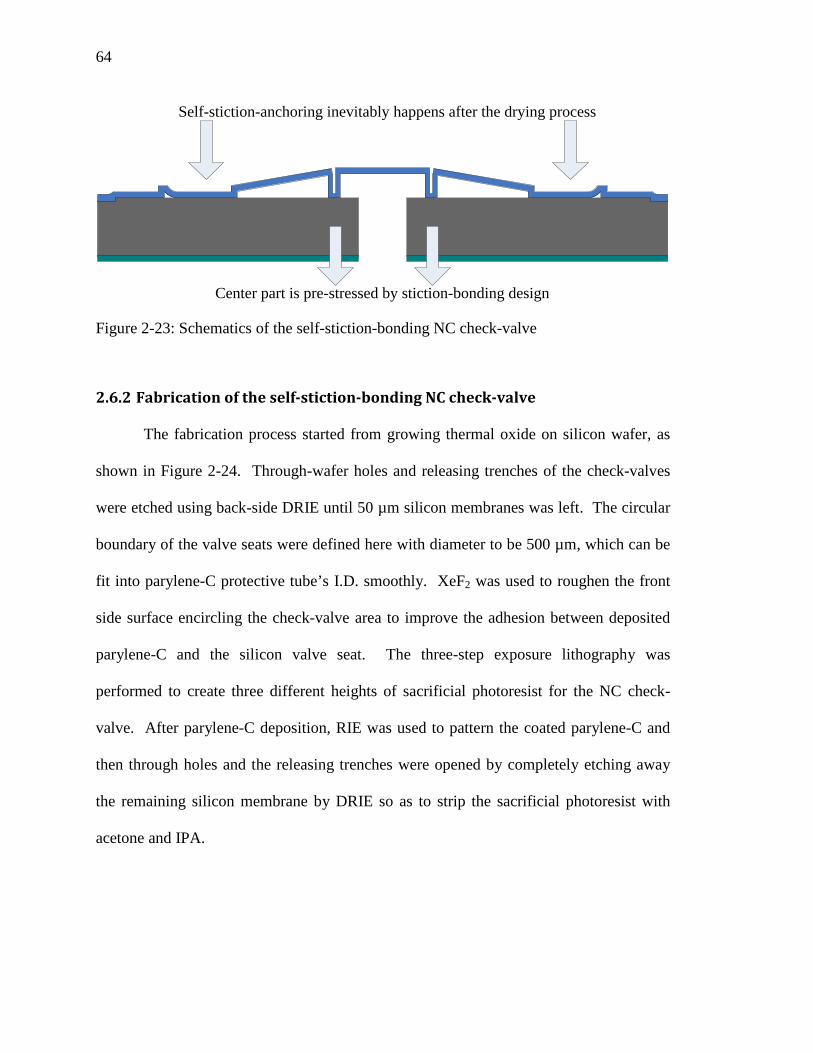
As shown in Figure 2-23, the self-stiction-bonding NC valve utilizes a stiction
process that inevitably takes place after the drying process. According to theory [118–
123], the parylene-C tether’s length can be accurately designed for enough stiction while
keeping the appropriate size of the micro NC check-valves. To generate enough stiction,
the length of the parylene-C tether must be longer than the critical length of a cantilever
beam which can be predicted as:
𝑙𝑐𝑟𝑖𝑡 ≥ �3
16𝐸𝑡3𝑔2
𝛾𝑙𝑎𝑐𝑜𝑠𝜃𝑐
4, (2-22)
where E, and t is the Young’s modulus and the thickness of parylene,-C, respectively. g
is the gap spacing, γla is the surface tension of the liquid–air interface. θc is the contact
angle between the drying liquid and the parylene-C.
This self-stiction effect facilitates spontaneous anchoring of the NC check-valve
with predetermined cracking pressure by pre-stressing the center sealing part of the
check-valve through straight tethers connecting to the anchoring part, as shown in Figure
2-23. The built-in stress of the parylene-C tethers comes from both the residual tensile
stress remained after thermal annealing, and stretching due to stiction bonding. Cracking
pressure can be controlled by many parameters as described in Section 2.3.1. Similar to
the NC check-valve structure aforementioned, flow-rate is defined by the size of the
opening orifice and the opening gap of the parylene-C membrane. Furthermore, few
holes are designed on the stiction-bonding parts where epoxy can be used to further
ensure bonding strength and to prevent parylene-C from de-lamination after repeated
operations, as shown in Figure 2-25 (b).
64
Center part is pre-stressed by stiction-bonding design
Self-stiction-anchoring inevitably happens after the drying process
Figure 2-23: Schematics of the self-stiction-bonding NC check-valve
2.6.2 Fabrication of the self-stiction-bonding NC check-valve
The fabrication process started from growing thermal oxide on silicon wafer, as
shown in Figure 2-24. Through-wafer holes and releasing trenches of the check-valves
were etched using back-side DRIE until 50 µm silicon membranes was left. The circular
boundary of the valve seats were defined here with diameter to be 500 µm, which can be
fit into parylene-C protective tube’s I.D. smoothly. XeF2 was used to roughen the front
side surface encircling the check-valve area to improve the adhesion between deposited
parylene-C and the silicon valve seat. The three-step exposure lithography was
performed to create three different heights of sacrificial photoresist for the NC check-
valve. After parylene-C deposition, RIE was used to pattern the coated parylene-C and
then through holes and the releasing trenches were opened by completely etching away
the remaining silicon membrane by DRIE so as to strip the sacrificial photoresist with
acetone and IPA.
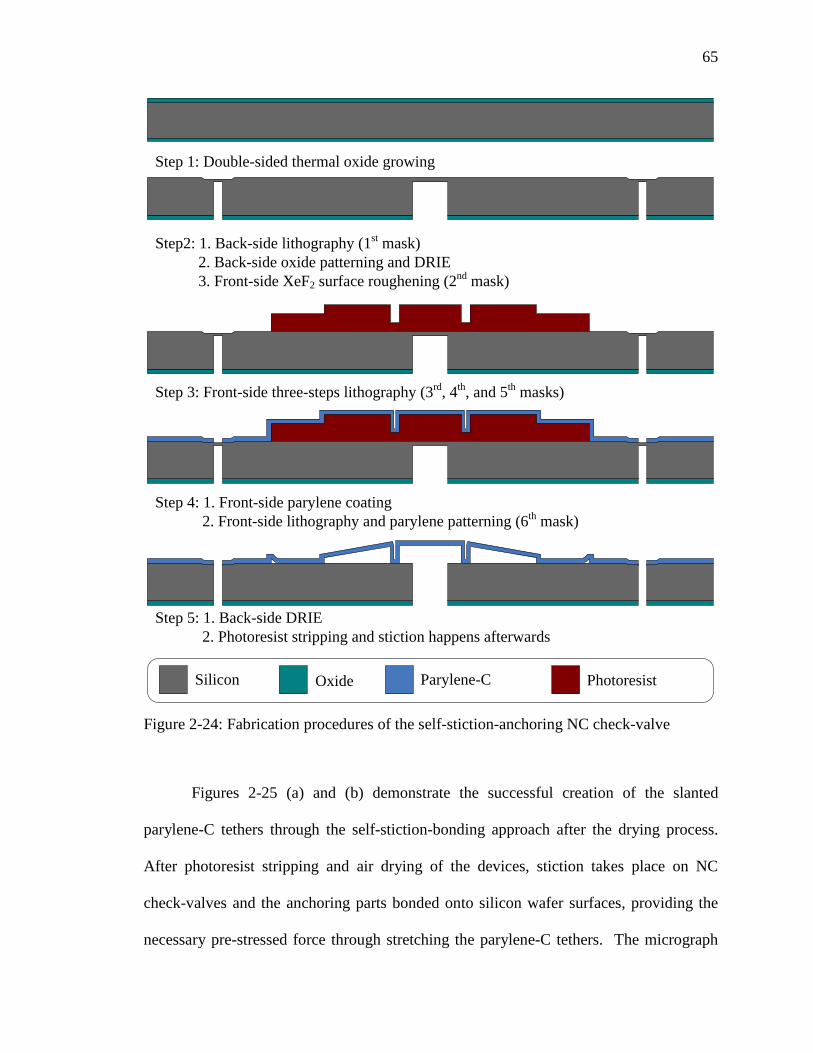
65
Step 1: Double-sided thermal oxide growing
Step 3: Front-side three-steps lithography (3rd, 4th, and 5th masks)
Step 5: 1. Back-side DRIE 2. Photoresist stripping and stiction happens afterwards
Step2: 1. Back-side lithography (1st mask) 2. Back-side oxide patterning and DRIE 3. Front-side XeF2 surface roughening (2nd mask)
Step 4: 1. Front-side parylene coating 2. Front-side lithography and parylene patterning (6th mask)
Silicon Oxide Parylene-C Photoresist
Figure 2-24: Fabrication procedures of the self-stiction-anchoring NC check-valve
Figures 2-25 (a) and (b) demonstrate the successful creation of the slanted
parylene-C tethers through the self-stiction-bonding approach after the drying process.
After photoresist stripping and air drying of the devices, stiction takes place on NC
check-valves and the anchoring parts bonded onto silicon wafer surfaces, providing the
necessary pre-stressed force through stretching the parylene-C tethers. The micrograph

66
of the fabrication result of the completed micro NC check-valve is illustrated in Figure
2-25 (c). To further enhance the bonding strength, tiny epoxy drops were then manually
applied onto these NC check-valves’ stiction-bonding parts to make sure the parylene-C
won’t de-laminate after several repeated operations, as shown in Figure 2-25 (d).
Figure 2-25: Fabrication results of the self-stiction-anchoring NC check-valves: (a) SEM
picture showing the regular NC check-valve, (b) SEM picture showing the NC check-
valve with small holes for epoxy enhancement, (c) top view of the NC check-valve, and
(d) NC check-valve with epoxy bonding enhancement
2.6.3 Characterization of the self-stiction-bonding NC check-valve
To characterize the completed self-stiction-bonding NC check-valve, the same
single check-valve packaging procedure as Figure 2-12 was adopted to accommodate
SpontaneousStiction-Bonding
Epoxy EnhancingStiction-Bonding
100 µm100 µm
Slanted tethers afterself-stiction-anchoring
Small holes forepoxy enhancement
(a)
(c) (d)
(b)

67
single NC check-valve in the capillary tube. On the other hand, the characterization setup
represented in Figure 2-13 was also utilized to measure the NC check-valve’s flow-rate
profile. The pressure/flow-rate characteristic profile is shown in Figure 2-26. Liquid
starts to flow at 0.2–0.3 psi (10–15 mmHg), and no obvious flow-rate is observed before
the cracking pressure, showing that the sealing is well pressed by the four straight tether
arms with the predetermined snapping force. This result meets our simulation
expectation and provides the evidence that stiction does provide the required pre-stress
force to create the cracking can secure the gap between the check-valve and the capillary
tube opening.
Figure 2-26: Pressure/flow-rate profile characterization results of the self-stiction-
bonding NC check-valve
0.0 0.1 0.2 0.3 0.4 0.5 0.6 0.7 0.8 0.9 1.0 1.1 1.2 1.3
020406080
100120140160180200
0.0 5.2 10.3 15.5 20.7 25.8 31.0 36.2 41.4 46.5 51.7 56.9 62.0 67.2 Applied Pressure (mmHg)
Mea
sure
d Fl
owra
te (µ
L/m
in)
Applied Pressure (Psi)0.3 psi
Flow rate = 2.75 µL/min

68
2.7 Blister Test of Stiction of Parylene-C Film
The self-stiction-bonding check-valve developed in Section 2.6 has demonstrated
its successful regulating the microfluidic flow. However, since the cracking pressure of
this check-valve is governed by stiction between the parylene-C film and the underlying
substrate, a comprehensive study of stiction between parylene-C and different surfaces is
required in order to understand, design, and create valves with specific cracking pressure
and desired flow-rate profiles.
Stiction is an attraction that occurs between free standing micro-machined
features and the substrate after the release of sacrificial photoresist [124]. Even though
stiction is often an undesirable phenomenon, it can be employed to control the operation
regime of thin film parylene-C check-valves. Attempts have been made to reduce stiction
for specific check-valve geometries. For example, the cracking pressure of a polyimide
check-valve with C4F8/Ar non-stiction coating changed from 210 kPa to 59 kPa [125],
and SAM (self-assembled monolayer) is also used to reduce stiction [126].
The study in this section presents a comprehensive investigation of stiction
between parylene-C and a variety of different surfaces using blister test. Blister test has
been sophisticatedly used to measure the adhesion of two different materials and is
capable to provide measurable results [127–137]. The surfaces under investigation
include Au, Al, Si, parylene-C, XeF2 treated Si, and silicon dioxide. After quantifying
surface stiction, possible mechanisms that lead to stiction between parylene-C and
various materials are explained. In addition, different recipes for sacrificial photoresist
release that may affect the resulting stiction are also explored. Stiction results for
different surfaces under different photoresist releasing methods show that surface coating
69
and releasing procedures used in this investigation can be used to control characteristics
of parylene-C check-valves.
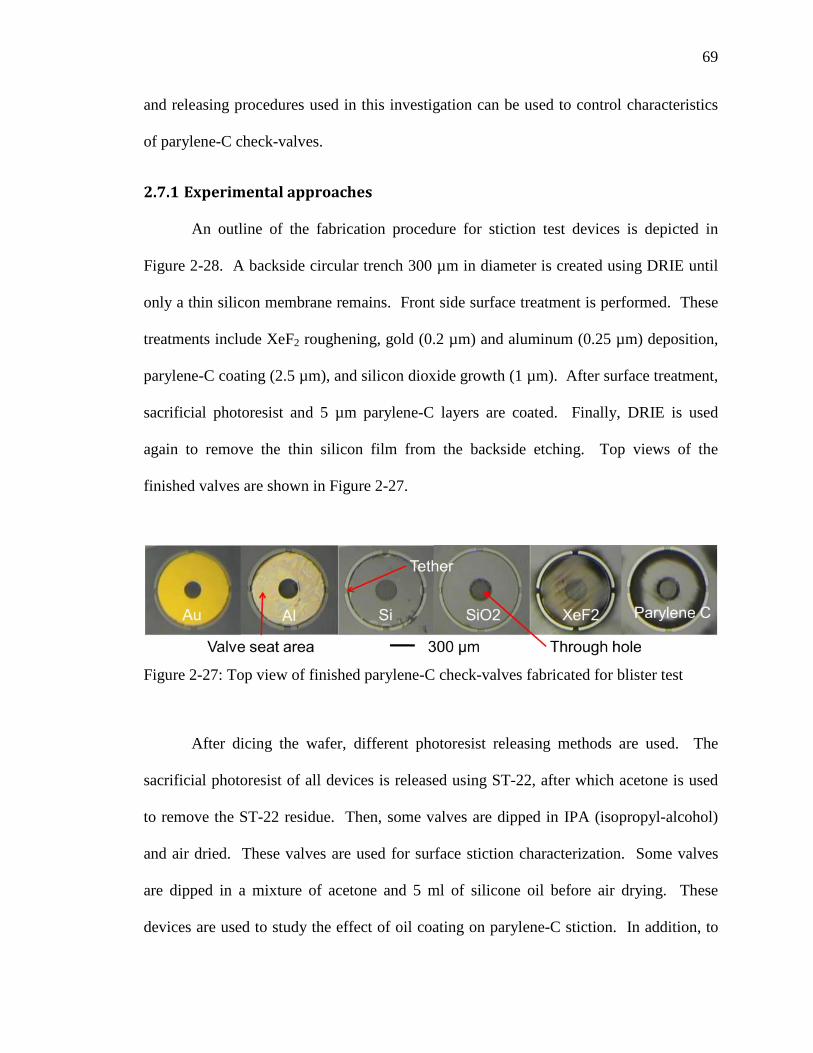
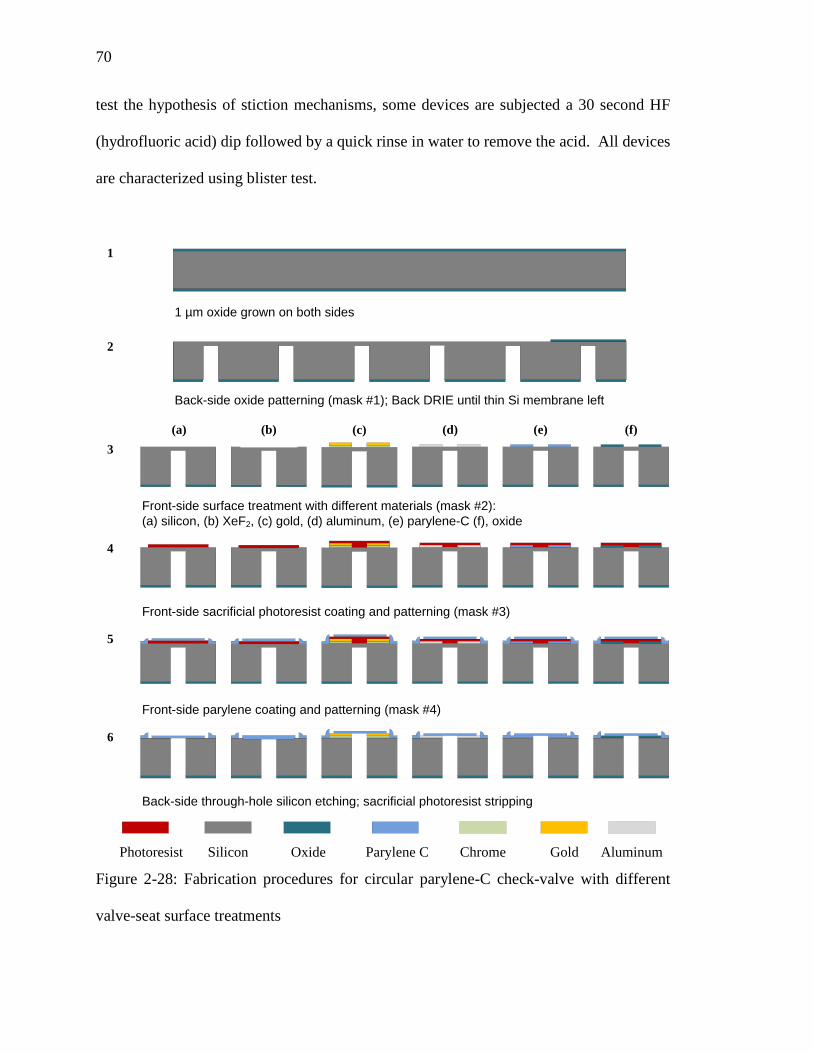
2.7.1 Experimental approaches
An outline of the fabrication procedure for stiction test devices is depicted in
Figure 2-28. A backside circular trench 300 µm in diameter is created using DRIE until
only a thin silicon membrane remains. Front side surface treatment is performed. These
treatments include XeF2 roughening, gold (0.2 µm) and aluminum (0.25 µm) deposition,
parylene-C coating (2.5 µm), and silicon dioxide growth (1 µm). After surface treatment,
sacrificial photoresist and 5 µm parylene-C layers are coated. Finally, DRIE is used
again to remove the thin silicon film from the backside etching. Top views of the
finished valves are shown in Figure 2-27.
Figure 2-27: Top view of finished parylene-C check-valves fabricated for blister test
After dicing the wafer, different photoresist releasing methods are used. The
sacrificial photoresist of all devices is released using ST-22, after which acetone is used
to remove the ST-22 residue. Then, some valves are dipped in IPA (isopropyl-alcohol)
and air dried. These valves are used for surface stiction characterization. Some valves
are dipped in a mixture of acetone and 5 ml of silicone oil before air drying. These
devices are used to study the effect of oil coating on parylene-C stiction. In addition, to
70
test the hypothesis of stiction mechanisms, some devices are subjected a 30 second HF
(hydrofluoric acid) dip followed by a quick rinse in water to remove the acid. All devices
are characterized using blister test.
1 µm oxide grown on both sides
Back-side oxide patterning (mask #1); Back DRIE until thin Si membrane left
Front-side surface treatment with different materials (mask #2):(a) silicon, (b) XeF2, (c) gold, (d) aluminum, (e) parylene-C (f), oxide
Front-side sacrificial photoresist coating and patterning (mask #3)
Front-side parylene coating and patterning (mask #4)
(a) (f)(e)(d)(c)(b)
Back-side through-hole silicon etching; sacrificial photoresist stripping
1
2
3
4
6
5
Photoresist Silicon Oxide Parylene C Gold AluminumChrome Figure 2-28: Fabrication procedures for circular parylene-C check-valve with different
valve-seat surface treatments
71
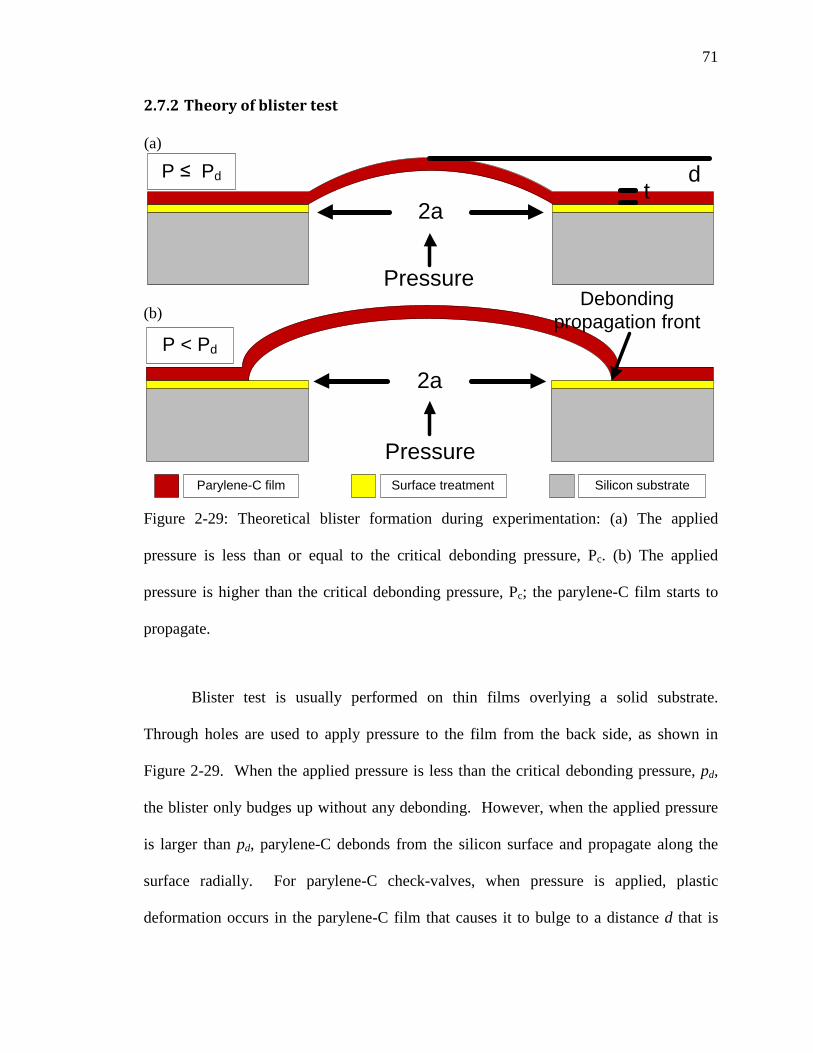
2.7.2 Theory of blister test
2a
Pressure
td
2a
PressureParylene-C film Surface treatment Silicon substrate
Debonding propagation front
P ≤ Pd
P < Pd
Figure 2-29: Theoretical blister formation during experimentation: (a) The applied
pressure is less than or equal to the critical debonding pressure, Pc. (b) The applied
pressure is higher than the critical debonding pressure, Pc; the parylene-C film starts to
propagate.
Blister test is usually performed on thin films overlying a solid substrate.
Through holes are used to apply pressure to the film from the back side, as shown in
Figure 2-29. When the applied pressure is less than the critical debonding pressure, pd,
the blister only budges up without any debonding. However, when the applied pressure
is larger than pd, parylene-C debonds from the silicon surface and propagate along the
surface radially. For parylene-C check-valves, when pressure is applied, plastic
deformation occurs in the parylene-C film that causes it to bulge to a distance d that is
(a)
(b)

72
dependent on the Young’s modulus, E(~ 4 GPa), Poisson’s ratio, ν (~ 0.4 [138]),
geometry of the substrate opening, and thickness of the parylene-C film, t.
Due to the circular via in silicon, it can be assumed that the blister has a
semispherical profile. With this assumption, the critical debonding pressurecan be first
calculated as [137]:
𝑝𝑑 =3.56𝐸𝑡
𝑎4 𝑑𝑐3 +
4𝜎𝑜𝑡
𝑎2 𝑑𝑐, (2-23)
where dc is the maximum vertical displacement of the parylene-C film, t is the thickness
of the parylene film (3 μm in our experiment), a is the radius of the blister (100 μm).
With the obtained critical debonding pressure, the stiction between parylene-C and
silicon surface, γ, can be derived by
𝛾 = 2.22𝐸𝑡 �𝑑𝑐𝑎�4
+ 2.00𝜎𝑜𝑡 �𝑑𝑐𝑎�2
, (2-24)
where the constant σ0 represents residual stress within the parylene-C film. For this
particular experiment where parylene-C is annealed at 100°C, 37.8 MPa is used as the
residual stress [138]. As the pressure inside the blister exceeds the critical pressure, pd,
parylene-C film debonds from the silicon surface and the obtained pd from eqn. (2-24) is
used to calculate the stiction, γ.
2.7.3 Blister test experimental setup
During experimentation, each die is placed in a testing jig that allows fluid (N2
gas) to apply pressure to the parylene-C membrane. The jig is then connected to a fluidic
setup consisting of a valve, a pressure regulator, and a pressure gauge, as shown in Figure
2-30. Figure 2-30 (a) shows the cross section view of the testing jig and Figure 2-30 (b)
illustrates the overall view of the testing setup. The testing jig is placed under a

73
microscope for observation. Pressure inside the tubing is gradually increased by
adjusting the pressure regulator. The pressure gauge reads out the current pressure inside
the blister. The critical pressure is recorded when debonding occurs.
PressureRegulator
Valve PressureGauge
Air Input
Air
Testing Jig
Silicon Wafer
O-ring
Parylene Film Surface Material
Testing Jig
Figure 2-30: Experimental setup of the blister test: (a) the cross-section view of the test
jig, and (b) schematic diagram of the testing setup
(a)
(a)
74
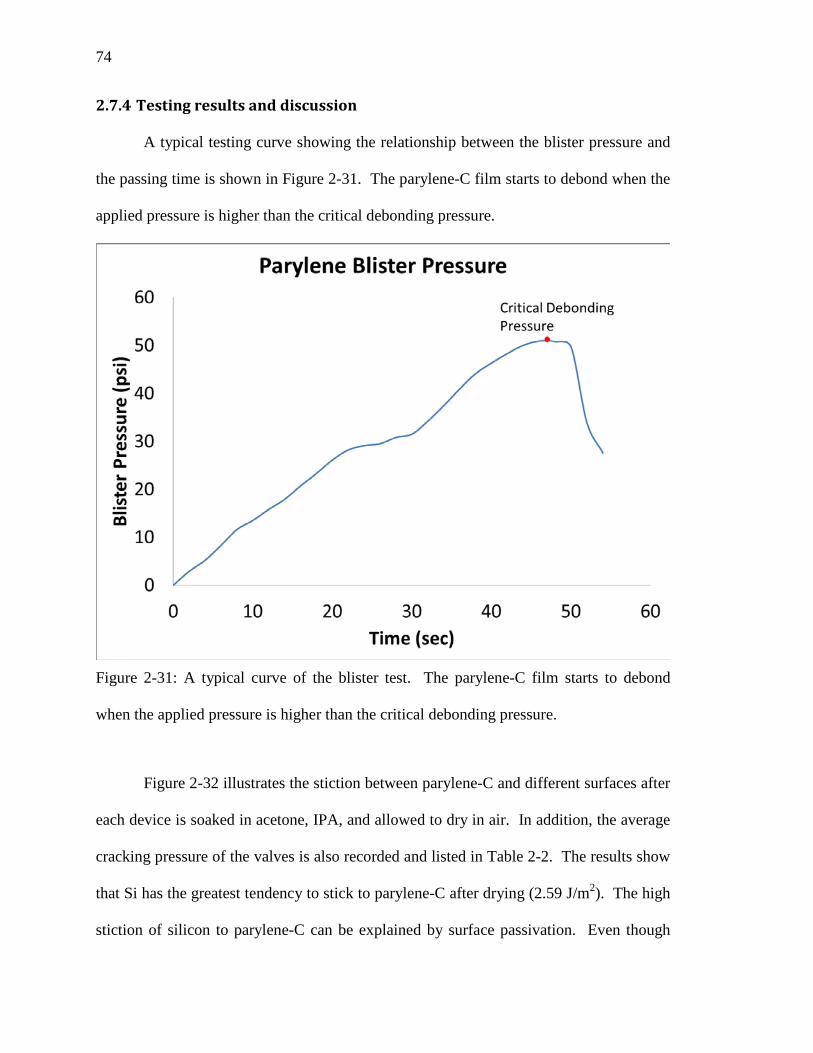
2.7.4 Testing results and discussion
A typical testing curve showing the relationship between the blister pressure and
the passing time is shown in Figure 2-31. The parylene-C film starts to debond when the
applied pressure is higher than the critical debonding pressure.
Figure 2-31: A typical curve of the blister test. The parylene-C film starts to debond
when the applied pressure is higher than the critical debonding pressure.
Figure 2-32 illustrates the stiction between parylene-C and different surfaces after
each device is soaked in acetone, IPA, and allowed to dry in air. In addition, the average
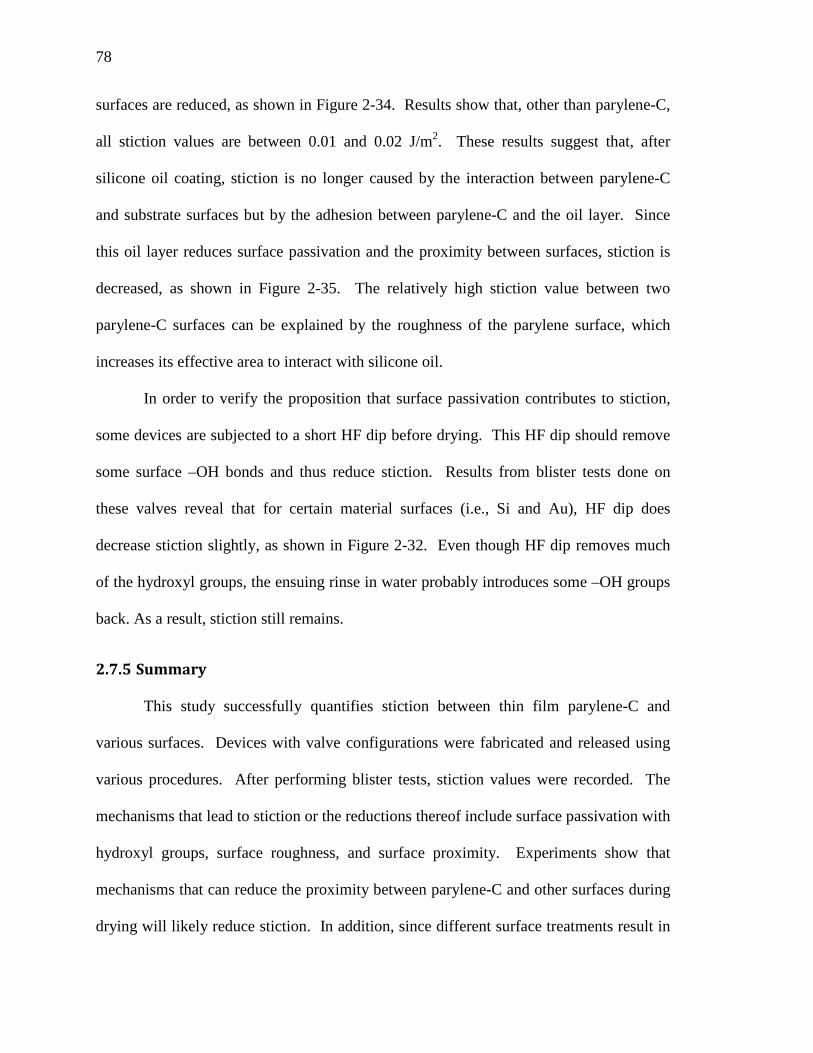
cracking pressure of the valves is also recorded and listed in Table 2-2. The results show
that Si has the greatest tendency to stick to parylene-C after drying (2.59 J/m2). The high
stiction of silicon to parylene-C can be explained by surface passivation. Even though

75
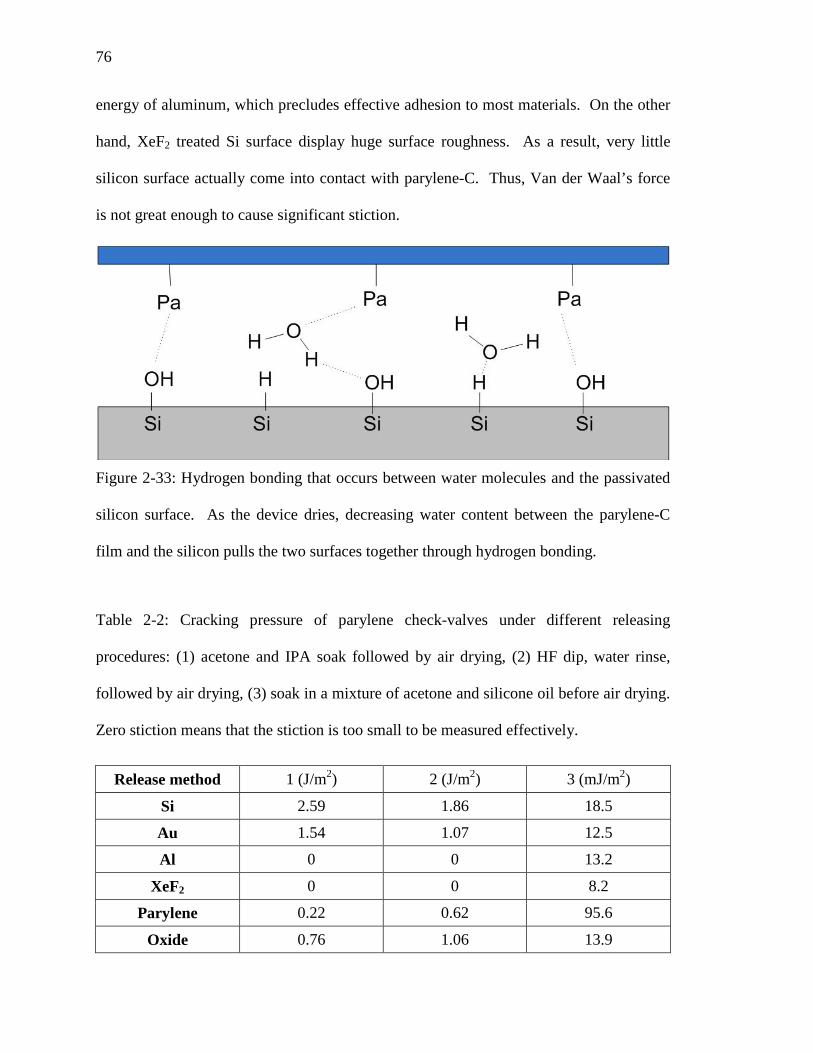
silicon and parylene-C are inherently hydrophobic, when they are subjected to water
during photoresist release, the dangling bonds on the surface of the materials tend to bond
to OH- groups in water. Such bonds make surfaces slightly hydrophilic. As the device
dries, decreasing water content between the parylene-C film and silicon surface pulls the
two surfaces together through hydrogen bonding, as illustrated in Figure 2-33. When the
surfaces are extremely close from each other, Van der Waal’s forces result in adhesion.
Figure 2-32: Stiction of parylene-C with different substrate surfaces after three kinds of
releasing processes. Blue: acetone soak followed by IPA and water soak. Green: acetone
soak followed by HF dip and water rinse. Red: soaking in mixture of acetone and silicone
oil followed by direct air drying
Compared to Si, Au, oxide, and parylene all had gradually decreasing stiction to
parylene-C. The decreasing values could be attributed either to increasing surface
roughness or decreasing reactivity to OH- groups. Al and XeF2 treated Si surfaces show
almost no stiction to parylene-C. The former result can be attributed to the high surface
76
energy of aluminum, which precludes effective adhesion to most materials. On the other
hand, XeF2 treated Si surface display huge surface roughness. As a result, very little
silicon surface actually come into contact with parylene-C. Thus, Van der Waal’s force
is not great enough to cause significant stiction.
Figure 2-33: Hydrogen bonding that occurs between water molecules and the passivated
silicon surface. As the device dries, decreasing water content between the parylene-C
film and the silicon pulls the two surfaces together through hydrogen bonding.
Table 2-2: Cracking pressure of parylene check-valves under different releasing
procedures: (1) acetone and IPA soak followed by air drying, (2) HF dip, water rinse,
followed by air drying, (3) soak in a mixture of acetone and silicone oil before air drying.
Zero stiction means that the stiction is too small to be measured effectively.
Release method 1 (J/m2) 2 (J/m2) 3 (mJ/m2)
Si 2.59 1.86 18.5
Au 1.54 1.07 12.5
Al 0 0 13.2
XeF2 0 0 8.2
Parylene 0.22 0.62 95.6
Oxide 0.76 1.06 13.9

77
Figure 2-34: Stiction between parylene-C and various surfaces after releasing in a
mixture of acetone and silicone oil
Figure 2-35: Stiction between the parylene-C and the silicon surface is reduced due to the
silicone oil layer, which reduces surface passivation and the proximity between surfaces.
Following the second photoresist releasing method where devices are air dried
after soaking in a mixture of acetone and silicone oil, stiction between parylene-C and all
Silicone Oil Layer
78
surfaces are reduced, as shown in Figure 2-34. Results show that, other than parylene-C,
all stiction values are between 0.01 and 0.02 J/m2. These results suggest that, after
silicone oil coating, stiction is no longer caused by the interaction between parylene-C
and substrate surfaces but by the adhesion between parylene-C and the oil layer. Since
this oil layer reduces surface passivation and the proximity between surfaces, stiction is
decreased, as shown in Figure 2-35. The relatively high stiction value between two
parylene-C surfaces can be explained by the roughness of the parylene surface, which
increases its effective area to interact with silicone oil.
In order to verify the proposition that surface passivation contributes to stiction,
some devices are subjected to a short HF dip before drying. This HF dip should remove
some surface –OH bonds and thus reduce stiction. Results from blister tests done on
these valves reveal that for certain material surfaces (i.e., Si and Au), HF dip does
decrease stiction slightly, as shown in Figure 2-32. Even though HF dip removes much
of the hydroxyl groups, the ensuing rinse in water probably introduces some –OH groups
back. As a result, stiction still remains.
2.7.5 Summary
This study successfully quantifies stiction between thin film parylene-C and
various surfaces. Devices with valve configurations were fabricated and released using
various procedures. After performing blister tests, stiction values were recorded. The
mechanisms that lead to stiction or the reductions thereof include surface passivation with
hydroxyl groups, surface roughness, and surface proximity. Experiments show that
mechanisms that can reduce the proximity between parylene-C and other surfaces during
drying will likely reduce stiction. In addition, since different surface treatments result in

79
different stiction, all processes and photoresist releasing methods from this study can be
used to design parylene-C check-valves with different cracking pressures.
2.8 Summary and Conclusion
2.8.1 Comparison of different types of micro check-valves
In this chapter, a parylene-C-based NC check-valve paradigm was proposed and
developed. The standard NC check-valve structure consists of slanted parylene-C tethers
with built-in residual tensile stress. These pre-stressed slanted parylene-C tethers provide
the necessary downward force, giving the desired cracking pressure of the NC check-
valve.
Three different methods were developed to create the slanted tethers. The first
method adopted the gray-scale photolithography to generate the sloped sacrificial
photoresist as the mold of the following deposited parylene-C film. The second approach
utilized the post-fabricated pop-up structural design to generate the desired slanted
tethers. The third method adopted the stiction phenomenon that inevitably takes place
after the drying process to create the slanted slope created using height differences of the
parylene-C structure. The residual stress built in the parylene-C tethers can be achieved
by stretching the tether, thermal annealing and quenching afterward, or combination of
both. The cracking pressure can be manipulated by several parameters such as the
number of the slanted tethers, the sloping angle of the slanted tethers, the geometry of the
slanted tethers (the width and the thickness), and also the residual stress of the slated
tethers which can be controlled by the annealing temperatures. Table 2-3 shows the
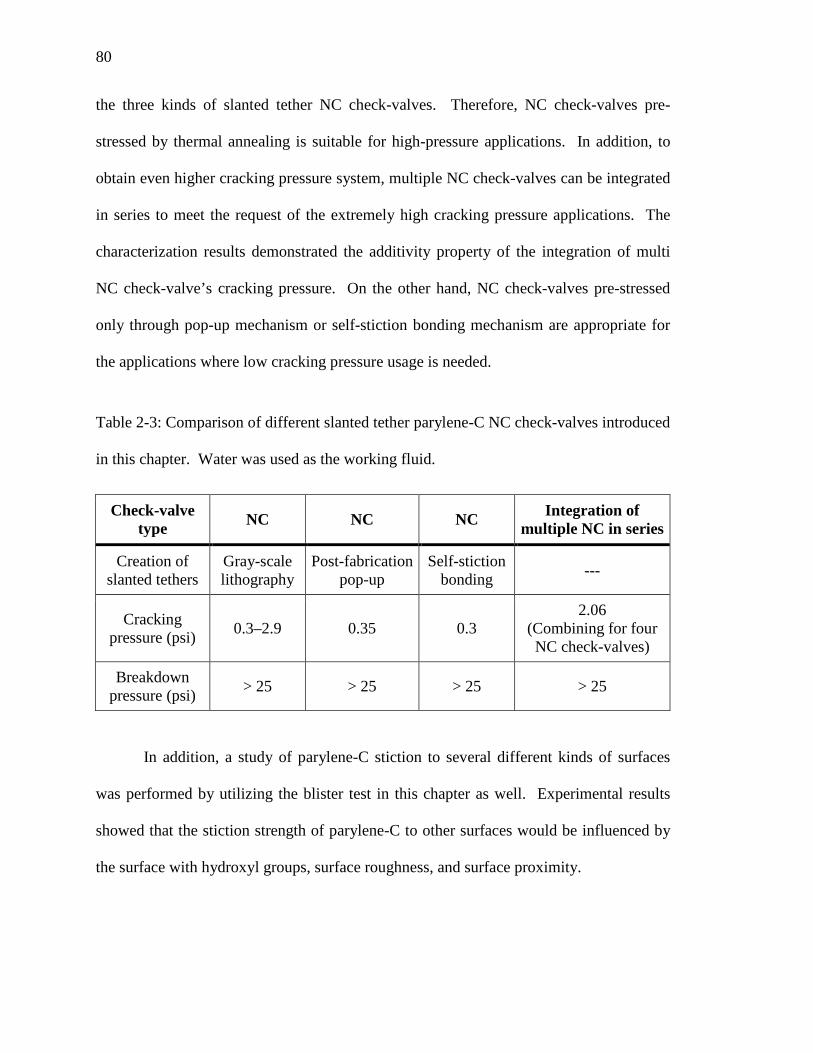
comparison of all different check-valves introduced in this chapter. It can be seen that
thermal annealing are capable of providing the highest cracking pressure (2.9 psi) among
80
the three kinds of slanted tether NC check-valves. Therefore, NC check-valves pre-
stressed by thermal annealing is suitable for high-pressure applications. In addition, to
obtain even higher cracking pressure system, multiple NC check-valves can be integrated
in series to meet the request of the extremely high cracking pressure applications. The
characterization results demonstrated the additivity property of the integration of multi
NC check-valve’s cracking pressure. On the other hand, NC check-valves pre-stressed
only through pop-up mechanism or self-stiction bonding mechanism are appropriate for
the applications where low cracking pressure usage is needed.
Table 2-3: Comparison of different slanted tether parylene-C NC check-valves introduced
in this chapter. Water was used as the working fluid.
Check-valve type NC NC NC Integration of
multiple NC in series
Creation of slanted tethers
Gray-scale lithography
Post-fabrication pop-up
Self-stiction bonding ---
Cracking pressure (psi) 0.3–2.9 0.35 0.3
2.06 (Combining for four NC check-valves)
Breakdown pressure (psi) > 25 > 25 > 25 > 25
In addition, a study of parylene-C stiction to several different kinds of surfaces
was performed by utilizing the blister test in this chapter as well. Experimental results
showed that the stiction strength of parylene-C to other surfaces would be influenced by
the surface with hydroxyl groups, surface roughness, and surface proximity.
81
2.8.2 Lifetime of the slanted tether NC check-valves
Because parylene-C served as the main structural material of the NC check-valves
developed here, it begs the question of how long the residual tensile stress would last
within the parylene-C tethers. The question is actually related to the
viscoelastic/viscoplastic properties of parylene-C, which has rarely been explored in the
past. Therefore, the creep and stress relaxation behavior and other types of
viscoelastic/viscoplastic properties of the parylene-C will be discussed at length in
chapter 5.

82