Chapter 2 Brief Overview of the Yamuna River Basin and...
13
Chapter 2 Brief Overview of the Yamuna River Basin and Issues Abstract This chapter presents the current status of the Yamuna river basin as well as brief description of its catchments. This chapter also includes the various issue related to water in terms of water quantity, quality, wastewater and environmental flow. The Yamuna River is one of the important and sacred rivers of India. It is the largest tributary of the River Ganga. It originates from Yamunotri glacier in the Mussoorie range of the lower Himalayas, and after traversing 1,376 km joins the river Ganga at Allahabad. The drainage area of the Yamuna basin is 366,220 sq km, which comprises part of seven states, viz. Uttarakhand, Himachal Pradesh, Uttar Pradesh, Haryana, Delhi, Rajasthan and Madhya Pradesh (Table 2.1). The Yamuna River has four main tributaries in the Himalayan region: Rishi Ganga, Hanuman Ganga, Tons, and Giri. In the plains, the main tributaries are the Hindon, Chambal, Sind, Betwa and Ken (Fig. 2.1). The river water is generally used for irrigation, drinking and industries as well as for mass bathing, laundry, cattle bathing, and secretion of the cremation ash. The construction of diversion structures at regular intervals (Hathinikund, Wazirabad, Okhla, Gokul, etc.) for irrigation, domestic and industrial water supply, has largely modified the flow regime of the river. The inflow of wastewater either treated or partially treated in the river further aggravates the water quality problem of the river. Though the green revolution was important for food security, but lack of regulation in the groundwater abstraction has led to ground water table depletion causes damage in causal linkage between surface and ground water, resulting change in surface water dynamics during the lean season of the river. This is the main reason of dry river segments observed between Hathinikund and Palla (Delhi). A. Upadhyay and R. K. Rai, Water Management and Public Participation, SpringerBriefs in Earth Sciences, DOI: 10.1007/978-94-007-5709-7_2, Ó The Author(s) 2013 13
Transcript of Chapter 2 Brief Overview of the Yamuna River Basin and...
Chapter 2Brief Overview of the Yamuna RiverBasin and Issues
Abstract This chapter presents the current status of the Yamuna river basin as wellas brief description of its catchments. This chapter also includes the various issuerelated to water in terms of water quantity, quality, wastewater and environmentalflow.
The Yamuna River is one of the important and sacred rivers of India. It is thelargest tributary of the River Ganga. It originates from Yamunotri glacier inthe Mussoorie range of the lower Himalayas, and after traversing 1,376 km joinsthe river Ganga at Allahabad. The drainage area of the Yamuna basin is366,220 sq km, which comprises part of seven states, viz. Uttarakhand, HimachalPradesh, Uttar Pradesh, Haryana, Delhi, Rajasthan and Madhya Pradesh(Table 2.1). The Yamuna River has four main tributaries in the Himalayan region:Rishi Ganga, Hanuman Ganga, Tons, and Giri. In the plains, the main tributariesare the Hindon, Chambal, Sind, Betwa and Ken (Fig. 2.1).
The river water is generally used for irrigation, drinking and industries as well asfor mass bathing, laundry, cattle bathing, and secretion of the cremation ash. Theconstruction of diversion structures at regular intervals (Hathinikund, Wazirabad,Okhla, Gokul, etc.) for irrigation, domestic and industrial water supply, has largelymodified the flow regime of the river. The inflow of wastewater either treated orpartially treated in the river further aggravates the water quality problem of theriver. Though the green revolution was important for food security, but lack ofregulation in the groundwater abstraction has led to ground water table depletioncauses damage in causal linkage between surface and ground water, resultingchange in surface water dynamics during the lean season of the river. This is themain reason of dry river segments observed between Hathinikund and Palla(Delhi).
A. Upadhyay and R. K. Rai, Water Management and Public Participation,SpringerBriefs in Earth Sciences, DOI: 10.1007/978-94-007-5709-7_2,� The Author(s) 2013
13

Tab
le2.
1D
etai
lsof
catc
hmen
tar
eaan
dst
ate
ofY
amun
ari
ver
basi
n
Sta
teA
rea
inY
amun
aba
sin
(km
2)
Are
ain
maj
orsu
b-ba
sin
(km
2)
Hin
don
Cha
mba
lS
ind
Bet
wa
Ken
Oth
ers
Utt
arak
hand
3,77
1(1
.1%
)–
––
––
3,77
1(3
.74
%)
Him
acha
lP
rade
sh5,
799
(1.7
%)
––
––
–5,
799
(5.7
6%
)U
ttar
Pra
desh
70,4
37(2
0.4
%)
7,08
3(1
00%
)45
2(0
.32
%)
748
(2.8
9%
)14
,438
(30.
12%
)3,
336
(13.
66%
)44
,380
(44.
06%
)H
arya
na21
,265
(6.1
%)
––
––
–21
,265
(21.
11%
)R
ajas
than
102,
883
(29.
7%
)–
79,4
95(5
6.87
%)
––
–23
,388
(23.
22%
)M
adhy
aP
rade
sh14
0,20
8(4
0.6
%)
–59
,838
(42.
81%
)25
,131
(97.
11%
)33
,502
(69.
88%
)21
,090
(86.
34%
)64
7(0
.64
%)
14 2 Brief Overview of the Yamuna River Basin and Issues

2.1 Issues and Challenges
The major issues and the challenges of the Yamuna river basin may be categorizedas water resources, water quality and wastewater generation. These issues arebriefly elaborated in the following sections.
2.1.1 Water Resources
Since independence, the population in the Yamuna basin has been increased by 2.5times, and to ensure the food security, various irrigation schemes have beensubsequently developed. Currently, the irrigated area in the basin has become 2
Fig. 2.1 Catchments of the Yamuna river basin and major tributaries
2.1 Issues and Challenges 15

times as compared to the year 1950. Also, during 60 years since 1950, the con-tribution of groundwater resources for irrigation has been triplicated. A net shareof surface and groundwater for irrigation has now been become 37 and 57 %instead of 60 and 20 % in 1950s. The rest of the irrigation water is met by othersources like ponds, tanks, anicuts, etc.
The increasing groundwater development in the basin is a major concern insustainable water resources planning and management. The district-wise stage ofground water development in the basin is depicted in Fig. 2.2, which clearlyindicates that eastern and south-east part of the basin has already been overex-ploited in terms of CGWB classification (CGWB 2010). The right bank portion ofthe main Yamuna River is also under semi-critical to overexploited category of
Fig. 2.2 Stages of ground water development in the basin (Rai et al. 2011)
16 2 Brief Overview of the Yamuna River Basin and Issues

stage of ground water development starting from Yamunanagar to Etawah, this ledto termination in the causal linkage between the groundwater and the river runoff.
The current water use and the analysis of 10 years (2000–2009) of hydrologicaldata (both surface water and groundwater) reveal that entire basin is under waterdeficit (approximately 34.54 BCM of deficit). However, the Ken River (surplus of3.27 BCM) and the Upper Himalayan (surplus of 4.6 BCM) catchments have
Table 2.2 Mean monthly flows of Yamuna river at various locations (Rai et al. 2011)
Months Mean monthly flows (m3/s)
Paonta Kalanaur aDRB aAgra Pratappur
June 84.9 35.9 37.8 27.0 356.8July 302.4 287.8 248.3 157.2 2,426.8August 595.5 604.8 630.9 505.9 6,608.4September 399.3 389.6 453.3 504.6 6,230.7October 104.5 89.6 93.3 157.2 1,166.7November 53.2 52.1 57.8 81.0 569.0December 40.7 11.9 35.8 43.6 466.7January 40.7 11.9 34.3 29.8 366.2February 56.2 10.3 33.5 28.9 392.6March 71.7 43.7 28.0 20.9 345.3April 30.8 17.7 42.4 27.0 356.8May 40.3 17.2 24.3 17.4 242.6a Though the flow is available but water quality is very poor
Fig. 2.3 Comparison of water quality profile for the year 2003 and 2008 (Rai et al. 2011)
2.1 Issues and Challenges 17

surplus water resources because of its poor land capabilities. The mean monthlyflows available at various discharge measurement sites are specified in Table 2.2.
2.1.2 Water Quality
Analysis of the secondary data collected from Central Pollution Control Board(CPCB) and primary sampling at various locations in the Yamuna River revealsthat water quality is gradually deteriorating and will tend to deteriorate if notmanaged properly. This can be seen through the comparison of DO profile of theYamuna River for the year 2003 and 2008 (Fig. 2.3), which indicates that pollutedstretch in the Yamuna River, is gradually increasing.
6125
8444
17229
0
2000
4000
6000
8000
10000
12000
14000
16000
18000
20000
2001, 2010, 2030,
Sew
age,
ML
D
Fig. 2.4 Projection ofwastewater generation
0
500
1000
1500
2000
2500
3000
3500
4000
4500
HP
Utta
rakh
and
Har
yana
Del
hi
UP
MP
Raj
asth
an
Was
tew
ater
(M
LD
)
Domestic IndustrialFig. 2.5 State-wise domesticand industrial wastewater
18 2 Brief Overview of the Yamuna River Basin and Issues

2.1.3 Wastewater Generation
Wastewater inflow in the river Yamuna is major source of pollution, which isgoverned by population, water supply, sewerage network and collection, efficiencyof the relevant infrastructure, etc. Currently, 8,444 MLD of wastewater is gener-ated in the basin, out of which about 4,458 MLD is discharged directly into theYamuna river and about 1,200 MLD is discharged into its tributaries remaining2,786 MLD is either disposed of on land or used for irrigation. Due to populationgrowth, this wastewater generation will be further aggravated (Fig. 2.4). Delhialone generates about 3,743 MLD of wastewater, which is 44 % of the entiresewage generated in the basin and 84 % of the sewage being discharged into theYamuna along its entire course.
State-wise wastewater generation is shown in Fig. 2.5, which demonstrates thatthe Uttar Pradesh is highest contributor of industrial waste in the Yamuna Riverthrough Hindon River and Hindon-cut.
On the sewage treatment front, Delhi has highest sewage treatment capacity of2,330 MLD which is about 68 % of the total sewage treatment capacity in thebasin (Table 2.3). However, there is still a large gap between generation andtreatment in Delhi itself. Though, several STPs have been installed along the rivercourse with a designed capacity of the order of 2,332.25 MLD for Delhi,327 MLD for Haryana, and 403.25 MLD for Uttar Pradesh. But, the river qualityof the river is not yet improved as the treatment capacity is neither adequate noreffectively utilized. Main issues related to sewage management are:
Table 2.3 Wastewater generation and treatment capacity of YAP towns
Cities/towns Bank Volume of WW(MLD)
Treatment capacity(MLD)
Yamunanagar R 45 35Saharanpur L 45 38Muzaffarnagar L 40 32.5Karnal R 60 48Panipat R 60 45Sonepat R 45 30Delhi R/L 3,800 2,330Gurgaon R 45 30Faridabad R 140 115Ghaziabad L 150 126Noida L 90 70Vrindavan R 5 4.5Mathura R 35 28Agra R 190 90Etawah R 13 10Allahabad L 223 89Total 4,986 3,121
2.1 Issues and Challenges 19

• STPs capacity is inadequate as compared to the generated sewage.• STPs are in general practically not meeting their compliance.• Under running of most of the STPs due to lack of sewer connections.• Improper drainage system.• Excess BOD concentration coming to the plant due to inadequate water supply,
etc.
Considering the current status of generation and treatment capacity of Delhialone, even if treated effluent quality is achieved at 10 mg/l BOD for the entireexisting treatment capacity, still BOD load would be 179 t/d, which may result inBOD concentration of 46 mg/l in the final effluent and not complying with theprescribed standards. Even if the entire sewage of Delhi is treated to a level of5 mg/l of BOD, still the BOD load in the final effluent would be 19.4 t/d, whichmay continue to impair the water quality of the river.
2.1.4 Environmental Flow
Environmental flow is an important issue for the river Yamuna, and an attempt wasmade to estimate it for different stretches in different months. In the study, varioushydrology based methodology was investigated. A hydraulic method (Rai et al.2011), which accounts for seepage and evaporation losses, ecological require-ment and water requirement for pollution assimilation was used to estimate the
Table 2.4 Environmental flow requirement of various reaches of Yamuna river
Month Release fromHathinikund(Hathinikundto Palla)(m3/s)
ReleasefromWazirabad(Wazirabadto Okhla)(m3/s)
ReleasefromOkhla(Okhla toAgra)(m3/s)
aNet release fromHathinikund formaintaining theenvironmental flowup to Agra (m3/s)
FromAgra(Agra toEtawah)(m3/s)
FromEtawah(Etawah toAllahabad)(m3/s)
January 36.8 14.5 42.4 82.2 63.8 91.6February 40.4 14.7 45.5 89.9 67.8 98.8March 47.2 12.3 36.7 78.4 54.9 86.3April 37.0 17.6 48.4 88.0 69.7 89.2May 39.2 11.0 33.8 73.8 51.1 60.7June 46.4 15.99 45.5 89.5 66.6 89.2July 121.8 83.3 117.3 188.5 196.8 606.7August 227.2 189.0 221.1 318.0 435.4 1,707.3September 155.6 162.4 209.5 323.6 409.0 1,507.5October 63.0 36.4 115.3 167.6 182.4 301.4November 48.5 22.4 69.4 113.8 107.4 137.7December 36.8 15.0 47.0 87.0 72.9 116.7a The net release accounts the ecological flow of previous reach which will carry forward to thenext reach
20 2 Brief Overview of the Yamuna River Basin and Issues
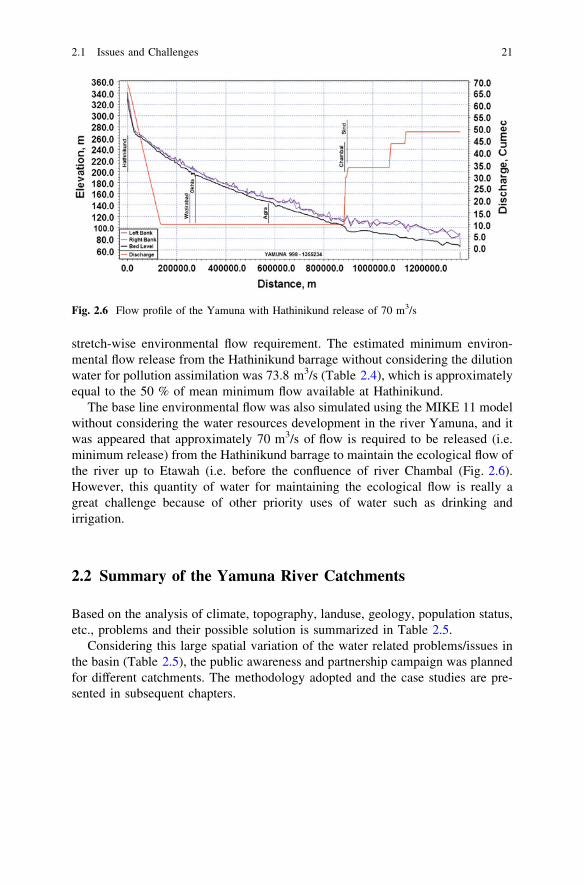
stretch-wise environmental flow requirement. The estimated minimum environ-mental flow release from the Hathinikund barrage without considering the dilutionwater for pollution assimilation was 73.8 m3/s (Table 2.4), which is approximatelyequal to the 50 % of mean minimum flow available at Hathinikund.
The base line environmental flow was also simulated using the MIKE 11 modelwithout considering the water resources development in the river Yamuna, and itwas appeared that approximately 70 m3/s of flow is required to be released (i.e.minimum release) from the Hathinikund barrage to maintain the ecological flow ofthe river up to Etawah (i.e. before the confluence of river Chambal (Fig. 2.6).However, this quantity of water for maintaining the ecological flow is really agreat challenge because of other priority uses of water such as drinking andirrigation.
2.2 Summary of the Yamuna River Catchments
Based on the analysis of climate, topography, landuse, geology, population status,etc., problems and their possible solution is summarized in Table 2.5.
Considering this large spatial variation of the water related problems/issues inthe basin (Table 2.5), the public awareness and partnership campaign was plannedfor different catchments. The methodology adopted and the case studies are pre-sented in subsequent chapters.
Fig. 2.6 Flow profile of the Yamuna with Hathinikund release of 70 m3/s
2.1 Issues and Challenges 21

Tab
le2.
5S
umm
ary
ofth
eph
ysio
grap
hic
and
clim
atic
cond
itio
nsof
the
sub-
basi
n
Var
iabl
esU
pper
Him
alay
anH
indo
nH
athi
niku
ndto
Del
hi
Mea
nra
infa
ll(m
m)
1175
887.
065
0.0
Cli
mat
eH
umid
Sem
i-ar
idto
sub-
hum
idS
emi-
arid
Mea
nsl
ope
(m/k
m)
28.5
28\
0.70
\0.
80
Hyd
roge
olog
yH
illy
and
Tar
aiR
ecen
tal
luvi
umR
ecen
tto
olde
ral
luvi
um
Geo
logy
Sof
tro
ckan
dT
arai
All
uviu
mA
lluv
ium
Gro
undw
ater
deve
lopm
ent
Whi
teW
hite
togr
eyG
rey
toda
rk
Cro
ppin
gin
tens
ity
(%)
118–
167
132–
167
148–
212
Pop
ulat
ion
dens
ity
(per
sqkm
),ce
nsus
-200
112
–300
600–
2000
100–
800
Pop
ulat
ion
dens
ity
alon
gth
eri
ver
Pop
ulat
ion
dens
ity
alon
gth
eri
ver
cour
seis
vary
ing
betw
een
800
and
9,41
2;w
hich
caus
ing
maj
oren
viro
nmen
tal
dam
age
toth
eri
ver.
Eco
nom
yH
orti
cult
ure
+A
gric
ultu
reA
gric
ultu
re+
Indu
stri
esA
gric
ultu
re+
Indu
stri
es
Pol
luti
onso
urce
sD
omes
tic
Indu
stri
es(S
catt
ered
sour
ce)
Indu
stri
esD
omes
tic
Dom
esti
cIn
dust
ries
Maj
orw
ater
prob
lem
–Q
uali
tyQ
uant
ity
and
qual
ity
Sol
utio
nC
onst
ruct
ion
ofen
viro
nmen
tal
rese
rvoi
rfo
rri
pari
anec
osys
tem
mai
nten
ance
Soi
lco
nser
vati
on
Was
tew
ater
man
agem
ent
Cro
ppl
anni
ngIm
prov
emen
tin
irri
gati
onef
fici
ency
Cro
ppl
anni
ngIm
prov
emen
tin
irri
gati
onef
fici
ency
Gro
undw
ater
rech
arge
Was
tew
ater
man
agem
ent
Riv
ertr
aini
ngw
ork
for
wat
erau
gmen
tati
onth
roug
hw
eirs
acro
ssth
eri
ver
Var
iabl
esC
ham
bal
Sin
dB
etw
aK
en
Mea
nR
ainf
all
(mm
)78
3.7
848.
310
64.9
1125
.0
Cli
mat
eS
emi-
arid
tosu
b-hu
mid
Sem
i-ar
idto
sub-
hum
idS
emi-
arid
tom
oist
sub-
hum
idS
ubhu
mid
tohu
mid
Mea
nS
lope
(m/k
m)
1.70
41.
066
1.06
31.
5527
(con
tinu
ed)
22 2 Brief Overview of the Yamuna River Basin and Issues

Tab
le2.
5(c
onti
nued
)
Var
iabl
esC
ham
bal
Sin
dB
etw
aK
en
Hyd
roge
olog
yO
lder
allu
vium
Con
soli
date
dse
dim
enta
ryC
ryst
alli
ne(I
gneo
usan
dm
etam
orph
ic)
Dec
can
trap
Old
eral
luvi
umC
onso
lida
ted
sedi
men
tary
Cry
stal
line
(Ign
eous
and
Met
amor
phic
)D
ecca
ntr
ap
Con
soli
date
dse
dim
enta
ryC
ryst
alli
ne(I
gneo
usan
dm
etam
orph
ic)
Dec
can
trap
Old
eral
luvi
umC
onso
lida
ted
sedi
men
tary
Cry
stal
line
(Ign
eous
and
met
amor
phic
)
Geo
logy
Har
dro
ckH
ard
rock
Har
dro
ckH
ard
rock
Gro
undw
ater
deve
lopm
ent
Mos
tly
dark
Whi
teto
grey
Whi
teto
grey
Whi
teto
grey
Cro
ppin
gin
tens
ity
(%)
105–
212
105–
132
105–
167
105–
148
Pop
ulat
ion
dens
ity
(per
sqkm
),ce
nsus
-200
110
0–30
010
0–60
010
0–60
010
0–60
0
Eco
nom
yA
gric
ultu
re+
Liv
esto
ckA
gric
ultu
re+
Liv
esto
ckA
gric
ultu
re+
Liv
esto
ckA
gric
ultu
re+
Liv
esto
ck
Pol
luti
onso
urce
sD
omes
tic
Dom
esti
cD
omes
tic
Dom
esti
c
(Sca
tter
edso
urce
)(S
catt
ered
sour
ce)
(Sca
tter
edso
urce
)(S
catt
ered
sour
ce)
Maj
orw
ater
Pro
blem
Qua
ntit
yQ
uant
ity
Qua
ntit
yQ
uant
ity
Sol
utio
nC
rop
plan
ning
Impr
ovem
ent
inir
riga
tion
effi
cien
cyS
oil
cons
erva
tion
Wat
erha
rves
ting
and
grou
ndw
ater
rech
arge
thro
ugh
shaf
t
Cro
ppl
anni
ngIm
prov
emen
tin
irri
gati
onef
fici
ency
Soi
lco
nser
vati
onW
ater
harv
esti
ngan
dgr
ound
wat
erre
char
geth
roug
hsh
aft
Cro
ppl
anni
ngIm
prov
emen
tin
irri
gati
onef
fici
ency
Soi
lco
nser
vati
onW
ater
harv
esti
ngan
dgr
ound
wat
erre
char
geth
roug
hsh
aft
Cro
ppl
anni
ngIm
prov
emen
tin
irri
gati
onef
fici
ency
Soi
lco
nser
vati
onW
ater
harv
esti
ngan
dgr
ound
wat
erre
char
geth
roug
hsh
aft
2.2 Summary of the Yamuna River Catchments 23

References
CGWB (2010) Groundwater status of India. Central Ground Water Board, FaridabadRai RK, Upadhyay Alka, Ojha CSP, Singh VP (2011) The Yamuna river basin: water resources
and environment. Water science and technology series, vol 66, Springer, The Netherlands
24 2 Brief Overview of the Yamuna River Basin and Issues

http://www.springer.com/978-94-007-5708-0