Chapter 2: Amplitude Modulation Transmissionspot.pcc.edu/~wlara/eet223/slides/Chapter02.pdf ·...
28
Chapter 2: Amplitude Modulation Transmission EET-223: RF Communication Circuits Walter Lara
Transcript of Chapter 2: Amplitude Modulation Transmissionspot.pcc.edu/~wlara/eet223/slides/Chapter02.pdf ·...

Chapter 2: Amplitude Modulation Transmission
EET-223: RF Communication Circuits
Walter Lara
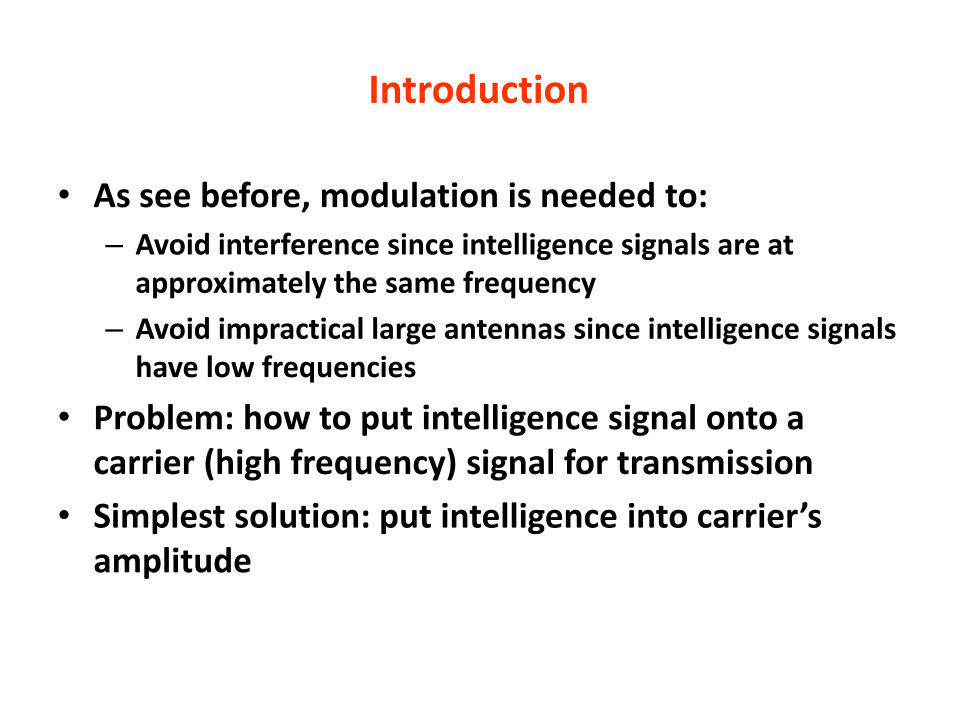
Introduction
• As see before, modulation is needed to:
– Avoid interference since intelligence signals are at approximately the same frequency
– Avoid impractical large antennas since intelligence signals have low frequencies
• Problem: how to put intelligence signal onto a carrier (high frequency) signal for transmission
• Simplest solution: put intelligence into carrier’s amplitude

AM Fundamentals
• Combining (“mixing”) the intelligence and carrier signals can be done:
– Using linear device (e.g. resistor) – simple addition, but not suitable for transmission (receiver cannot detect intelligence)
– Non-linear device (e.g., BJT or OpAmp) – method used in practice
• Non-linear mixing results on:
– DC Component
– Components at original frequencies (intelligence & carrier)
– Components at sum & difference of original frequencies
– Harmonics of original frequencies

AM Fundamentals – Cont’d
• Only the following components resulting from non-linear mixing are used on an AM waveform:
– Carrier frequency (fc)
– Lower-side frequency (fc - fi)
– Upper-side frequency (fc + fi)

Figure 2-1 Linear addition of two sine waves.

Figure 2-2 Nonlinear mixing.

AM Waveforms
• An AM modulated signal can be expressed as:
e(t) = (Ec + Ei sin wit) sin wct
where:
Ec = peak value of carrier signal
Ei =peak value of intelligence signal
wc= angular frequency of carrier signal
wi = angular frequency of intelligence signal
• It can be demonstrated that:
e(t)= Ec sin wct + (Ei/2)cos (wc - wi)t - (Ei/2)cos (wc + wi)t
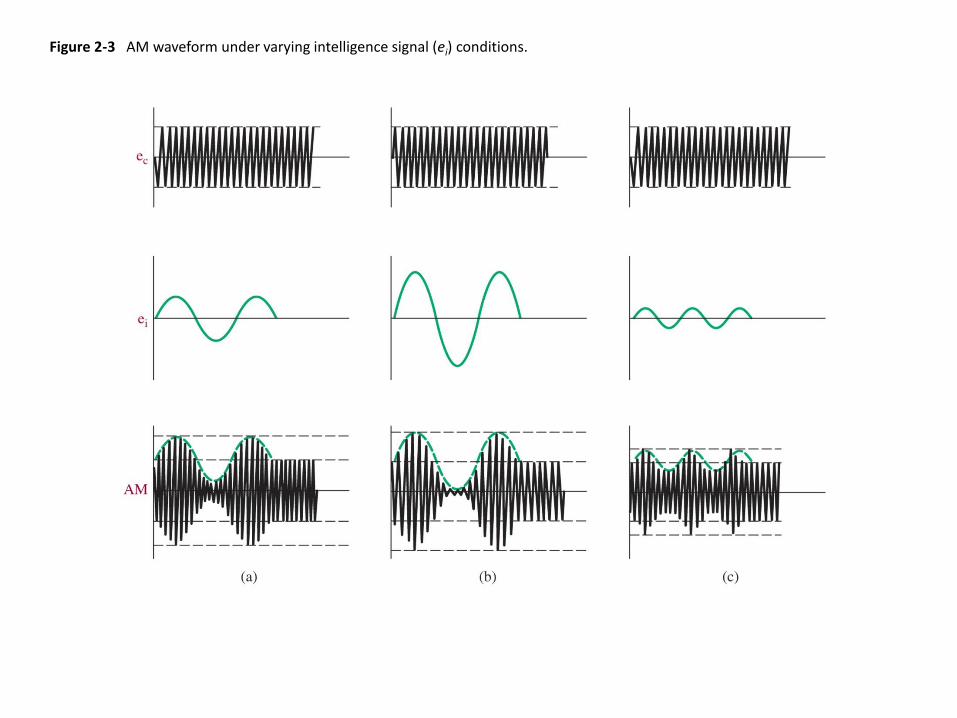
Figure 2-3 AM waveform under varying intelligence signal (ei) conditions.
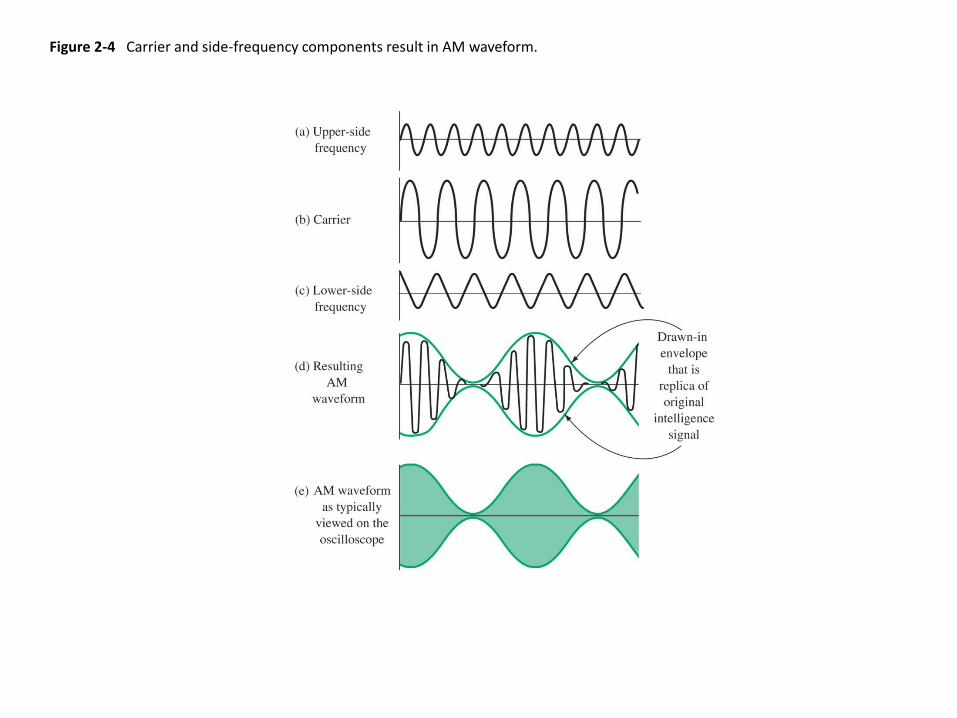
Figure 2-4 Carrier and side-frequency components result in AM waveform.

Figure 2-5 Modulation by a band of intelligence frequencies.

Figure 2-6 Solution for Example 2-1.

Percentage Modulation
• Aka Modulation Index or Modulation Factor
• Measure of extend to which carrier voltage is varied by intelligence
• Defined as: %m = Ei / Ec * 100
– Ei: Peak value of intelligence signal
– Ec: Peak value of carrier signal
• Can also be computed using the peak-to-peak value of the AM waveform (see Fig. 2-8)
– Convenient in graphical (oscilloscope) solutions.
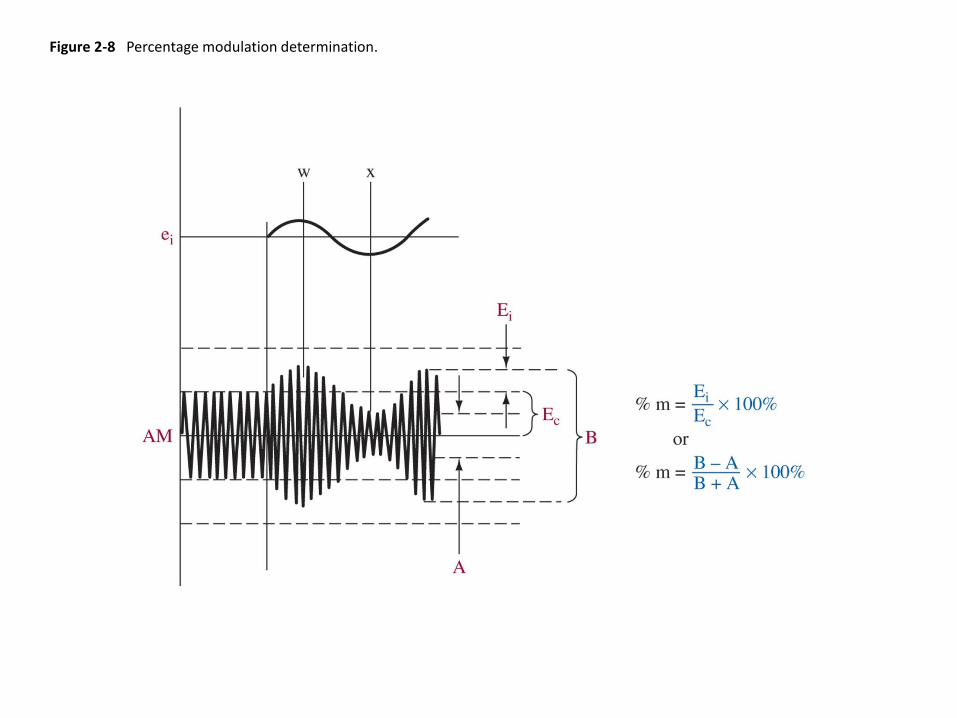
Figure 2-8 Percentage modulation determination.
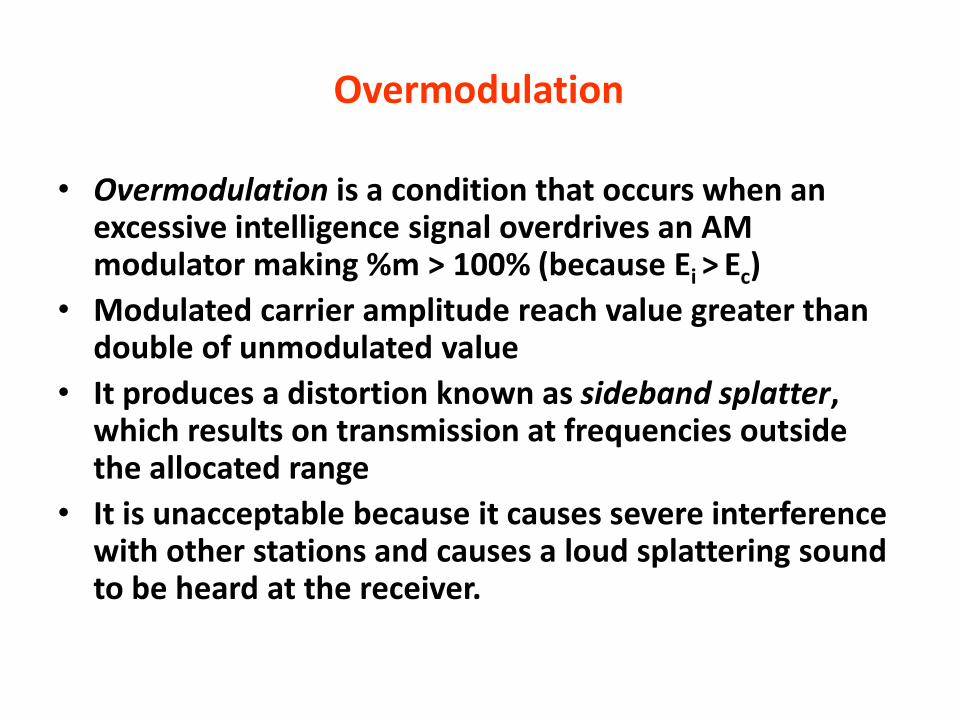
Overmodulation
• Overmodulation is a condition that occurs when an excessive intelligence signal overdrives an AM modulator making %m > 100% (because Ei > Ec)
• Modulated carrier amplitude reach value greater than double of unmodulated value
• It produces a distortion known as sideband splatter, which results on transmission at frequencies outside the allocated range
• It is unacceptable because it causes severe interference with other stations and causes a loud splattering sound to be heard at the receiver.
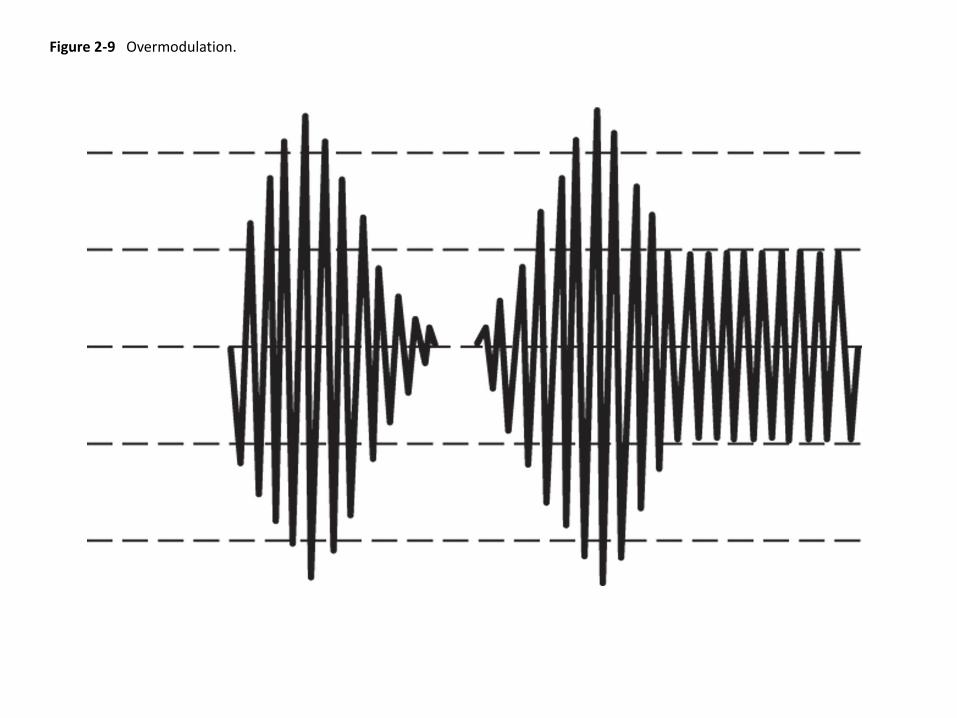
Figure 2-9 Overmodulation.

AM Analysis
• Recall:
e(t) = (Ec + Ei sin wit) sin wct
= Ec sin wct + (Ei/2)cos (wc - wi)t + (Ei/2)cos (wc + wi)t
• Since Ei = m Ec , then:
e(t) = Ec sin wct + (mEc/2) cos (wc - wi)t
+ (mEc/2) cos (wc + wi)t
• Therefore, the side-frequency amplitude is:
ESF = mEc/2

Why is important to use a high %m?
• The higher m, the more transmitted power gets to our sidebands, which contain the intelligence.
• The total power can be computed as:PT = PC + 2PSF = PC (1 + m2 / 2)
Where:
PC : carrier power
PSF : single sideband power
• The total current can be computed as:
IT = Ic 𝟏 +𝒎𝟐/𝟐
• The power efficiency can be computed as:Efficiency = 2PSF / PT = m2 / (2 + m2)

AM Transmitter System
• Refer to block diagram at Fig. 2-18 (next slide).
• Main components are:– Oscillator: generates carrier signal at high accuracy (crystal-
controlled)
– Buffer Amplifier: provides high impedance load to oscillator to minimize drift
– Intelligence Amplifier: amplifies the signal from input transducer
– Modulated Amplifier (aka Modulator): generates modulated/mixed signal
– Linear Power Amplifier: amplifies modulated signal on high-power (commercial) systems
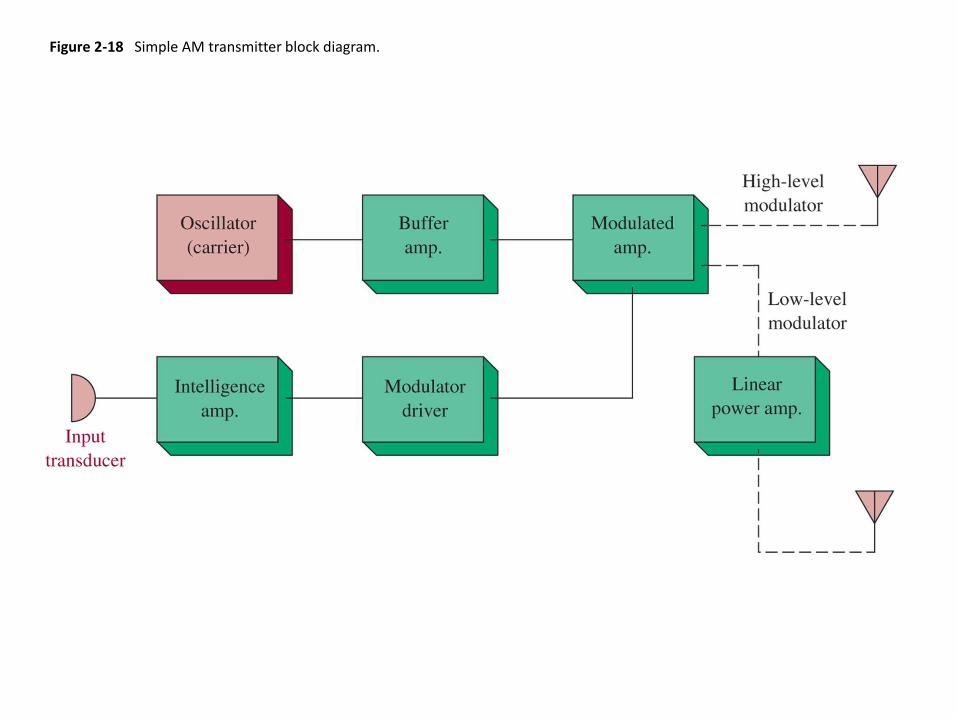
Figure 2-18 Simple AM transmitter block diagram.
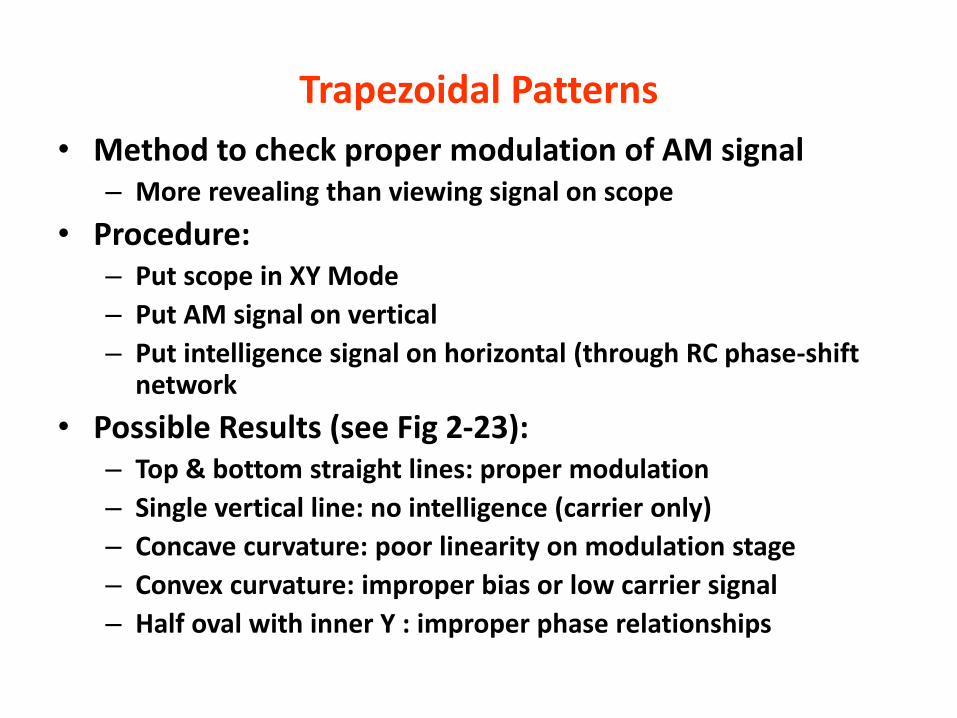
Trapezoidal Patterns
• Method to check proper modulation of AM signal– More revealing than viewing signal on scope
• Procedure:– Put scope in XY Mode
– Put AM signal on vertical
– Put intelligence signal on horizontal (through RC phase-shift network
• Possible Results (see Fig 2-23):– Top & bottom straight lines: proper modulation
– Single vertical line: no intelligence (carrier only)
– Concave curvature: poor linearity on modulation stage
– Convex curvature: improper bias or low carrier signal
– Half oval with inner Y : improper phase relationships

Figure 2-23 Trapezoidal pattern connection scheme and displays.

Spectrum Analyzers
• Show plot of amplitude vs frequency
• Swept-tuned (superhetereodyne) Analyzer – uses analog frequency sweep, can go up to GHz range
• Fourier Analyzer – digitizes waveform and uses FFT algorithms. Limited to ~40 MHz (EET Labs)
• Vector Signal Analyzer (VSA) – uses analog front-end and digitizes after down-convertion.
– Best of both worlds, but expensive
– Can measure Total Harmonic Distortion (THD)

Figure 2-24 Spectrum analysis of AM waveforms.

Figure 2-25 Spectrum analyzer and typical display. (Courtesy of Tektronix, Inc.)

Figure 2-25 (continued) Spectrum analyzer and typical display. (Courtesy of Tektronix, Inc.)

Relative Harmonic Distortion (RHD)
• Ratio of fundamental with respect to the largestundesired harmonic
– The greater, the better
• Can be computed (in dB) as:
RHD = 𝟐𝟎 𝒍𝒐𝒈 𝑽𝟏/𝑽𝟐Where:
V1: desired component (fundamental frequency)
V2: largest undesired harmonic component
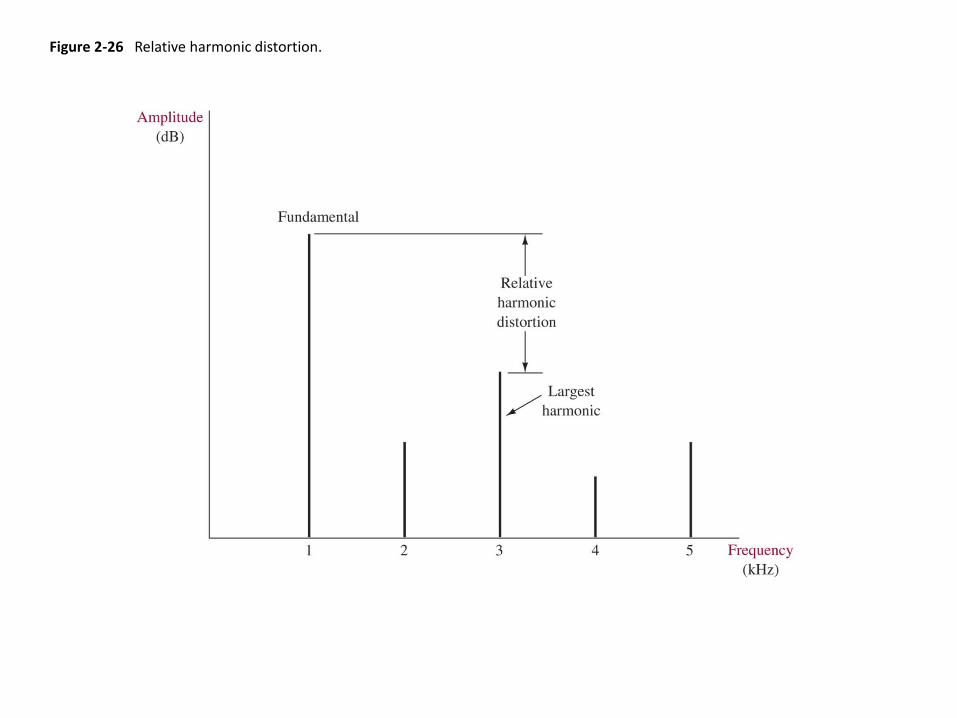
Figure 2-26 Relative harmonic distortion.

Total Harmonic Distortion (THD)
• Ratio of power from unwanted harmonics to desired frequency components– The greater, the worst– More descriptive distortion spec than RHD
• Occurs in amplifiers and non-linear devices
• Can be computed as:
THD = (𝑽𝟐𝟐 + 𝑽𝟑
𝟐 + 𝑽𝟒𝟐 + …)/𝑽𝟏
𝟐
Where:
V1: desired component (fundamental frequency)
V2, V3, … : undesired harmonic components


![Electronic PRINCIPLESspot.pcc.edu/~wlara/eet222/slides/22.pdf · 2016. 1. 3. · Title:Microsoft PowerPoint - 22.ppt [Compatibility Mode] Author: wlara Created Date: 1/7/2013 1:50:11](https://static.fdocuments.in/doc/165x107/6149bc4112c9616cbc68f46b/electronic-wlaraeet222slides22pdf-2016-1-3-titlemicrosoft-powerpoint.jpg)


![Electronic PRINCIPLES - PCCspot.pcc.edu/~wlara/eet222/slides/23.pdf · Title: Microsoft PowerPoint - 23.ppt [Compatibility Mode] Author: wlara Created Date: 1/7/2013 1:50:36 PM](https://static.fdocuments.in/doc/165x107/5a79cce27f8b9a5c3a8cd8ca/electronic-principles-wlaraeet222slides23pdftitle-microsoft-powerpoint-.jpg)