
Chapter 17 Notes - Part 1 Basics of Financial Statement ... · o Horizontal Analysis: ... o Ratio...
34
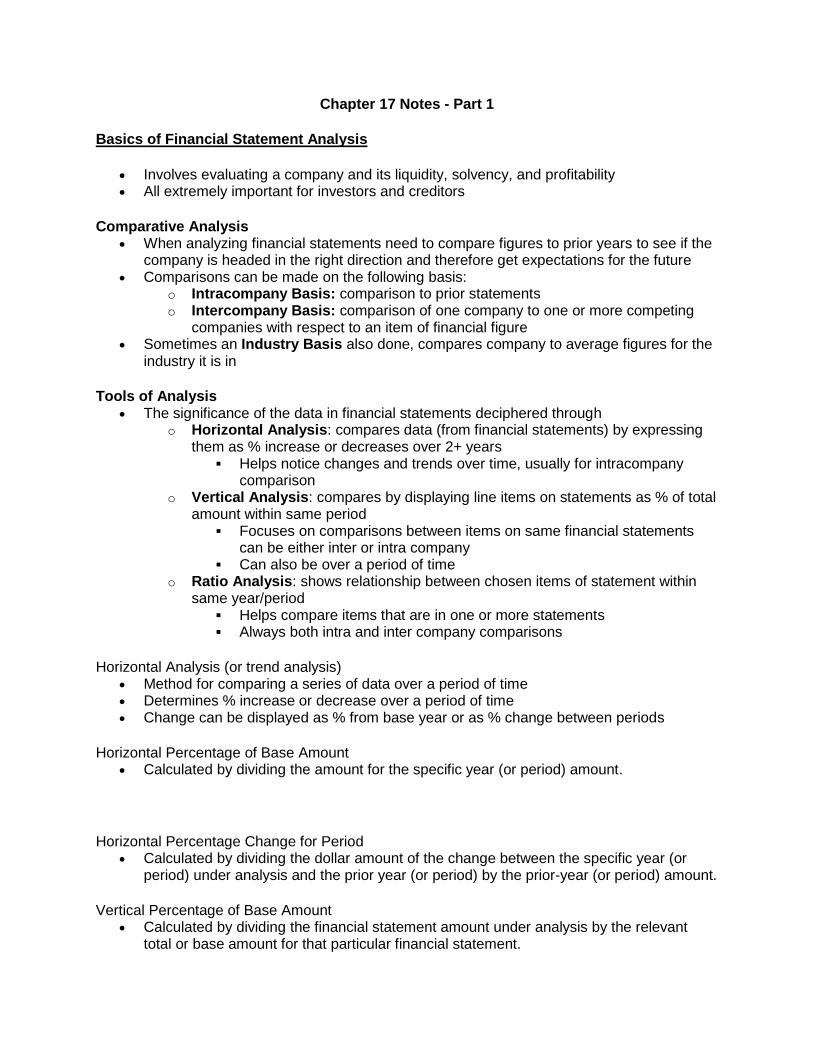
Chapter 17 Notes - Part 1 Basics of Financial Statement Analysis Involves evaluating a company and its liquidity, solvency, and profitability All extremely important for investors and creditors Comparative Analysis When analyzing financial statements need to compare figures to prior years to see if the company is headed in the right direction and therefore get expectations for the future Comparisons can be made on the following basis: o Intracompany Basis: comparison to prior statements o Intercompany Basis: comparison of one company to one or more competing companies with respect to an item of financial figure Sometimes an Industry Basis also done, compares company to average figures for the industry it is in Tools of Analysis The significance of the data in financial statements deciphered through o Horizontal Analysis: compares data (from financial statements) by expressing them as % increase or decreases over 2+ years Helps notice changes and trends over time, usually for intracompany comparison o Vertical Analysis: compares by displaying line items on statements as % of total amount within same period Focuses on comparisons between items on same financial statements can be either inter or intra company Can also be over a period of time o Ratio Analysis: shows relationship between chosen items of statement within same year/period Helps compare items that are in one or more statements Always both intra and inter company comparisons Horizontal Analysis (or trend analysis) Method for comparing a series of data over a period of time Determines % increase or decrease over a period of time Change can be displayed as % from base year or as % change between periods Horizontal Percentage of Base Amount Calculated by dividing the amount for the specific year (or period) amount. Horizontal Percentage Change for Period Calculated by dividing the dollar amount of the change between the specific year (or period) under analysis and the prior year (or period) by the prior-year (or period) amount. Vertical Percentage of Base Amount Calculated by dividing the financial statement amount under analysis by the relevant total or base amount for that particular financial statement.
Transcript of Chapter 17 Notes - Part 1 Basics of Financial Statement ... · o Horizontal Analysis: ... o Ratio...
Chapter 17 Notes - Part 1
Basics of Financial Statement Analysis
Involves evaluating a company and its liquidity, solvency, and profitability All extremely important for investors and creditors
Comparative Analysis
When analyzing financial statements need to compare figures to prior years to see if the company is headed in the right direction and therefore get expectations for the future
Comparisons can be made on the following basis: o Intracompany Basis: comparison to prior statements o Intercompany Basis: comparison of one company to one or more competing
companies with respect to an item of financial figure Sometimes an Industry Basis also done, compares company to average figures for the
industry it is in
Tools of Analysis
The significance of the data in financial statements deciphered through o Horizontal Analysis: compares data (from financial statements) by expressing
them as % increase or decreases over 2+ years Helps notice changes and trends over time, usually for intracompany
comparison o Vertical Analysis: compares by displaying line items on statements as % of total
amount within same period Focuses on comparisons between items on same financial statements
can be either inter or intra company Can also be over a period of time
o Ratio Analysis: shows relationship between chosen items of statement within same year/period
Helps compare items that are in one or more statements Always both intra and inter company comparisons
Horizontal Analysis (or trend analysis)
Method for comparing a series of data over a period of time Determines % increase or decrease over a period of time Change can be displayed as % from base year or as % change between periods
Horizontal Percentage of Base Amount
Calculated by dividing the amount for the specific year (or period) amount.
Horizontal Percentage Change for Period
Calculated by dividing the dollar amount of the change between the specific year (or period) under analysis and the prior year (or period) by the prior-year (or period) amount.
Vertical Percentage of Base Amount
Calculated by dividing the financial statement amount under analysis by the relevant total or base amount for that particular financial statement.
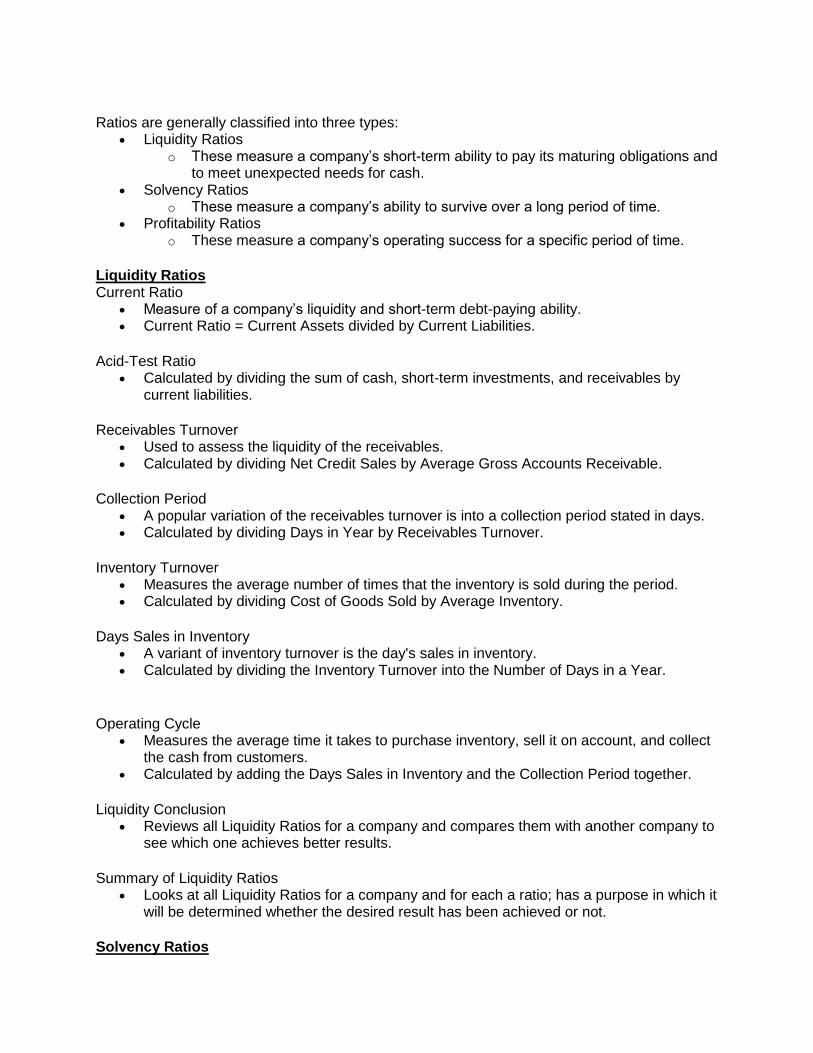
Ratios are generally classified into three types:
Liquidity Ratios o These measure a company’s short-term ability to pay its maturing obligations and
to meet unexpected needs for cash. Solvency Ratios
o These measure a company’s ability to survive over a long period of time. Profitability Ratios
o These measure a company’s operating success for a specific period of time.
Liquidity Ratios Current Ratio
Measure of a company’s liquidity and short-term debt-paying ability. Current Ratio = Current Assets divided by Current Liabilities.
Acid-Test Ratio
Calculated by dividing the sum of cash, short-term investments, and receivables by current liabilities.
Receivables Turnover
Used to assess the liquidity of the receivables. Calculated by dividing Net Credit Sales by Average Gross Accounts Receivable.
Collection Period
A popular variation of the receivables turnover is into a collection period stated in days. Calculated by dividing Days in Year by Receivables Turnover.
Inventory Turnover
Measures the average number of times that the inventory is sold during the period. Calculated by dividing Cost of Goods Sold by Average Inventory.
Days Sales in Inventory
A variant of inventory turnover is the day's sales in inventory. Calculated by dividing the Inventory Turnover into the Number of Days in a Year.
Operating Cycle
Measures the average time it takes to purchase inventory, sell it on account, and collect the cash from customers.
Calculated by adding the Days Sales in Inventory and the Collection Period together.
Liquidity Conclusion
Reviews all Liquidity Ratios for a company and compares them with another company to see which one achieves better results.
Summary of Liquidity Ratios
Looks at all Liquidity Ratios for a company and for each a ratio; has a purpose in which it will be determined whether the desired result has been achieved or not.
Solvency Ratios

Measure a company’s ability to survive over a long period of time. Long-term creditors are interested in a company’s long-term solvency, particularly its
ability to pay interest as it comes due and to repay the face value of debt at maturity.
Debt to Total Assets
Measures the percentage of the total assets that is provided by creditors. Calculated by dividing Total Liabilities (both Current and Long-Term) by Total Assets.
Interest Coverage
Gives an indication of the company’s ability to make its interest payments as they come due.
Calculated by dividing Profit before Interest Expense and Income Tax Expense by Interest Expense.
Free Cash Flow
One indication of a company’s solvency, as well as of its ability to expand operations, repay debt, or pay dividends, is the amount of excess cash it generates after paying to maintain its current productive capacity.
Calculated by subtracting Cash Provided (used) by operating activities by Cash Used (provided) by investing activities.
Solvency Conclusion and Summary of Solvency Ratio
Summarizes and makes conclusions on whether the solvency ratios for the year have been good/as predicted.
Profitability Ratios
Measure a company’s operating success for a specific period of time. A company’s profit, or lack of it, affects its ability to obtain debt and equity financing, its
liquidity position, and its growth. Gross Profit Margin
Indicated the relationship between net sales and cost of goods sold. Calculated by dividing Gross Profit (Net Sales less COGS) by Net Sales.
Profit Margin
A measure of the percentage of each dollar of sales that results in profit. Calculated by dividing Profit by Net Sales.
Asset Turnover
Measures how efficiently a company uses its assets to generate sales. Calculated by dividing Net Sales by Average Total Assets. The resulting number shows the dollar of sales produced by each dollar of assets.
Return on Assets
An overall measure of profitability. Calculated by dividing Profit by Average Total Assets.
Return on Equity
Shows how many dollars of profit were earned for each dollar invested by shareholders. Calculated by dividing Profit by Average Total Shareholders’ Equity.

Limitations of Financial Statement Analysis Alternative Accounting Policies
There are a wide variety of different accounting policies and practices that companies can use.
Ex. companies may use different inventory cost determination methods (specific identification, FIFO, or average) or different depreciation methods (straight-line, diminishing balance, or units-of-production) depending on the pattern of the revenues (economic benefits) their assets produce.
Comprehensive Income
Most financial analysis ratios exclude other comprehensive income. Ex. profitability ratios generally use data from the income statement and not the income
statement and not the statement of comprehensive income, which includes both profit and other comprehensive income.
Quality of Information
In evaluating a company’s financial performance, the quality of the information provided is extremely important.
A company that has a high quality index includes full and transparent information that will not confuse or mislead users of the financial statements.
Economic Factors
You cannot properly interpret a financial analysis without also considering the economic circumstances in which a company operates.
One must use this information, along with non-financial information, to try to assess what changes relate to the economic situation and what changes relate to factors the management can, or should be able to, control.
Economic measures such as the rate of interest, unemployment, and changes in demand and supply can have a significant impact on a company’s performance.

CORPORATE ANALYSIS ACCOUNTING CPT
PRESENTED BY: JOHNATHAN & BRIAN
DOLLARAMA INC.
Corporate Analysis 1
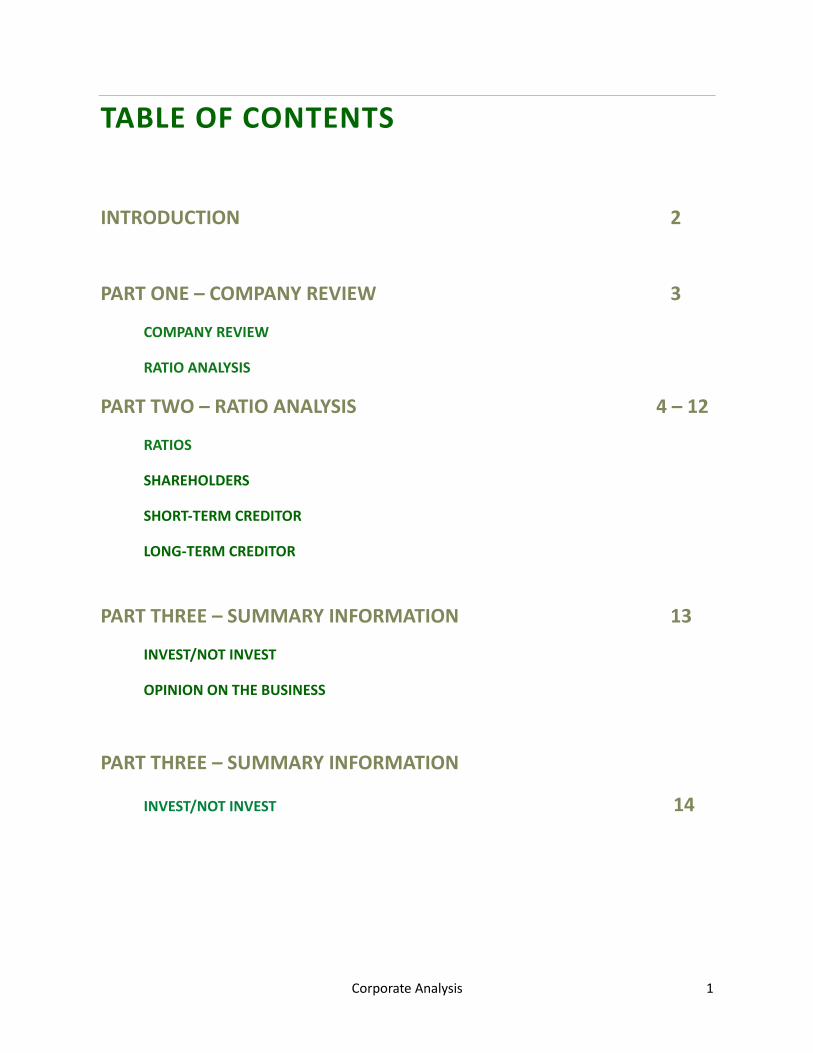
TABLE OF CONTENTS
INTRODUCTION 2
PART ONE – COMPANY REVIEW 3
COMPANY REVIEW
RATIO ANALYSIS
PART TWO – RATIO ANALYSIS 4 – 12
RATIOS
SHAREHOLDERS
SHORT-TERM CREDITOR
LONG-TERM CREDITOR
PART THREE – SUMMARY INFORMATION 13
INVEST/NOT INVEST
OPINION ON THE BUSINESS
PART THREE – SUMMARY INFORMATION
INVEST/NOT INVEST 14

Corporate Analysis 2
CORPORATE ANALYSIS
INTRODUCTION
Dollarama Inc. is a Canadian dollar store retailer which began as a family owned business first opened on April 1992 in Mantane, Quebec. Dollarama began selling products for $1 and expanded to have store in Ontario. Starting in 2009 Dollarama began introducing new price ranges. Currently, Dollarama sells products that are $4 or less. Dollarama sells a wide variety of products including cleaning supplies, greeting cards, candy, and several home items just to name a few. Dollarama has also spread all over Canada and now has more than 1000
locations. Through Dollarama’s extensive expansion by 2009 the decision to make Dollarama a public company was made. Dollarama shares from then on have been traded at the Toronto Stock Exchange under the ticker “DOL”.
Dollarama began as and continues to be a company that is committed to offering products at compelling prices without compromising safety or quality. Dollarama also strives to offer products that are sourced responsibly. Dollarama also emphasizes the importance to provide their employees with a safe work environment where employees are able to utilize their skills to pass down company values. Dollarama also contributes to the economic development of communities where stores are located.
Corporate Analysis 3
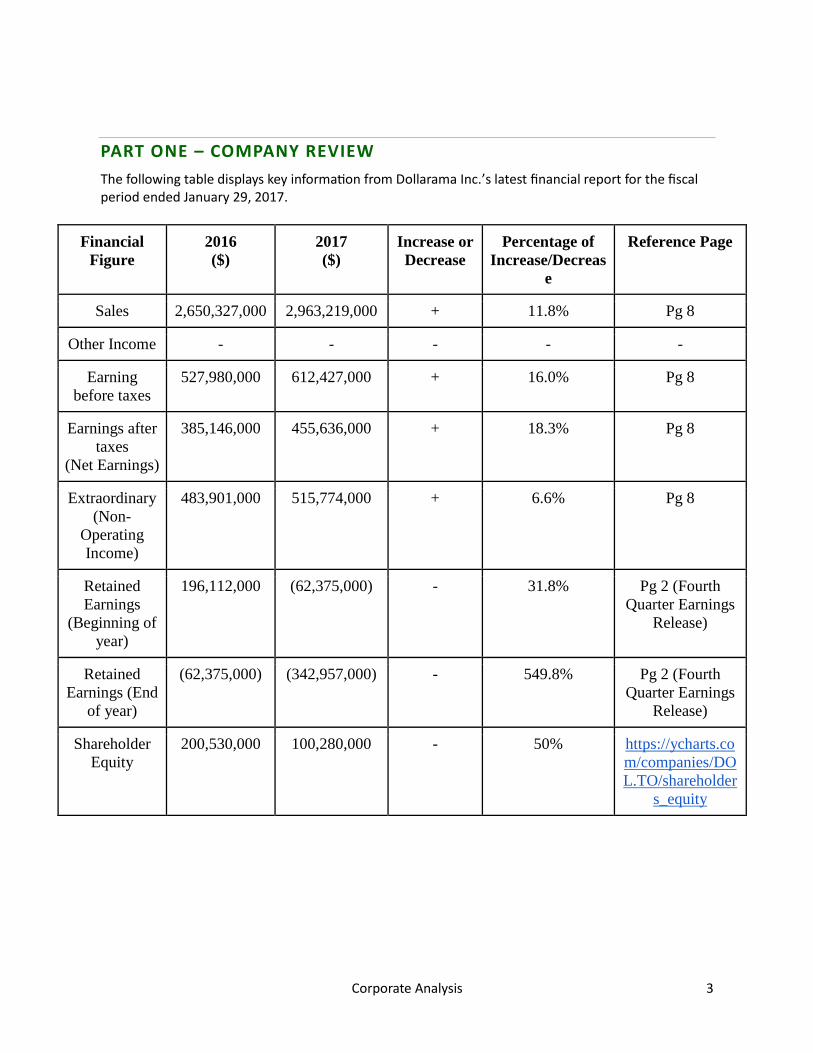
PART ONE – COMPANY REVIEW
The following table displays key information from Dollarama Inc.’s latest financial report for the fiscal period ended January 29, 2017.
Financial
Figure
2016
($)
2017
($)
Increase or
Decrease
Percentage of
Increase/Decreas
e
Reference Page
Sales 2,650,327,000 2,963,219,000 + 11.8% Pg 8
Other Income - - - - -
Earning
before taxes
527,980,000 612,427,000 + 16.0% Pg 8
Earnings after
taxes
(Net Earnings)
385,146,000 455,636,000 + 18.3% Pg 8
Extraordinary
(Non-
Operating
Income)
483,901,000 515,774,000 + 6.6% Pg 8
Retained
Earnings
(Beginning of
year)
196,112,000 (62,375,000) - 31.8% Pg 2 (Fourth
Quarter Earnings
Release)
Retained
Earnings (End
of year)
(62,375,000) (342,957,000) - 549.8%
Pg 2 (Fourth
Quarter Earnings
Release)
Shareholder
Equity
200,530,000 100,280,000 - 50% https://ycharts.co
m/companies/DO
L.TO/shareholder
s_equity

Corporate Analysis 4
PART TWO – RATIO ANALYSIS
The following table displays significant ratios that help to decipher and dissect the numbers reported in Dollarama Inc.’s latest financial report.
Ratio Formula Calculation References Result Industry
Norm
Earnings per
share of
Common Stock
Income
Available for
Common
Shareholders
(Net Income -
Preferred
Dividends)
Number of
Common
Shares
outstanding
(445,636,000-
_____) /
115,051,349
Preferred
dividends not
disclosed
Pg 8 (Management
Proxy Circular)
Pg 29 (Annual
Information Form)
https://www.google.c
a/finance?q=TSE:D
OL&fstype=ii
n/a n/a
Dividend Yield Cash
Dividends per
share Market
Price per share
0.10 127.80 Pg 30 (Annual
Information Form)
0.00078247
261
0
https://ychar
ts.com/com
panies/DLT
R/dividend_
yield
Price Earnings
Ratio
Market Price
per share
Earnings per
share
127.80 3.75 Pg 3 (Fourth Quarter
financial statement)
34.08 79.28/3.78
=20.97
Corporate Analysis 5
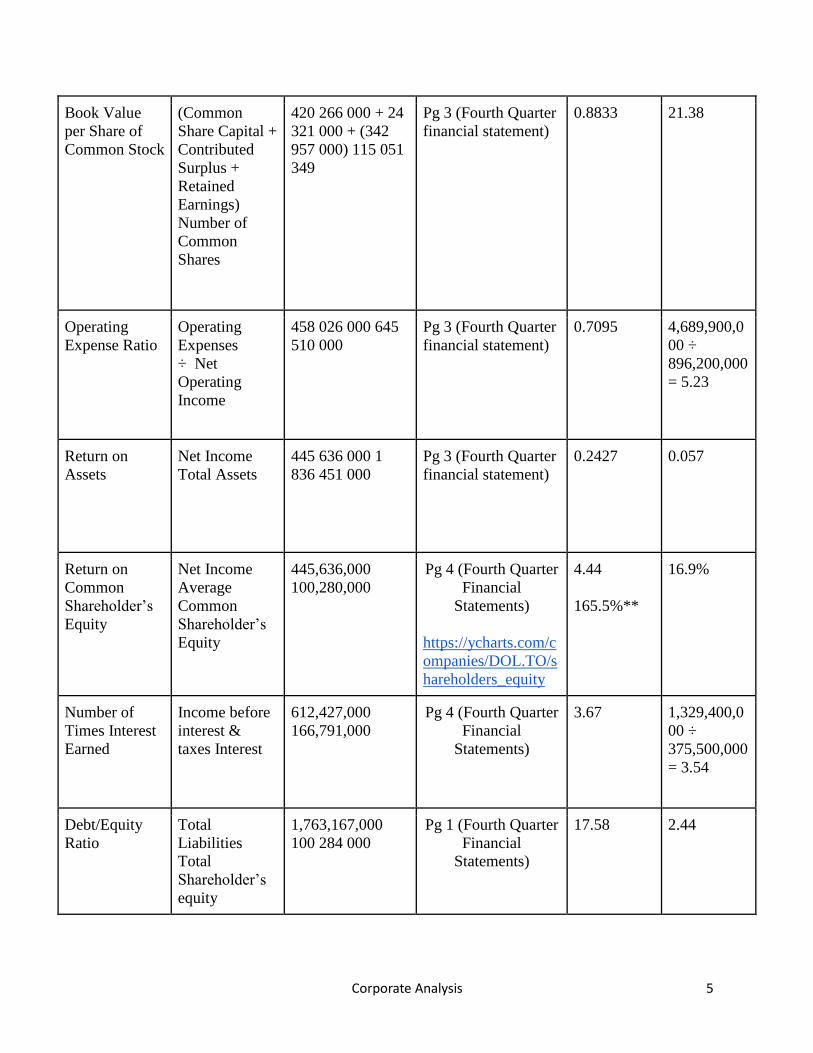
Book Value
per Share of
Common Stock
(Common
Share Capital +
Contributed
Surplus +
Retained
Earnings)
Number of
Common
Shares
420 266 000 + 24
321 000 + (342
957 000) 115 051
349
Pg 3 (Fourth Quarter
financial statement)
0.8833 21.38
Operating
Expense Ratio
Operating
Expenses
÷ Net
Operating
Income
458 026 000 645
510 000
Pg 3 (Fourth Quarter
financial statement)
0.7095 4,689,900,0
00 ÷
896,200,000
= 5.23
Return on
Assets
Net Income
Total Assets
445 636 000 1
836 451 000
Pg 3 (Fourth Quarter
financial statement)
0.2427 0.057
Return on
Common
Shareholder’s
Equity
Net Income
Average
Common
Shareholder’s
Equity
445,636,000
100,280,000
Pg 4 (Fourth Quarter
Financial
Statements)
https://ycharts.com/c
ompanies/DOL.TO/s
hareholders_equity
4.44
165.5%**
16.9%
Number of
Times Interest
Earned
Income before
interest &
taxes Interest
612,427,000
166,791,000
Pg 4 (Fourth Quarter
Financial
Statements)
3.67 1,329,400,0
00 ÷
375,500,000
= 3.54
Debt/Equity
Ratio
Total
Liabilities
Total
Shareholder’s
equity
1,763,167,000
100 284 000
Pg 1 (Fourth Quarter
Financial
Statements)
17.58 2.44

Corporate Analysis 6
Working
Capital
Current Assets
- Current
Liabilities
559,065,000 -
513,402,000
Pg 1 (Fourth Quarter
Financial
Statements)
45,663,000 1,832,100,0
00
Inventory
Turnover
Cost of Goods
Sold ÷
Average
Inventory
1,801,935,000 ÷
467,955,000
Pg 8 (Management
Proxy Circular)
3.85 1.27
Accounts
Receivable
Turnover
Net value of
Credit Sales
(for period) ÷
Average
accounts
receivable (for
that same
period)
_________÷
13,252,000
Pg 3 (Fourth Quarter
Financial Statement)
n/a credit
sales not
disclosed
n/a credit
sales not
disclosed
Current Ratio Current Assets
÷ Current
Liabilities
559 065 000 ÷
513 402 000
Pg 1 (Consolidated
Statement of
Financial Position)
1.088 1.91
Acid Test
(Quick) Ratio
(Cash +
Accounts
Receivable +
Short-Term
Investments -
Inventory) ÷
Current
Liabilities
(62 015 + 15 386
+ 7 162 - 465
715) ÷ 513 402
Pg 1 (Consolidated
Statement of
Financial Position)
-0.7424 0.62
Gross Profit
Ratio
Gross
Profit (Sales-
COGS) ÷ Net
Sales
(2 963 219 000 - 1
801 935 000) ÷ 2
963 219 000
Pg 8 (Management
Proxy Circular)
0.39% 1.37%
Profit Margin Net Income
Net Sales
445 636 000 ÷ 2
963 219 000
Pg 8 (Management
Proxy Circular)
0.15%
15%*
0.19%
31%*
*average figures from https://ycharts.com/companies/DLTR/gross_profit_margin

Corporate Analysis 7
A breakdown of the ratios displayed above to further explain and discuss what the ratio is. Then to explain what the ratio value for Dollarama means. Then a comparison will be made between the ratio value Dollarama has and the industry norm.
SHAREHOLDER’S POINT OF VIEW
As a shareholder or potential investor in Dollarama, it is crucial to consider how the company is performing, and relate it to how other businesses are doing in the same industry. Analyzing Dollarama’s financial ratios can help determine Dollarama’s current success and help predict Dollarama’s future.
EARNINGS PER SHARE (EPS)
Investors typically search for companies that have high earnings per share. This value is important to potential investors because it shows how much profit they would make per share. If the earnings per share has a high value, it means that each share has a greater value of total earnings. The EPS for Dollarama for the fiscal period ended in January 2017 was $3.75, while industry norm was $1.32. Dollarama’s EPS is $2.43 above the industry norm revealing large earnings for Dollarama’s shareholders.
DIVIDEND YIELD
The financial ratio, Dividend Yield measures the amount of cash flow investors receive for each dollar invested in an equity position. Basically these are earnings that shareholders receive. Dollarama for the fiscal period ended January 29, 2017 was 0.0008. Although this is a small value when you compare it to the industry norm which is 0 the value becomes a little more significant. So Dollarama’s Dividend Yield is about the same of the industry norm which is zero.
PRICE EARNINGS RATIO
The Price Earnings Ratio is a financial ratio that compares the company’s current share price to the earnings per share. If the price earnings ratio has a high value, it indicates high earnings growth. Dollarama’s price earnings ratio for the fiscal period ended January 2017 was 34.08, while the industry norm 20.97. This price earnings ratio shows how Dollarama is performing significantly better than the industry norm. Thus, because Dollarama is performing better than the industry norm, it shows how future growth for the company is on the up rise.

Corporate Analysis 8
RETURN ON ASSETS (ROA)
This value helps potential investors and current investors determine how efficient the company is performing. A company’s return on assets is used to understand how effective an organization is at using assets to generate income. A company with a higher return on assets is better at allocating assets to maximize revenue. Dollarama’s return on assets for the fiscal period ended January 2017 was 0.2427. In comparison with the industry norm which for ROA is 0.057 Dollarama has about four times more ROA than the industry norm. So it can be said that Dollarama is using its assets effectively.
RETURN ON COMMON SHAREHOLDER’S EQUITY (ROE)
Return on Common Shareholder’s Equity is the amount of net income as a percentage of the average shareholder’s equity. ROE reveals how much income a company is able to make with the money that is invested in the company. Dollarama has an ROE of 165.5% compared to the industry norm of 16.9 %. In comparison, Dollarama has roughly 10 times more ROE than the industry norm. Thus revealing that Dollarama is able to use the equity it has very efficiently to earn and maximize sales and income.
PROFIT MARGIN RATIO
Profit Margin Ratio measures how profitable a company is. This ratio measure what percentage of sales is retained as profits. Dollarama’s Profit Margin Ratio for the latest fiscal period was 0.15% while the industry norm is 0.19%. This means that for every dollar of sales $0.0015 is made in profits. This low profit margin ratio can be justified by the fact that the dollar store industry already sells at low prices and relies on selling a lot of merchandise to make a profits.
REVENUE AND EXPENSE ANALYSIS
According to the fiscal report for the period ended January 2017 Dollarama had $2,963,219,000 in revenue. After all expenses were deducted Dollarama had $445,636,000 in net earnings. In other words, Dollarama had $2,517,583,000 in expenses. After having very high sales, Dollarama also a large portion of expenses. Nonetheless, the company still managed to get almost half a billion dollars in Net Earnings; in which shareholders would be drawn to, as it would appear that Dollarama has decent profits with such high earnings.
CONCLUSION
Through the information provided from these financial ratios current shareholders can see how well Dollarama is doing. More than that, shareholders can see things like how much their investment in the company has grown or if there has been a loss. A very encouraging sign for shareholders displayed within these ratios is the fact that Dollarama is either about the same as the industry norm if not greater. In some instances like in the Return on Common Shareholder’s Equity where Dollarama was significantly above the industry norm, more specifically, about 10 times greater than the industry norm. As a shareholder having earnings is very important, but with the large earnings Dollarama has had in the latest fiscal period

Corporate Analysis 9
shareholders may wonder if Dollarama will be able to continue their growth or if Dollarama’s value will decrease.
SHORT-TERM CREDITORS
A short-term creditor is another group interested in looking at a business’ financial ratios as they are interested to see if the business will be able to make the agreed upon repayments on time. Short Term Creditors are also interested to know if the business has assets to make up for the loan if unable to meet payments.
WORKING CAPITAL
Working Capital ratio measures a company’s short-term financial health by comparing current assets and current liabilities. It is important for a company to have more current assets than current liabilities so that it can fulfill its financial commitments and continue in business. Dollarama’s Working Capital is of $45,663,000. Dollarama’s working capital, however when compared to the industry norm is significantly smaller, the industry norm is $1,832,100,000.
INVENTORY TURNOVER
Inventory Turnover is a ratio revealing how many times a company’s inventory is sold and replaced over a period. A low inventory means that sales are low in comparison to the inventory held on hand. During the fiscal period ending January 2017, Dollarama had an Inventory Turnover of 3.85. This means that during the fiscal period, Dollarama bought and sold its inventory almost 4 times over. This is significantly higher than that of the industry norm of 1.27. In addition to this, having this inventory turnover figure means that there will a consistent flow of cash in and out of the business. This is a positive point for short-term creditors to see because they would see that the company will have any required cash for various reasons on hand. A greater inventory turnover means less risk for short-term creditors; and because Dollarama has the highest inventory turnover in comparison to all its competitors, they would be likely to invest in Dollarama as opposed to other dollar stores. Dollarama can turnover their inventory more times than its competitors, and also will have more cash readily available on hand.

Corporate Analysis 10
CURENT RATIO
The Current Ratio represents the company’s ability to pay off its short-term debts. A higher ratio means that the company is more capable of using its current assets to make payments on its current liabilities. During the fiscal period ended January 2017, Dollarama’s Current Ratio was 1.088. This is slightly lower than the industry norm of 1.91. This ratio may raise flags for short-term creditors, when they are considering issuing a loan, since Dollarama has $1.09 of current assets for every dollar of its current liabilities. The slightly low Current Ratio makes Dollarama a somewhat risky company to give loans to, as they may not be able to handle any additional liabilities that may be incurred.
ACID TEST (QUICK) RATIO
The Acid Test Ratio is the measurement of a company’s ability to pay off its current debts with its most liquid assets. Differentiating from the Current Ratio; this ratio does not include values like inventory, which makes this a more realistic value and measure of the company’s ability to pay off short term debt. Dollarama’s Acid Test Ratio for the fiscal period ended January 29, 2017 was -0.7424; as opposed to the industry norm which was 0.62. Dollarama is significantly lower than the industry norm; and in addition, are in the negative. This indicates that Dollarama may not capable of paying back all its short term creditors. In addition, because the Acid Test Ratio for Dollarama is much lower than its Current Ratio, it indicates that current assets highly dependent on inventory. Thus, short-term creditors may be hesitant to give Dollarama a loan because it is probable that they will not be paid back on schedule.
CONCLUSION
After calculating all these ratios of liquidity, we have concluded that Dollarama is not a good investment opportunity for short-term creditors. Analyzing all these ratios, we can see that Dollarama is not meeting the normal standards of the industry based on their Current Ratio and Acid Test Ratio. This means that Dollarama may not be financially stable enough to handle its short term liabilities. Being below the norm in each ratio, Dollarama’s short-term creditors should reconsider putting in more money into the business. Ratios such as the Current Ratio and Acid Test Ratio prove the fact that Dollarama does not have enough current assets to actively pay off its current liabilities. Thus, after all aspects are analyzed, we can conclude that Dollarama is not in the financial position to pay back all their short-term creditors.
Corporate Analysis 11
LONG-TERM CREDITORS
A long term creditor is a potential lender of funds to a company or business. In order to give credit to a business background checks are done to look at how well a business is doing. Analyzing a company’s financial report enables a potential creditor to see how efficiently a business can turn capital to a profit. Through the ratios outlined below creditors can decide if the business can stay profitable in the long run and be able to pay back the loan they will receive.
NUMBER OF TIMES INTEREST EARNED (TIE)
The Number of Times Interest Earned helps to understand how capable a company is at paying off its debts. It considers how a company can handle its upcoming interest payments, and whether it can afford the liabilities it currently has. Dollarama, for the fiscal period ended January 2017, was 3.67. This is a positive value for short-term creditors to look at considering that the industry norm was 3.54. Even though it’s only 0.13 higher, it’s still positive for creditors to see as it shows how efficient a company is at paying back its debts, and for Dollarama it seems decent.
DEBT TO EQUITY RATIO
Debt to Equity Ratio tells how much debt a company has per dollar of equity. A higher Debt to Equity Ratio shows that a company has more long-term liabilities, and that investing in such practices present a risk to creditors. Dollarama’s Debt to Equity Ratio for the fiscal period ended January 2017, was 17.58. The industry norm for Debt to Equity Ratio was 2.44. A ratio of 17.58 indicates that for every dollar of equity; the company has $17.58 of debt. Dollarama has an infinitely greater Debt to Equity Ratio than that of the industry norm, which is problematic for short-term creditors, as they company has about $18 for every dollar of equity they have.

Corporate Analysis 12
DEBT TO TOTAL ASSETS
Debt to Total Assets Ratio measures how much of a company’s assets are financed on debt. A higher Debt to Assets Ratio means the company has less legitimate assets to pay off loans. Dollarama’s Debt to Total Assets for the fiscal period ended January 2017 is displayed below:
Debt to Total Assets = 𝑆ℎ𝑜𝑟𝑡 𝑇𝑒𝑟𝑚 𝐷𝑒𝑏𝑡+𝐿𝑜𝑛𝑔 𝑇𝑒𝑟𝑚 𝐷𝑒𝑏𝑡
𝑇𝑜𝑡𝑎𝑙 𝐴𝑠𝑠𝑒𝑡𝑠
= 513,402,000+1,249,765,000
1,863,451,000
= 0.946
Dollarama has a debt to assets ratio of 0.95. This means that for every dollar in assets Dollarama has $0.95 in liabilities. Therefore, Dollarama is forced to rely on a large revenue to be able to meet future expenses and earn profits. Compared to the industry norm of 0.42 Dollarama is about double which is not very encouraging.
CONCLUSION
Based on all three of these ratios, we can conclude that Dollarama may not be the best company for long-term creditors to invest in. Two of these ratios give an indication that Dollarama is not a stable enough company to handle long-term liabilities. The Debt to Total Asset Ratio is not a positive value for long-term creditors because all Dollarama’s assets will be used to pay off its current liabilities. The Debt to Equity Ratio and Number of Times Interest Earned may cause creditors to overlook loaning Dollarama any money. This is because Dollarama has an incredible amount of liabilities that still have to be paid. Investing in Dollarama would be a risk for long-term creditors, even if their initial investment is guaranteed if the company was to liquidate. After our analysis of Dollarama, we would advise potential creditors to be cautious when loaning this company money.

Corporate Analysis 13
PART THREE – SUMMARY INFORMATION
SHOULD INVEST / SHOULDN’T INVEST
After analyzing Dollarama’s latest financial report and comparing it to the industry norm the conclusion to not invest in Dollarama has been made. We believe that Dollarama is a solid company which will be able to continue growing, but there were some concerning figures in the latest financial report. As the savvy investors we are, we would only invest in a company that has healthy financials. Understanding that every investment comes with a risk we will not put all our eggs into one basket. Dollarama, however, is an unsafe investment considering some negative figures it has.
Considering the financial ratios expresses throughout this report we are highly unmotivated to invest in Dollarama stock. One of the reasons for this is the retained earnings of $-342,957,000. Even more discouraging is the fact that Dollarama’s retained earnings seems to be on a decline as in 2016 it was only $-62,375,000. It is also important to point out that Dollarama has an Acid Test ratio of -0.74. Having a negative Acid Test ratio means that Dollarama’s current liabilities would not be able to pay off their current liabilities. So if sales were to decline Dollarama may be unable to make ends meet. It also must be said that from a shareholders point of view Dollarama is doing well. Their share value is on a constant rise and they meet or surpass the industry norm in about all the ratios outlined in the Shareholders Point of View section of this report.
Verdict: not recommended for short-term or long-term creditors, but being a shareholder is a safer bet.
Another important factor to keep in mind is that Dollarama is a business that focuses on selling cheap priced products perfect when unemployment is high and people do not have a lot of

Corporate Analysis 14
excess money. With the upcoming increase in minimum wage we are concerned that consumers will stop purchasing goods from Dollarama as they may be seen as inferior goods.
OVERALL OPINION
Dollarama is a well-positioned company focusing on selling products priced up to $4 with the goal of “providing value for the customer” as expressed the company's mission statement. We believe Dollarama does a great job at doing so. Dollarama’s stock value is on a constant rise, but the worrying values in their financial report causes us to worry about drop in the value of Dollarama. Even worse because of their poor finances, like the negative acid test ratio we fear that Dollarama would be unable to get out of a crisis if one were to occur in the near future. We will continue to be consumers, but not investors of Dollarama.
PART FOUR – WORKS CITED
http://www.dollarama.com/financial-information/financial-reports/
http://www.dollarama.com/financial-information/
http://www.dollarama.com/wp-content/uploads/2017/04/2017-Annual-Information-Form-vFinal-
EN.pdf
http://www.dollarama.com/wp-content/uploads/2017/03/4th-Quarter-Financial-Statements.pdf
http://www.dollartreeinfo.com/investors/financial/annuals/
http://www.dollarama.com/about_us/our_history/
http://www.dollarama.com/wp-content/uploads/2012/06/0458_001_en.pdf

Corporate Analysis 15

Corporate Analysis 16

Corporate Analysis 17

Corporate Analysis 18

Corporate Analysis 19
Corporate AnalysisBy: Johnathan & Brian

Company Overview
Canadian dollar store retailer first opened on April 1992
Dollarama began and continues to be a company that is committed to offering products at compelling prices without compromising safety or quality
Canada now has more than 1000 locations throughout Canada
Dollarama went public in 2009 and since then its shares have been traded in the Toronto Stock Exchange under the ticker “DOL”

Role of a Shareholder
➔A shareholder is someone who owns at least one share of a company
➔Before buying shares of a company shareholders should look at how the company is doing to know if the company’s share will increase or decrease
➔As a current shareholder you also want to know a company is doing to know if they should sell the shares they have, buy more, or just keep the ones they have

Shareholders Point of View
Some significant ratios that interest shareholders include:
Earnings Per Share (EPS): Dollarama $3.75, Industry Norm $1.32
Return on Assets (ROA): Dollarama 34.08, Industry Norm 20.97
Return on Common Shareholder’s Equity (ROE): Dollarama 165.5%, Industry Norm 16.9%
Current Shareholders can be content by Dollarama’s performance in the latest fiscal period

Short-Term Creditors
➔A short-term is a potential loaner of money to a business to be paid back in the short-term (usually one year or less)
● Some important financial ratios that would interest potential short-term creditors include:
○ Working Capital: Dollarama $45,663,000, Industry Norm $1,832,100,000
○ Current Ratio: Dollarama 1.088, Industry Norm 1.91
○ Acid Test (Quick) Ratio: Dollarama -0.74, Industry Norm 0.62
Short-term creditors will be disappointed because Dollarama is not meeting Industry Norms
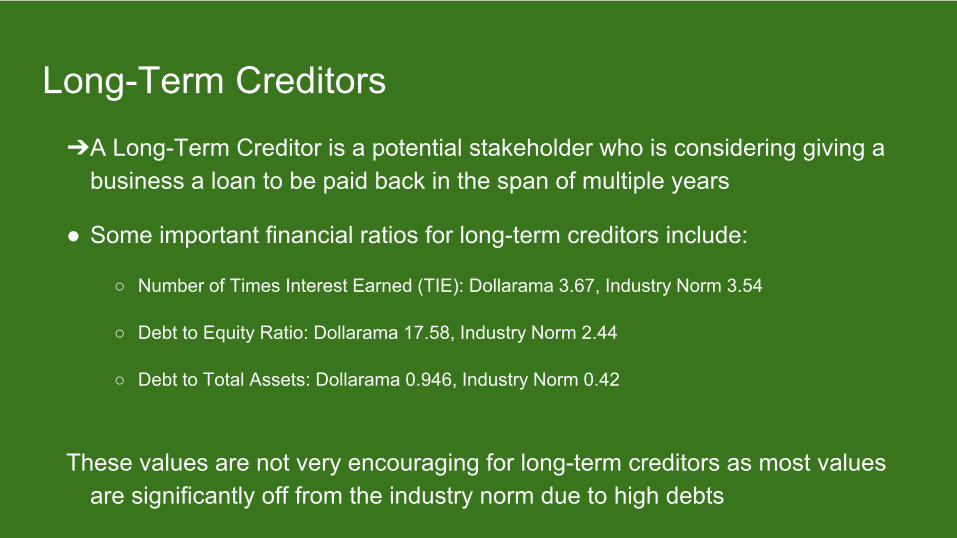
Long-Term Creditors
➔A Long-Term Creditor is a potential stakeholder who is considering giving a business a loan to be paid back in the span of multiple years
● Some important financial ratios for long-term creditors include:
○ Number of Times Interest Earned (TIE): Dollarama 3.67, Industry Norm 3.54
○ Debt to Equity Ratio: Dollarama 17.58, Industry Norm 2.44
○ Debt to Total Assets: Dollarama 0.946, Industry Norm 0.42
These values are not very encouraging for long-term creditors as most values are significantly off from the industry norm due to high debts
Should Invest or Shouldn’t Invest
For current shareholders, the values reflected from the financial ratios are quickly motivating, but when looking at other ratios a fear can come from the $-342,957,000 in retained earnings
As potential creditors, the values are not very motivating, especially due to values like -0.74 in the Acid Test Ratio
Creditors may worry that Dollarama won’t be able to pay off any new loans as they already have significant debt


Overall Opinion
Dollarama is a well-established and positioned company in the dollar store industry
They live up to core values; such as, providing customers with safe and affordable products while also providing excellent conditions for workers and franchisees
In the future, we will be customers, but not creditors for Dollarama


