Chapter 17 Company Analysis. Define fundamental analysis at the company level. Explain the...
52
Chapter Chapter 17 17 Company Analysis Company Analysis
-
date post
22-Dec-2015 -
Category
Documents
-
view
225 -
download
5
Transcript of Chapter 17 Company Analysis. Define fundamental analysis at the company level. Explain the...
Chapter 17Chapter 17
Company AnalysisCompany Analysis
• Define fundamental analysis at the company level.
• Explain the accounting aspects of a company’s earnings.
• Describe the importance of EPS forecasts.• Estimate the P/E ratio of a company.• Use the beta coefficient to estimate the risk of
a stock.
Learning ObjectivesLearning Objectives
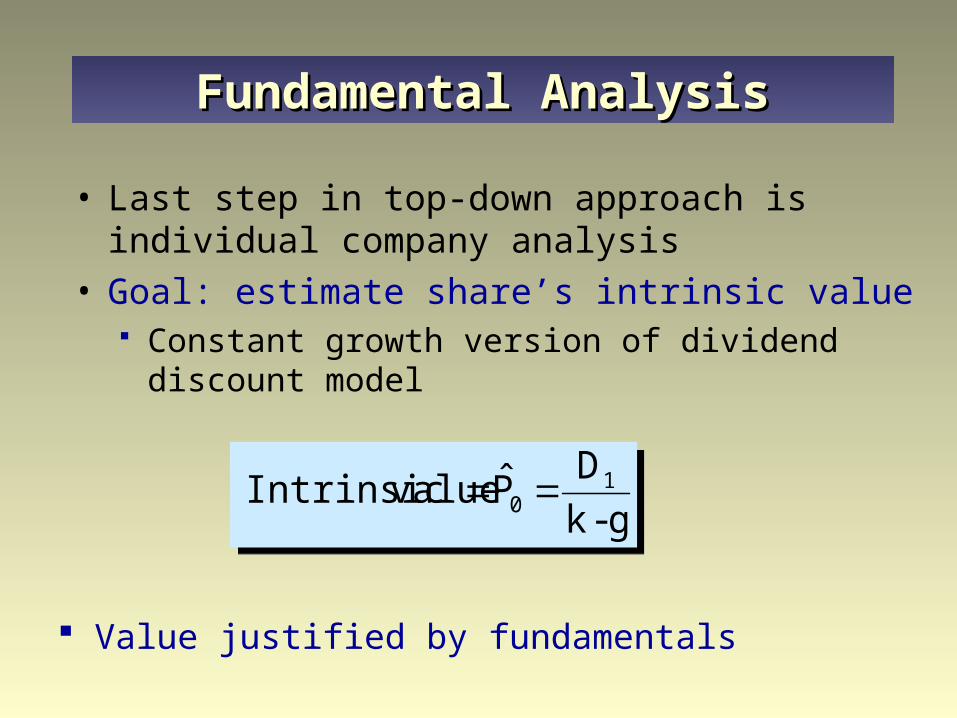
• Last step in top-down approach is individual company analysis
• Goal: estimate share’s intrinsic value Constant growth version of dividend discount
model
g-k
DP̂ valueIntrinsic 1
0 g-k
DP̂ valueIntrinsic 1
0
Value justified by fundamentals
Fundamental AnalysisFundamental Analysis
Multiple Growth RateMultiple Growth Rate
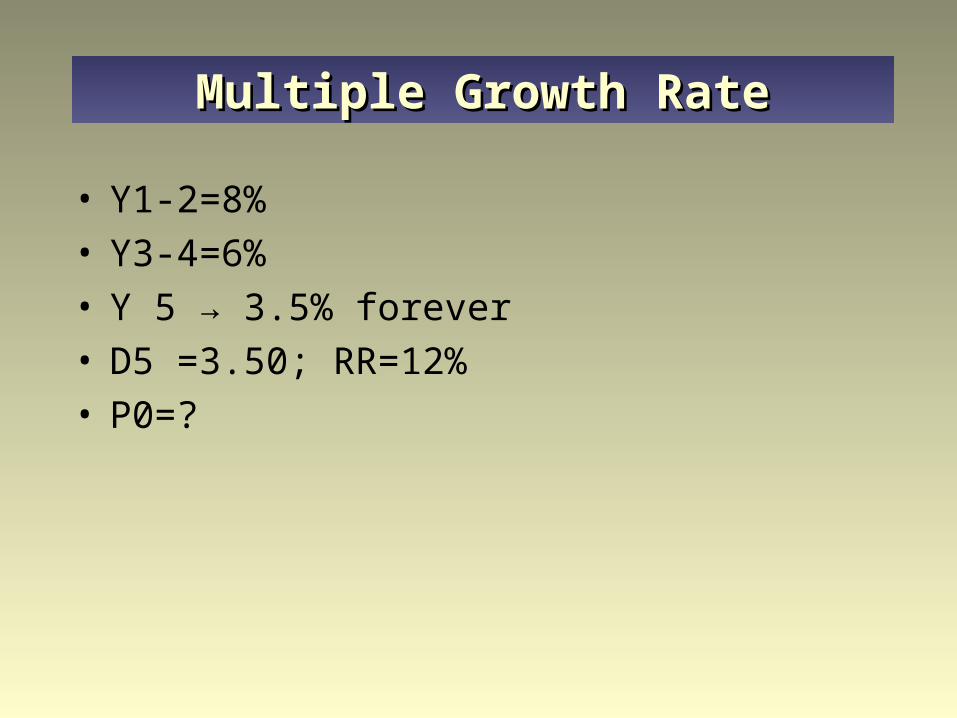
• Y1-2=8%• Y3-4=6%• Y 5 → 3.5% forever• D5 =3.50; RR=12%• P0=?

• Earnings multiple could also be usedP0 = estimated EPS justified P/E ratio
• Stock is under- (over-) valued if intrinsic value is larger (smaller) than current market price
• Focus on earnings and P/E ratio Dividends paid from earnings Close correlation between earnings and stock
price changes
Fundamental AnalysisFundamental Analysis
• How is EPS derived and what does EPS represent?
• Financial statements provide majority of financial information about firms
• Analysis implies comparison over time or with other firms in the same industry
• Focus on how statements used, not made
Accounting Aspects of EarningsAccounting Aspects of Earnings
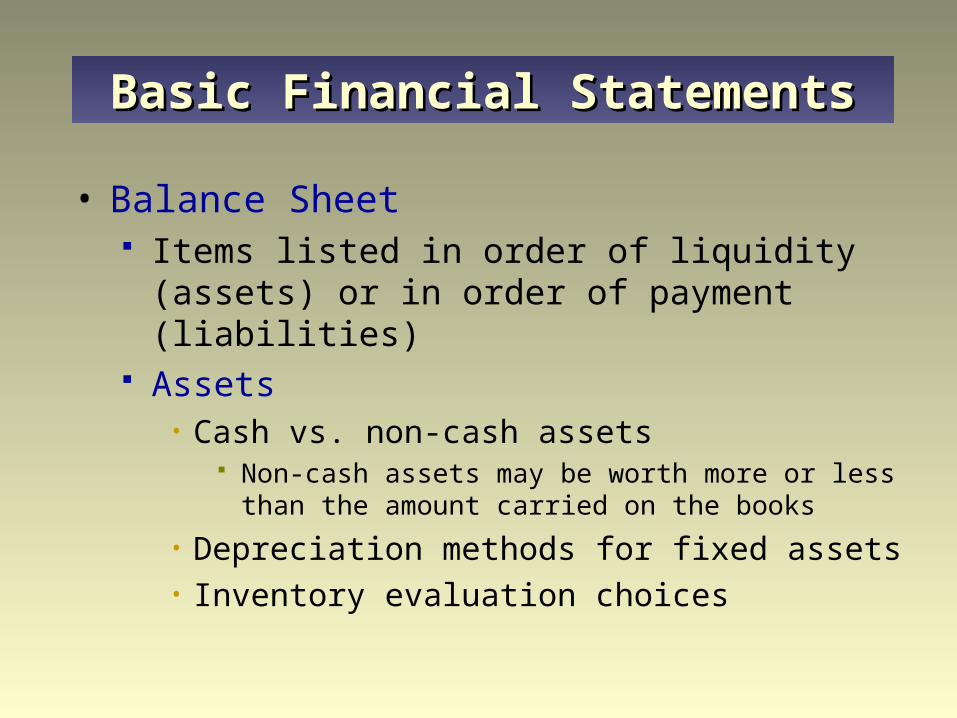
• Balance Sheet Items listed in order of liquidity (assets) or in
order of payment (liabilities) Assets
• Cash vs. non-cash assets Non-cash assets may be worth more or less than the
amount carried on the books
• Depreciation methods for fixed assets• Inventory evaluation choices
Basic Financial StatementsBasic Financial Statements

• Balance Sheet Liabilities
• Fixed claims against the firm Equity
• Residual claims• Adjusts when the value of assets change• Linked to Income Statement
“Snapshot” at one point in time
Basic Financial StatementsBasic Financial Statements
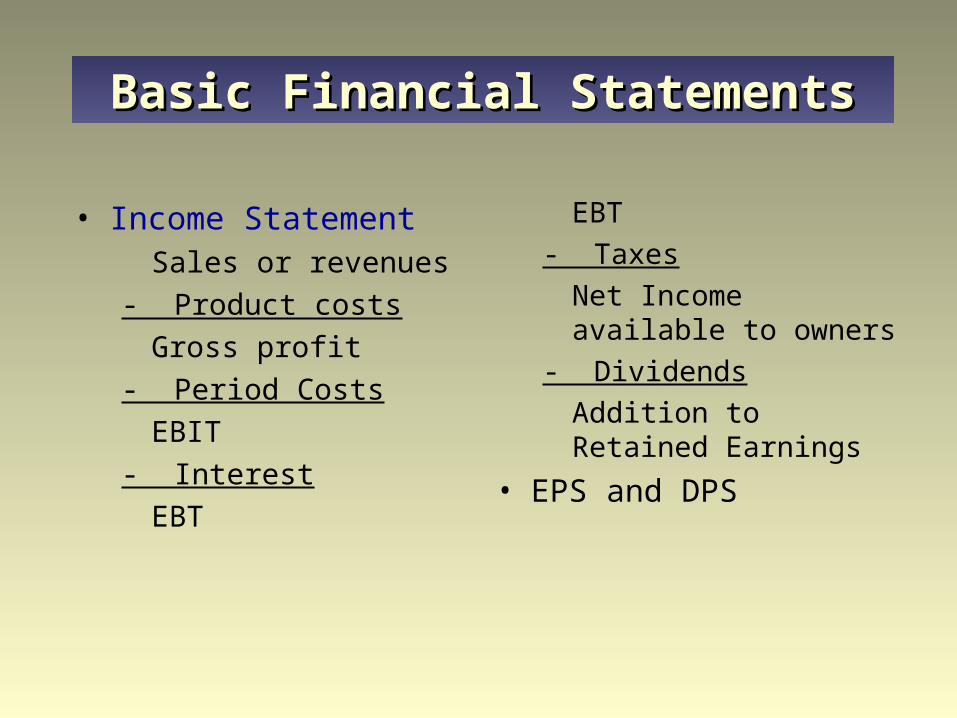
• Income StatementSales or revenues
- Product costs
Gross profit
- Period Costs
EBIT
- Interest
EBT
EBT
- Taxes
Net Income available to owners
- Dividends
Addition to Retained Earnings
• EPS and DPS
Basic Financial StatementsBasic Financial Statements

• Earnings per share
EPS = Net Income/average number of shares outstanding Net Income before adjustments in accounting
treatment or one-time events
• Certifying statements Auditors do not guarantee the accuracy of
earnings, but only that statements are a fair financial representation
Basic Financial StatementsBasic Financial Statements
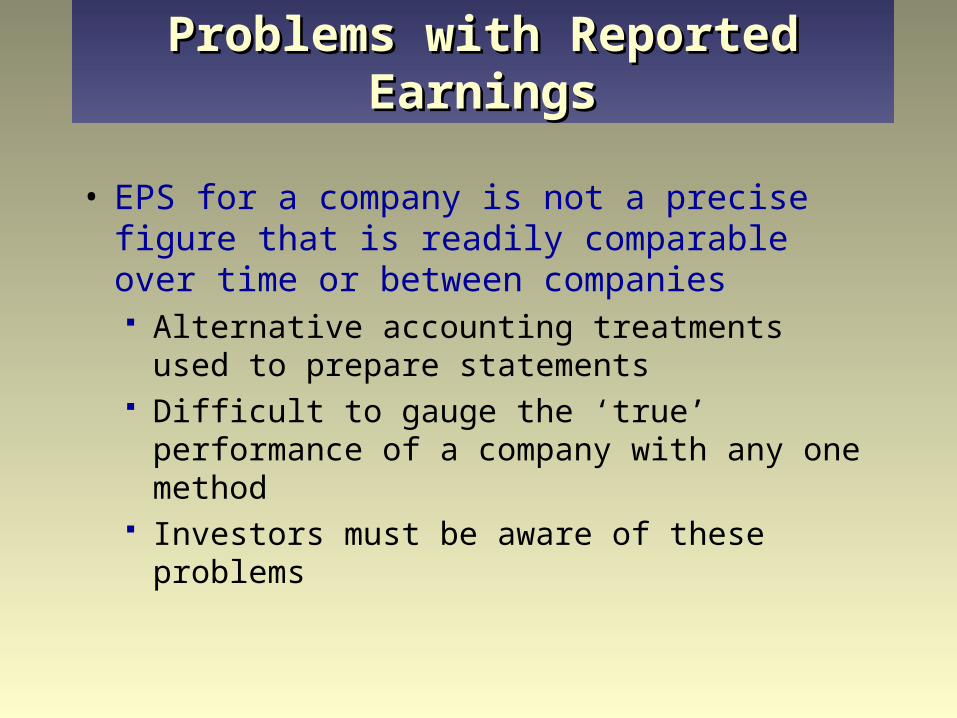
• EPS for a company is not a precise figure that is readily comparable over time or between companies Alternative accounting treatments used to
prepare statements Difficult to gauge the ‘true’ performance of a
company with any one method Investors must be aware of these problems
Problems with Reported EarningsProblems with Reported Earnings

• Important to determine whether a company’s profitability is increasing or decreasing and why
• Return on equity (ROE) emphasized because it is a key component in finding earnings and dividend growth
EPS = ROE Book value per share
Analyzing a Company’s Analyzing a Company’s ProfitabilityProfitability

• Share prices depend partly on ROE• Management can influence ROE• Decomposing ROE into its components
allows analysts to identify adverse impacts on ROE and to predict future trends
• Highlights expense control, asset utilization, and debt utilization
DuPont AnalysisDuPont Analysis
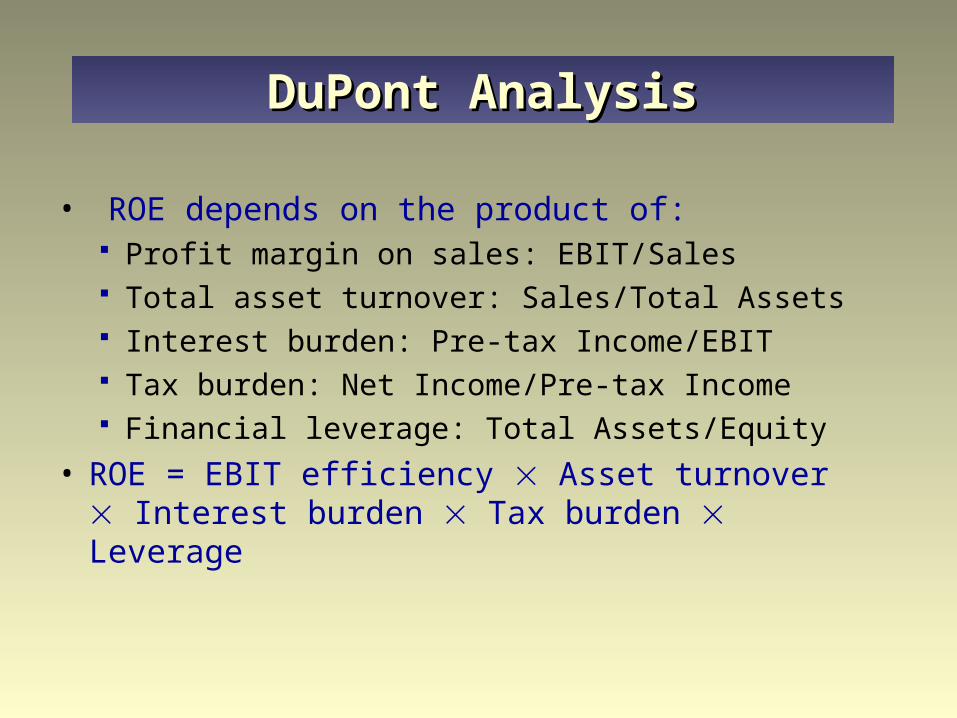
• ROE depends on the product of: Profit margin on sales: EBIT/Sales Total asset turnover: Sales/Total Assets Interest burden: Pre-tax Income/EBIT Tax burden: Net Income/Pre-tax Income Financial leverage: Total Assets/Equity
• ROE = EBIT efficiency Asset turnover Interest burden Tax burden Leverage
DuPont AnalysisDuPont Analysis

• Expected EPS is of the most value• Stock price is a function of future earnings and
the P/E ratio Investors estimate expected growth in dividends
or earnings by using quarterly and annual EPS forecasts
• Estimating internal growth rate EPS1 = EPS0(1+g)
Obtaining Estimates of EarningsObtaining Estimates of Earnings
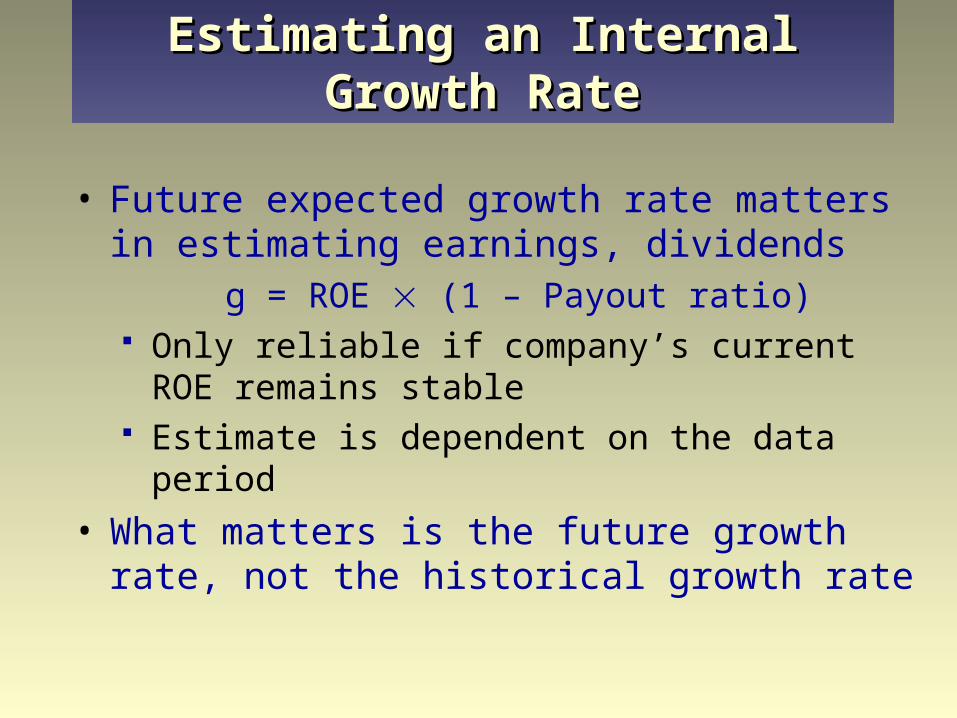
• Future expected growth rate matters in estimating earnings, dividends
g = ROE (1 – Payout ratio) Only reliable if company’s current ROE remains
stable Estimate is dependent on the data period
• What matters is the future growth rate, not the historical growth rate
Estimating an Internal Growth RateEstimating an Internal Growth Rate

• Security analysts’ forecasts of earnings Consensus forecast superior to individual
• Time series forecast Use historical data to make earnings forecasts
• Evidence favours analysts over statistical models in predicting what actual reported earnings will be Analysts are still frequently wrong
Forecasts of EPSForecasts of EPS

• What is the role of expectations in selecting stocks? Old information will be incorporated into stock
prices if market is efficient Unexpected information implies revision
• Stock prices affected by Level and growth in earnings Market’s expectation of earnings
Earnings SurprisesEarnings Surprises
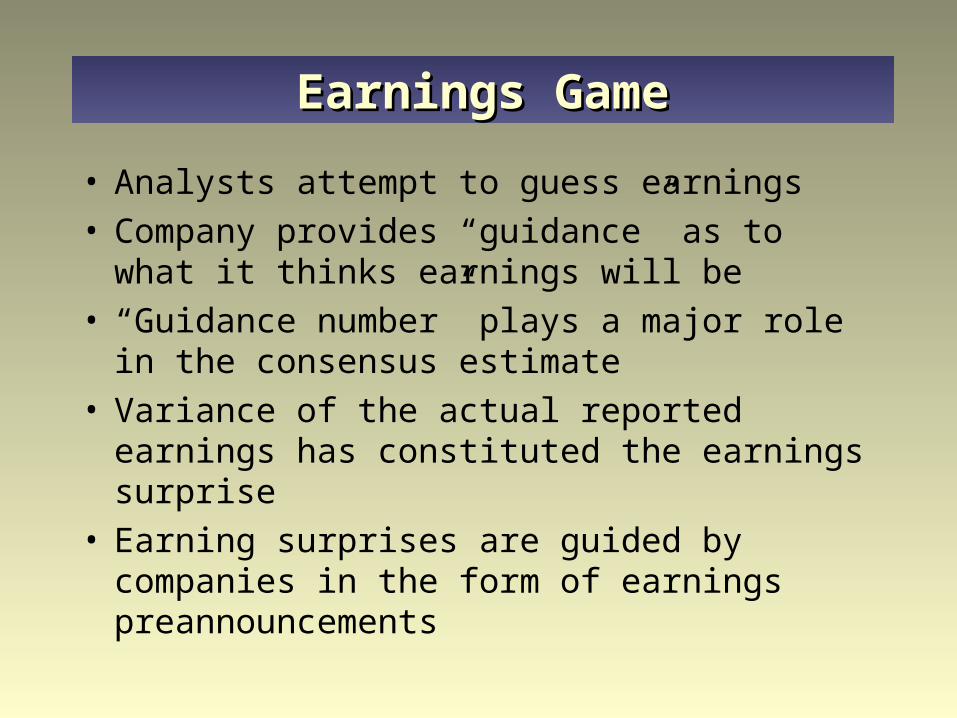
• Analysts attempt to guess earnings• Company provides “guidance” as to what it
thinks earnings will be• “Guidance number” plays a major role in the
consensus estimate• Variance of the actual reported earnings has
constituted the earnings surprise• Earning surprises are guided by companies in
the form of earnings preannouncements
Earnings GameEarnings Game
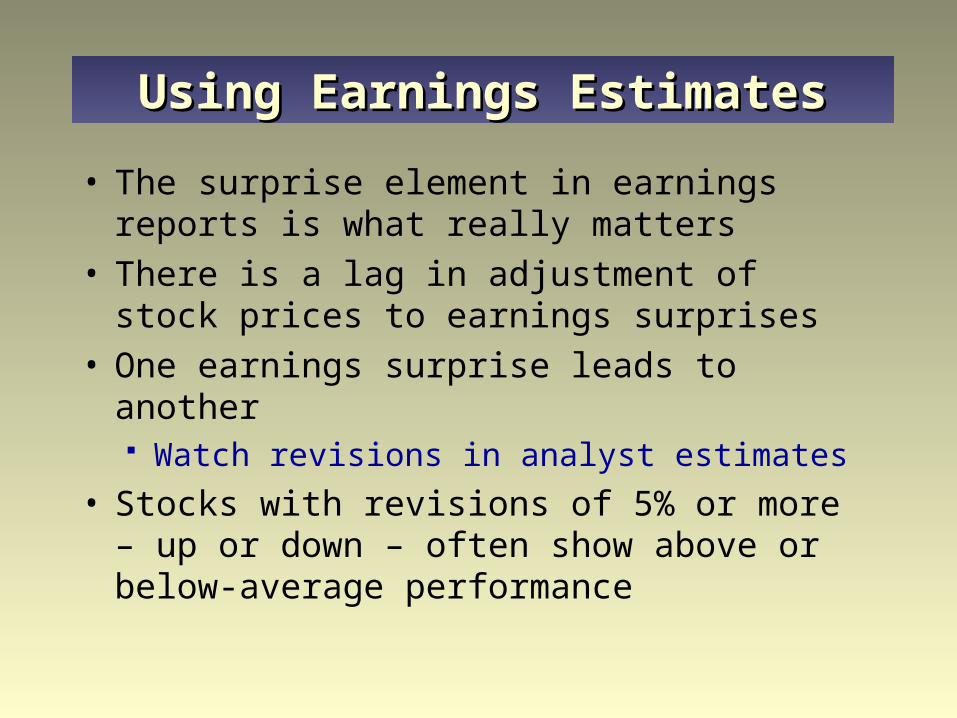
• The surprise element in earnings reports is what really matters
• There is a lag in adjustment of stock prices to earnings surprises
• One earnings surprise leads to another Watch revisions in analyst estimates
• Stocks with revisions of 5% or more – up or down – often show above or below-average performance
Using Earnings EstimatesUsing Earnings Estimates

• Measures how much investors currently are willing to pay per dollar of earnings Summary evaluation of firm’s prospects A relative price measure of a stock
• A function of expected dividend payout ratio, required rate of return, expected growth rate in dividends
g)k/()/E(DP/E 11 g)k/()/E(DP/E 11
The P/E RatioThe P/E Ratio

• Dividend levels usually maintained Decreased only if no other alternative Not increased unless it can be supported Adjust with a lag to earnings
• In theory, the higher the expected payout ratio, the higher the P/E ratio However, growth rate will probably decline,
adversely affecting the P/E ratio
Dividend Payout RatioDividend Payout Ratio
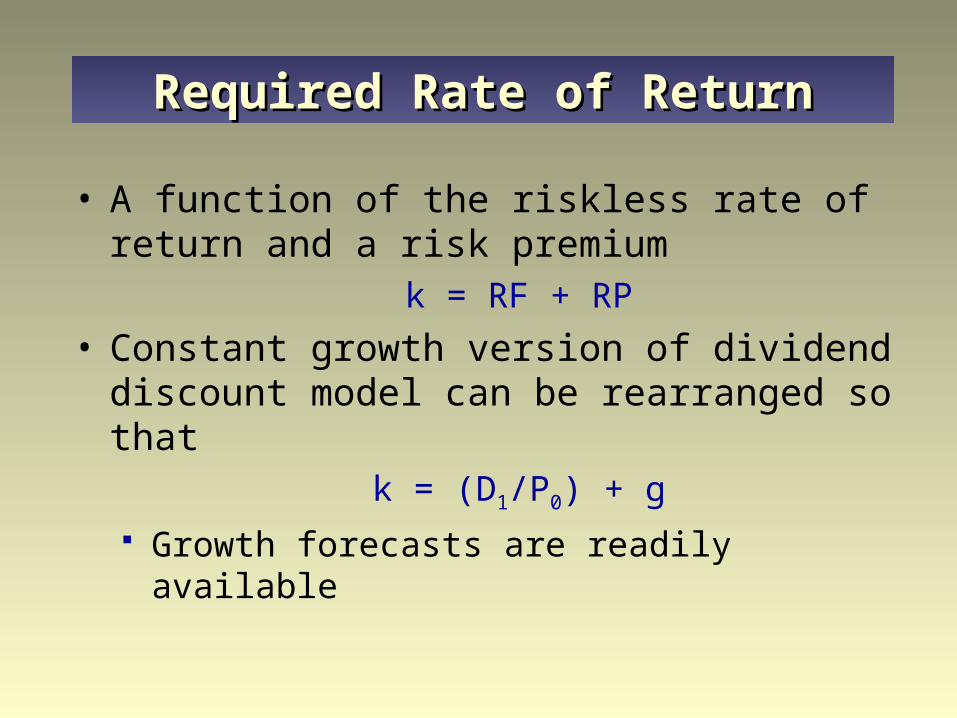
• A function of the riskless rate of return and a risk premium
k = RF + RP
• Constant growth version of dividend discount model can be rearranged so that
k = (D1/P0) + g Growth forecasts are readily available
Required Rate of ReturnRequired Rate of Return
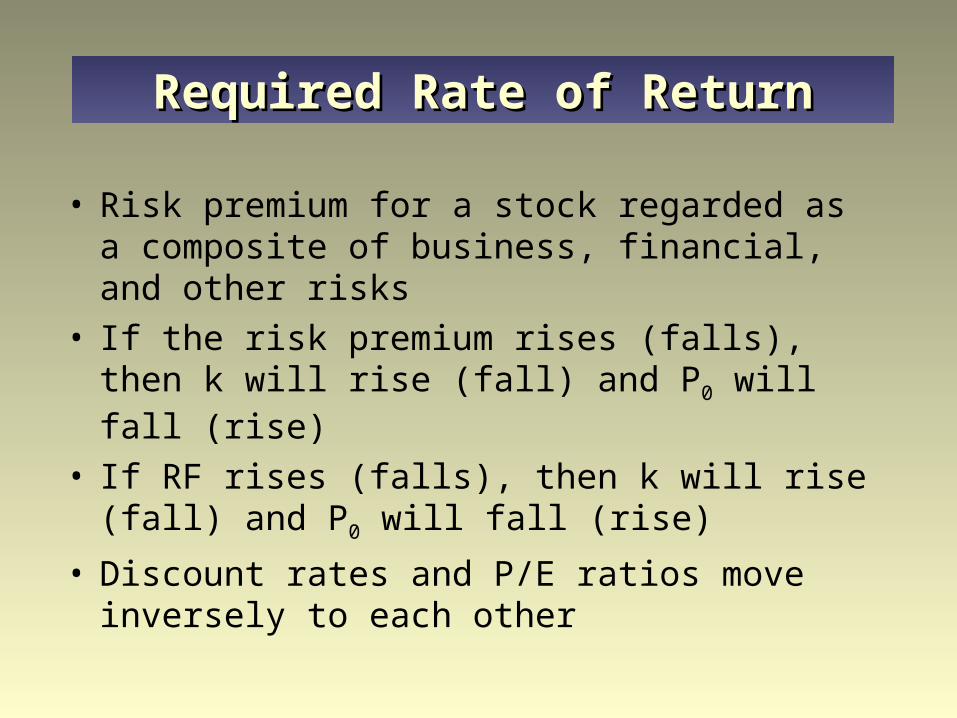
• Risk premium for a stock regarded as a composite of business, financial, and other risks
• If the risk premium rises (falls), then k will rise (fall) and P0 will fall (rise)
• If RF rises (falls), then k will rise (fall) and P0 will fall (rise)
• Discount rates and P/E ratios move inversely to each other
Required Rate of ReturnRequired Rate of Return
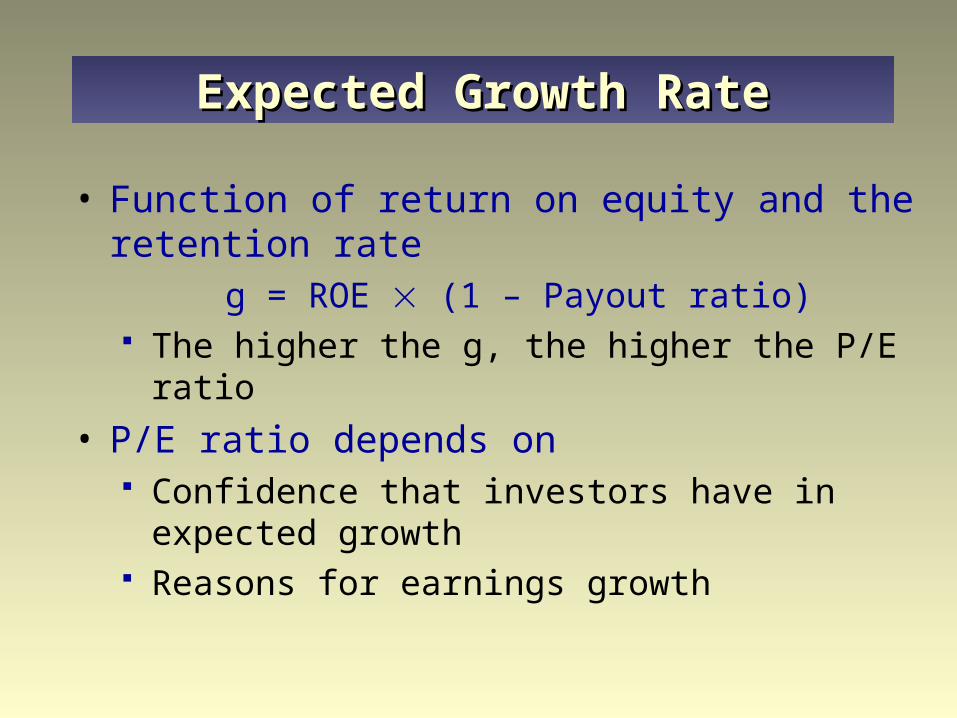
• Function of return on equity and the retention rate
g = ROE (1 – Payout ratio) The higher the g, the higher the P/E ratio
• P/E ratio depends on Confidence that investors have in expected
growth Reasons for earnings growth
Expected Growth RateExpected Growth Rate
• Regardless of detail and complexity, analysts and investors seek an estimate of earnings and a justified P/E ratio to determine intrinsic value
• Security analysis always involves predicting an uncertain future; mistakes will be made and outlooks will differ
Fundamental Security Analysis in Fundamental Security Analysis in PracticePractice
Appendix 17-A Financial Ratio AnalysisAppendix 17-A Financial Ratio Analysis
• Used to examine a firm’s financial performance• A ratio on its own has limited value – to be
useful, one must examine: Trends Ratios of comparable firms or industry
benchmarks
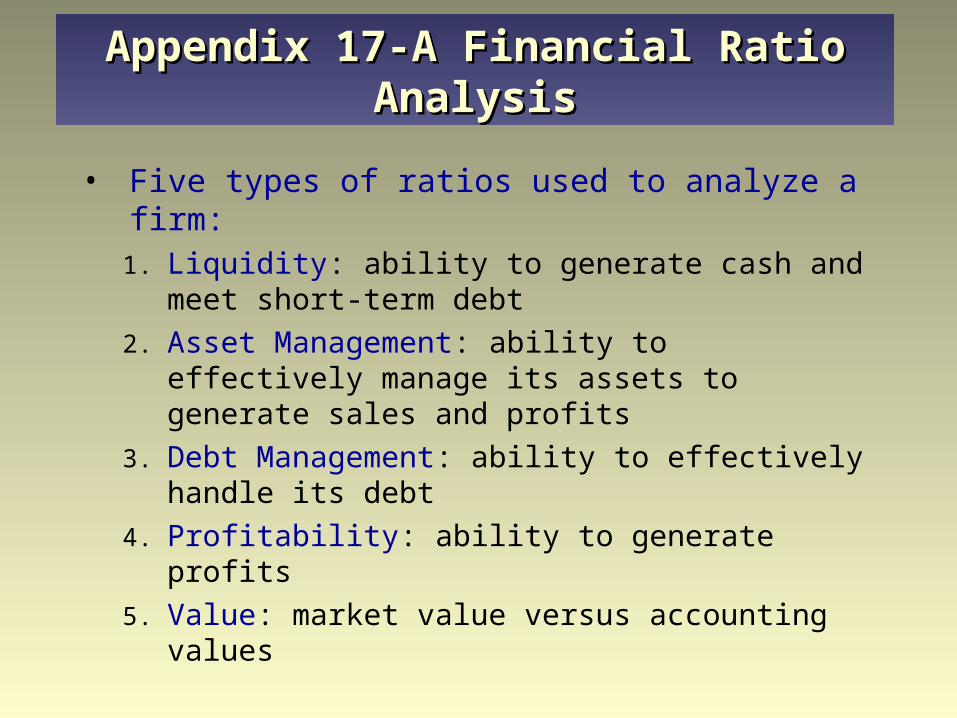
• Five types of ratios used to analyze a firm:1. Liquidity: ability to generate cash and meet
short-term debt
2. Asset Management: ability to effectively manage its assets to generate sales and profits
3. Debt Management: ability to effectively handle its debt
4. Profitability: ability to generate profits
5. Value: market value versus accounting values
Appendix 17-A Financial Ratio AnalysisAppendix 17-A Financial Ratio Analysis
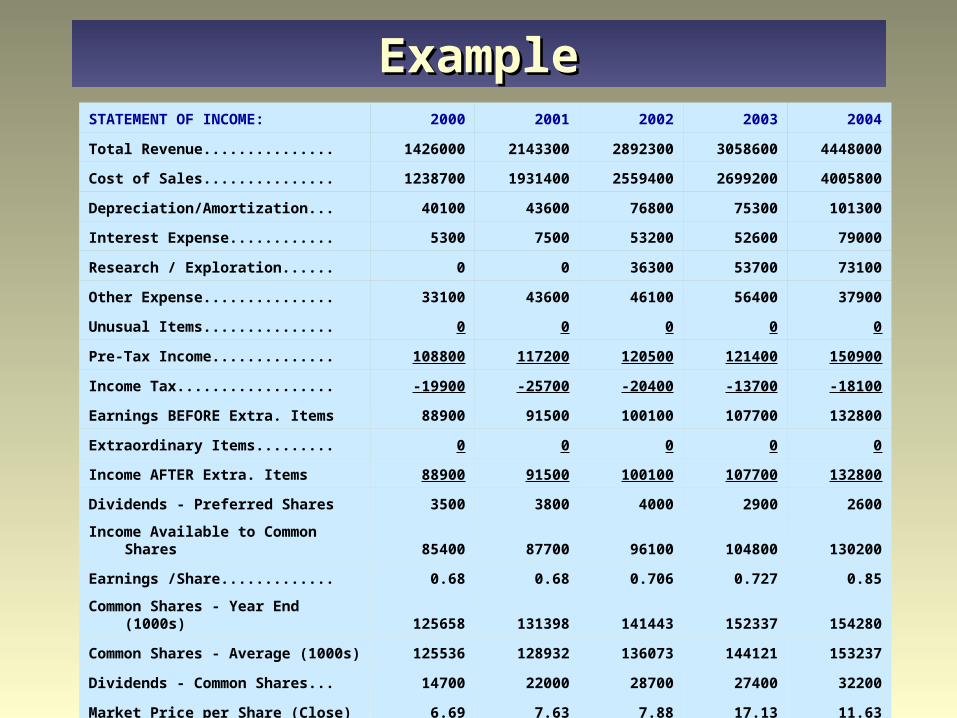
STATEMENT OF INCOME: 2000 2001 2002 2003 2004
Total Revenue............... 1426000 2143300 2892300 3058600 4448000
Cost of Sales............... 1238700 1931400 2559400 2699200 4005800
Depreciation/Amortization... 40100 43600 76800 75300 101300
Interest Expense............ 5300 7500 53200 52600 79000
Research / Exploration...... 0 0 36300 53700 73100
Other Expense............... 33100 43600 46100 56400 37900
Unusual Items............... 0 0 0 0 0
Pre-Tax Income.............. 108800 117200 120500 121400 150900
Income Tax.................. -19900 -25700 -20400 -13700 -18100
Earnings BEFORE Extra. Items 88900 91500 100100 107700 132800
Extraordinary Items......... 0 0 0 0 0
Income AFTER Extra. Items 88900 91500 100100 107700 132800
Dividends - Preferred Shares 3500 3800 4000 2900 2600
Income Available to Common Shares 85400 87700 96100 104800 130200
Earnings /Share............. 0.68 0.68 0.706 0.727 0.85
Common Shares - Year End (1000s) 125658 131398 141443 152337 154280
Common Shares - Average (1000s) 125536 128932 136073 144121 153237
Dividends - Common Shares... 14700 22000 28700 27400 32200
Market Price per Share (Close) 6.69 7.63 7.88 17.13 11.63
ExampleExample
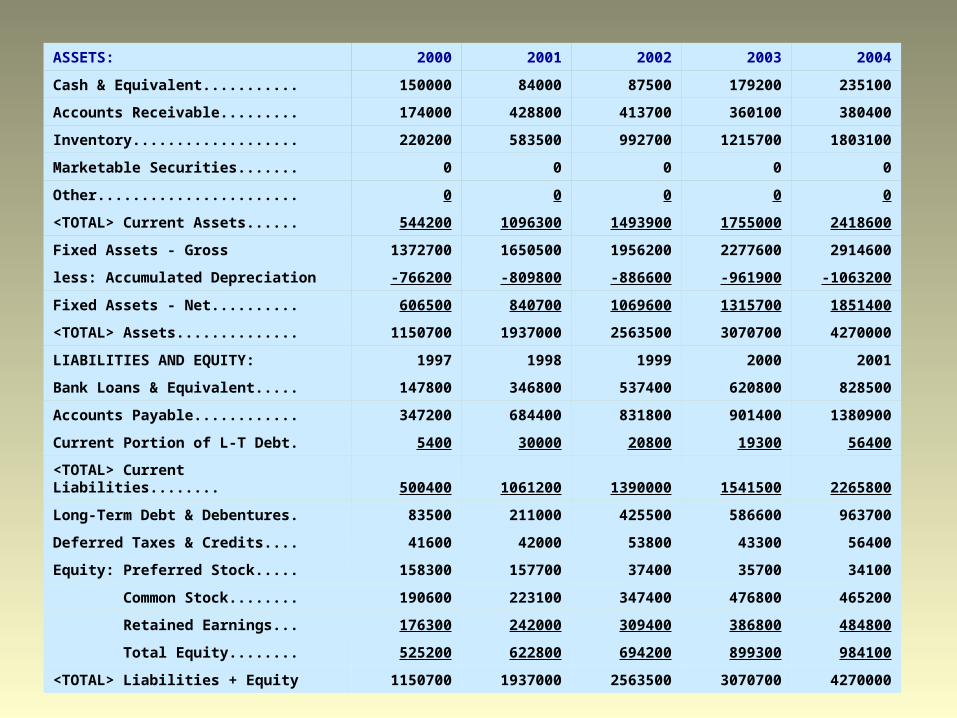
ASSETS: 2000 2001 2002 2003 2004
Cash & Equivalent........... 150000 84000 87500 179200 235100
Accounts Receivable......... 174000 428800 413700 360100 380400
Inventory................... 220200 583500 992700 1215700 1803100
Marketable Securities....... 0 0 0 0 0
Other....................... 0 0 0 0 0
<TOTAL> Current Assets...... 544200 1096300 1493900 1755000 2418600
Fixed Assets - Gross 1372700 1650500 1956200 2277600 2914600
less: Accumulated Depreciation -766200 -809800 -886600 -961900 -1063200
Fixed Assets - Net.......... 606500 840700 1069600 1315700 1851400
<TOTAL> Assets.............. 1150700 1937000 2563500 3070700 4270000
LIABILITIES AND EQUITY: 1997 1998 1999 2000 2001
Bank Loans & Equivalent..... 147800 346800 537400 620800 828500
Accounts Payable............ 347200 684400 831800 901400 1380900
Current Portion of L-T Debt. 5400 30000 20800 19300 56400
<TOTAL> Current Liabilities........ 500400 1061200 1390000 1541500 2265800
Long-Term Debt & Debentures. 83500 211000 425500 586600 963700
Deferred Taxes & Credits.... 41600 42000 53800 43300 56400
Equity: Preferred Stock..... 158300 157700 37400 35700 34100
Common Stock........ 190600 223100 347400 476800 465200
Retained Earnings... 176300 242000 309400 386800 484800
Total Equity........ 525200 622800 694200 899300 984100
<TOTAL> Liabilities + Equity 1150700 1937000 2563500 3070700 4270000

XYZ COMPANY
FINANCIAL RATIOS: 2000 2001 2002 2003 2004
Current Ratio 1.09 1.03 1.07 1.14 1.07
Acid Test (Quick) Ratio 0.65 0.48 0.36 0.35 0.27
ACP (days) 44.54 73.02 52.21 42.97 31.22
Inventory Turnover 5.62 3.31 2.58 2.22 2.22
Total Asset Turnover 1.24 1.11 1.13 1.00 1.04
Debt Ratio 0.51 0.66 0.71 0.69 0.76
Debt-to-Equity Ratio 1.11 2.04 2.62 2.37 3.28
Equity Multiplier 2.19 3.11 3.69 3.41 4.34
TIE (or Interest Coverage) 21.53 16.63 3.27 3.31 2.91
Net Income Margin 6.23% 4.27% 3.46% 3.52% 2.99%
Return on Assets (ROA) 7.73% 4.72% 3.90% 3.51% 3.11%
Return on Equity (ROE) 16.93% 14.69% 14.42% 11.98% 13.49%
P/E Ratio 9.84 11.21 11.15 23.56 13.68
M/B Ratio 2.29 2.15 1.70 3.02 1.89
Dividend Yield 1.75% 2.24% 2.68% 1.11% 1.81%
Dividend Payout Ratio 0.17 0.25 0.30 0.26 0.25

INDUSTRY AVERAGES
FINANCIAL RATIOS: 2000 2001 2002 2003 2004
Current Ratio 2.12 2.85 2.25 2.01 1.69
Acid Test (Quick) Ratio 1.21 1.97 1.36 1.24 1.09
ACP (days) 35.20 34.09 44.50 45.90 46.90
Inventory Turnover 7.78 8.20 7.68 8.52 8.16
Total Asset Turnover 1.78 1.43 1.37 1.26 1.23
Debt Ratio 0.23 0.33 0.32 0.29 0.32
Debt-to-Equity Ratio 0.36 0.61 0.56 0.49 0.55
Equity Multiplier 1.57 1.82 1.78 1.70 1.74
TIE (or Interest Coverage) 34.41 42.19 5.95 5.53 8.61
Net Income Margin 8.47% 6.03% 4.34% 4.19% 5.68%
Return on Assets (ROA) 15.08% 8.64% 5.95% 5.27% 7.01%
Return on Equity (ROE) 23.68% 15.72% 10.59% 8.96% 12.20%
P/E Ratio 6.42 9.08 12.13 22.38 15.53
M/B Ratio 1.51 1.42 1.28 2.00 1.88
Dividend Yield 1.71% 1.73% 2.86% 2.67% 2.08%
Dividend Payout Ratio 0.13 0.24 0.35 0.39 0.26
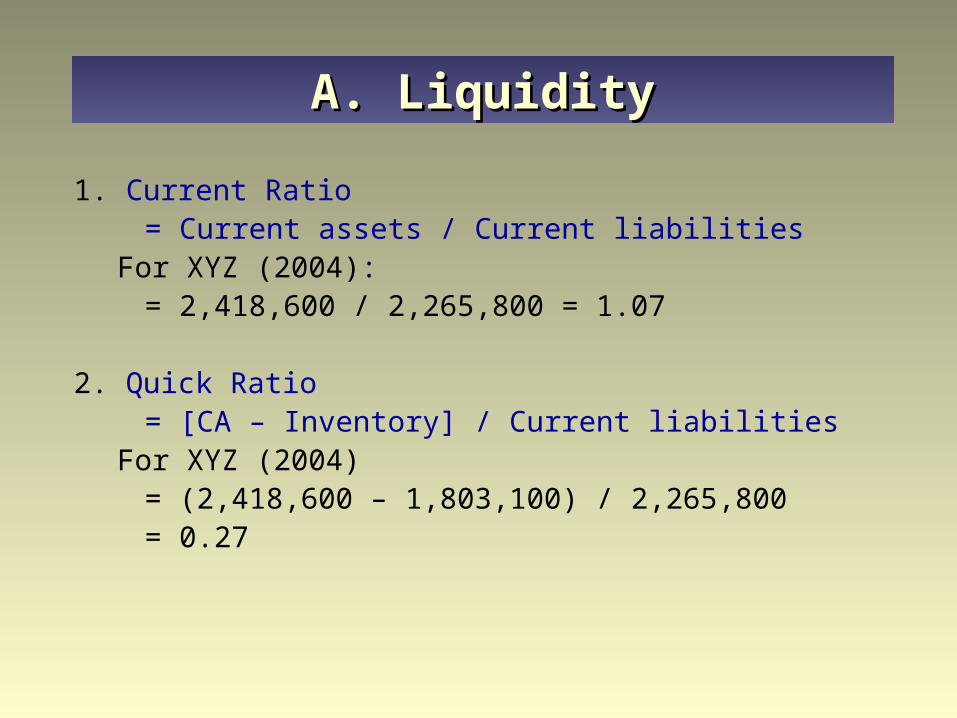
A. LiquidityA. Liquidity
1. Current Ratio = Current assets / Current liabilities
For XYZ (2004):= 2,418,600 / 2,265,800 = 1.07
2. Quick Ratio = [CA – Inventory] / Current liabilities
For XYZ (2004)= (2,418,600 – 1,803,100) / 2,265,800= 0.27

B. Asset ManagementB. Asset Management
3. Average Collection Period (ACP) = Account Receivable / (Sales/365days)
For XYZ (2004):
= 380,400 / (4,448,000/365) = 31.22 days
Note:
A/R Turnover = Sales / Acct Receivable
= 365 / ACP
For XYZ (2004) = 365/31.22 days = 11.69 times
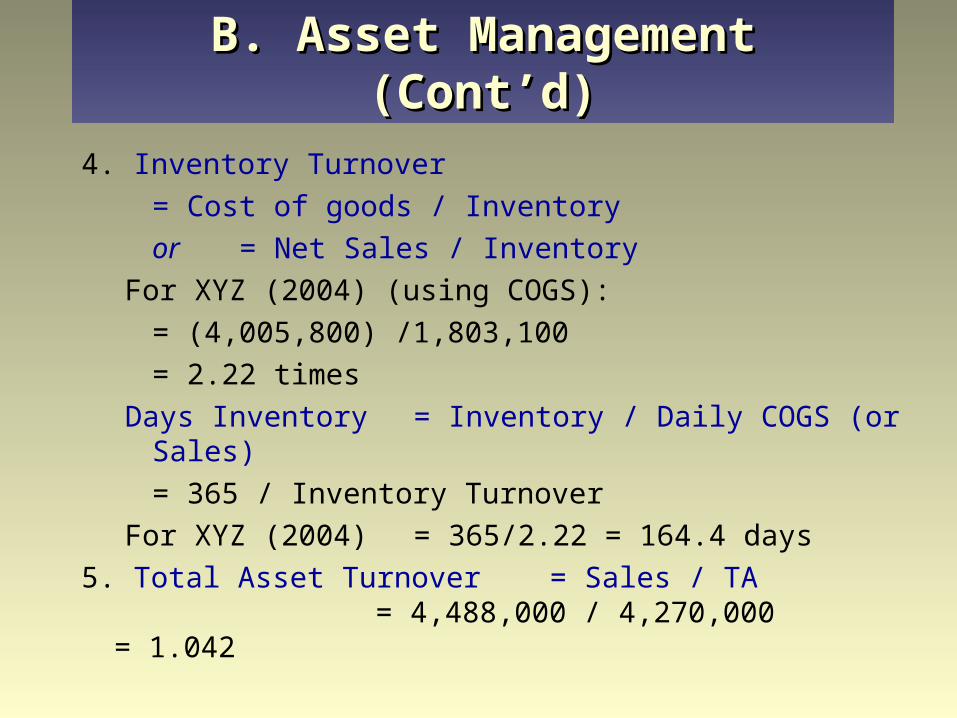
B. Asset Management (Cont’d)B. Asset Management (Cont’d)
4. Inventory Turnover
= Cost of goods / Inventory
or = Net Sales / Inventory
For XYZ (2004) (using COGS):
= (4,005,800) /1,803,100
= 2.22 times
Days Inventory = Inventory / Daily COGS (or Sales)
= 365 / Inventory Turnover
For XYZ (2004) = 365/2.22 = 164.4 days
5. Total Asset Turnover = Sales / TA = 4,488,000 / 4,270,000
= 1.042
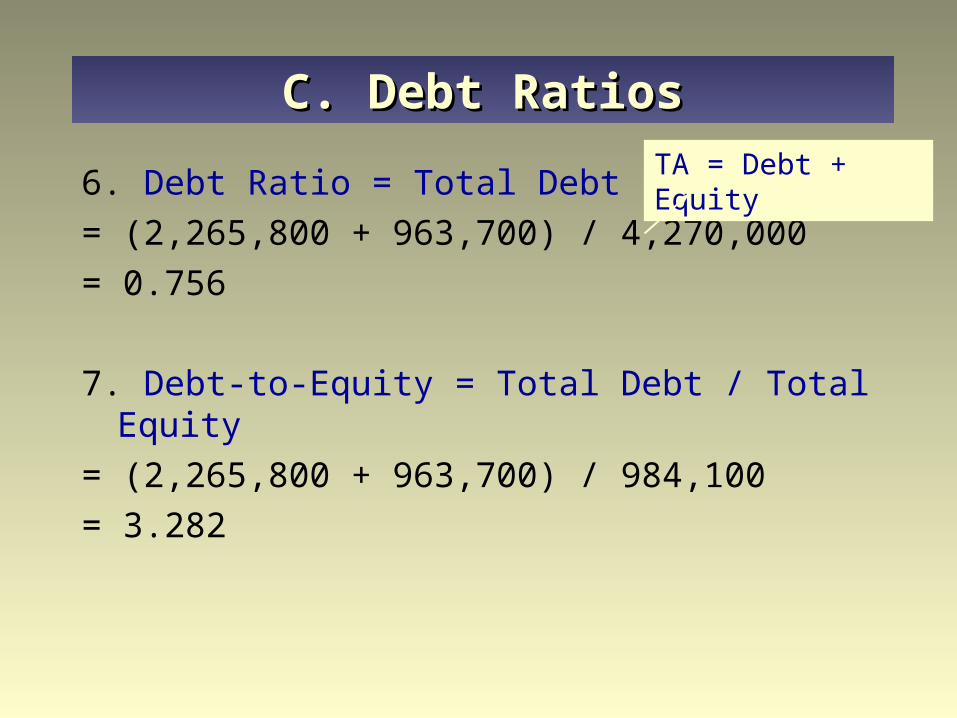
C. Debt RatiosC. Debt Ratios
6. Debt Ratio = Total Debt / TA
= (2,265,800 + 963,700) / 4,270,000
= 0.756
7. Debt-to-Equity = Total Debt / Total Equity
= (2,265,800 + 963,700) / 984,100
= 3.282
TA = Debt + Equity
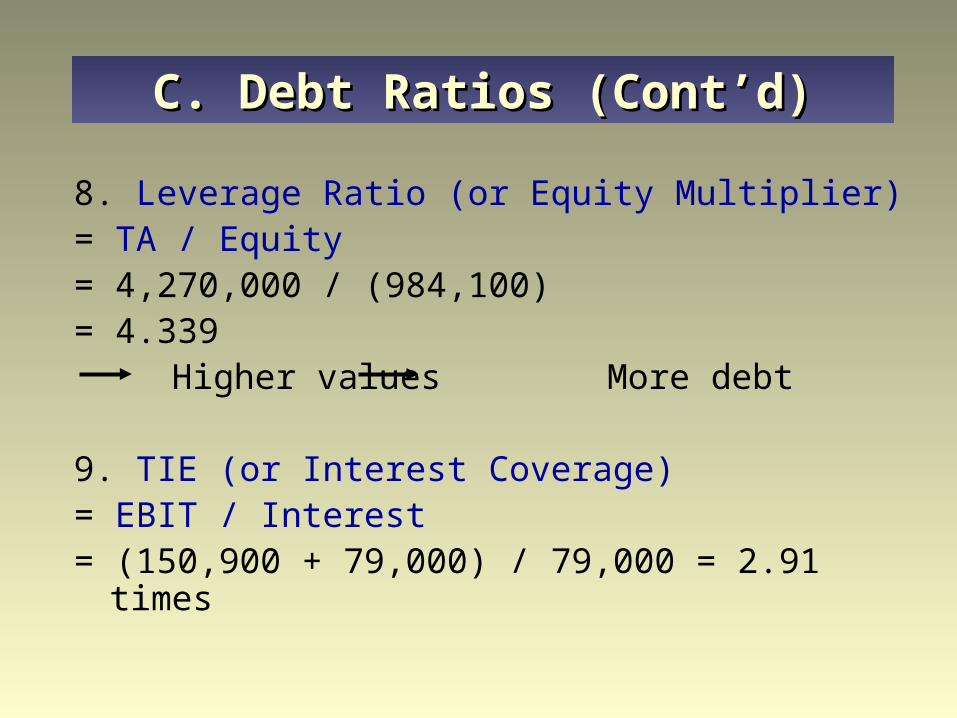
C. Debt Ratios (Cont’d)C. Debt Ratios (Cont’d)
8. Leverage Ratio (or Equity Multiplier) = TA / Equity = 4,270,000 / (984,100) = 4.339
Higher values More debt
9. TIE (or Interest Coverage) = EBIT / Interest= (150,900 + 79,000) / 79,000 = 2.91 times

D. ProfitabilityD. Profitability
10. ROE = NI / Equity
= 132,800 / 984,100 = 13.49%
11. ROA = NI / TA
= 132,800 / 4,270,000 = 3.11%
12. Net Income Margin = NI / Sales
= 132,800 / 4,448,000 = 2.99%

E. Value RatiosE. Value Ratios
13. Dividends Payout = DPS / EPS or
= Common Dividends / Earnings Available to Common Shareholders
= 32,200 / 130,200 = .2473 = 24.73%
14. P/E = Market Price per Share / EPS
= 11.63 / 0.85 = 13.68
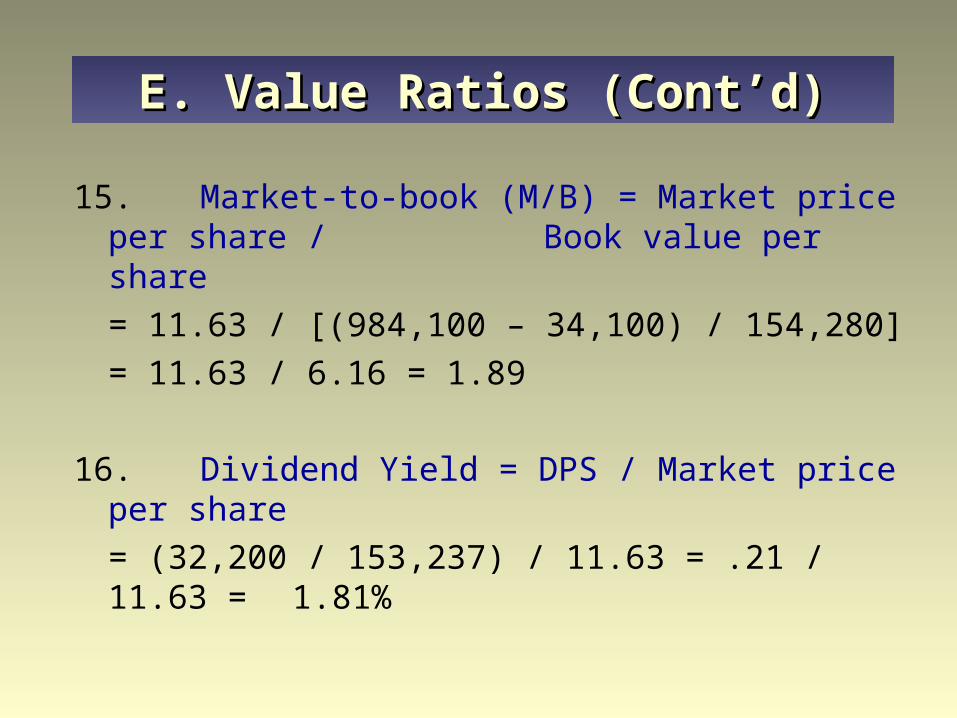
E. Value Ratios (Cont’d)E. Value Ratios (Cont’d)
15. Market-to-book (M/B) = Market price per share / Book value per share
= 11.63 / [(984,100 – 34,100) / 154,280]
= 11.63 / 6.16 = 1.89
16. Dividend Yield = DPS / Market price per share
= (32,200 / 153,237) / 11.63 = .21 / 11.63 = 1.81%

DuPont AnalysisDuPont Analysis
Eqty
TA
TA
Sales
Sales
EBIT
EBIT
EBT
EBT
NI
Tax Burden
Interest Burden
EBIT Efficiency
TA Turnover
NI / Sales = Net Income Margin
NI / TA = ROA
Equity
TA ROA Leverage Ratio = TA / Equity
LeverageRatio
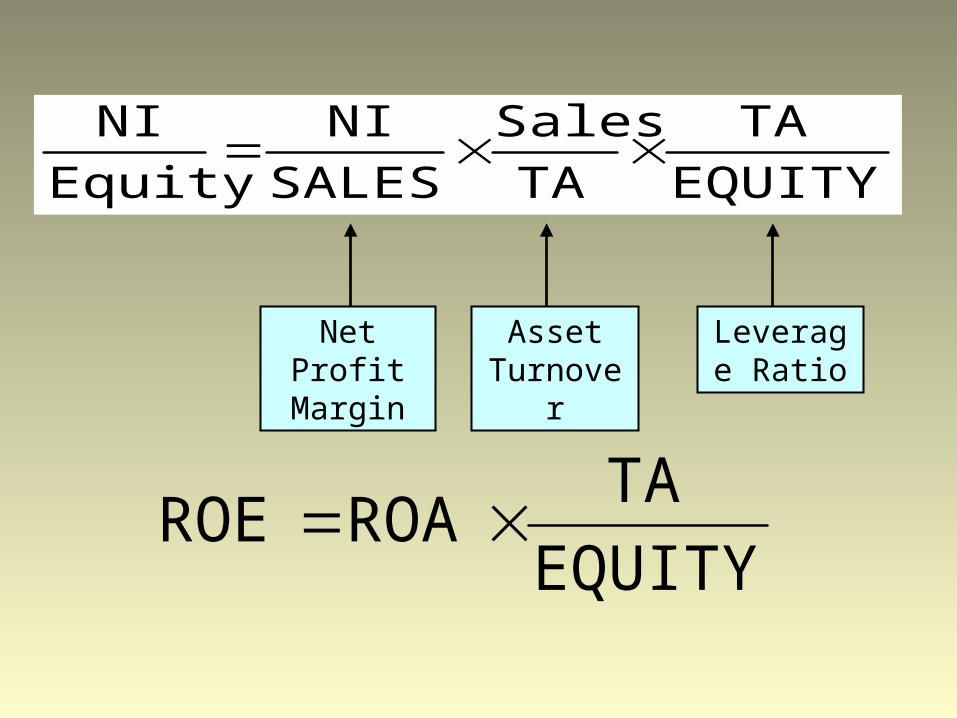
EQUITY
TA
TA
Sales
SALES
NI
Equity
NI
Net Profit Margin
Asset Turnover
Leverage Ratio
EQUITY
TAROAROE
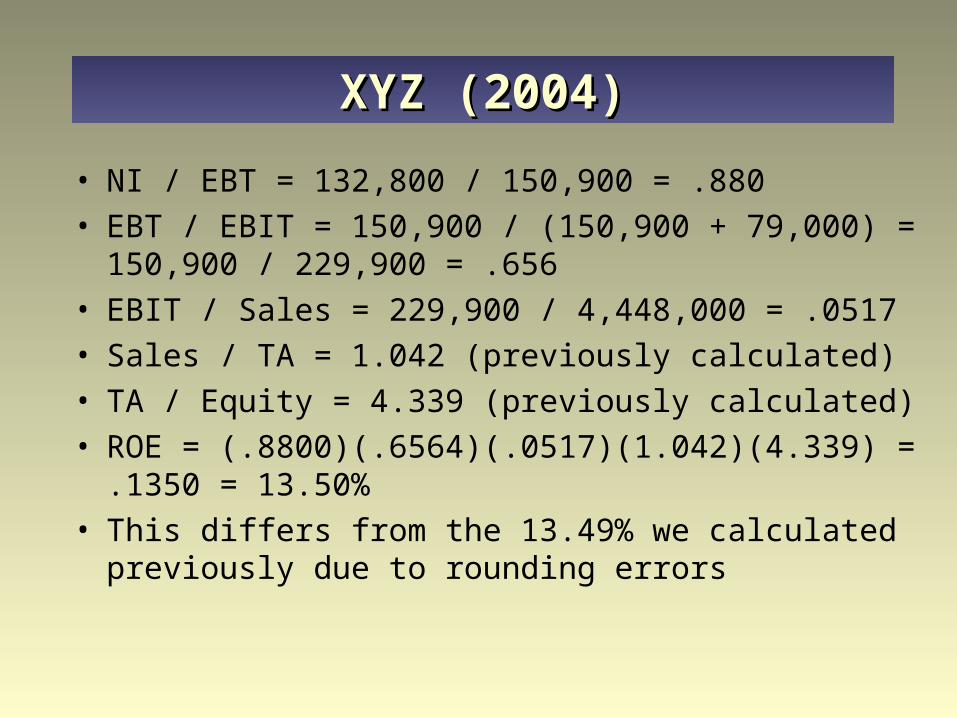
XYZ (2004)XYZ (2004)
• NI / EBT = 132,800 / 150,900 = .880
• EBT / EBIT = 150,900 / (150,900 + 79,000) = 150,900 / 229,900 = .656
• EBIT / Sales = 229,900 / 4,448,000 = .0517
• Sales / TA = 1.042 (previously calculated)
• TA / Equity = 4.339 (previously calculated)
• ROE = (.8800)(.6564)(.0517)(1.042)(4.339) = .1350 = 13.50%
• This differs from the 13.49% we calculated previously due to rounding errors

XYZ (2004)XYZ (2004)
• NI / Sales = 0.0299 (previously calculated)
• Sales /TA = 1.042 (previously calculated)
• Calculate ROA = (.0299)(1.042) = .0311 = 3.11% (equals the 3.11% previously calculated)
• TA / Equity = 4.339 (previously calculated)• So, ROE = (.0299)(1.042)(4.339) = 13.52% (differs
from 13.49% previously calculated due to rounding errors)

LiquidityLiquidity
• Below average Current and quick ratios of 1.07 and 0.27 are
both well below industry averages of 1.69 and 1.09
• Bad trend Current ratio has been steady, but quick ratio has
deteriorated significantly
• Low and deteriorating quick ratio is due to high levels of inventory

Asset ManagementAsset Management
• Collections as measured by ACP is above average (31 days versus 47 days) and is improving
• Inventory turnover is very low (2.3 versus industry average of 8.2), and has been continually deteriorating, and they maintain high inventory levels
• TA turnover is below average, has been over the period, and continues to deteriorate

Debt ManagementDebt Management
• Debt levels have increased steadily and coverage has deteriorated Debt ratio is 0.76 (from 0.51 in 2000) Debt-to-equity is 3.28 (from 1.11 in 2000) Coverage is 2.91 (from 21.53 in 2000)
• Debt capacity and coverage are both below average Debt ratio is 0.76 versus 0.32 industry average Debt-to-equity is 3.28 versus 0.55 industry
average Coverage is 2.91 versus 8.61 industry average
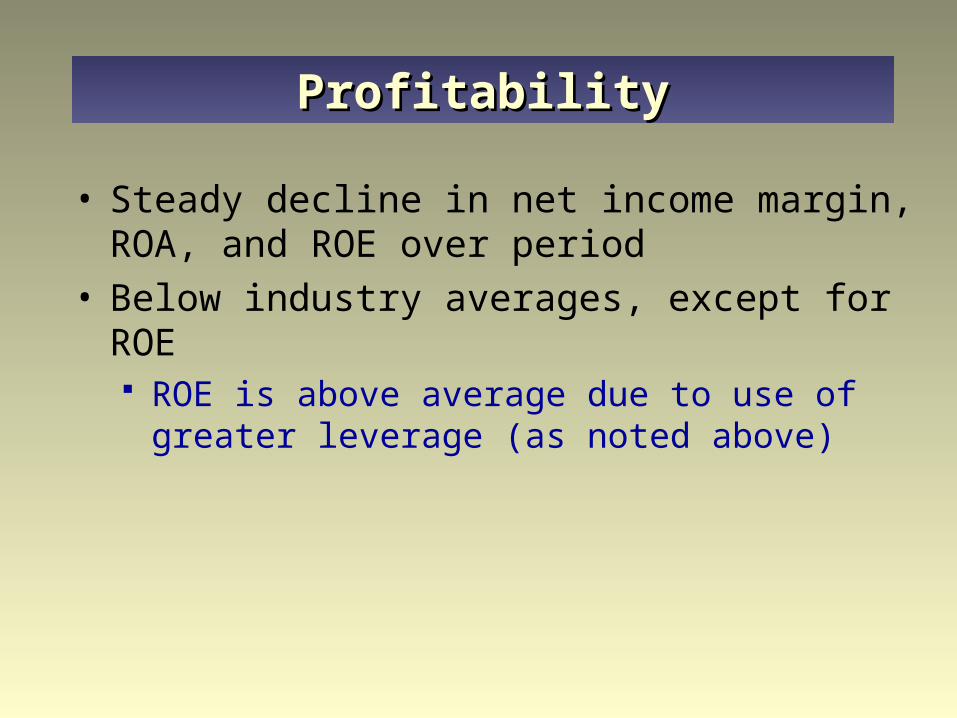
ProfitabilityProfitability
• Steady decline in net income margin, ROA, and ROE over period
• Below industry averages, except for ROE ROE is above average due to use of greater
leverage (as noted above)
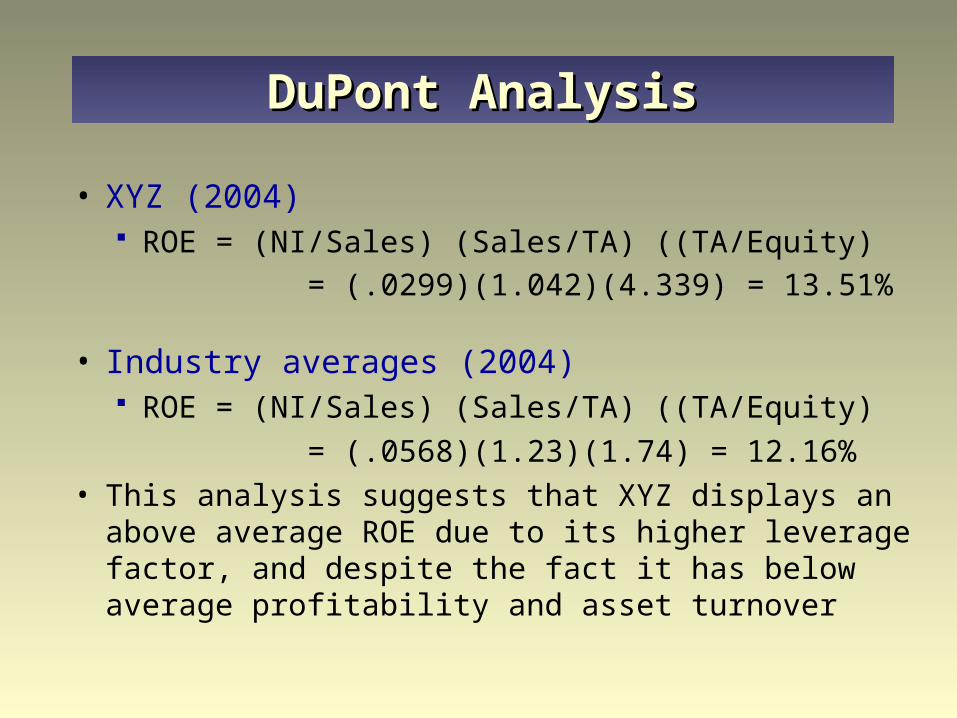
DuPont AnalysisDuPont Analysis
• XYZ (2004) ROE = (NI/Sales) (Sales/TA) ((TA/Equity)
= (.0299)(1.042)(4.339) = 13.51%
• Industry averages (2004) ROE = (NI/Sales) (Sales/TA) ((TA/Equity)
= (.0568)(1.23)(1.74) = 12.16%
• This analysis suggests that XYZ displays an above average ROE due to its higher leverage factor, and despite the fact it has below average profitability and asset turnover
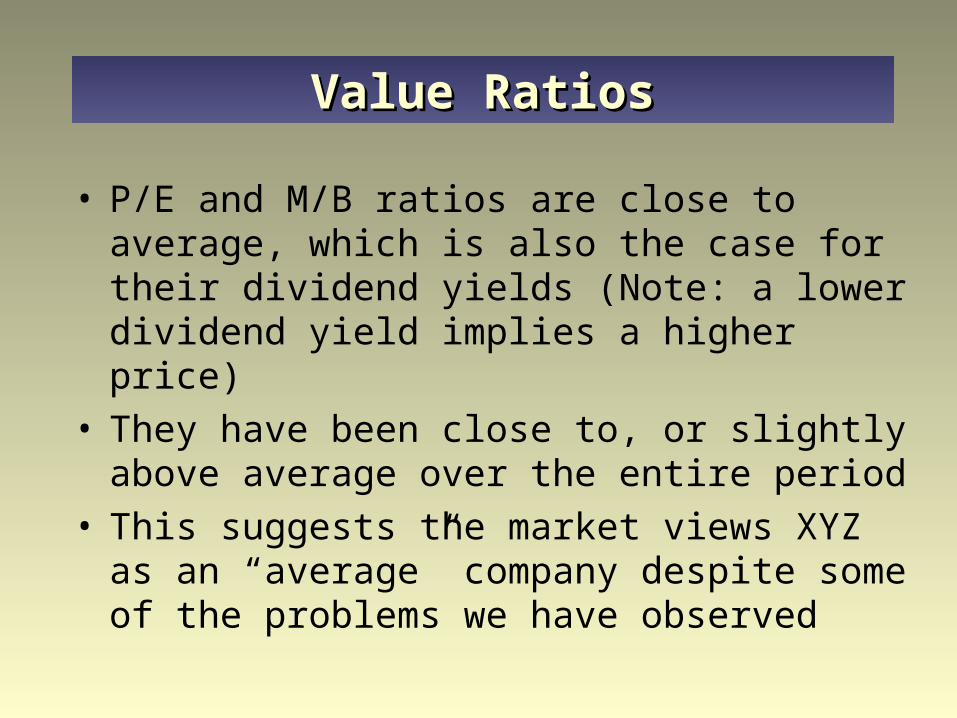
Value RatiosValue Ratios
• P/E and M/B ratios are close to average, which is also the case for their dividend yields (Note: a lower dividend yield implies a higher price)
• They have been close to, or slightly above average over the entire period
• This suggests the market views XYZ as an “average” company despite some of the problems we have observed
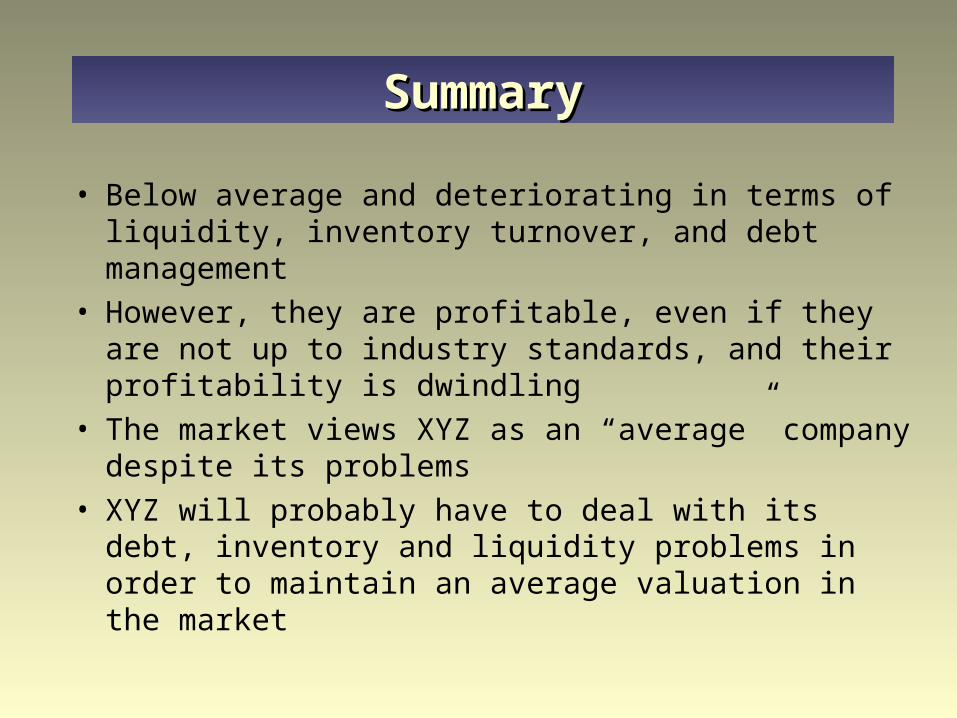
SummarySummary
• Below average and deteriorating in terms of liquidity, inventory turnover, and debt management
• However, they are profitable, even if they are not up to industry standards, and their profitability is dwindling
• The market views XYZ as an “average” company despite its problems
• XYZ will probably have to deal with its debt, inventory and liquidity problems in order to maintain an average valuation in the market
Copyright © 2005 John Wiley & Sons Canada, Ltd. All rights reserved. Reproduction or translation of this work beyond that permitted by Access Copyright (The Canadian Copyright Licensing Agency) is unlawful. Requests for further information should be addressed to the Permissions Department, John Wiley & Sons Canada, Ltd. The purchaser may make back-up copies for his or her own use only and not for distribution or resale. The author and the publisher assume no responsibility for errors, omissions, or damages caused by the use of these programs or from the use of the information contained herein.
CoprightCopright