Chapter 17 Case Studies in Crime Travel Demand Modeling · 2010-07-30 · Case Studies in Crime...
57
17.1 Chapter 17 Case Studies in Crime Travel Demand Modeling In this chapter, Richard Block and Daniel Helms present case studies in crime travel demand modeling for Chicago and Las Vegas respectively. I. Travel Patterns of Chicago Robbery Offenders Richard Block Loyola University Chicago Some neighborhoods are dangerous others are safe. Crime clusters in specific areas. So too do criminals. Criminologists, police, and civilians have known this for nearly 150 years. However, relatively little research has been done on the travel patterns of offenders. Using a modification of standard transportation models, CrimeStat III allows police and researchers to describe and predict travel patterns based on four sequential models. The object of research presented here is to test the usefulness and feasibility of CrimeStat’s Crime Travel Demand model utilizing police reports of all robberies occurring in Chicago in 1997 and 1998 that had at least one known offender who lived in the city. In sum, the objectives of this study of robbery in Chicago were: 1. To test the CrimeStat III crime travel demand model in a mature central city. 2. To describe the travel patterns of robbery offenders based upon offenders home and location of incident. 3. To predict the travel patterns of robbers in 1998 based upon characteristics of the offender's resident neighborhood and the incident neighborhood and a gravity model of the relationship between the two.. 4. To predict the travel patterns of robbers in 1998 based upon the patterns of 1997. 5. To assess the quality of the predictions and their value to the police. Two Models: Econometric and Opportunistic As outlined in chapter 13, a travel demand model is a four-step sequential model. The first stage is trip generation, whereby the number of crimes originating in a neighborhood and the number of crimes ending in a neighborhood are modeled. The second stage is trip distribution which is a model of the number of trips that go from each origin zone to each destination zone. The third stage is mode split, which models the number of trips for each zone pair (origin zone and destination zone) that travels by a particular
Transcript of Chapter 17 Case Studies in Crime Travel Demand Modeling · 2010-07-30 · Case Studies in Crime...

17.1
Chapter 17Case Studies in Crime Travel Demand Modeling
In th is chapt er , Richard Block and Daniel Helm s presen t case studies in crim et ravel dem and m odelin g for Ch icago and Las Vega s r espectively.
I. Trave l P at te rn s o f Ch ic ag o R obbe ry Offen de rsRichard Block
Loyola Univers i ty Chicago
Some n eigh borhoods a re danger ous oth er s a re sa fe. Cr ime clust er s in specific a rea s. So too do cr imin a ls. Criminologist s, police, an d civilians h ave known th is for near ly 150yea rs. H owever , rela t ively lit t le r esea rch h as been done on the t r avel pa t t er ns of offen ders. Usin g a modifica t ion of st anda rd t r ansport a t ion m odels , Crim eS tat III a llows police andresea rcher s t o descr ibe a nd predict t r avel pa t t er ns based on four sequ en t ia l models.
The object of research presen ted here is to test the usefu ln ess and feasibilit y ofCr imeSta t ’s Cr ime Tr avel Dem and m odel u t ilizing police repor t s of a ll robber ies occur r ingin Ch icago in 1997 a nd 1998 tha t had a t lea st one known offender wh o lived in the city. Insu m, th e object ives of th is st udy of robbery in Chicago were:
1. To test the Crim eS tat III cr ime t ravel demand model in a mature cen t ra lcity.
2. To describe the t r avel pa t t erns of robbery offender s ba sed u pon offender shome and locat ion of inciden t .
3. To predict the t r avel pa t t erns of robbers in 1998 ba sed upon character is t icsof th e offender's resident n eighborh ood an d th e incident n eighborh ood an d agravity model of the r ela t ionsh ip bet ween the t wo..
4. To predict t he tr avel pat tern s of robbers in 1998 based upon t he pat tern s of1997.
5. To asses s t he qua lity of the pr edict ions a nd t heir va lue t o the police.
Tw o Mode ls: Econ om etric a nd Oppo rtun istic
As out lined in cha pter 13, a t ra vel deman d model is a four -step sequent ial model. The firs t st age is t r ip gen er a t ion , wher eby t he number of crim es origina t ing in aneighborhood and the number of cr im es endin g in a neighborhood are modeled. The secondst age is t r ip d ist r ibu t ion wh ich is a model of the number of t r ips tha t go from each originzone to each des t ina t ion zone. The th ird s tage is mode split , wh ich models the number oft r ips for each zone pa ir (or igin zone and dest ina t ion zone) th a t t r avels by a pa r t icula r

17.2
t r avel. The four th , an d fina l stage, is net work a ssignment which models t he likely rout estaken by offender s in t r aveling bet ween pa r t icula r zone pa ir s.
Th is m apping of links a ssumes tha t t r avel decisions a re ba sed u pon minimizingcosts to get to a valued des t inat ion–as sor t of geographic ra t ionality. When I go to work, Iweigh cost s a nd benefits . I choose t he rou te tha t will get m e there quickest with the fewestpr oblems . Ea r ly theor ies of cr imin ology assu med t ha t cr imin a l activity was no differen tthan oth er beh avior . It wa s det er mined ra t iona lly. By extension, t r avel rout es and cr imeloca t ions a re a lso determined ra t iona lly.
Tr ips of offen ders a re sim ila r to any r epea ted act ivit y. Most of our act ivit ies occurnea r wh er e we live or work or on the pa th in bet ween . This is our knowledge spa ce. Tripswit h in it maximize our efficiency an d m in imize cost s. Da ily purchases occur close to homewit h a rapid fa ll off wit h dis t ance. But major purchases a re an except ion . They m ay occu rfar awa y. Th is d ist ance decay can be gener a lized to tr avel cost decay. Th e m ore expen sivein t im e, m oney, and dis t ance, t he less likely a t r ip will occu r . Applied to robbery, mostin ciden t s occur close to home, bu t a bank robber might in cur gr ea ter cost s to fin d a goodta rget . Most previous research has found tha t preda tory cr im in a ls avoid in ciden t s tooclose to home for fear tha t they will be r ecognized. Combined wit h dis t ance decay, th iscrea tes a bu ffer zon e of few cr im in a l inciden t s (Rossmo, 2000).
Environmenta l cr im in ology a ssumes tha t most act ivit y occu rs in a knowledge spacetha t includes nodes of res idence work and p lay and t he r out es bet ween these (Bran t inghamand Bran t ingham, 1984,1990) However, t he componen ts of t r avel for cr imin a ls may not bethe same as other people. F or exa mple, for someone wit h a fu ll t im e job, get t in g t o work asquickly as possible is impor tan t ; t ime is m oney. For a jobless crimina l, t ime m ay be lessimpor t an t .
Rout ine act ivit ies theory assumes tha t both t a rget s and offenders choose theiract ivit ies based on a weighin g of cost s and benefit s. Offenders seek out t a rget s in loca t ion swh er e t hey a re likely t o congr ega te (e.g. Bars a t closin g t ime, r apid t r ansit st a t ions ). Acr ime occurs when an offender and a t a rget converge in the absence of a capable guard ian(Felson , 2002). The r ou t ine a ct ivities of offender may most ly be ha nging ou t ra ther thanra t ion a lly seekin g t a rget s. What is the basis of convergence? Ch ance or the decis ion s ofoffender s? Any poten t ial r obbers decision is effected by both chance and cost . Time anddist ance are both measu res of cost . However , with in a sh or t dist ance of home t ime a nddis tance cost s a re near to zero.
An a lt er na t ive h ypothesis is tha t robber s do not weigh cost s a nd ben efits of tr avel. Ra ther , t he may see an oppor tun ity for cr ime and t ake it . Because much of t heir day toda y activity is nea r home, ma ny incident s occur near the robbers’s home. Travel pa t t ernsare ir releva nt for these cr im es. The number of robber ies decline wit h dis t ance from theoffender 's h ome because fewer of the r obber 's da ily activit ies occur far from home. On theother hand, more pr ofessiona l robbers m ay seek out specific a reas or loca t ions wh erelucra t ive t a rget s a re found a nd m ay be willing to tr avel gr ea t dis t ances.

17.3
In Chicago, an opport un ist ic robber’s knowledge of good t a rgets may be limit ed t othe isola ted area a round h is residence. In addit ion , t r ips wit h in the a rea cost a lm ostnoth ing, alt hough oth er cost s, such as r isk of capt ure may be rela t ively h igh . Thedifferences bet ween Chicago and Ba ltim ore County or between Chicago and it s su burbs h asto do as much with knowledge of the dist r ibu t ion of opport un it ies as with the cost of t r avel. Chica go’s neighborhoods a re so isola ted tha t some offenders may h ave lit t le knowledge ofoppor tun it ies ou t s ide their r es iden t a rea . The cr ime t ravel demand model holds tha t in theaggregat e offender s a ppea r to weigh cost s a nd benefits . However , th e da ta ana lyzed her esa ys noth ing about individua l decisions. Decisions m ay be ma de with other factors notcapt ured by shor test dist ance or t ime.
In one of the few studies of non-a r rested robbers Wr ight and Decker (1997) foundtha t most St Lou is robbers a re oppor tun is t ic a nd rob close to home. Ra t ion a lity a nd carefulcost ca lcu la t ion have lit t le to do wit h their decis ion s. These a re people who have a need forquick m oney. If they saw an opport un ity near home, th ey would take it . Oppor tun itieswer e m ost likely to occur as t he poten t ia l offen der and vict im go about their da ily rout ineact ivities. Many of them are close t o home. Ther efore, cr ime occurs close t o home.
The closer to an offender 's home t ha t an inciden t occurs t he more likely th e inciden tresu lt s from a cha nce meet ing. The fur ther awa y tha t it occur s t he m ore lik ely tha t it isplanned. Pa r t of the planning is t r ansport a t ion cost s. Usu a lly th is is ca lcu lat ed in t ermsof income. It is difficu lt t o do th is for offender s. The best we can do is est ima te t r avelt ime.
Crime Travel Demand Models in Chicago
The Offender Travel Model is a n ew applica t ion of the Tra vel Demand Model. Thet ravel dem and m odel ha s been in developm ent since the 1950's. It is used in ever ymet ropolitan a rea in the United St a tes . Crim eS tat 's cr ime t ravel demand m odel wasout lined in Chapt er 13.
As a pp lied t o robber y in Ch icago, descrip t ion is a s im por tan t as p rediction. Whilethe CP D has lon g collected in format ion of the loca t ion of the in ciden t and residence of t heoffender , th ese wer e not linked in a ny system at ic way. In meet ings with the depa r tment ,credible descr ipt ive maps, pr oved to be th e most convincing reason t o use t he newCrim eS tat t r avel demand m odule. Before a new t echn ique is t ested, its poten t ia l crediblitymust be demonst ra ted. Ther efore, th e las t ph ase, in t he Chicago Travel Demand Modelem ph asized both the predicted t r avel dem and m odel a nd t he observed t ravel of offenders.
Ana lysis of Chicago's Crim e Tra vel Demand pr oceeds in th ree st ages. The firs t st ep(t r ip gener a t ion) is a p redict ion of var iables a ssociat ed with the number of cr imesorigin a t ing in ea ch zone a nd t he n umber of crim es en din g in ea ch zone.
The second step is the predict ion of links between zon es based on zon a lcharacter is t ics of inciden t loca t ions and offender res idences and a measure of the

17.4
a t t ract ion between the two zones. These pr edict ive models a re compa red t o the obser vedlinks and t r ips and the previous year ’s t r ips used as a predict ion .
Th e m ode split st ep wa s n ot r un because of the la ck of da ta . Unfor tuna tely, t heChicago police data does not perm it an an alysis by different modes of tr an sport at ion (seechap ter 15). Da ta on whether the offender d rove, wa lked , or rode rap id t ransit to theinciden t a re not collected.
The fin a l s t ep is the descr ip t ion of probable t r avel r outes from the offender ’s homezone to the inciden t zone based on shor t es t t ime or dis t ance a long a t r anspor t a t ionnetwork. The links modeled in the second step can be conver ted to a probable routebetween home and in ciden t zon es over a road network or a summary n etwork loa d whichaggrega tes t r avel of a ll offenders a lon g a t r anspor ta t ion network.
Data for the Study
Inc id e n t an d Arre st Fi le s
The ana lysis presen ted here merged in format ion from many sources. This researchis ba sed on inciden t and a r rest records from the CP D. Excludin g O’Hare Airport , the cityof Chicago is divided in to 946 tr a ffic ana lysis zones. Incident s a re assigned t o these zonesfor both residen ce loca t ion (the or igin) an d t he cr ime loca t ion (the dest ina t ion). Theseinclude a ll Chicago robber ies in 1997 and 1998 tha t had a t leas t one kn own offender wholived in Ch ica go. Th ese were geo-coded by t he address of the in ciden t and a ll knownoffenders. Offenders who t raveled lon ger dis t ances a re probably under -represen ted (Block,2004). About 20% of a ll r eport ed r obber ies a re included. In 1997, there were 25,000robberies report ed to th e police. Of th ese robberies, 4,636 resulted in t he ar rest of at leastone Chicago residen t . In cluding robber ies wit h mult iple offen ders, t her e were 6,643 crim etr ips.
Traffic Analys is Zones
Th ese in ciden t s a nd offen ders a re counted in 946 Tr affic Ana lysis Zones (TAZ). O’Hare Air por t is excluded. Chica go's t r a ffic a na lysis zon es a re most ly based on a un ifor mgr id of 1/2 m ile squ ares . These a re n ot based on censu s t r acts or other city d ivisions. However , some census da ta is ava ilable for these zon es a lon g wit h in format ion onem ploymen t . About 100 of them have n o cen su s popu la t ion a nd t her efore a re u n likely t oinclude t he residen ce of an offender . Lan d u se, employmen t , popu lat ion , an d r obberyin ciden t and offender residence counts a re ava ilable for a ll zon es. Land use goes beyon dthe st anda rd censu s m easu res t o include cha racter ist ics from m any dat a sour ces t ha tmight be rela ted to cr im e. Am ong t hese a re code viola t ion s, vacant parcels , fir es, liquorlicenses, pawn shops, en ter t a in ment venues, d is t ance from the cen t ra l busin ess dis t r ict

1In con tr ast to ma ny cities, Ch icago has a lar ge popu lat ion living in t he centr a l bus ines sdist rict a nd lacks a rin g of impoverish ed communities s urr ounding downtown.
17.5
and other poten t ia lly cr im in ogenic ch aracter is t ics .1 These t r a ffic ana lysis zones a re theunits of ana lysis. Trips a re defined from t he cen ter of a zone.
Chic ag o’s Ro ad Ne tw ork
The bas e of Chicago's road network is a grid with 1/8 mile between blocks , a feederst reet every ha lf mile, and a main s t reet every mile. Layer ed on top of th is grid is a ser iesof d iagona l s tr eet s t ha t t end to be ma jor shopping s tr eet s and a r ela t ively small number ofexpressways tha t converge a t the edge of the cen t ra l city. A semi-expressway, Lake ShoreDr ive, runs a long the lakefront for 25 m iles. Ch icago ha s a well developed rapid t r ansitsystem t ha t, unfort un at ely, could not be included in th e cur rent an alysis.
Two str eet n etwork s were available for a na lysis:
1. Modi fie d TIGER Lin e Fi le : A mos t ly complete map of a ll s t r eet s and ra illines. F ollowin g police pract ice, t he modified TIGER file a llows forgeo-coding in n on-addr essed ar eas, such a s par ks, by extending the base grid. All pu blic st reet s a re included, bu t one-wa y st reet s a re not t aken in toaccoun t and t he short est dis t ance may be on a rout e t ha t no one wouldtr avel. Some ar eas of th e city ar e not well ma pped.
2. Model ing ne twork: This includes Expressways, principal ar terials andcollector r oads. Each road segment is un i-directiona l; th at is, it expressest ravel in on ly one direction . Thus, for a t wo-way road, th ere will be tworecords for ever y segmen t , one in ea ch d irect ion. Th is h as t he a dva ntagetha t one-wa y st reet s can examined sin ce th er e will n ot be an opposit edir ect ion pa ir . On the other hand, a modeling n etwork is less complete sin ceminor s t reet s a re ignored . This t ype of ma p is useful for captur ing t r ips tha toccur over a mile or more, but is not ver y useful for the many tr ips of lessthan 1/2 mile tha t occur in Ch ica go. I t does take in to account one-wayst reet s. Usin g dis t ance, t he network will over -emphasize sur face dia gon a lstr eets a nd will un der-empha size expressways.
One of the advantages of the modeling network is t ha t st r eet segments can beweigh ted by speed or t r avel t ime, r a ther than jus t dis t ance. There a re eigh t dis t inct t imeper iods wit h the t r avel t ime on ea ch segment by period being indica ted. Ea ch st reetsegment can be weighted by its t r avel t ime in minu tes du r ing a specific t ime per iod (e.g.; 7-9 AM) to allow a more r ea list ic descr ipt ion of t r avel beh avior . Fur ther , t r avel in opposit edir ect ions can be t r ea ted differen t ly sin ce t r avel t imes can be d iffer en t for ea ch d irect ion. Dur ing rush hour , tr avel in one dir ect ion may be mu ch quicker than t ravel in t he otherdirect ion . Weight ing by tr avel t ime will allow lar ger a r t er ial roads a nd expresswa ys to be

17.6
chosen more s ince tr avel speeds will gener a lly be fas ter on t he la rger capacity r oads. Th isnetwork tends to be most rea list ic for lon ger t r ips bu t , a ga in , is not usefu l for very shor t‘loca l’ t r ips sin ce the loca l, neighborhood r oad network is n ot included. A grea terpercentage of the t r avel is on expr essways.
Trip Gene ration
Usin g the a r rest da ta , even t s wer e aggrega ted to th e TAZ’s by both the origin s a ndthe dest in a t ion s. As expected, t he dis t r ibu t ion of cr im es by or igin zon e and by dest in a t ionzone were h ighly skewed. F or exa mple, 419 zones h ad n o robber ies origina te in them wh ileone zone had 27 origins a nd a noth er had 24 origins.
A similar condit ion held for the number of cr imes by dest ina t ion . For exam ple, 409zon es had no robber ies occur wit h in them while one zon e had 24 cr im es occur and two had23 cr im es occur .
Separa te models of these in ciden t s were developed a t the zon e level. Th e regr essionana lysis tools in Cr im eSta t a re excellen t , bu t choosin g r egr ession predict ors requir es bothsk ill and t heory. Many explana tory var iables wer e test ed. The indepen den t var iableschosen for a na lysis were based on t hose previously foun d to be import an t pr edictors ofviolent cr ime in Chicago. Sign ifican t var iables wer e:
1. POP2000 The m ost impor tan t was t he 2000 popu lat ion because t hedepen den t var iable was a pr edicted count of or igins or dest ina t ion . Oth ervar iables t ha t were included wer e:
2. ETH NICP ER Th e per cent age of the domin ant racial or et hn ic group wit h inthe TAZ. Recent research (Sampson & Raudenbush , 2001) has found tha tracial isolat ion and pover ty pred icted h igh community levels of violence.
4. POVPERCE NT Th e per cent of the h ouseh olds below t he poverty level.
Sa mpson a nd Rauden bush (2001) found t h is to be a domina nt var iablesexpla in ing community disorder .
5. VENUE The number of en ter ta inment venues (clubs , thea ter s , bowlinga llies) in a TAZ. This is informat ion gat hered from t he Met roMix and theReader in 2002. It wa s n egat ively relat ed t o the residen ce of the offenderand was p robably m ore a mea su re of perceived neigh borhood sa fety thanavailabilit y of t a rget s.
6. PAWNSHOP Th e n umber of pa wn sh ops is in cluded in sever a l regr essions. Apa wn sh op is both a focus for poten t ia l t a rget s a nd a good p lace to get cash .
7. VACANT: Coun t of vacan t bu ild ings in the TAZ. Perhaps th is is an indica torof genera l n eighborhood dilapida t ion (Br oken Windows).

17.7
The var iables t ha t were not significan t ly relat ed t o or igins or dest ina t ions includedmany t ha t a re typ ica lly r ela ted to t r avel demand in clu din g employment and dis t ance fromthe cen t ra l bu sin ess d ist r ict. In add it ion, va r iables tha t a re oft en associa ted wit h robber y,such as counts of drug a r rest s, con venience stores, liquor licences, banks and cur rencyexchanges were unrelat ed t o or igins or dest ina t ions a ft er pover ty an d populat ion wereaccoun ted for . Few TAZ cha racter ist ics tha t might a t t r act a n offender to comm it a crim ewer e significan t ly rela ted to th e number of robbery inciden t s in a TAZ. In gener a l theresu lt s of the regr ession s and the resu lt in g t ravel demand mat r ix suppor ted the depict ionof robbery in Ch ica go occu r in g in or near the offender ’s rela t ively isola ted homeneighborh ood.
Poisson r egressions for or igin a nd des t ina t ion zone counts for overn igh t t r ips wer esim ilar in 1997 and 1998. Ta bles 17.1 a nd 17.2 pr esen t the fina l Poisson r egression modelsfor the residen t zone of robbers in 1998 an d t he loca t ion zones for robber ies tha t occur redovern igh t . In a ll regr ession models , popula t ion had a posit ive rela t ion sh ip to the number ofcrim es, both origins a nd dest ina t ions. Similar ly, th e pover ty var iable a nd t he et hn ichomogeneit y var iable were posit ively rela ted to th e number of crim es, both origins a nddest ina t ions .
Ta ble 17.1
Final Overnight 1998 Robbery Orig in Model
Data file: Chicago TAZ with Time.dbf Type of model: Origin DepVar: Robbery Origins 8PM-5:59AM N: 946 Df: 940 Type of regression model: Poisson with over-dispersion correction Log Likelihood: -2011.35 Likelihood ratio(LR): 2962.73 P-value of LR: 0.0001 AIC: 4034.71 SC: 4063.82 Dispersion multiplier: 1.00 R-square: 0.443 Deviance r-square: 0.445
----------------------------------------------------------------------------- Pseudo- Predictor DF Coefficient Stand Error Tolerance z-value p-value CONSTANT 1 -2.072610 0.170828 . -12.132746 0.001 POP2000 1 0.000235 0.000011 0.876420 22.156415 0.001 ETHNICPER 1 0.015786 0.001746 0.909463 9.042151 0.001POVPERCENT 1 0.037134 0.002144 0.872974 17.321707 0.001 VACANT 1 0.016970 0.002528 0.835809 6.712064 0.001 VENUE 1 -0.115182 0.033458 0.933336 -3.442566 0.001----------------------------------------------------------------------------

17.8
The pseudo-R-square va lues a re r ea sonably good and a n ana lysis of the r esidu a ler rors do not revea l a ny m ajor out lier s. Given the la rge number of zones (n=946) theregr essions p redict va r ia t ions in the count of origin s a nd dest ina t ion fa ir ly well.
Ta ble 17.2
Final Overnight 1998 Robbery Dest inat ion Model
Data file: Chicago TAZ with Time.dbf Type of model: Destination DepVar: Robbery Destinations 8PM-5:59AM N: 946 Df: 941 Type of regression model: Poisson with over-dispersion correction Log Likelihood: -2041.56 Likelihood ratio(LR): 2661.30 P-value of LR: 0.0001 AIC: 4093.11 SC: 4117.37 Dispersion multiplier: 1.00 R-square: 0.380 Deviance r-square: 0.474
----------------------------------------------------------------------------- Pseudo- Predictor DF Coefficient Stand Error Tolerance z-value p-value CONSTANT 1 -1.946591 0.032370 . -60.135432 0.001 POP2000 1 0.000218 0.000008 0.898680 26.418877 0.001 ETHNICPER 1 0.015913 0.000874 0.944910 18.201093 0.001 PAWNSHOP 1 0.335678 0.029184 0.954563 11.501940 0.001POVPERCENT 1 0.035707 0.001888 0.989400 18.913079 0.001-----------------------------------------------------------------------------
Trip Dis tr ibut ion
After t he two predicted models were developed, th e tr ip distr ibut ion st age wasmodeled, in other words the number of t r ips tha t go fr om each or igin zon e to eachdest ina t ion zone (th e t r ip d ist r ibu t ion). The inpu t s wer e t he predicted origins a ndpr edicted dest ina t ions for robber ies in 1998 from t ables 17.1 and 17.2.
Th e t es t of Cr imeSta t ’s cr ime t ravel dem and m odule, began wit h ana lysis of 1997. Prepara tory a na lysis in dica ted tha t 29% of robbery t r ips occur red in the offender ’s homezone. While the number of in t ra -zona l t r ips can be mapped and p red icted , t r avel with in azone can not be described.
Usin g observed cr im e t r ips, t he number of t r ips from each zon e to every ot her zon ewa s ca lcula ted. Figure 17.1 depicts the volum e of obser ved in ter - an d in t ra -zona l t r ip lin ksin 1997. The zone sh adin gs in dicate t he number of in t ra -zona l t r ips . The width of the linksindicat es the frequency of tr ip links. Impoverished areas of th e west a nd sout h sidedomina te th is ana lysis. Most int er -zona l link s a re quit e sh or t . Man y begin in zones t ha t

17.9
also ha ve man y int ra -zona l tr ips. In Las Vegas a nd Baltimore Coun ty ma ny links ar eassocia ted wit h specific sit es su ch a s shoppin g malls or en ter t a inmen t a rea s. Wit h in theCity of Chicago, the links la ck a clea r focal zone for inciden t s. H owever , few r obbery t r ipsa re m ade to th e cen t ra l bu sin ess d ist r ict.
A t r ip dis t r ibu t ion ana lys is includes both in ter - and in t ra -zona l t r ips in a singleana lysis . The ana lysis is not of t r avel fr om home to dest in a t ion , bu t from a home zon e to adest in a t ion zon e. F or t r anspor ta t ion pla nners in ter -zon a l t r ips a re more im por tan t thanin t r a -zona l t r ip s because these p red ict changing t r anspor t a t ion needs. The volume ofwit h in zone t ravel can be predicted bu t not specific rou tes However , many Ch icagorobber ies (29% in 1997, 26% in 1998) a re in t ra -zonal.
Th er efore, t wo techniqu es a re t es ted to account for the m any in t ra -zona l t r ips . Inthe firs t ana lysis , both in ter - an d in t ra -zonal overn ight robber ies t r ips a re included in thesa me ana lysis . In the second a na lysis , to see wh et her differ en t var iables wer e predictin ginciden t s close to the offender ’s home address from those fu r ther away, in ter - and in t ra -zona l tr ips wer e ana lyzed sepa ra tely. Ultim ately, I concluded t ha t there was litt le to bega ined by separa t ing the t wo types of tr ips .
Trip Dis tribut ion
The gra vity model th at un derlies CrimeSta t’s t r ip dist r ibut ion model assumes tha tt ravel between or with in zones is dependent upon the offender pool, opport un it ies , andcosts. Conceptua lly, th is can be written a s:
T(ij) = "(Offen der Pool) $(Opport un ities)/Cost 8 (17.1)
where " an d $ ar e coefficient s an d 8 is an exponent . The impeda nce (or ‘cost ’) componen tis modeled with a ma th emat ical fun ction. After experiment at ion, I foun d th at th e bestimpedance fun ction was a lognorm al distr ibut ion with a mean of 2 miles and a sta nda rddeviat ion of 5. The resu ltin g model fit t he actua l tr ip length dist r ibut ion quit e well. Thecoinciden ce ra t io was a bout the same for both the 1997 a nd 1998 compa r isons (figur e 17.2).
To gra ph ica lly indica te the t r ips, st r a igh t lines a re used t o indica te links betweenzon es and wid ths to in dica te volume (figu re 17.3). An inspect ion of figure 17.3, shows th a tmany specific links were not well pr edicted. In gener a l, the pr edict ion under est ima tedvery shor t t r ips bu t overest im ated middle dis t ance t r ips (2-4 miles).
Predic t ing 1998 Tr ips From 1997 Tr ips
From a police perspect ive, even the dis t r ibu t ion of cr im e t r ips can be of va lu e fortactica l pu rposes and for pla nning in ter ven t ions . However , the descrip t ion of 1998 n ightt im e robber ies t r avel demand was ret rospect ive-done lon g a ft er 1998. Can th is dis t r ibu t ionbe successfu lly pr edicted? In t ime ser ies analysis , the bes t pr ediction of one per iod isgen er a lly the per iod tha t immedia tely preceded it . In spa t ia l ana lysis , th is is a lso likely t o

Figure 17.1:

Figure 17.2:

Figure 17.3

17.13
be t rue, especially in a mature city. However , wh ile n eigh borhood character ist ics cha ngeslowly in Ch ica go, they do change. Dur in g t he la te 1990's many public housin g project swere em pt ied and some wer e t orn down . While few n eigh borhoods deter iora ted, manygen t r ified. Any of these m ight cau se a cha nge in the dist r ibu t ion of robbery t r ips .
The 1997 obser ved r obbery t ravel mat r ix was u sed t o predict observed t ravel in1998. Crim eS tat III, in con junct ion with a GIS and a s t a t is t ica l package, p rovides severa l compa r ison tools. Compa r ing 1997 an d 1998, th e fit is qu ite good. Including st reetsegments t ha t had n o t r ips in eit her year , 55% of the t r ip links in 1998 wer e pr edicted bythe t r ip links in 1997 (r2=.741). The coin cidence ra t io of .86 for 1998 and the dis t ancedis t r ibu t ion in figur e 17.2 above indica te a h igh degree of sim ila r ity. However , acompar ison of the top 300 t r ip links illus t ra tes tha t , while zones with many in t ra -zona linciden t s a re fa irly well pr edicted, int er -zona l tr ips a re not well pr edicted. Mapping th esemakes clear tha t 1997 in ter -zona l links cannot a ccura tely predict specific 1998 lin ks (figur e17.4). However , specific links may be less im port an t from a police per spective th ankn owledge of the frequency of offender t r avel on specific st reet s.
Predic t ing Overnight Robbery Tr ips
After select ing only t hose 1998 r obber ies tha t occur red from 8 PM t o 5:59 AM, azone to zone ma t r ix was const ruct ed . Un like the ana lys is above, t h is mat r ix included bothint ra -zona l (31.5% of the tota l) an d int er-zona l tr ips. As sh own in F igure 17.5, zones withmany in t ra -zona l overn igh t t r ips a lso had m any in ter -zona l tr ips. In t ra -zona l link s wer ewidely disper sed t h roughout the city with an area of concent ra t ion on the west side, butther e wa s n o clea r pa t t er n .
Mode Spl it
Because of the la ck of in format ion about t r avel m ode, t he mode split model was notrun . It is h oped t ha t , with bet t er informat ion , th is type of model could be ru n in t he fu ture.
N e tw o rk As sig n m en t
The th ird , an d fina l step, in t he ana lysis wa s t o exam ine t he likely rout es t aken aswell a s t he t ota l dem and p laced on t he r oad net work. Network ass ignmen t is a n especiallyuseful t ool for police work because it su ggest poss ible loca t ions for in ter ven t ion . Becau se itis based on the a ctu a l st r eet net work, it is m ore concrete t han a depict ion of link s. Therefore, I tes ted severa l ways t o depict network a ssignment for 1997 robbery t ravelbefore proceeding to th e 1998 ana lysis.
The net work ass ignmen t rout ine in Crim eS tat III ou tpu t s two r esult s :
1. Th e short es t rout es on a st reet net work. For each zone-to-zone pa ir , theshort est pat h is calculat ed.

Figure 17.4:

Figure 17.5:

17.16
2. The Net work load. Net work load counts t he number of t r ips over each st reetsegment regar dless of or igin or des t ina t ion and su ms t hese.
Both th e short est routes an d th e tota l network load can be based on t ime or costra ther than dis t ance.
F ir st , a ll in ter -zon a l r obber ies in 1997 were mapped a lon g Chica go’s st reet networkby short est dist ance. The 4000 t r ips wer e counted a long each of Chicago’s 51,000 st reetsegments a nd m apped as a network load. As t he width and color changes from blue t o redin Figure 17.6, t he number of t r ips tha t pa ssed over a segmen t increases. H owever , th ismap is difficu lt t o int erpr et and lacks credibility. Much of the load is a long small side-st reet s. Diagona l st reet s a re emph asized an d expresswa ys ar e ignored because t heyusua lly a re not the shor test route in terms of dis t ance. Also, t r avel in the wrong dir ect ionon a one wa y st reet is possible s ince on ly dis t ance was u sed t o ca lcula te t he short es t pa th . Th e CP D did n ot believe th is t o be a useful m ap.
The same in ter -zona l links wer e m apped again a long usin g the Ch icago modelingnet work, bu t weigh t ing segm en ts only by dist ance (figure 17.7). While th is r esu lted in agrea t ly simplified map, it st ill lacked some credibility. Expr esswa ys ar e ra rely the sh or testdist ance, th erefore, th eir u se is under emph asized. The a lgor ith m resu lts in a n overemphasis on dia gon a l m ain st reet s. Some connected segm ents look ed like a st a ir casefollowing a long Chicago’s gr id of main a nd seconda ry st reet s from one h igh inciden tneigh borhood t o an oth er on t he west and sout hwest sides .
In oth er words , dis t ance did not seem to be a good r epresen ta t ion of tr avel r out es . Given tha t police records in clu de t im e of in ciden t and t ravel t im e a lon g Chica go’s roadnetwork is available, an d th at Crim eS tat a llows for ana lysis by tr avel t ime, I r e-concep tua lized t ravel cos t a s shor tes t t ime ra ther than dis tance.
S h ort e st Ti m e or S h ort e st D is ta n ce ?
What does dista nce measu re? Traveling ten m iles during Chicago's evening ru shis quit e differen t than a t midnight . However , th e two blocks from my house t o the nearestconvenience store is unaffected by t he t im e of day a nd lit t le effected by t he mode oft ranspor ta t ion . While dis t ance appears to be a st ra igh t forward measure, it is not . Atclose dist ance, it specifies kn owledge space or the loca t ion of rou t ine a ct ivities. Fur therfrom home, it is r ela ted to a lack of knowledge, bu t is a lso an inaccura te measure of thecos t of t r avel. Bet ter measures than d is tance a re often ava ilable. All U .S . majormet ropolitan a rea s m ap t ravel t ime by t ime of da y on m ajor st reet s, feeder st reet s, a ndexpresswa ys us ing modeling networks (see chapt er 16). These m aps a long with police da taon t ime of inciden t can be combined to rea listically describe sh or test t r avel t ime r a therthan sh or test dist ance.
The Ch icago Area Transport a t ion Su rvey (CATS) divides the day into eight t imeper iods ba sed on t ravel demand. Wheth er a cr ime t r ip was in t ra - or int er-zona l wasunaffected by t ime of da y (P2=7.07 s ig=.421 in 1998). Not surpr isin gly, th e r obber 's da ily

Figure 17.6:

Figure 17.7:

17.19
t r avel cycle is differen t than the gener a l popu lat ion . In 1998, robbers sh ow litt le demandfor t r avel in the morn ing rush hour per iod (6 AM to 10 AM). Of the remain ing t r ips, abou tha lf (46% in 1998) occur red from 8 PM to 5:59 AM. These overn igh t t r ips a re the subjectof the ana lysis pr esen ted h ere.
Overn igh t Robbery Tr ips
Overn igh t network loa d was mapped on Ch ica go's a r t er ia l r oads accordin g t o bot hsh or test dist ance (figure 17.8 left ) and sh or test t ime (figure 17.8 right ). As before, th e twomaps a re very differen t . Expr esswa ys ar e ra rely included in the sh or test dist ance betweenzones. Much of the t r avel is on dia gona l su r face st reet s. H owever , if t ime is t aken in toaccoun t , many of the t r ips a re on expressways a nd on La ke Shore Dr ive. Th is is pr obably amore rea list ic descrip t ion of longer dis t ance t r ips .
In moving from a complete st reet network t o a simplified net work u sing dista nce asan im pedance to a t im e-based network, t he descr ip t ion moves from an unrea list ic a ndpr obably un-int erpr etable ma p t o one tha t pr obably cor responds t o the rou tes t aken byoffender s. Does th is a dd to police knowledge? Of th e 10,763 m apped segmen ts in thenetwork, 65.1% had no predict ed t r ips assigned to them. Two percen t of the roadsegments, those with 15 or more t r ips, con t r ibut ed 20.2% of the 16,162 robber 's movemen tsacross road segment s. These were typically ar terial roads or expressways. Neverth eless,by iden t ifying th ese st reet s a s t hose m ost likely to ca r ry cr ime t r ips, th ese ‘hot st reet ’segments could become a focus for police pa t rol or for int ervent ion to pr event cr ime.
F e as ib ili ty & Ad v an t ag e s
The police a lrea dy collect informat ion on the loca t ion and t ime of inciden t s a nd t hehome addr ess of a r rest ed offender s. Can th is informat ion be ut ilized to describe andpr edict t he t r avel pa t t er ns of Chicago robber s? Fir st , Crim eS tat 's t r ip dis t r ibu t ionmodu le was used t o describe zona l pa t t erns of t r avel for a ll kn own 1997 Chicago robberyoffenders. Aroun d 30% of Chicago robber ies a re commit ted nea r to th e offender 's h ome. For these a zona l model cannot pr edict t r avel pa t t erns. For oth er robber ies, a t ime-weighted t ravel pa t t er n resu lt ed in a more credible descrip t ion t han one ba sed on dis t ance. However , even th is descrip t ion resu lted in an over em ph asis on t ravel a long su r face gr idst reet s a nd d iagona l st reet s r a ther than expressways.
The key t o ana lyzing t he robber 's t r avel pa t t ern is to reconsider the meanin g ofdist ance. Close t o home or work, dist ance repr esen t s a kn owledge space and a nopport un ity space, a place the offender kn ows in which h e or sh e spends a lot t ime. This isan area wh er e t he ben efits of knowledge m ay outweigh the cost s of poss ible cap ture or itmay s im ply be where the offender hangs out .. Fur ther away, shor test dis t ance is a poorrepresen ta t ion of t r avel cost . In major met ropolitan a rea s, a bet t er represen ta t ion isshor test t r avel t im e. Combin in g t ravel t im e of day wit h t im e of in ciden t , r esu lt s in a morerea lis t ic t r avel pa t t ern .

Figure 17.8

17.21
These in t ra - and in ter -zon a l lin ks a re, t hemselves, a new way t o look a t therela t ion sh ip between offender and in ciden t . H owever , t hey n eed some represen ta t ionbefore t hey a re u seful t o th e police for t actica l ana lysis or cr ime preven t ion. In mydiscussion wit h the Ch ica go P olice Depar tment , a network loa d map seemed to be mostusefu l. Network loa d summar izes the number of cr im e t r ips tha t passed over eachsegment in a road network.
Lim it ing ana lysis to robber ies occur r ing overn ight (8PM t o 5:59 AM), 1997 t ravelpa t t erns were a good predict or of t r avel d is t ances, in t ra -zon a l r obber ies, a nd network loa din 1998. However , 1997 t ravel pa t t er ns only wea kly pr edicted specific links bet ween t ra fficana lysis zon es. F or 1998 in ciden t s, a t r ip dis t r ibu t ion model (u sin g P oisson regr ession ofthe zon a l cou nt of robbers' h omes and in ciden t loca t ion s, a nd a im pedance funct ion )modeled the overnigh t t ravel lin ks between home and in ciden t . Subst it u t in g a lognormalimpeda nce funct ion - tha t bet t er matched t he obser ved overn igh t robbery pat t ern , resu ltedin pr edictions t ha t wer e n ea r ly as good as t he 1997 obser ved t ravel pa t t er ns. Acombina t ion of these p red ict ions with ana lys is of t r avel pa t t erns over severa l years migh teven tua lly resu lt in an excellen t zona l pr ediction of crim e t ravel pa t t er ns.
Cr ime t ravel dem and a na lysis is complex an d t ime consu ming and r equires arela t ively power fu l P C wit h a la rge memory ca pacit y. Is it wor th it ? Yes . In format ion oncr ime t r ips is au tomat ica lly gat hered by th e police, but it is n ot fu lly u t ilized. However ,un like t r ansport a t ion planners, police are gener a lly concerned with the sh or t t erm andwith acu te ra ther than chron ic p roblems . They work on an exis t ing s t reet network ra therthan planning for the fu ture. Crime t ravel dem and m odels m ay bett er ser ve th e police assh or t t erm descript ions r a ther than long ter m pr edict ions a nd can pr obably be used t odescr ibe t he effect of specific police in ter ven t ions su ch a s r oad blocks or dr ug in ter dict ions . The cr im e t ravel demand model a lon g wit h a GIS can iden t ify hot st reet segm ents–thosesegm ents tha t a re most likely to be on the t r avel r outes of offen ders and most usefu l forin ter ven t ion t o preven t crim e.
For r esea rchers, on the other hand, a crim e t ravel dem and m odel is a good way toask long-term, st ructura l quest ions. If the t r avel pa t t erns r emain r elat ively const an t overt ime, t hen these r elat ionsh ips can be modeled using a limit ed n umber of var iables. Theresu lt is a way to compa re differen t met ropolita n a reas a s well as a way to look a t the sa memet ropolita n a rea over differen t t ime per iods. It ’s a framework for ana lysis t ha t is broaderthan jus t a journey-to-cr ime type of descr ip t ion .
Lim it at io n s
Ther e a re a lso limita t ions t o th e m odel:
1. Only cr imes with a t leas t one kn own offender a re ana lyzed. To the exten ttha t offender t r avel pa t t er ns in unsolved cr imes a re differ en t than those wit hknown offenders, t r avel pa t t er ns will be m isr epresen ted.
17.22
2. The model work s best if records a re gath ered in su ch a way tha t t he addr essof an offender home can be linked to the addres s of an inciden t .
2. The t ravel demand m odel assumes tha t the offender ’s h ome address isaccur at e. Offenders ma y not h ave a sta ble address or m ay give a falseaddr ess.
3. The t ravel demand model a ssumes tha t offenders t r avel d ir ect ly from homeneighborhood to in ciden t neighborhood; many probably do not .
4. The cr ime t ravel dem and m odel is an aggregat e model, not a individua l one.It pr edicts t r avel from t he cen ter of one zone to th e cen ter of anoth er . Itcannot predict specific t r ips or the behavior of specific offenders and cannotpr edict t r avel with in a zone.
5. The model m ust be cr im e and cit y specific. Chica go r obbers were much morelikely to at ta ck close to home th an th ose in Baltimore Coun ty or Las Vegas. Because t hese h omes wer e dist r ibut ed t h roughout the city, th e t r avelpa t t erns of Chicago robbers wer e much less focused on s ingle ta rget zonesth an in t he oth er test sites.
6. The study of Chica go was limit ed to in ciden t s tha t occur red in the cit y ofChicago. It does n ot model t r avel pa t t erns of inciden t s occur r ing ou t side t hecity and can say noth ing abou t t hem.
7. The da ta ava ilable from the Ch ica go P olice Depar tment did not a llow for atest of t r avel mode u sed. It cannot be as su med t ha t cr imin a l tr ips u se t hesam e modes of tr an sport at ion a s non-criminal tr ips.
Conclus ions: Chicago
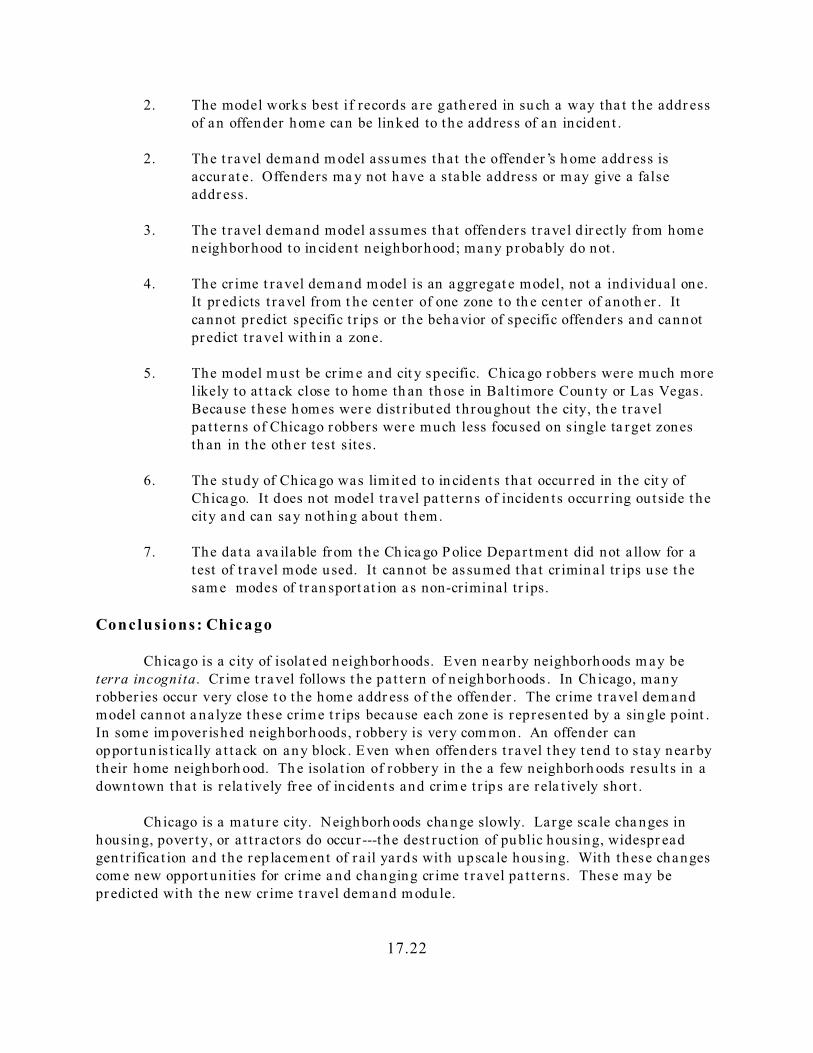
Chicago is a city of isolat ed n eighborhoods. Even n earby neighborh oods m ay beterra incognita. Cr ime t ravel follows t he pa t t er n of neigh borhoods . In Ch icago, manyrobber ies occur very close t o the home addr ess of the offender . The cr ime t ravel dem andmodel cannot a na lyze t hese cr ime t r ips because ea ch zone is represen ted by a sin gle point . In some im pover ished neighborhoods, r obbery is very com mon. An offender canoppor tun is t ica lly a t t ack on any block . Even when offender s t r avel t hey t end to s tay nea rbytheir home neighborh ood. Th e isola t ion of robbery in the a few neighborh oods resu lt s in adowntown tha t is rela t ively free of in ciden t s and cr im e t r ips a re rela t ively shor t .
Ch icago is a mature city. Neighborh oods cha nge slowly. Large sca le cha nges inhousing, pover ty, or a t t r actor s do occur ---the dest ruct ion of pu blic housing, widespr eadgen t r ifica t ion and the rep lacement of ra il ya rds with upsca le hous ing. With these changescome new opport un ities for cr ime a nd changing cr ime t ravel pa t t erns. These may bepr edicted with the new cr ime t ravel dem and m odu le.

17.23
II. Ap p li ca ti on o f Tra v el D e m an d B e h av io r Mo d e l on Crime Data from Las Vegas , Nevada
D an He lm sGIS & Crime Analys i s Spec ia li s t
Crime Mapping & Analys is ProgramNation al Law Enforcem en t & Correc tions Tec hn ology Cen ter
Rocky Mounta in RegionDe n ve r, CO
Introduct ion
St ra tegic cr ime forecas t ing has for many years r elied on a limited and s implis t icsu ite of methods t o pr edict appr oximately where fu ture event s m ay occur in br oad st rokes .Ext rapola t ion of percen t ile change is probably the most commonly used means offorecast ing fut ur e crime frequencies, based on t he notion fun dam enta l to all predictions,tha t the fu ture will resem ble th e pa st . Unfor tuna tely, th is method is completely unable tocope wit h cha nges in the dem ogra ph ics, popula t ion, a nd socia l makeu p of a ju r isd iction .
For a number of year s, inn ovat ive cr ime a na lyst s a nd criminologist s h ave looked toother discip lines out side the study of cr im in a l behavior for methods of predict in g h ow thefu ture will unfold. Economics, epidemiology, met eorology, an d biology have all offereds ign ifican t con t r ibu t ions , a s their more soph is t ica ted and crea t ive methods for foretellingfu ture frequencies have been a da pt ed t o cr imin ology with var ying degrees of su ccess.
Tr ansport a t ion modeling is t he m ost recent exter na l science to su ggest poten t ia lmea ns of pr edictin g cr imina l beh avior . The success of t r avel-dem and m odeling in thecivilian wor ld of t r anspor ta t ion behavior has p resen ted us with another possible t echn iquewh ich could be ada pt ed to forecast ing cr ime.Tr avel-dem and m odeling offer s a n a lgor ithmfor est im at in g n ot only how much act ivit y will occu r in a given region , bu t a lso howoffender s will t ravel across t he ju r isdict ion to commit t heir crimes. This m odel ha s beenimplemen ted in t he Crim eS tat softwa re applicat ion for u se against crime dat a.
In th is study, we will r eview the applica t ion of th is model a ga in st da ta from themet ropolita n Las Vegas a rea over a period of th ree years.
Th e La s Ve g as Me t ro p oli ta n Are a
Th e La s Vega s m et ropolitan a rea is compr ised of Clark County, Neva da , andsevera l independent municipa lit ies wit h in it . The Las Vegas Met ropolit an PoliceDepar tmen t (LVMP D) ser ves Clark Coun ty (in the capacity of a Sh er iff's Office) as well a sthe Cit y of La s Vega s (in the capa city of a m unicipa l police depa r tmen t ). Although the va stmajor ity of the la nd a rea , popu la t ion, a nd busin esses with in th is a rea a re policed by t heLVMPD, t her e a re t h ree other sign ifican t jur isd ictions: Th e Cit y of Nort h La s Vega s, t heCity of Hender son, an d t he City of Boulder City, each h aving th eir own police depa r tment .

17.24
In addit ion to these import an t sibling agencies, severa l other law en forcementagencies h ave overlappin g ju r isdict ion with in a reas pr incipa lly policed by th e LVMPD: ThePaiu te Tr iba l Police, t he Sout her n Pacific Railwa y Police, t he Neva da Highwa y Pa t rol, USAir Force Secur ity Police, US Air Force Office of Specia l Inves t iga t ions , Federa l Bureau ofInvest iga t ion , Veteran 's Adm inist ra t ion Police, an d oth ers. Alth ough t hese a genciesper form valuable police functions, t he LVMPD u nqu est ionable dea ls with the vast major ityof crime in the vast m ajority of locat ions, mak ing it a n a tt ra ctive can didat e for offendert ravel r esea rch .
In many ways, La s Vegas r esem bles an isla nd. Sur roun ded by bar ren deser t , withvery few roads en ter ing or leaving the city, it is an urban oasis in a spa rsely popu lat eddeser t wilderness, con sis t in g of la rgely im passable ter ra in . This geogr aphic posit ion andisola t ion make Las Vegas h igh ly in terest in g fr om the perspect ive of a t r anspor ta t ion (orcrim e t r ip m ovemen t ) modeler .
Another un ique fea tu re of the Las Vegas a rea is the h igh ly t rans ien t na tu re of thepopula t ion , which fa lls in to th ree discret e ca tegor ies:
1. F ir st , t he Residen t Popula t ion consis t s of some one million persons,approxim ately 880,000 of wh ich live in the ju r isdict ion of the LVMPD (theremain der bein g served pr im ar ily by H enderson and Nor th La s Vegas).These perma nent resident s ar e the ma insta y of th e comm un ity an d th esource for dem ograph ic da ta used by t he censu s burea u and p lanningagencies.
2. Second, we must consider the Vis it or Popula t ion , con sis t in g of some35,000,000 - 40,000,000 per sons per year . On a ny given da y, between 100,000and 500,000 vis itors will be s t aying in the La s Vegas a rea - a crit ical factor int ranspor ta t ion , demogr aphy, and cr im e! These tour is t s somet im es act ascrim e impor ter s (e.g., cr imina l st r eet gangs from n eighborin g Californ iancit ies often visit Las Vegas for weekend mayh em, or more profession a lcr imin a l purposes); in m ost ins tances, however, th ey serve a s a pool of pr eyfor local cr imina ls.
3. Th ird, a nd fina lly, ther e is a su bstan t ia l Homeless P opu la t ion in La s Vega s,drawn by t he seasona lly warm climate and the ease wit h which th is cit y ca nbe r ea ched as a dest ina t ion . Although not famous for a "frien dly" at t itudetoward t he homeless, th ese per sons a re pr otected by law en forcement in La sVega s and are well served by m any ch ar it able socia l inst it u t ion s andservices. Becau se Las Vegas is a lso an ea sy place to sin , homeless in dividua lswit h drug, a lcohol, a nd ga mbling a ddict ion s often gr avit a te here; theposs ibility of "win ning big" and in st an t ly rever sin g a life of misfor tune a lsoweighs in the consider a t ion of many homeless wh o choose t o make t heir ba sein Las Vegas . Although not a major source of annoyance as cr imina ls , norover ly vict im ized by cr im in a ls , t hese persons do const it u te a sign ifican t(alt hough never well-m ea su red) fraction of the loca l popu la t ion, a nd

17.25
ther efore of local cr ime sta t ist ics. However , du e t o th e inability to accura telymeasu re a "home" locat ion for t hese persons when t hey do comm it crimes,few of these h ave been represen ted in th is s tudy.
This study will focu s on the cr im in a l m ovement behavior of the residen t popula t ionof the grea ter Las Vegas met ropolita n a rea .
Source Data Proven ance and Organizat ion
Da ta concern ing the La s Vega s m et ropolitan a rea wa s p rovided by t he La s Vega sMet ropolitan Police Depa r tmen t 's In vest igat ive Division. Often , resea rcher s u nderest imatethe severe difficu lt ies and chronic shor tcomin gs of la w enforcement da ta . Thanks to afir s t -ra te RMS, and a voluminous t act ica l da tabase repos itory, the Las Vegas Met ropolit anPolice Depar tment 's da ta presen ted rela t ively few problems; however , geocodin g a ccuracyissues, m issin g da ta fields from m odus operandi t ables, a nd er roneous a r restee homeloca t ion s resu lt ed in some difficu lt ies. These had to be overcome before any a na lysis ort est ing of new methods wa s possible.
Crime report dat a for t he LVMPD is ma inta ined in a n SQL-Server 7.0 dat abaseconst ructed by the Pr int rak (now owned by Motorola) compa ny, maker s of the Law RMS(LRMS) police r ecords managemen t sys tem used by La s Vegas, a mong other s. Th isrepository cur rent ly houses many hundr eds of thousa nds of cr ime r epor t s, field int erviews,and oth er cr itical police da ta in a well-organ ized, rela t iona l da tabase.
Cr ime r eport s a re filled out by either sworn officers (when taken in t he field) or byst a t ion per sonn el (when report ed in person a t an LVMPD su bst a t ion or city ha ll). Thesepa per report s include ample MO det a il and descr ipt ive informat ion in compa r tmenta lized,"force-choice" fields, a s well a s substan t ia l exposit ory n ar ra t ives. "Forced-choice" fields a realso typically supplement ed by "Oth er" options which can th en be individua lly explained,to dea l with very unusu a l cr ime beh aviors, descrip t ions, or deta ils.
At the end of each sh ift , officers submit their r epor t s t o their ser gean t for review;after a qu ick check to ensure the most basic levels of da ta qua lity a nd in tegr it y, the repor t sa re t hen pla ced in a mailbox for p icku p, which occurs sever a l t imes ea ch day and n ight .Report s a re t r ansferr ed by int radepa r tmenta l cour iers to city ha ll, where they ar e collectedby t he Records Sect ion . P rofession a l da ta en t ry specia list s then met icu lou sly type eachreport in to th e LRMS da taba se.
The data entr y process includes several validat ion a nd err or-tra pping element s.These u su a lly grea t ly enhance the completeness a nd a ccuracy of each report , but a resomet im es bypassed by busy clerks. P erhaps the most sign ifican t va lidit y ch eck which canbe bypassed is t he address ver ificat ion sys tem , wh ich per forms a bru te-force match a gainsta "geofile" of kn own, va lid loca t ions. When a match ing addr ess is en tered int o the syst em,geograph ic coord ina tes and other usefu l da ta is au tomat ica lly p ropaga ted in to the file.Because many cr imes do not occu r a t va lid , documen ted phys ica l s tr eet add res ses (cr imes

17.26
in remote or deser t a reas, or in new const ruct ion zon es, or on buses or in taxi cabs, forexam ple), however , dat a ent ry clerk s h ave grown accust omed t o overr iding the addr essver ifica t ion m odule. Th is is a lso somet imes done in the in ter es t s of speed and expediency,even wh en a valid, ma tchable add ress is p rovided in the cr ime r eport . When th is happen s,the resu lt in g a ddress must be cleaned usin g a da ta clean in g a pplica t ion pr ior tosu ccessfully ma tch ing in a geocoding oper a t ion . Once ent ered int o the LRMS da tabase,crime report inform at ion m ay be extr acted th rough a var iety of sta nda rd m ethods.
The LVMPD rou t in ely downloa ds cr im e repor t s on a da ily basis in to an ATACanalyt ical da taba se wh er e cr ime a na lyst s a nd in vest iga tors can exa mine a nd s tudy t heda ta with out crea t ing any dra g on the pr ima ry server. The ATAC da tabase is st r eamlinedfor ana lys is , and is much eas ier to query and ana lyze than the LRMS repos itory it self. TheATAC da tabases a re Microsoft J et -complian t relat iona l da tabase very sim ilar to the MSAccess 2000 da tabase.
Da ta used for the Next -Genera t ion Offender Crim e Tra vel Model pr oject wereder ived from r ecords s tored in s evera l ATAC an a lyt ica l da tabases crea ted a nd m aint a inedby th e LVMPD Cr ime Ana lysis Section . These da tabases a re a rch ived by ca lendar year andby cr ime ca t egory. The a rch ive dat es for ca lenda r yea r a r e a ss igned based on the yea r ofoccur ren ce. Crim e cat egories a re: Auto Crim es (including motor veh icle t hefts, bu rglar iesfrom motor veh icles, and cr imina l da mage to au tomobiles); Burglar ies (including allburgla ry s t a tu tes); Larcen ies (in clu din g a ll Larceny/Theft st a tu tes); and Persona l(including a ll s exua l offenses , a ssau lt s and aggrava ted as sau lt s , robber ies and homein va sion s, k idnappin gs , a nd homicides).
These da tabases conta in MO, Persons, and Vehicles tables, rela ted by eventnumber . The MO table cont a ins a ll in format ion per t inen t to th e loca t ion, t iming, cat egory,and methods of ea ch cr im e event ; the Persons table a ll in format ion on persona liden t ificat ion , descrip t ion , and h ist ories , not only for suspect and a r restees , bu t a lsovictim s, witnesses, r eport ing pa r t ies , et c.; the Vehicle table a ll in format ion concer n ing anyvehicles which may be in volved in the offense, inclu din g descr ip t ive and iden t ifica t ioninformat ion , whether the veh icle rela tes to the cr imina ls , vict ims , or has some otherrelat ionsh ip to the cr ime.
For purposes of th is project , t he LVMPD author ized access and t ransmission of thecon ten t s of the complete ATAC da tabase inven tory for the Cr ime Ana lys is Sect ion . Of thefifty-odd databases provided , t he Per sona l Cr imes da t abases for t he yea r s 1996 - 2002 wereinitially selected.
D a ta Sc re e n in g
Three broad ca tegor ies were selected from t he complete da ta inventory provided:
1. Confron ta t iona l2. Burgla ry, and 3. Vehicular crimes.

17.27
Th ese in ten t iona lly dispa ra te da ta wer e select ed in the in ter es t s of increa sin g thelat itu de of the st udy. It wa s h ypothesized th a t t r avel beha vior would var y between theseca tegor ies of event s. Confron ta t iona l cr imes included sexua l assa u lts , robberies,kidn appings, a nd m urders. Th ese crim es wer e included in a sin gle group as par t of th isinit ial appr a isa l of the effect iveness of t r avel-dem and m odeling on cr imin a l beha vior , eventhough it is obvious t ha t the beha viors exhibited by offender s a cross t hese crime types a relikely to va ry. These cr im es were gr ouped in spit e of these likely differences becauses imila r it ies in t a rget ing behavior across these cr imes migh t make them amenable tocollect ive ana lysis ; a hypothesis which can be tested usin g t he techniques bu ilt in to thet ravel-dem and m odu le.
Burglar ies used in th is a na lysis included both residen t ia l and commer cialburgla r ies, bu t not burgla r ies from motor veh icles. Only cr im es in which a bu ildin g orpr oper ty was illega lly entered for the pu rpose of theft were included in th is st udy, th erebyelim ina t ing the prolific lar ceny cat egory.
Vehicular crimes included both au to th efts a nd bur glaries from m otor vehicles."Ca r jackin gs" were not specifica lly inclu ded, bu t some au to theft s in which the modusoper andi followed t he confron ta t iona l "ca r jackin g" pa t t ern may ha ve been included whenspecifica lly s t a tu tory designa t ion s were missin g t o differen t ia te these from more typica lau to th efts.
Some opera t iona l definit ions of these crimes a re in order .
1. Sexu a l a ssau lt s used in th is ana lysis in clu ded forcible rapes wit h vict im s ofeit her sex, as well as any ot her physica l, sexu a l a buse of another person ofeit her sex - su ch a s d igita l or objective penet ra t ion , fondling, etc. - and a lsoopen and gr oss lewdness (e.g., "fla sh in g"). S ta tu tory sexu a l seduct ion("sta tu tory ra pe") was excluded.
2. Robber ies used in th is a na lysis included a ll robbery-rela ted st a tu tes in theNeva da Revised Sta tu tes (2002), inclu din g h ome in va sion s.
3. Kidnappin gs were in clu ded in confronta t ion a l cr im es, bu t the applica t ion ofkidnappin g a s a st a tu tory offense by la w en forcem ent in La s Vegas (andelsewhere) may be counter -int u itive to some reader s. Kidna ppin g is oft ena t t ached a s a n add it iona l offense to other crim es, su ch a s r obber ies or sexu a lassau lt s, in any ca se in which the vict im is forcibly moved from one loca t ionto another . This pract ice is used pr im ar ily a s an adjunct to prosecut ion ,because k idnappin g (un like eith er robbery or sexua l assa u lt) is a federa lcr im e, a nd in some cases may be easier to prove in cour t .
4. Homicides used in th is a na lysis included a ll murder st a tu tes, as well a s a llma nslau ght er sta tu tes. No just ified homicides were included.

17.28
Once the ta rget cr im e ca tegor ies have been defin ed, separa te da tabases for each ofthe t h ree categories wer e compiled . Although da ta for severa l years was m ade available, a llbu t th ree year s of da ta were excluded from t he st udy. Dat a pr ior to 1997 was oftenrela t ively poor ly main ta in ed and prepared, a nd somet im es conta in ed ser iou s omission swhich made it u nreliable. Dat a for the year 2002 was incomplete wh en t h is study wascommissioned. Alth ough crime da ta for the year s 1997 and 1998 was fun ct iona lly reliable,socio-economic and t ranspor ta t ion da ta for these years was not read ily obta inable a t thet ime t h is s tudy commen ced; since th ese da ta wer e necessary for im plemen ta t ion of th ismodel, th ese year s, too, were excluded from ana lysis. Ther efore, on ly the year s 1999, 2000,and 2001 wer e in cluded in th is s tudy.
Because th is study focu ses on spa t ia l r ela t ion sh ips between cr im e event loca t ion san d criminal home locat ions, only solved crimes could be used. Crimes were included as"Solved" when an a r res t was made - unfor tuna tely, d ifficu lt ies in obta in ing da ta from thejus t ice syst em and t he long delays in evit able in the prosecut oria l pr ocess m ade itimpossible to ident ify cr imes in wh ich a convict ion had been obta ined; an a r rest was t heclosest approximat ion to a reliable solu t ion possible for th is research .
Of those "solved" crim es in which an ar rest was made, on ly those in which theoffender 's home address and the p recise loca t ion of the cr ime it self were both known cou ldbe used. Even when cr imes were closed by a r rest , an d a dequ a te da ta was a vailable t ogeogr aphica lly p lot and ana lyze the case, some have st ill been excluded. Instances in whichthe offender and vict im both live at the scene of the cr ime h ave been excluded from t heseana lyses, since no t ravel was involved; however, ins tances in which eith er pa r ty lived a tthe scene of the crim e bu t the oth er did not h ave been ret a ined. The r ea soning beh ind t h isdecis ion is tha t the decis ion to commit a cr im e a t a given pla ce does in clu de the decis ion tocommit a crim e in one's own h ome. Ther efore, the spa t ia l t r avel (none) componen t of th isdecision sh ould st ill be r eflected in the m odel if we h ope to event ua lly der ive a validsta t is t ica l r epresen ta t ion of offen der t r avel behavior .
Also, cr ime in wh ich t he offender lived out side t he s tudy a rea (Clark County,Neva da) have been exclu ded in most cases - bu t not a ll. In some cases, "tour is t " offendersmay have been included wh en their t em porary "ba se of oper a t ions" (i.e., local lodgin gs)have been r ecorded. In these ins tances, th e hotel, motel, resort , or pr iva te dwelling th eylived in has been used a s a "home" locat ion for pu rposes of origina t ing a crim e t r ip.
The number of cases u sa ble for each ca tegory of cr ime va r ied significan t ly from yearto year (t able 17.3).
Ta ble 17.3Confrontation al Crime s Available for Ana lysis
Year Tota l Offense s U s ab le Offe n s e s1999 5272 10802000 7560 16432001 3588 991

17.29
The la rge increase in number of offens es from 1999 to 2000 is d ifficult to expla in ;the following su bst an t ial dr op (52%!) is even m ore t roubling. A similar , but inver ted,discrepa ncy em er ges in the frequ en cy of bu rglar ies report ed du r ing those yea rs (Table17.4).
Ta ble 17.4Bu rglary Crime s Available for Ana lysis
Year Tota l Offense s U s ab le Offe n s e s1999 17234 25202000 12899 20402001 16403 2733
A fin a l en igma, m ost sign ifican t of a ll, is obviou s when we look a t the frequency ofau to crim es over the same three-year per iod (table 17.5).
Ta ble 17.5Veh icular Crime s Available for Ana lysis
Year Tota l Offense s U s ab le Offe n s e s1999 6871 6462000 15025 12192001 8349 894
These dispar it ies a re hard to account for .
On the whole, 1999 ha d a middling number of auto theft s a nd confron ta t ions, but ashockin gly h igh number of bu rgla r ies; in 2000, on the other hand, t he confronta t ion s andauto theft s r adica lly increa sed (th e au to cr imes by more t han double!), but bur gla r iesdropped notably. F in a lly, in 2001, confronta t ion a l cr im es drop to the lowest levels (asta ggering decrease), as do au to crimes, while bur glaries leap up t o near ly 1999 levels!
How can we explain these st range fluctu a t ions? Given t he lar ge percent agesinvolved, it's t empt ing to ima gine some change in count ing or report ing pr ocedu res in 2000;however , a scru t in y of t he policies and procedures for the LVMPD does not seem to bearth is ou t . Pr evious year s (1996 - 1999) do not evince a similar wide degree of var iat ion . Thereason or reasons for these crime report ing "mood swin gs" remains unkn own. Is therereason , therefore, to d is t rust these da ta?
For pu rposes of th is st udy, th e answer appea rs t o be, "No." Tha t is, th e da ta usedfor these a na lyses should , even a llowing for as yet -un expla ined vagar ies in report ing,compr ise a repr esen ta t ive sa mple of the report ed crime act ivity in La s Vegas over theseyears.
Sin ce for ecast in g t he frequency of cr im e is a rela t ively min or component of thet ravel-dem and m odel, th ese n umer ic sine-waves shouldn 't cau se u s t oo much concern .

17.30
Instead, s in ce t he focus of th is model is the effect ive expla na t ion and represen ta t ion of thedis t r ibu t ion of crim e t r ip genera tors and cr im e t r ip dest in a t ion s (and, a s a funct ion thereof,of the cr ime t r ip pa ths bet ween them), th e frequencies themselves should mat ter lit t le.
Refere nc e D ata
The Tr affic Ana lysis Zone (TAZ) file for Las Vegas was selected as t he opt imumpolygona l refer en ce them e for th is s tudy (figur e 17.9). This file was p rovided by t heMet ropolit an Pla nnin g Office for Las Vegas, t he Regiona l Transpor ta t ion Com missionthrough the cour tesy of David Gr ana ta , Sen ior GIS Analyst , himself an exper t int ransport a t ion modeling th rough t he use of geogra ph ic informat ion syst ems (GIS). Theda ta provided in clu ded h is tor ica l da ta for 1999, 2000, a nd 2001, enabling m ore accura temodeling of t he im por tance of va r iou s factors lon gitudin a lly a cross t im e. The TAZ da tasetwas pr ovided in ESRI sh apefile format , which is int r ins ica lly legible to the Crim eSt a tapp lica t ion on wh ich t he m odel is t o be built .
The TAZ sh apefile includes informat ion on housing, employmen t , income,popula t ion , r oad mileage, a nd a va r iety of subset da ta specific to par t icu la r types ofemploymen t (e.g., "St r ip" jobs, Nellis Air F orce Base employmen t , ent er t a inm ent -relat edjobs , va cant proper t ies, n umber of pawn shops, et c.).
An addit iona l r eference theme is needed to apply the fina l s t ep in thet ravel-dem and m odel, the net work ass ignmen t met hod. The Ma jor St reet Cen ter line file(LVMAJ SCL.sh p) in ESRI sh apefile format was selected (figure 17.10). Although onlyincluding a r t er ia l s tr eet s , fr eeways , and ma jor t horoughfa res , t h is tr anspor t a t ion networklayer is a ll tha t is n eeded to describe t he va st major ity of t r ips (of an y sor t ) in Las Vega s.Th e addit ion of bu s route in format ion may prove a useful supplementa ry n etwork to futureana lyses usin g th is m odel.
Ass ignmen t o f Cr ime Trips
Dat a from each year, by cat egory, is assigned to a simple ta bular da ta baseconsis t in g of a n iden t ifyin g var ia ble (Event Number as pr im ary k ey), Or igin a t ioncoord ina tes (coord ina tes of the offender 's home address, or loca l base of opera t ions in thecase of externa l offenders), a nd Dest in a t ion coordin a tes (coordin a tes of the cr im e scen e).These da ta were then combin ed in to an MS Access 97® da tabase for ana lys is usingCr im eSta t . F igures 17.11 and 17.12 shows the assigned or igin s and dest ion a t ion s.
Each or igin -dest in a t ion pa ir is t ermed a "Cr im e Tr ip ." Followin g t he reasonin g oft ransport a t ion modelers, it is u nder st ood t ha t offender s t o not leave their h omes, tr aveldirect ly to a cr ime scene to commit a n a t t ack, t hen return home. Ins tead, each "sor t ie" islikely to consist of severa l stages.
For exam ple, a sexua lly pr eda tory offender may get up in the morn ing, leave home,dr ive t o work (stopping for coffee a long t he wa y), th en go out to lun ch before r et urn ing tothe office, then on h is way home depa r t from his u su a l rout e t o dr ive th rough a residen t ia l

Figure-17.9: Traffic Analysis Zones in metropolitan Las Vegas

Figure-17.10: Las Vegas major street centerline network

Figure 17.11: Crime Trip Origins (All Confrontational Crimes, 1999 – 2001)
#
#
#
#
#
#
#
#
#
#
#
#
#
#
#
# #
#
#
#
##
#
##
#
#
#
#
#
#
#
#
#
##
#
#
#
#
#
#
#
#
#
#
#
#
#
#
#
#
#
#
#
#
#
#
#
#
#
#
#
#
#
#
#
#
#
#
##
#
#
#
#
#
#
#
#
##
#
##
#
#
#
#
#
#
#
#
#
#
#
#
#
#
##
##
#
#
##
#
#
#
#
##
#
#
#
#
#
#
#
#
#
#
#
#
##
#
#
#
#
#
#
#
#
#
#
#
#
#
#
#
#
#
#
#
#
#
#
#
#
#
#
#
##
#
#
##
#
#
#
##
#
# #
#
#
#
#
#
#
#
#
#
#
#
#
##
#
##
#
#
#
#
#
#
#
#
#
#
#
#
#
##
#
#
##
#
#
#
#
#
#
#
#
#
#
#
# #
#
#
##
#
#
#
#
#
#
#
#
#
#
##
#
##
#
#
#
##
##
#
#
#
#
#
#
#
#
##
#
#
#
#
#
#
#
#
#
#
##
##
##
#
# #
#
#
#
#
#
#
##
## #
#
#
#
#
#
#
#
#
##
##
#
#
#
#
#
# #
#
#
#
#
##
#
#
##
#
#
##
##
#
#
#
#
#
#
#
#
#
##
#
#
#
#
####
#
#
##
#
###
#
#
#
#
#
##
##
#
#
#
#
#
#
#
#
#
#
#
#
#
#
#
#
#
#
#
#
#
#
#
#
#
#
#
#
#
#
#
##
#
#
##
#
#
#
#
#
#
##
#
##
#
#
##
#
## #
#
#
#
#
#
#
#
#
#
#
#
#
#
#
#
#
#
#
##
#
#
#
#
#
#
#
#
#
#
#
#
#
#
#
#
#
#
#
#
#
##
#
#
#
##
#
#
#
#
#
#
#
#
#
#
#
##
##
#
##
#
##
#
#
#
#
#
#
#
#
#
#
#
##
#
#
#
#
#
#
#
#
#
#
#
#
#
#
#
##
#
#
#
#
###
#
#
#
#
#
#
#
#
#
##
#
#
##
#
#
###
#
#
#
#
#
#
##
#
#
#
#
#
#
#
#
#
#
#
#
#
#
#
#
#
##
# #
#
# #
#
#
#
#
#
#
##
#
#
#
#
#
#
#
#
#
#
#
#
#
#
#
#
#
#
##
#
#
#
#
#
#
#
#
#
#
#
#
#
#
#
#
#
#
#
#
#
#
#
#
#
#
#
#
#
# #
##
#
#
#
#
#
#
###
#
#
#
#
#
#
##
# #
#
#
#
#
#
#
#
#
#
##
#
#
#
#
#
#
#
#
#
#
##
#
##
#
#
#
#
#
#
#
##
#
#
##
#
##
#
#
#
##
##
#
#
#
#
#
#
#
#
#
#
##
#
#
#
#
# #
##
#
#
#
#
#
#
#
#
#
#
#
#
##
#
#
##
#
#
#
#
##
#
#
#
##
#
#
##
##
#
#
#
#
#
#
#
#
#
#
#
#
#
#
#
#
#
#
#
#
##
#
#
#
##
#
#
#
#
#
#
#
##
#
#
#
#
#
#
#
#
#
#
#
#
#
###
#
###
#
#
#
#
###
#
#
###
#
#
#
#
#
#
#
#
#
##
#
#
##
#
###
#
#
#
##
#
#
#
#
#
#
#
#
#
#
#
#
#
#
#
#
#
#
#
#
#
#
#
#
#
#
#
##
#
#
#
#
#
#
#
#
#
#
#
#
#
##
#
#
##
#
#
#
##
#
#
#
#
##
#
#
#
#
#
#
#
#
#
#
#
#
##
###
#
#
#
#
#
#
#
#
#
##
#
#
#
#
#
#
##
#
#
#
#
#
#
#
#
#
#
#
#
#
##
#
#
#
#
#
#
#
#
#
#
#
#
#
#
#
#
#
#
#
#
#
#
#
#
#
#
#
#
#
#
#
#
#
#
#
#
# #
##
#
#
#
##
#
#
#
#
#
#
#
#
#
#
#
#
#
##
##
#
#
#
##
#
#
#
#
#
# #
##
#
#
#
#
#
#
#
#
#
#
#
#
##
#
#
#
#
##
#
#
##
#
#
#
#
#
#
#
#
###
#
#
#
#
#
#
#
#
##
##
#
#
#
#
#
#
#
#
#
#
##
#
#
#
#
#
#
#
#
#
#
#
#
#
#
#
#
#
#
#
#
#
#
#
#
# #
#
#
##
#
###
#
#
#
#
##
##
#
#
#
#
#
#
#
#
#
#
##
#
#
#
#
#
##
#
#
#
#
#
#
#
#
##
#
#
#
#
#
#
#
#
#
#
#
#
#
#
#
#
#
#
#
#
#
#
#
#
#
#
#
##
#
#
#
#
#
#
##
#
#
##
#
#
#
#
#
#
#
#
#
#
#
#
#
#
#
#
#
#
#
#
#
#
##
##
#
#
##
#
#
#
#
#
##
#
#
#
#
#
#
#
#
##
#
#
#
#
##
#
#
#
###
#
#
# #
#
#
#
#
##
#
#
#
#
##
#
#
#
#
#
#
#
#
#
#
#
#
###
#
#
##
#
#
#
#
#
#
#
#
#
#
#
#
##
#
#
##
# ##
#
#
#
#
#
##
#
#
##
##
##
#
#
#
#
#
#
#
#
#
#
#
#
#
#
##
#
#
#
#
#
#
#
###
##
#
##
#
##
#
#
#
#
# #
#
#
#
#
#
#
##
#
#
#
#
#
#
#
#
#
#
#
#
#
#
#
#
#
##
#
#
#
#
#
#
##
#
#
#
#
#
#
#
#
#
#
#
#
#
#
##
#
#
#
#
#
#
#
#
#
#
#
#
#
#
##
#
#
#
#
#
#
##
##
#
#
#
#
#
#
#
#
#
#
#
#
#
#
#

Figure 17.12: Crime Trip Destinations (All Confrontational Crimes, 1999 – 2001)
# #
#
#
#
#
#
#
#
#
#
#
#
#
#
#
#
#
#
#
#
#
#
#
#
#
#
#
#
#
#
#
#
#
#
#
#
#
#
#
#
#
#
#
#
#
#
#
#
#
#
#
#
#
#
#
#
#
#
#
#
#
#
#
#
#
#
#
#
#
#
#
#
#
#
#
#
#
#
#
#
#
#
#
#
#
#
#
#
#
#
#
#
#
#
#
#
#
#
#
#
##
#
#
#
#
#
##
#
#
#
#
#
#
#
#
##
#
#
#
#
#
#
#
#
#
#
#
#
#
#
#
#
#
#
#
#
#
#
#
##
#
#
#
#
#
#
#
#
#
##
#
#
##
#
#
#
#
#
#
#
#
#
#
#
# #
##
#
#
#
#
#
#
#
#
#
#
#
#
#
#
#
#
#
#
#
#
#
#
#
#
#
#
#
#
#
#
#
#
#
#
#
#
#
#
#
#
#
#
#
#
#
#
#
#
#
#
#
#
#
#
#
#
#
#
#
#
#
##
#
#
#
##
#
#
#
#
#
#
#
#
#
#
#
#
#
#
#
#
#
#
#
#
#
#
#
#
#
#
##
#
#
#
#
#
#
#
##
#
#
##
#
#
##
#
#
#
#
#
#
#
##
#
#
#
#
#
#
# #
#
#
#
##
#
#
#
#
##
##
#
#
#
#
#
#
#
#
#
##
#
#
# ##
#
#
#
#
#
#
#
#
#
#
#
#
#
#
#
#
##
#
#
#
#
#
##
#
#
#
#
#
##
##
#
#
#
#
#
#
#
#
##
#
#
#
#
#
#
#
#
# #
#
### #
#
#
#
#
##
#
#
#
#
#
##
#
#
# #
#
###
#
#
#
#
#
#
#
#
#
#
#
#
#
#
#
#
#
#
#
#
#
#
#
##
#
#
#
##
#
#
#
#
#
#
#
#
#
#
#
#
##
#
#
#
#
#
#
#
#
#
#
#
#
#
#
#
#
#
#
#
#
#
#
#
#
#
#
#
#
##
#
#
#
#
#
#
#
#
#
#
#
#
#
#
#
#
#
#
#
#
#
#
#
#
#
#
##
#
#
#
#
#
#
#
#
#
#
#
#
#
#
#
#
#
#
#
###
#
#
##
#
#
#
#
#
#
#
#
#
#
## #
#
#
#
#
#
#
#
#
#
#
#
# #
#
#
#
#
#
#
#
#
#
#
#
#
#
#
#
#
#
#
#
#
#
#
#
#
#
#
##
#
#
#
#
#
#
#
#
#
#
#
#
#
#
##
#
#
#
#
#
#
#
#
#
#
#
#
#
# #
#
#
#
#
#
#
#
#
#
#
#
#
#
#
#
#
#
#
#
# #
#
#
#
#
#
#
#
#
#
#
#
#
#
#
#
#
#
#
#
#
#
#
#
#
#
#
#
#
#
#
#
#
#
#
#
#
#
##
##
#
#
#
#
#
#
##
#
#
#
#
#
#
#
#
#
#
#
#
#
#
#
#
#
#
#
#
#
#
#
#
#
#
#
#
#
#
# ##
#
#
#
#
#
#
#
#
#
#
#
#
#
#
#
#
#
#
#
#
#
#
#
#
#
#
#
#
#
#
#
#
#
#
#
#
#
#
#
#
#
#
##
#
#
#
#
#
#
#
#
#
#
#
#
##
#
#
#
#
#
#
#
#
#
#
#
#
#
###
#
##
#
#
#
#
#
###
#
#
#
#
#
#
#
#
#
#
#
#
#
#
#
#
#
#
##
#
###
#
#
#
##
#
#
#
#
#
#
#
#
#
#
#
#
#
#
#
#
#
#
#
#
#
#
#
#
#
#
#
#
#
#
#
#
#
#
#
#
#
#
#
#
#
#
##
#
#
#
#
#
#
#
#
#
#
#
#
#
##
#
#
##
#
# #
#
#
#
#
#
#
#
#
#
#
#
#
#
#
#
#
#
#
#
#
#
#
#
#
##
#
##
#
#
#
#
#
#
#
#
#
#
##
#
#
#
#
# #
#
#
#
#
#
#
#
# #
#
##
##
#
#
#
#
#
#
#
#
#
#
#
#
#
#
#
#
#
#
#
# #
# #
#
#
#
#
#
#
##
#
#
#
#
#
#
#
#
##
#
##
#
#
#
#
##
#
#
#
#
#
#
#
#
#
#
#
#
#
#
#
#
#
#
#
#
#
##
#
#
#
#
#
#
#
#
###
#
#
##
#
#
#
#
#
#
#
#
#
#
#
#
#
#
##
#
#
#
#
#
#
#
#
#
#
#
# #
#
#
#
#
#
#
#
#
#
#
#
#
#
#
#
#
#
#
#
#
#
#
#
#
#
#
#
#
#
#
#
#
###
# #
#
#
##
#
#
#
#
#
#
#
#
#
#
#
#
#
#
#
#
#
##
# #
#
#
#
#
#
#
##
##
#
#
#
#
#
#
#
#
#
#
#
#
#
#
#
#
#
##
#
#
#
#
#
#
#
#
##
#
#
#
#
#
#
#
##
#
#
#
#
#
#
#
#
#
#
#
#
#
#
#
#
#
#
#
#
#
#
#
#
#
#
#
##
#
#
#
#
#
#
#
#
#
#
#
#
#
#
#
#
#
# #
##
#
#
#
#
#
#
#
#
#
##
#
#
#
#
#
#
#
#
#
##
#
#
#
#
##
#
#
#
#
#
#
#
#
#
##
#
##
#
#
#
#
#
#
#
#
#
#
#
#
#
#
#
#
#
#
#
#
#
#
#
#
#
#
#
#
#
#
#
#
#
#
#
##
#
#
#
#
#
#
##
#
##
#
# #
#
#
#
#
#
#
#
#
#
#
##
##
#
#
#
#
#
#
#
#
##
#
#
#
#
#
#
#
#
#
#
#
#
#
#
#
#
#
#
#
#
#
#
#
#
#
#
#
#
#
#
#
##
#
#
#
#
#
#
##
#
#
##
#
#
#
#
#
##
#
#
#
#
#
#
#
#
#
#
#
#
#
#
#
#
#
#
#
#
##
##
#
#
#
#
#
##
#
#
#
#
#
#
##
#
#
#
#
#
#
#

17.35
neigh borhood, lookin g for t a rget s for poten t ia l victim s. I f a p romis ing ta rget is obser ved, hemay t hen commit an a t t ack, t hen dr ive back toward h is home area , s toppin g off for ga s ora t a dr ive-th ru restauran t on t he wa y, before parking at h is h ouse. Although th isround-t r ip from home to home consis t s of mult ip le dest in a t ion s, some of which arerepea ted th rough out the day, the wh ole journey is consider ed to be a sin gle "Cr ime Tr ip”.
In some cases, a sin gle offender wa s r esponsible for many cr imes. When th ishappen s, t he single origin is pa ired wit h mult iple dest ina t ions, r esu lt ing in sepa ra te Cr imeTr ips . In oth er cases, one crim e m ay be per pet ra ted by mult iple offen ders. Wh en th ishappen s, ea ch offender 's origin is pa ired wit h the single dest ina t ion , again resu lt ing insepara te Crime Trips.
While it is possible to dist inctly m odel ea ch Cr ime Tr ip ba sed on pr ecise spa t ia lloca t ions, it is genera lly accep ted to aggrega te both or igins and des t ina t ions to the cen t roidof each Tra ffic Ana lys is Zone. Th is enables the spa t ia l a ssignment of TAZ var iables such asin come and popula t ion to the aggrega te frequencies of bot h or igin s and dest in a t ion s.
This assignment is per formed in Cr im eSta t by cen t roid a lloca t ion - the nearest TAZcent roid is used t o assign the TAZ da ta to each origin and dest ina t ion . This m et hod isfas ter and s impler than "poin t -in -polygon" spa t ia l aggrega t ion and assignment , bu t shou ldresu lt in compara t ively few mis taken assignments due to unusua l TAZ polygon shape ordis t r ibu t ion . Sin ce Crime Tr ip da ta is a ggrega ted to th e zona l level, ther efore, the r esu lt ingana lyses and forecas t s a re only a pp licable t o th is level a nd cannot m ea ningfu llydisaggrega ted to a more refin ed resolu t ion .
The accepted t ravel-demand model fr amework conta in s a bu ilt -in "er ror factor" forext er na l t r ips - tha t is, crime t r ips origina t ing with in the study a rea bu t havingdest ina t ions falling ou t side t he area , or , conversely, or igina t ing ou t side t he st udy ar ea buthaving in terna l dest ina t ions. These "exter na l tr ips" were cu lled from the cr ime da tabasedur in g t he da ta screen in g process; therefore, "Ext erna l Zon e" da ta is in applicable to thetr ip genera tion st age of th e ana lysis.
Trip Gene ration
Each origin/dest ina t ion pa ir having been aggrega ted to th e TAZ polygon layer , it isnow possible t o evalu a te t he r ela t ionsh ip between socio-economic var iables available in theTAZ da tabase with the frequency of cr ime origins a nd des t ina t ions. This is a ccomplishedthrough regression modeling, and m ay pr ove one of the m ost useful s ingle feat ures in thenew modeling capa bilit ies of the Crim eS tat applica t ion .
There are two main r egression opt ions a vailable in t he software a t pr esen t :Ordinary Least Squares (OLS) and P oisson. The P oisson est ima t ion a lso includes asepara te opt ion which a llows backward elimin a t ion of va r ia bles. This opt ion , P oissonRegress ion with Backwa rd E limina t ion , was the most effect ive of the techniques evalua ted,resu lt in g in consis t en t ly bet t er visua l fit s to the da ta and lower residua ls . This very u seful

17.36
st ep exam ines each var iable elemen t su ggest ed by th e ana lyst for its pr edict ive value as acoefficien t in est im at in g t he frequency of eit her or igin s or dest in a t ion s by TAZ.
In every case, th ree var iables with in t he TAZ da tabase for Las Vegas pr ovedconsis ten t ly useful a s predict ive measures:
1. In come, 2. Populat ion, and 3. Tota l Employmen t .
The m ea su rable successfu lness of these va r iables to accoun t for the predicta bledist r ibut ion of both or igins a nd dest ina t ions was somewhat counter-intu itive; it wa ssu spected pr ior to th e app lica t ion of th is m odel tha t oth er var iables (in pa r t icula r thenumber of pawn shops, t he number of St r ip employment oppor tun it ies, a nd the number ofNellis AFB employment oppor tun it ies) would be cr it ica l predict ors of cr im e. In fact ,however, a ll of these var iables dem onst ra ted st rong mu lticolinea r ity with the th reepr im ary var ia bles list ed above. When these other , ext raneous factors were excluded fromthe regression process, th e effect iveness of the model's pr edict ive capa bilities wassubsta nt ially impr oved.
A su ggest ed a nd a ccept ed t ravel-dem and m odeling t echniques widely implemen tedby t ransport a t ion pla nner s is the adopt ion of “special gen er a tor” var iables to expla inunusu a l or un ique factors im plicit in some a reas. It was expected t ha t Nellis AFB, th e LasVega s St r ip it self, and some other seemin gly s ign ifican t factors would likely fill t he role of"special gen er a tor;" however , resu lt s in dicated tha t none of th ese were a s effective in apr edict ive or explan a tory role as In come, Popula t ion , an d Tota l Em ploymen t .
La t itudin a l forecast ing of cr ime t r ip or igins a nd dest ina t ions per formed fair ly well;compar ison of expected versus observed t r ip numbers did not match par t icu la r ly well, bu tthe rela t ive dis t r ibu t ion by TAZ was a very close match (figu res 17.13-17.16).
Longitudin a l forecast ing of crim e t r ip fr equ en cy by da ta from one yea r to th e n extyea r per formed very poor ly; th is is pr obably an ar t ifact of the st ill-unexpla ined dr ast icvar ia t ion in frequency between the th ree years cons idered in th is study. Resu lt s from otheryea rs, or oth er jur isd ictions, m ay exem plify ver y differen t find ings.
Side-by-s ide compar ison of observed and predict ed cr im e t r ip or igin s revea ls somepersu asive sim ila r it ies , bu t sign ifican t discrepa ncies, a lso (figures 17.17 a nd 17.18). Ingener a l, relat ive pr oport ions a re very accura tely described, but sm aller-producing zonesare somewh at under est ima ted (th e model seem s t o per form bet t er on zones with h igherproductions).
Side-by-s ide compar ison of observed versus predict ed cr im e t r ip dest in a t ion ssu ggest s t ha t , propor t iona lly, th e model again per forms very well, pa r t icu lar ly on zoneswit h h igher product ion scores. Zon es wit h very weak cr im e t r ip dest in a t ion product ion s (ofone or t wo crimes) ar e not a s accur at ely depicted.

Figure 17.13: Relative equal-interval frequency distribution of actual crime trip origins

Figure 17.14: Relative equal-interval frequency distribution of actual crime trip destinations
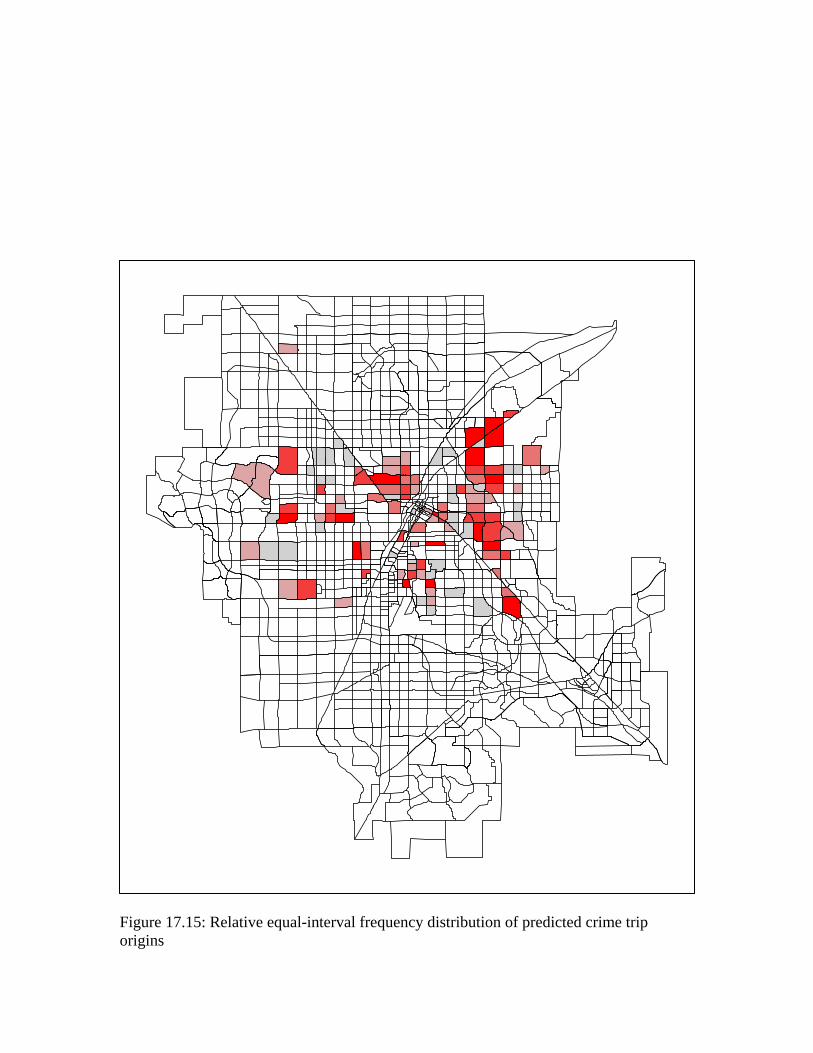
Figure 17.15: Relative equal-interval frequency distribution of predicted crime trip origins

Figure 17.16: Relative equal-interval frequency distribution of predicted crime trip destinations
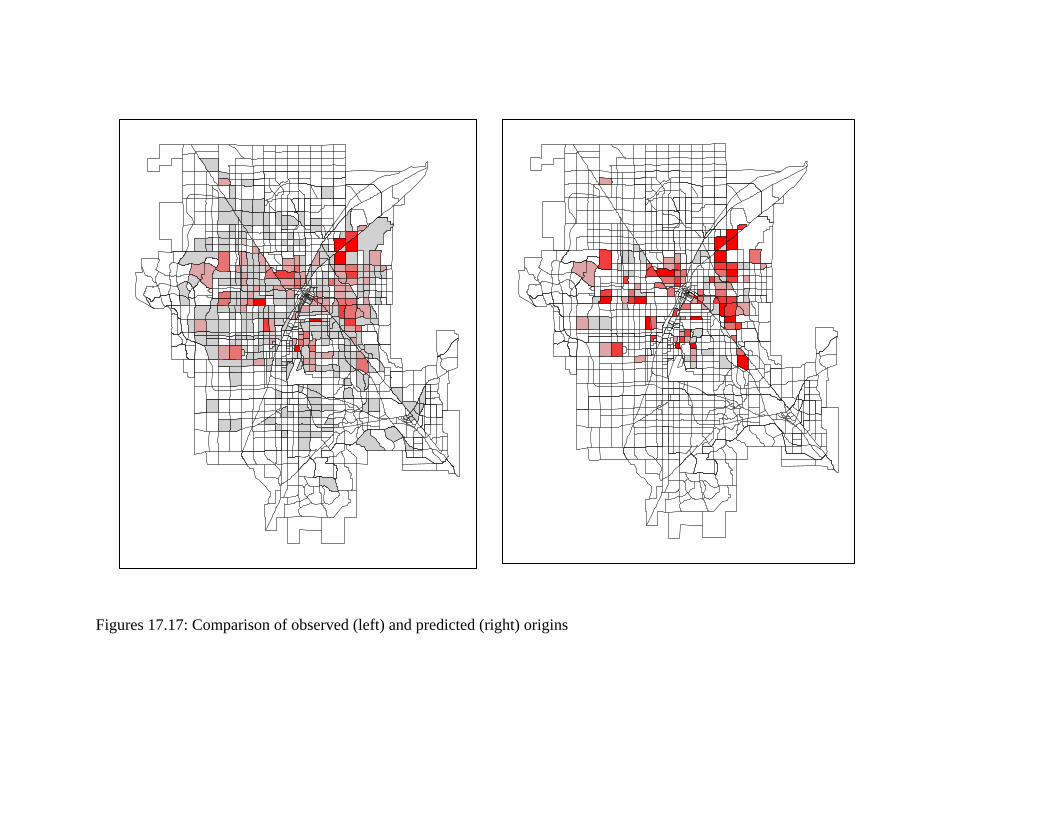
Figures 17.17: Comparison of observed (left) and predicted (right) origins

Figure 17.18: Comparison of observed (left) and predicted (right) destinations

17.43
Trip Dis tribut ion
Assignment of tr ip links between TAZ polygons per formed very well (figu re 17.19).Or igina lly, some concern wa s felt tha t the a ss ignmen t of crim e even t s t o TAZ cent roids(r a ther t han us ing the actua l cr ime scene and home addres s coordina tes ) migh t r esult insignifican t dist or t ion ; however, t h is does not a ppea r to have occur red. Compa re the raw(actua l) cr ime t r ip lines with the cen t roid -cor rect ed tr ip lines to s ee how nea t ly they ma tch(figure 17.20). The r esu lt ing dis t ance decay and im peda nce functions per form per fect lywell. Ther e are a lmost no discrepa ncies visible to th e naked eye.
Var ious impedan ce fun ction calculat ions were at tem pted in th e cour se of th is stu dy.Even tua lly, an adapt ive (100-bin) norm al in terpolat ion with 100 minim um samples wasselected a s t he bes t fit . However , a nega t ive exponen t ia l impeda nce function a lso fit well,sim ilar to th e Ba lt imore Coun ty and Ch icago models.
Int ra -zona l crime tr ips - th ose having both origin and destina tion within t he sam eTAZ - cannot be d isplayed as lines , s ince they have no length . Ins tead , they can berepr esen ted by point s (figure 17.21). Int er -zona l cr ime t r ips, on the other hand, ar e bet t erdispla yed by lines (figu re 17.22).
In t ra -zon a l cr im e t r ips accounted for 42% of a ll cr im e t r ips overa ll, bu t only 12% ofrobber ies, indicat ing a much longer "hunt ing range" for robbers; th is m ay be in keepingwith the hypothes is tha t the tour is t cor r idors draw robbery cr ime t r ips as des t ina t ionswh ich origina te in oth er neighborh oods . More than 50% of sexua l assau lt s wer e in t ra -zona l, indica t ing a shor t er -than -usua l hun t ing r ange for sexua l a t t acker s , who seem toprefer st r ik in g in their home neighborhoods.
Mode Spl it
Un fort un at ely, th e mode split port ion of th e tra vel-deman d model is th e weak estelement for t he Las Vegas da ta .
Tr anspor ta t ion modes across met ropolit an La s Vegas a re va r ied. Typica l of awestern cit y, the overwhelm in g m ajor it y of r esiden t s rely on pr iva te au tomobiles fort ransport a t ion, a s do ma ny tour ist visit ors . However , th is m ainst ay is supp lem en ted by arobust bu s syst em , as well a s a lt er na te per sona l t r ansport a t ion for short t r ips (i.e.,wa lking, bicycling, or scooters). The p icture of au tomobile t r ansport a t ion is somewh atmuddled by t he h igher than usua l dependency on taxi-cabs and limousin es fortr an sport at ion by out -of-sta te visitors.
Data provided by t he LVMPD in clu ded a field ca lled "Method of Depar ture" wh ichwas in tended to conta in in format ion about how the offen der depar ted the scen e of thecrim e, wh ich in tu rn would have been an effective wa y of ca lcula t ing pr obable mode sp litfor cr ime t r ips sampled . Unfor tuna tely, th is da ta field was blank in the overwhelming

Figure 17.19: Raw Crime Trip Links

Figure 17.20: Actual (left) and Predicted (right) TAZ-centric crime trip links

Figure 17.21: Predicted Intra-zonal crime trips
#
#
#
#
#
#
#
##
#
#
#
##
#
#
#
#
#
#
#
#
#
#
#
#
#
#
#
#
#
#
#
#
#
#
##
#
#
#
#
#
#
#
#
#
##
#
#
#
#
#
#
#
#
#
#
#
#
#
#
##
#
#
#
#
#
#
#
#
#
#
#
#
#
#
#
#
#
#
##
#
#
#
#
#
#
#
#
##
##
##
#
# #
#
#
#
#
#
# #
#
#
#
#
# #
#
#
#
#
##
# ##
#
#
#
##
#
#
#
#
#
#
#
#
#
##
#
#
#
#
#
#
#
#
#
#
#
#
#
#
#
#
##
###
#
#
##
# #
#
#
#
#
##
#
#
##
#
#
##
#
#
#
#
#
#
#
#
#
#
#
#
#
#
#
#
#
#
#
#
#
#
#
#
# #
#
#
#
##
#
##
#
#
#
#
#
#
#
#
#
#
#
#
#
#
#
##
##
#
# #
##
#
#
#
#
#
##
#
#
#
#
##
#
#
#
#
#
#
# ##
#
#
#
#
##
#
#
#
##
#
#
#
#
#
##
#
#
#
#
#
#
##
##
#
# ##
#
#
#
#
#
#
#
#
#
#
#
##
##
#
#
#
#
#
#
##
#
#
#
##
#
#
#
#
###
#
#
#
#
#
#
#
#
#
#
###
#
##
#
#
#
#
#
##
#
#
#
#
#
#
#
#
#
#
#
#
#
#
#
#
#
#
###
#
#
#
##
#
#
#
#
#
##
#
#
##
##
# #
#
##
#
###
#
##
#
#
##
#
#
#
#
#
#
##
#
#
#
#
# #
#
#
#
#
##
#
#
#
#
#
#
##
##
#
#
#
#
#
#
#
##
#
#
#
#
# #
#
#
#
#
#
#
#
#
#
#
##
#
#
#
#
#
#
#
#
#
#
#
#
#
#
#
#
#
#
#
#
#
##
#
#
###
#
##
#
#
#
#
#
#
##
##
#
#
#
#
#
#
#
#
#
#
#
#
#
#
##
#
#
#
#
#
#
#
#
#
#
#
##
#
#
#
#
#
#
##
#
#
#
#
#
#
#
#
#
#
##
#
#
#
#
#
#
#
#
#
##
#
#
#
#
#
#
#
#
#
#
#
#
#
#
#
#
#
#
#
#
##
#
#
##
#
#
#
#
#
#
#
#
# #
#
#
#
#
#
##
#
#
#
#
#
#
##
##
#
#
#
#
##
#
#
#
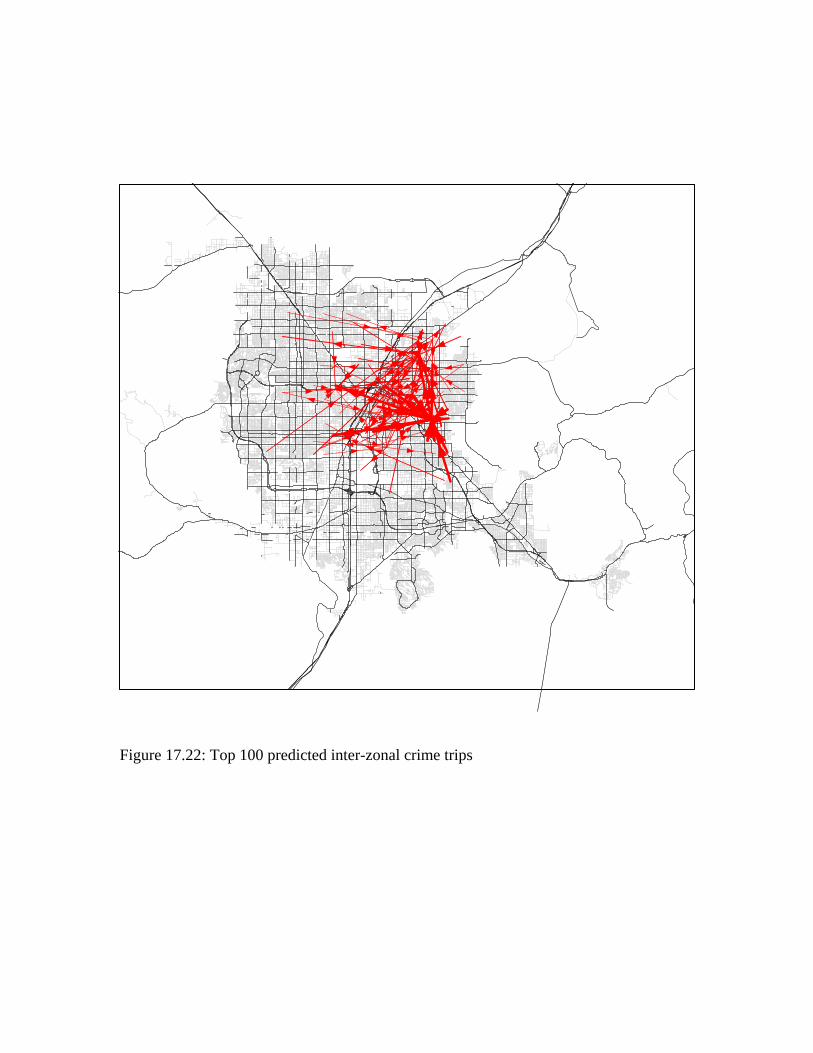
Figure 17.22: Top 100 predicted inter-zonal crime trips

17.48
major ity of cases (approximately 4% cont a ined en t r ies, and only 75% of th ese - 3% over a ll -conta in ed apparen t ly va lid da ta ).
Therefore, a ny empir ica l est im at ion of mode split for these da ta requir es in ferencefrom other da t a . For example, au to theft cr imes may safely be a ssumed to use a ca r t opr ovide t r ansport a t ion for a t lea st some port ion of th e cr ime t r ip. In oth er cases , thepla in-text nar ra t ive includes veh icle descript ions or st a tements a bout how the offendermoved tha t were not dis t illed in to the correct field . Unfor tuna tely, t he la rge volume ofcases makes recover ing in format ion from these free na r ra t ives impract ica l for the smallnumber of cases in which mode sp lit informat ion can beneficially be der ived.
Du e t o th is la ck of reliable da ta , on ly two mode sp lit opt ions wer e included in th isana lysis : Wa lk in g a nd Dr ivin g. Defau lt im pedance funct ion s proved very a cceptable forboth modes : Inver se Exponen t ia l for wa lking t r ips and Lognormal for dr iving.
N e tw o rk As sig n m en t
Th e complete s t reet center line (SCL) file for the m et ropolitan La s Vega s a rea wa savailable in a rout able format (topologica lly rectified ESRI Sh apefile); however , th is filepr oved pr ohibit ively large and u nwieldy for t he A* sh ort est -pa th /leas t -cost a lgor ithmimplemen ted in Crim eS tat. In st ea d of the complete SCL da ta layer , a layer consis t ing on lyof a r t er ial st r eet s a nd freewa ys was u sed in st ead. This m ajor roads file pr oved adequa te tonea t ly expla in in g t he probable t r anspor ta t ion pa th choices made by t he top 100 and top300 in ter -zona l cr im e t r ips (figu res 17.23 and 17.24).
In gener a l, the visu a l goodn ess-of-fit for pr edicted crime t r ips impr oved as thecategory of cr ime was narrowed. Predict ions from one year to the next remained weak,probably as a resu lt of the as-yet -unexpla in ed radica l va r ia nce in cr im e frequencies acrossa ll st udies cat egor ies; however, with in d iscrete cr ime cat egor ies pr edict ive capa bilit ieswere somet imes visu a lly impressive.
Mode ling Auto The ft Site to Re cove ry Site
In the case of au to theft s, a n a t t empt was made to isola te the movement fromvehicle theft sit e to veh icle recovery s it e, r a ther than use the theft sit e and offender homeloca t ion as the des t ina t ion and or igin , r espect ively, of the cr ime t r ip . It was hoped tha t th isvar ia t ion of the t r avel-demand model for cr ime t r ip ana lys is migh t p rove more usefu l forth is type of da ta than home-based cr im e t r ips, pa r t ly because more accura te loca t ioninformat ion wa s a vailable for recovery sit es than for home locat ions, a s well a s becau se itwa s h ypothesized tha t the t heft /recover y "t r ip" segmen t might pr ove more represen ta t iveth an th e home/th eft t rip.
Resu lts for au to theft s a ppea red wea k, with pr edicted crime t r ips m uch longer t hanthe obs erved (figure 17.25). While the obs erved t r ips focused t igh t ly on the cen t ra l cor earea s a nd den sely-popu la ted residen t ia l zones, the predicted t r ips seem ed to skir t theedges of the met ropolit an a rea . This is possibly due to an im plied over -emphasis on

Figure 17.23: Top 100 Inter-zonal Crime Trips as allocated to Major Streets Network

Figure 17.24: Top 300 Crime Trips (Intra- and Inter-zonal) as allocated to Major Streets Network
#
#
#
#
#
#
#
##
#
#
#
##
#
#
#
#
#
#
#
#
#
#
#
#
#
#
#
#
#
#
#
#
#
#
##
#
#
#
#
#
#
#
#
#
##
#
#
#
#
#
#
#
#
#
#
#
#
#
#
##
#
#
#
#
#
#
#
#
#
#
#
#
#
#
#
#
#
#
##
#
#
#
#
#
#
#
#
##
##
##
#
# #
#
#
#
#
#
# #
#
#
#
#
# #
#
#
#
#
##
# ##
#
#
#
##
#
#
#
#
#
#
#
#
#
##
#
#
#
#
#
#
#
#
#
#
#
#
#
#
#
#
##
###
#
#
##
# #
#
#
#
#
##
#
#
##
#
#
##
#
#
#
#
#
#
#
#
#
#
#
#
#
#
#
#
#
#
#
#
#
#
#
#
# #
#
#
#
##
#
##
#
#
#
#
#
#
#
#
#
#
#
#
#
#
#
##
##
#
# #
##
#
#
#
#
#
##
#
#
#
#
##
#
#
#
#
#
#
# ##
#
#
#
#
##
#
#
#
##
#
#
#
#
#
##
#
#
#
#
#
#
##
##
#
# ##
#
#
#
#
#
#
#
#
#
#
#
##
##
#
#
#
#
#
#
##
#
#
#
##
#
#
#
#
###
#
#
#
#
#
#
#
#
#
#
###
#
##
#
#
#
#
#
##
#
#
#
#
#
#
#
#
#
#
#
#
#
#
#
#
#
#
###
#
#
#
##
#
#
#
#
#
##
#
#
##
##
# #
#
##
#
###
#
##
#
#
##
#
#
#
#
#
#
##
#
#
#
#
# #
#
#
#
#
##
#
#
#
#
#
#
##
##
#
#
#
#
#
#
#
##
#
#
#
#
# #
#
#
#
#
#
#
#
#
#
#
##
#
#
#
#
#
#
#
#
#
#
#
#
#
#
#
#
#
#
#
#
#
##
#
#
###
#
##
#
#
#
#
#
#
##
##
#
#
#
#
#
#
#
#
#
#
#
#
#
#
##
#
#
#
#
#
#
#
#
#
#
#
##
#
#
#
#
#
#
##
#
#
#
#
#
#
#
#
#
#
##
#
#
#
#
#
#
#
#
#
##
#
#
#
#
#
#
#
#
#
#
#
#
#
#
#
#
#
#
#
#
##
#
#
##
#
#
#
#
#
#
#
#
# #
#
#
#
#
#
##
#
#
#
#
#
#
##
##
#
#
#
#
##
#
#
#

Figure 17.25: Observed (left) and Predicted (right) Top 100 Auto Theft Crime Trips as Allocated to Major Street Network

17.52
freeway tr avel which may be cor rect ible with bet t er network-alloca t ion pa rameters. Themedian distan ce for observed crime tr ips was 2.3 miles.
R e si de n ti al B u rg la ri e s
Differen t iat ion of residen t ial from commercial or au to bur gla r ies was a ccomplishedby th ree filter ing cr iter ia: Sta tu te, Pr emise, an d Zoning. Some specific Nevada RevisedSt a tu tes h ave been r eser ved for residen t ial burgla r ies; bur gla r ies in wh ich these st a tueswere cited were therefore accept ed a s r esiden t ial in n a ture. Cat egor ica l Pr emise type da tawa s provided in the MO da ta for each cr ime; when th is da ta explicit ly noted a residen t ia lsit e, these cases wer e a lso accepted as r esiden t ia l.
Some bu rglar ies didn 't specifically include a residen t ia l st a tue or explicitlyresiden t ia l premise code; bu t were spa t ia lly loca ted in a reas of the ju r isdict ion reserved forresiden t ial r a ther than commercial, indu st r ial, or other zoning pu rposes. These cases wer etherefore a lso accept ed a s r esiden t ial in cha racter .
Resu lt s for ana lysis of residen t ia l burgla r ies was more promis in g t han for au totheft s, or for burgla r ies overa ll (figure 17.26). While, a ga in , observed cr im e t r ips focused onthe most den sely-popula ted r esiden t ial neighborhoods, and pr edicted crime t r ips wer emuch longer and spr ea d m ore fa r a field, th is spr ea d was m uch smaller than tha t seen inau to theft s and more closely conformed to the obs erved dis t r ibu t ion . The media n dis t ancefor r esidential bur glary crime tr ips was 1.1 miles.
Se xu al Assau lts
The spa t ial dist r ibut ion of sexua l assa u lt crim e t r ips in m any ways seem ed t o inver tth e problems seen in t he pr edicted crime t rips for a ut o th efts a nd r esident ial bur glar ies. Inthe previous examples, a n obser ved t en dency toward cen t ra lity seemed to be confused witha pr edicted t enden cy towar d dispersion toward out lying a reas. In th is case, however, a verynebulous, ou t lying dist r ibut ion of obser ved cr ime t r ips (cen ter ing in t h ree fa int clus ter sa round t he per imet er of the cen t ra l met ropolita n region) was observed. The p redictedcrim e t r ip d ist r ibu t ion mist aken ly emph asized cent ra l area s, a nd seem ed to complet ely failto predict the southeastern-most "cluster" of cr im e t r ips (figu re 17.27).
The la rge median crim e t r ip len gth for sexua l assau lt s - 3.2 miles - may help expla inthe r ela t ively poor pr edictiven ess of these r esu lt s. Differen t impeda nce functions willpr obably help improve th e reliability of th is model against these t ypes of cr imes .
R ob be ri e s
Robber y crim e t r ips in La s Vega s a ppea r to closely para llel t he m ajor gaming andt ransport a t ion cor r idors r unning nort h to sou th th rough the center of the m et ropolitanarea (figure 17.28). The visua l fit of predict ed aga in st obs erved cr im e t r ips was mostimpressive aga ins t these cases . Alth ough t he pr edicted crime t r ip dist r ibut ion appea rsmore compa ct an d cent ra lized th an the observed, the directiona lity an d pola r ity of the two

Figure 17.26: Observed (left) and Predicted (right) Top 100 Residential Burglary Crime Trips as Allocated to Major Street Network
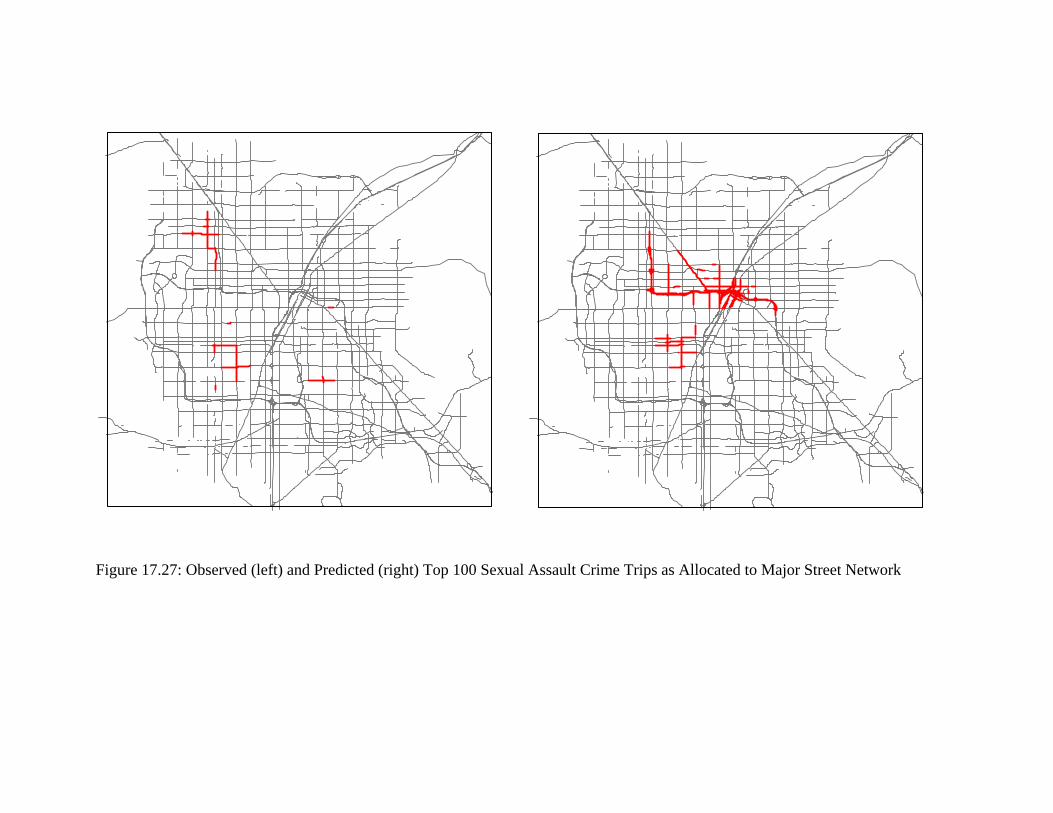
Figure 17.27: Observed (left) and Predicted (right) Top 100 Sexual Assault Crime Trips as Allocated to Major Street Network

Figure 17.28: Observed (left) and Predicted (right) Top 100 Robbery Crime Trips as Allocated to Major Street Network

17.56
para llel n icely, a nd make a st r ik in g visua l m atch . The media n cr im e t r ip dis t ance forrobberies was 2.3 miles.
Conclus ions: Las Vegas
Overa ll, the model appea red t o per form well in some ways, but weaker in oth ers.On e of the m ost t roubling pr oblems facing t he eva lua t ion of th e n et work ass ignmen t st ageof the model is the lack of any good fina l met r ic other than visua l approximat ion fordeter mining the va lue of the r esu lt ing pr ediction. Some m ea su rem en t of congruen ce isneeded to ma ke th e determ inat ion of usefulness reliable an d valid.
The firs t st age of the m odel - cr ime t r ip gen er a t ion , is a rguably the m ost useful t ola w enforcement . This elega nt ly sim ple model ca n readily be adapted to differen t types ofda ta , and with the for thcoming inclus ion of addit iona l regr ession met hods (specifica lly thenegat ive binomia l dist r ibut ion model) to su pplem ent the exist ing ordinary least squ ares(OLS) and P oisson va r ian t s, t h is fea ture is lik ely to rem ain useful for the foreseea blefu tu re.
The second s tage of the m odel - cr ime t r ip d ist r ibu t ion , is a lso poten t ia lly highlyuseful. The ana lysis n ot merely of where offender s live, or where cr imes a re committ ed, butof the t r avel a nd t ranspor ta t ion decis ion s linkin g t he two loca t ion s, m ay h ave sign ifican trepercussion s for cr im e ana lyst s. This type of ana lysis will be par t icu la r ly usefu l forst ra tegic and a dm inist ra t ive ana lyst s wh en recommending ma npower a lloca t ion , beatboundar ies and p recinct /d is t r ict configura t ion schemes , and assessing the impact of majordevelopments such as t r anspor ta t ion cor r idors , shopping malls , or spor t s complexes on thedist r ibut ion of cr ime.
The mode sp lit st age of the model was difficu lt t o apply meaningfully to the LasVegas dat a in th is study, because of deficiencies in the dat a it s elf. E ither t r anspor t a t ionchoice values wer e n ot r ecorded, or wer e r ecorded in ir ret r ieva ble form ats, m aking anem pir ical eva lua t ion of offen ders' t r ansport a t ion choice proclivit ies impr actica l. Fa iling theava ilabilit y of empir ica l da ta , fa llin g back on overa ll t r ends in public t r anspor ta t ion choiceare a ll tha t is possible for the ana lyst . Since it is possible tha t cr ime t r ips m ay bequa lita t ively differen t than other types of t r ips on wh ich these st a t ist ica l models ha ve beenbased, fu r ther resea rch is required to asses s wh ether or not these st anda rds will beapplicable to cr im in a l behavior .
Th e fina l st age of the m odel - net work ass ignmen t , fun ctioned mechanically a sexpected, bu t did resu lt in some poten t ia lly weak resu lt s (such as overemphasis on thespeed of freewa ys a pparen t in some r esu lt s) wh ich m ay be overcome wit h bet t er mode sp litan d network choice para met ers.
One aspect of the model tha t caused for init ial concern , th e aggregat ion of cr imes tothe Traffic An a lysis Zone polygon level, proved to have no sign ifican t im pact on theresu lt in g a na lysis . The TAZ st ructure seems admir ably su it ed to ana lysis of th is sor t ofmovemen t - as indeed one m ight expect from its pr ovena nce.

17.57
The most successfu l predict ive va r ia bles for est im at in g cr im e t r ip product ion ,wh et her of origin s or dest ina t ions , wer e in fallib ly Tota l Popu la t ion, Tota l Employmen t , andIn come. In clus ion of addit iona l var iables dis tort ed ra ther than impr oved t he predictiveva lu e of the model, most of the t im e wit h measurable mult icolin ear it y which was nota lwa ys a pparen t a pr ior i.
With the mechanica l a spect s of the model - a s im plemented in the la test ver sion ofCrim eS tat, complete and funct ion ing cor rect ly, it remains to be lear ned h ow to bet t ercalibr a te and im plemen t the m odel to ma ke it an effective tool for la w en forcemen t ana lysisand p lanning.