Chapter 16 Exploring, Displaying, and Examining Data McGraw-Hill/Irwin Business Research Methods,...
32
Chapter Chapter 16 16 Exploring, Exploring, Displaying, Displaying, and and Examining Examining Data Data McGraw-Hill/Irwin Business Research Methods, 10e Copyright © 2008 by The McGraw-Hill Companies, Inc. All Rights Reserved.
-
date post
20-Dec-2015 -
Category
Documents
-
view
257 -
download
2
Transcript of Chapter 16 Exploring, Displaying, and Examining Data McGraw-Hill/Irwin Business Research Methods,...

Chapter 16Chapter 16
Exploring, Exploring, Displaying, and Displaying, and Examining DataExamining Data
McGraw-Hill/IrwinBusiness Research Methods, 10e
Copyright © 2008 by The McGraw-Hill Companies, Inc. All Rights Reserved.

16-2
Learning Objectives
Understand . . .• That exploratory data analysis techniques
provide insights and data diagnostics by emphasizing visual representations of the data.
• How cross-tabulation is used to examine relationships involving categorical variables, serves as a framework for later statistical testing, and makes an efficient tool for data visualization and later decision-making.

16-3
PulsePoint: Research Revelation
67 The percent of college students who see nothing unethical about swapping or downloading digital copyrighted files (software, music, movies) without paying for them.
16-4
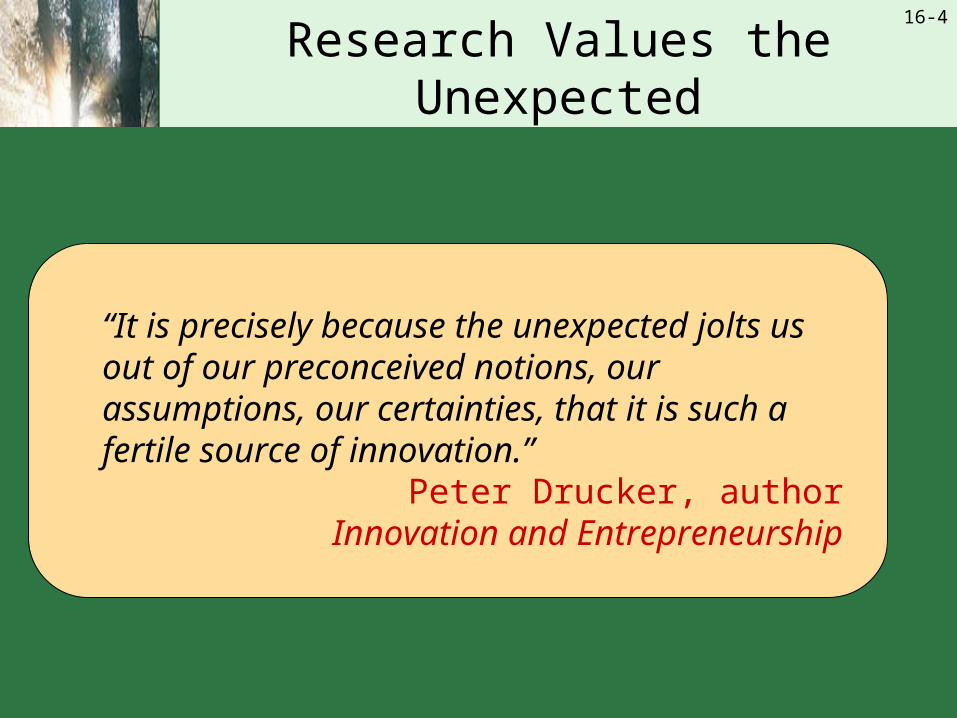
Research Values the Unexpected
“It is precisely because the unexpected jolts us out of our preconceived notions, our assumptions, our certainties, that it is such a fertile source of innovation.”
Peter Drucker, authorInnovation and Entrepreneurship
16-5
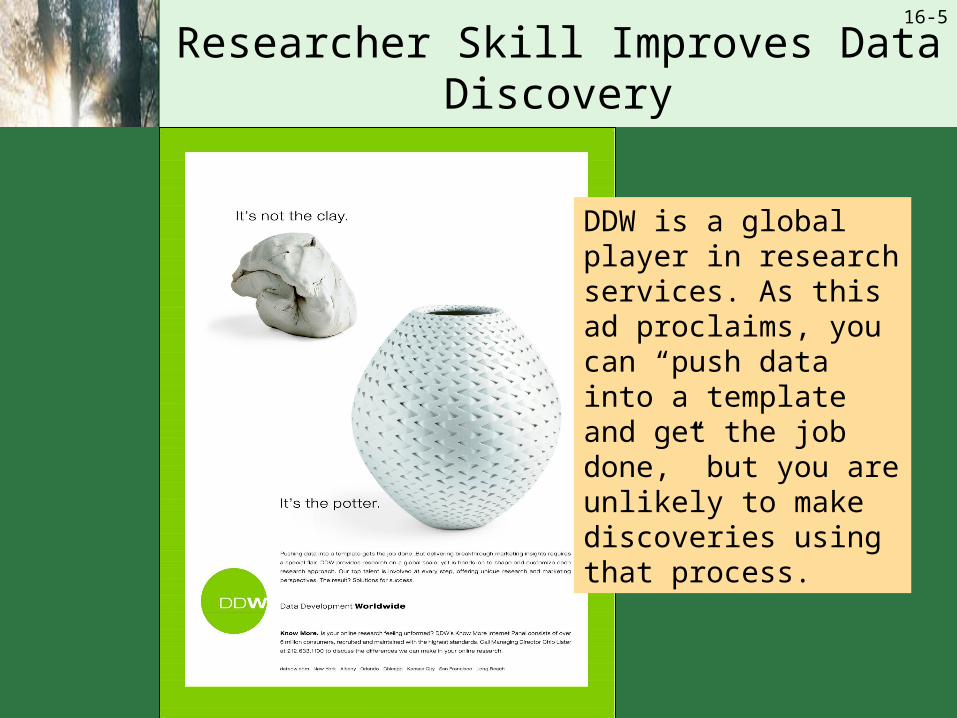
Researcher Skill Improves Data Discovery
DDW is a global player in research services. As this ad proclaims, you can “push data into a template and get the job done,” but you are unlikely to make discoveries using that process.

16-6
Exploratory Data Analysis
ConfirmatoryExploratory

16-7
Data Exploration, Examination, and Analysis in the Research Process

16-8
Frequency of Ad Recall
Value Label Value Frequency Percent Valid Cumulative Percent Percent
16-9
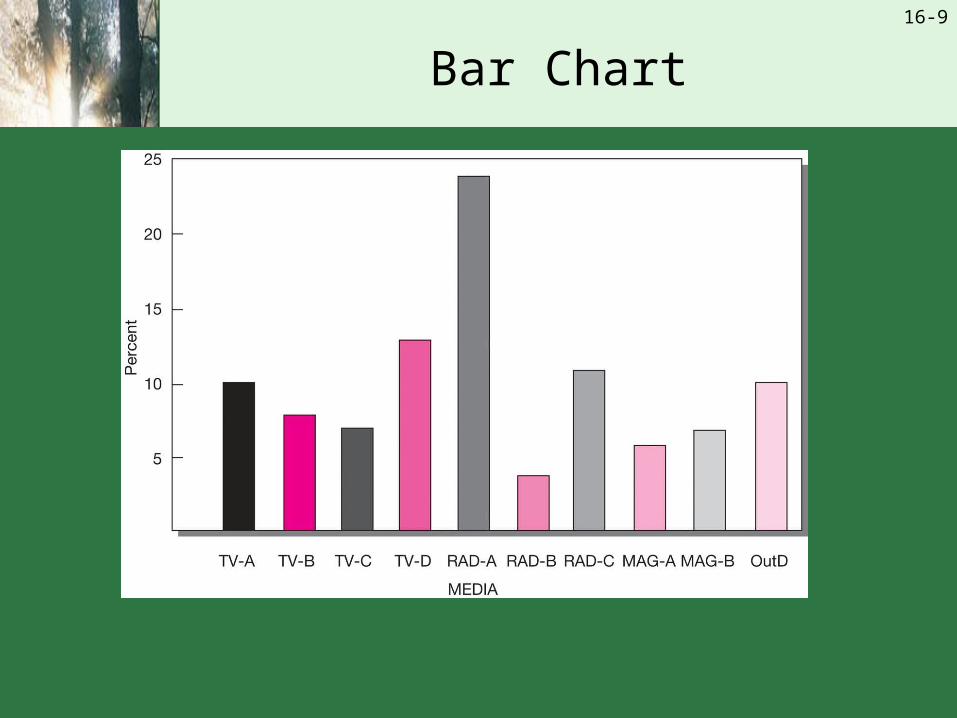
Bar Chart
16-10
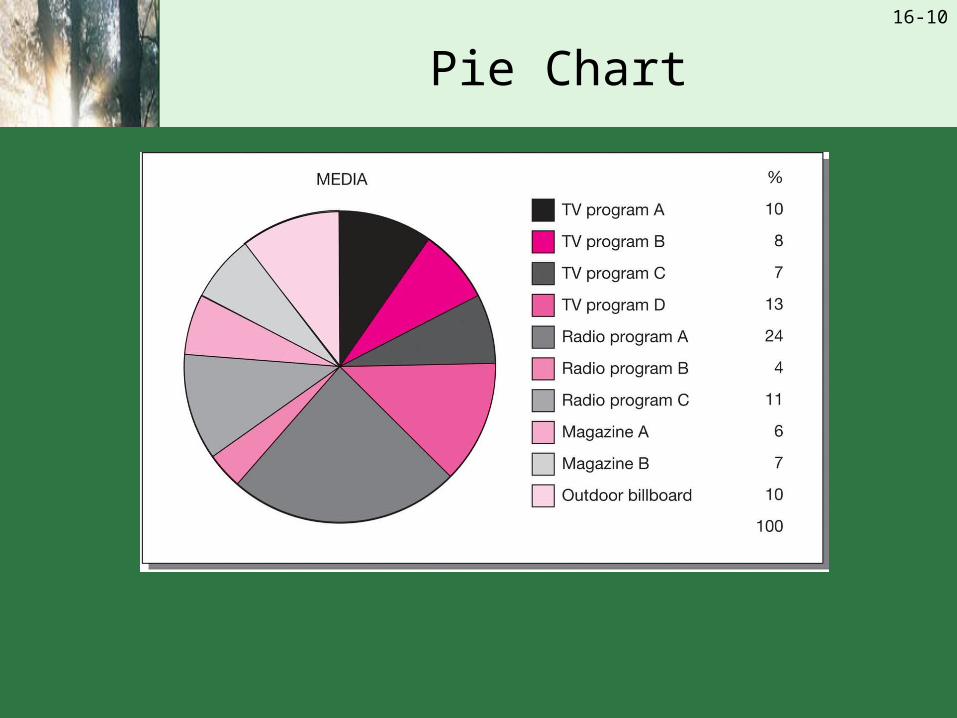
Pie Chart
16-11
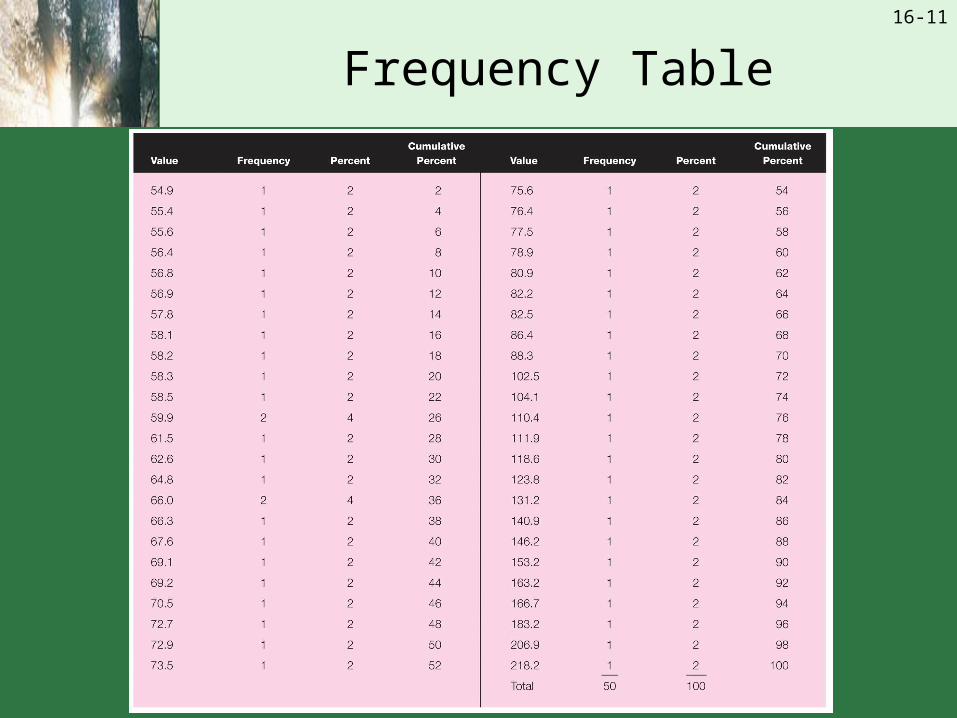
Frequency Table

16-12
Histogram

16-13
Stem-and-Leaf Display
455666788889
12466799
02235678
02268
24
018
3
1
06
3
36
3
6
8
5
6
7
8
9
10
11
12
13
14
15
16
17
18
19
20
21
16-14
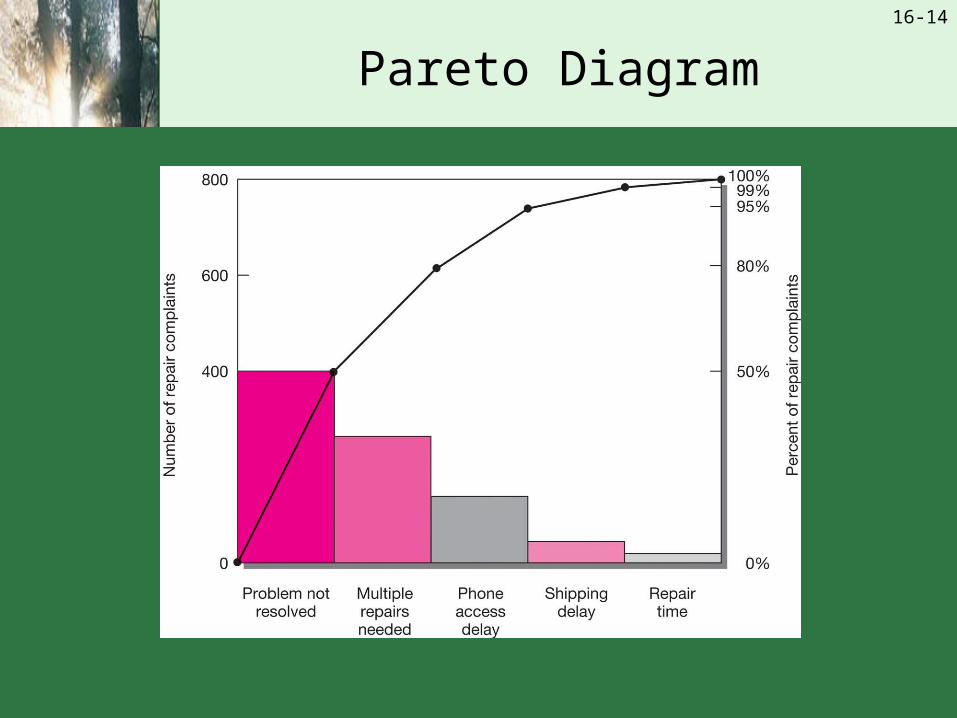
Pareto Diagram

16-15
Boxplot Components
16-16
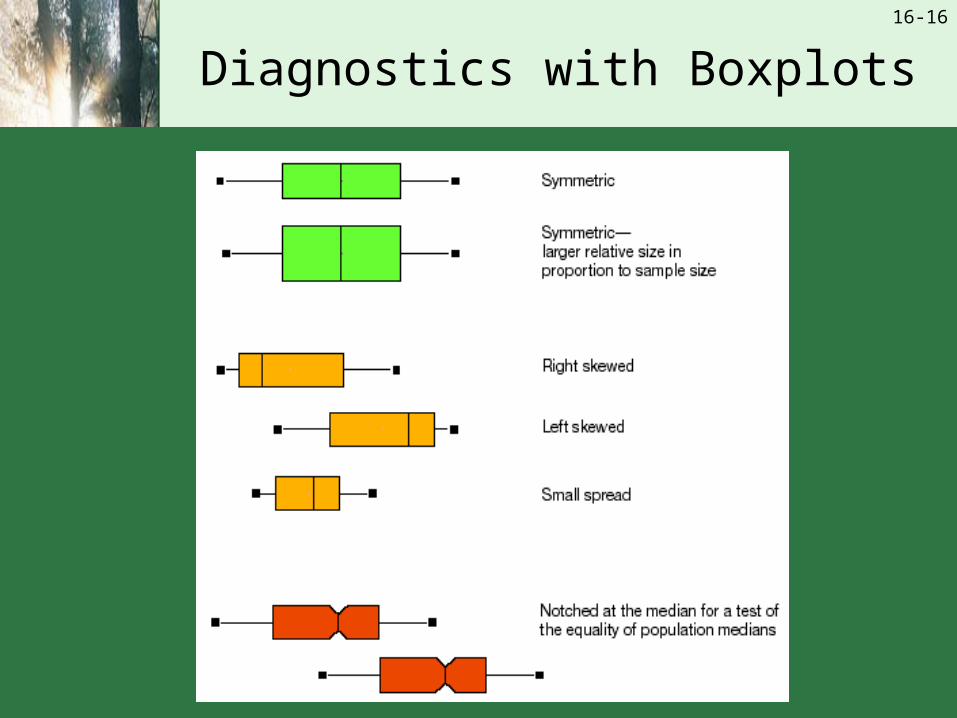
Diagnostics with Boxplots

16-17
Boxplot Comparison

16-18
Mapping

16-19
Geograph: Digital Camera Ownership

16-20
SPSS Cross-Tabulation

16-21
Percentages in Cross-Tabulation

16-22
Guidelines for Using Percentages
Averaging percentagesAveraging percentages
Use of too large percentagesUse of too large percentages
Using too small a baseUsing too small a base
Percentage decreases can never exceed 100%
Percentage decreases can never exceed 100%
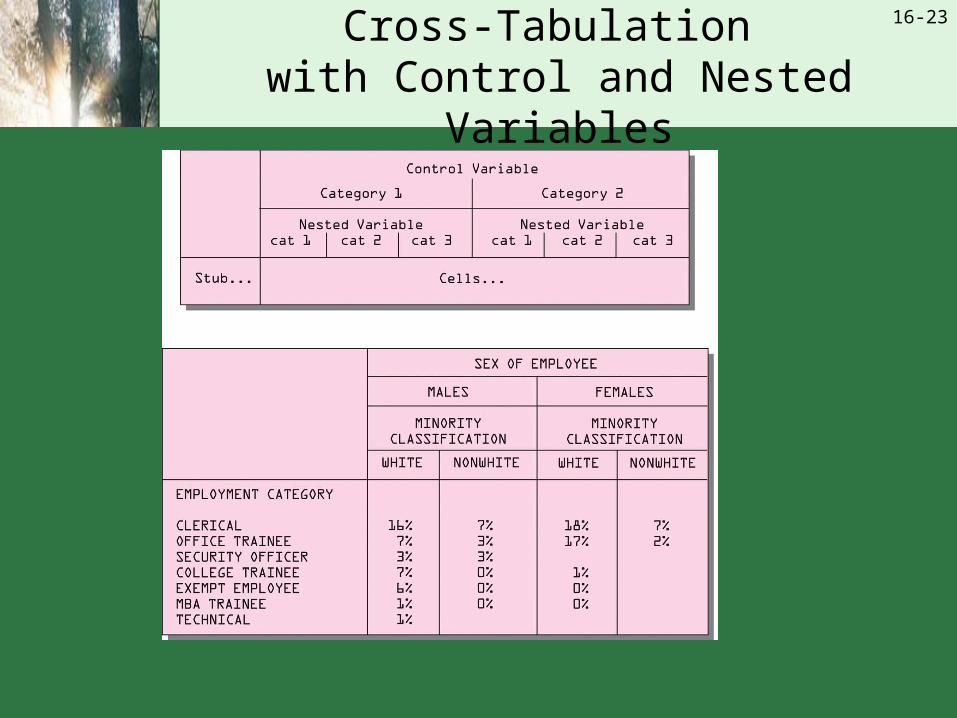
16-23
Cross-Tabulation with Control and Nested Variables

16-24
Automatic Interaction Detection (AID)
16-25
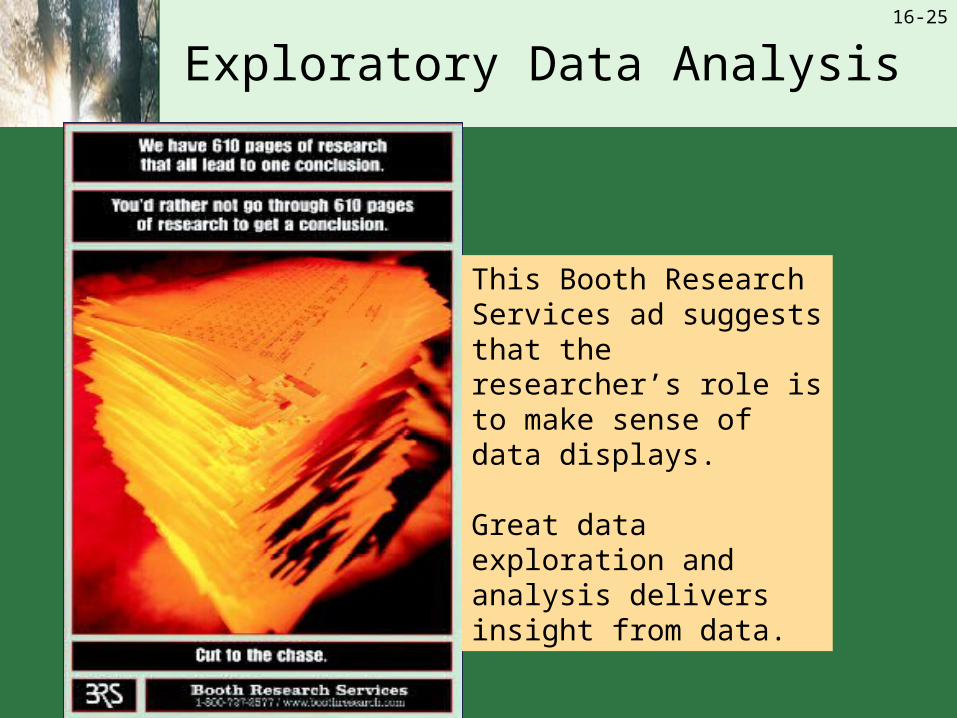
Exploratory Data Analysis
This Booth Research Services ad suggests that the researcher’s role is to make sense of data displays.
Great data exploration and analysis delivers insight from data.
16-26
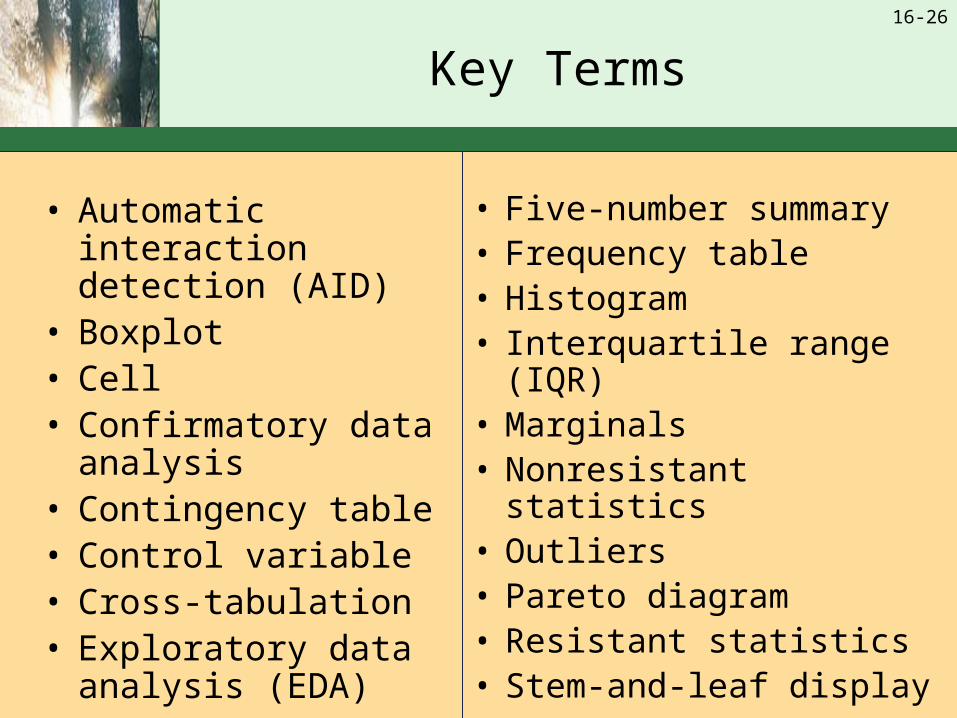
Key Terms
• Automatic interaction detection (AID)
• Boxplot• Cell• Confirmatory data
analysis• Contingency table• Control variable• Cross-tabulation• Exploratory data
analysis (EDA)
• Five-number summary• Frequency table• Histogram• Interquartile range (IQR)• Marginals• Nonresistant statistics• Outliers• Pareto diagram• Resistant statistics• Stem-and-leaf display

Working with Data Tables
16-28
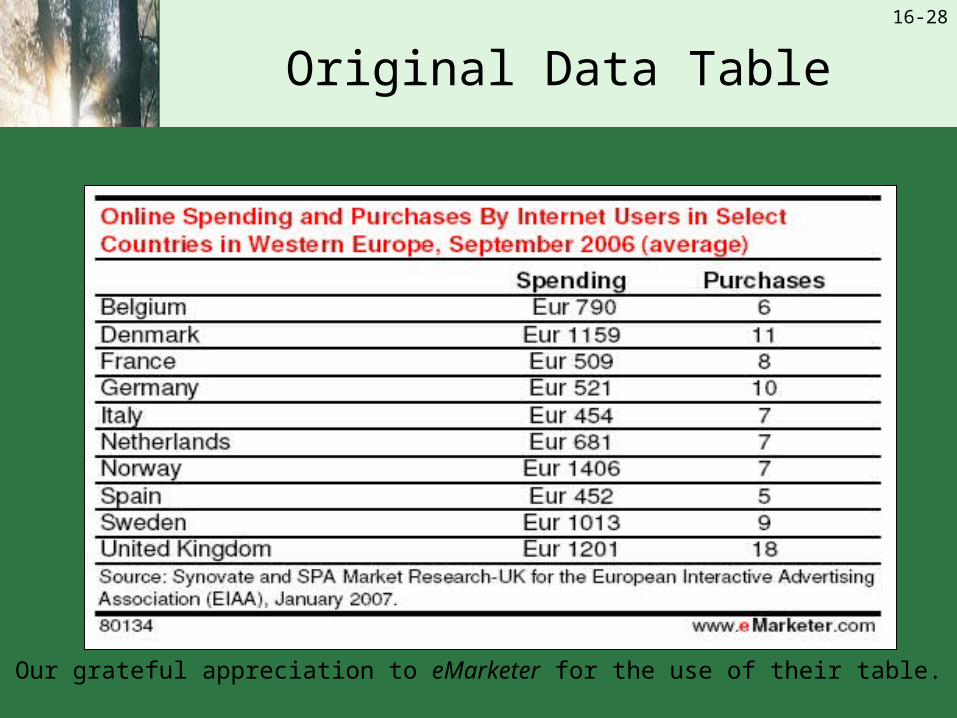
Original Data Table
Our grateful appreciation to eMarketer for the use of their table.

16-29
Arranged by Spending
16-30
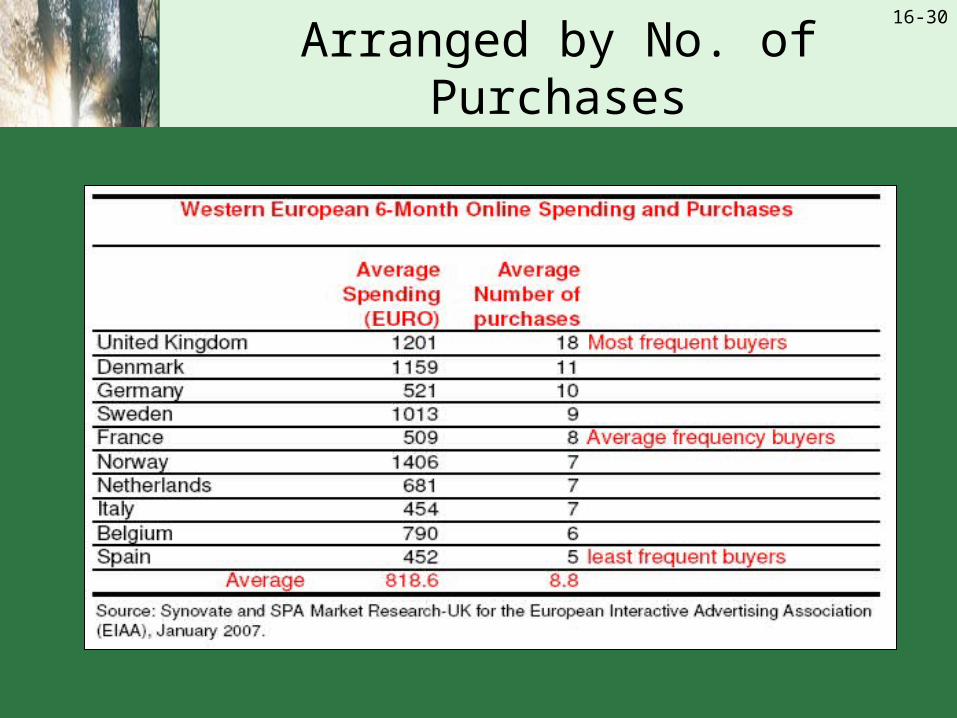
Arranged by No. of Purchases

16-31
Arranged by Avg. Transaction, Highest

16-32
Arranged by Avg. Transaction, Lowest