CHAPTER 16 Capital Structure Decisions the Basics...
62
Chapter 16: Capital Chapter 16: Capital Structure Decisions: The Structure Decisions: The Basics Basics Overview and preview of capital structure effects Business versus financial risk The impact of debt on returns Capital structure theory Example: Choosing the optimal structure Setting the capital structure in practice
description
fghfgfghfghfggggggggggggggggggggggggggggggggggggggggggggggggggggggggggggggggggggggggggggggggggggggggggggggggggggggggggggggggggggggggggggggggggggggggggggggggggggggggggggggggggggggggggggggggggggggggggggggggggggggggggggggggggggggggggggggggggggggggggggggggggggggggggggggggggggggggggggggggggggggggggggggggggggggggggggggggggggggggggggggggggggggggggggggggggggggggggggggggggggggggggggggggggggggggggggggggggggggggggggggggggggggggggggggggggggggggggggggggggggggggggggggggggggggggggggggggggggggggggggggggggggggggggggggggggggggggggggggggggggggggggggggggggggggggggggggggggggggggggggggggggggggggggggggggggg
Transcript of CHAPTER 16 Capital Structure Decisions the Basics...
Chapter 16: Capital Structure Chapter 16: Capital Structure Decisions: The BasicsDecisions: The Basics
Overview and preview of capital structure effects
Business versus financial risk
The impact of debt on returns
Capital structure theory
Example: Choosing the optimal structure
Setting the capital structure in practice
Basic DefinitionsBasic Definitions
V = value of firmFCF = free cash flowWACC = weighted average cost of
capitalrs and rd are costs of stock and debtre and wd are percentages of the
firm that are financed with stock and debt.
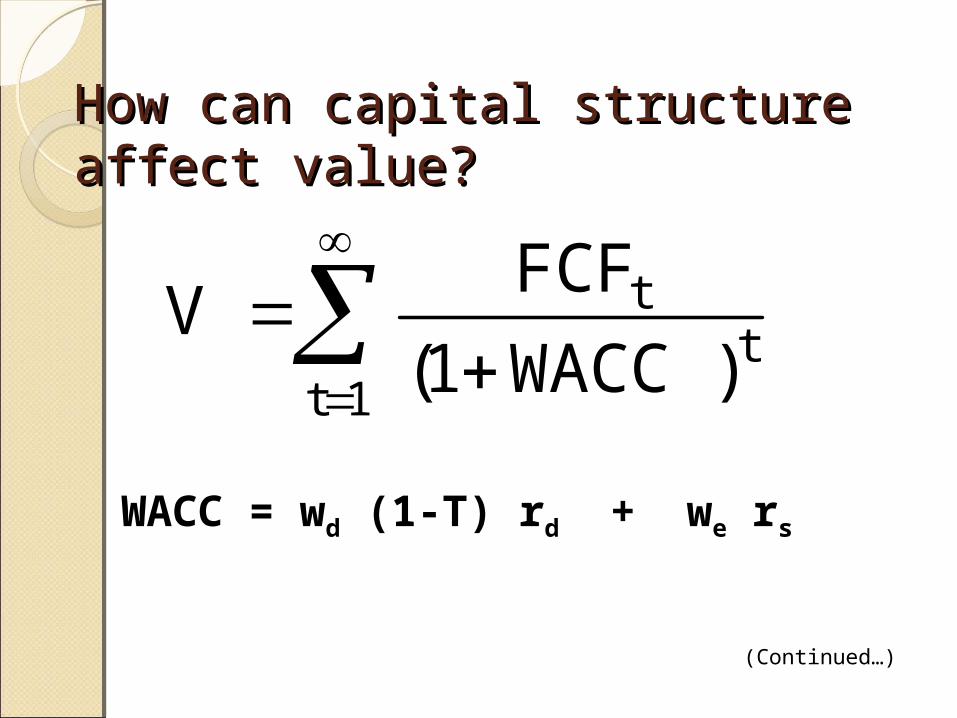
How can capital structure affect How can capital structure affect value?value?
1tt
t
)WACC1(
FCFV
(Continued…)
WACC = wd (1-T) rd + we rs

A Preview of Capital A Preview of Capital Structure EffectsStructure EffectsThe impact of capital structure
on value depends upon the effect of debt on:◦WACC◦FCF
(Continued…)
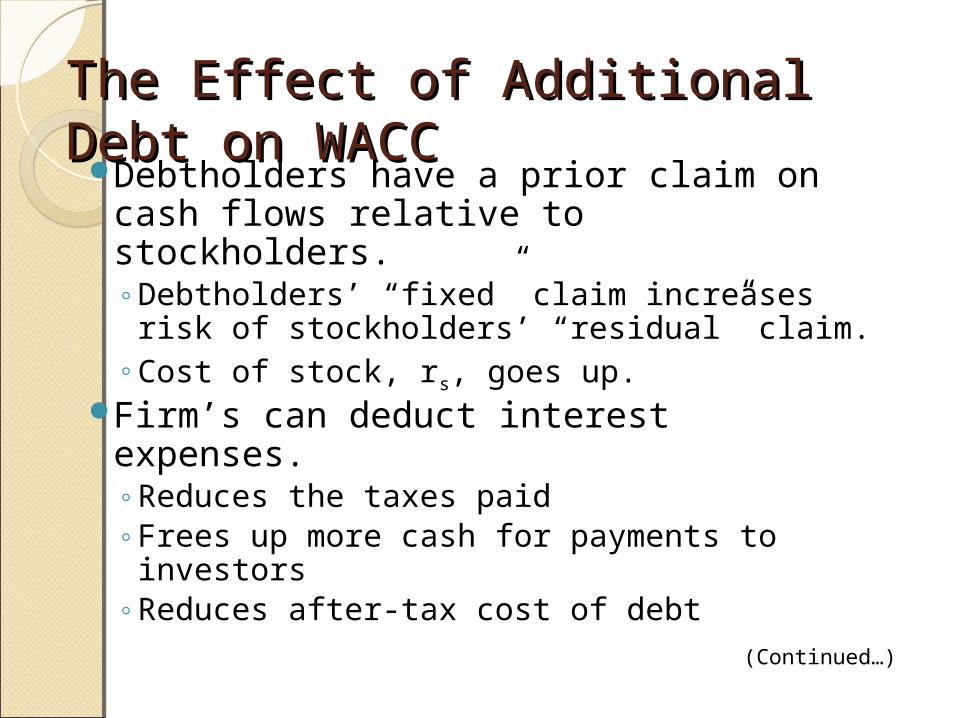
The Effect of Additional Debt The Effect of Additional Debt on WACCon WACCDebtholders have a prior claim on
cash flows relative to stockholders. ◦Debtholders’ “fixed” claim increases risk
of stockholders’ “residual” claim.◦Cost of stock, rs, goes up.
Firm’s can deduct interest expenses.◦Reduces the taxes paid◦Frees up more cash for payments to
investors◦Reduces after-tax cost of debt
(Continued…)
The Effect on WACC The Effect on WACC (Continued)(Continued)Debt increases risk of bankruptcy
◦Causes pre-tax cost of debt, rd, to
increase
Adding debt increase percent of firm financed with low-cost debt (wd) and decreases percent
financed with high-cost equity (we)
Net effect on WACC = uncertain.(Continued…)
The Effect of Additional Debt The Effect of Additional Debt on FCFon FCFAdditional debt increases the
probability of bankruptcy.◦Direct costs: Legal fees, “fire” sales,
etc.◦Indirect costs: Lost customers,
reduction in productivity of managers and line workers, reduction in credit (i.e., accounts payable) offered by suppliers
(Continued…)

Impact of indirect costs◦NOPAT goes down due to lost
customers and drop in productivity◦Investment in capital goes up due to
increase in net operating working capital (accounts payable goes down as suppliers tighten credit).
(Continued…)

Additional debt can affect the behavior of managers.◦Reductions in agency costs: debt “pre-
commits,” or “bonds,” free cash flow for use in making interest payments. Thus, managers are less likely to waste FCF on perquisites or non-value adding acquisitions.
◦Increases in agency costs: debt can make managers too risk-averse, causing “underinvestment” in risky but positive NPV projects.
(Continued…)
Asymmetric Information and Asymmetric Information and SignalingSignalingManagers know the firm’s future
prospects better than investors.Managers would not issue additional
equity if they thought the current stock price was less than the true value of the stock (given their inside information).
Hence, investors often perceive an additional issuance of stock as a negative signal, and the stock price falls.

Uncertainty about future pre-tax operating income (EBIT).
Note that business risk focuses on operating income, so it ignores financing effects.
What is business risk?What is business risk?
Probability
EBITE(EBIT)0
Low risk
High risk
Factors That Influence Factors That Influence Business RiskBusiness Risk
Uncertainty about demand (unit sales).
Uncertainty about output prices.
Uncertainty about input costs.
Product and other types of liability.
Degree of operating leverage (DOL).

What is operating leverage, What is operating leverage, and how does it affect a firm’s and how does it affect a firm’s business risk?business risk?Operating leverage is the change
in EBIT caused by a change in quantity sold.
The higher the proportion of fixed costs within a firm’s overall cost structure, the greater the operating leverage.
(More...)
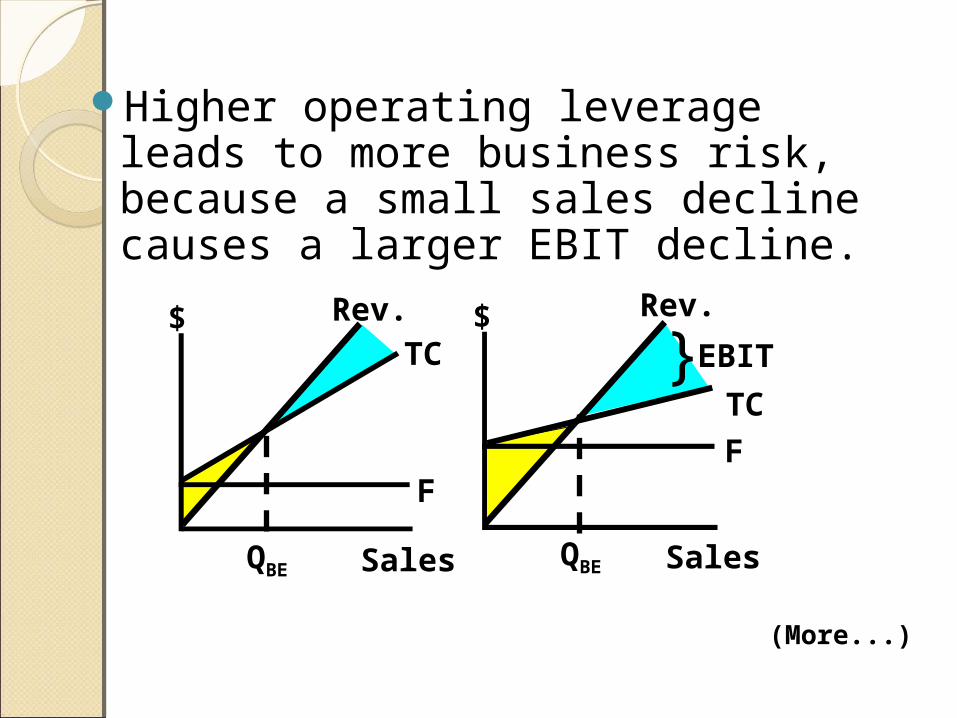
Higher operating leverage leads to more business risk, because a small sales decline causes a larger EBIT decline.
(More...)
Sales
$ Rev.TC
F
QBE Sales
$ Rev.
TC
F
QBE
EBIT}
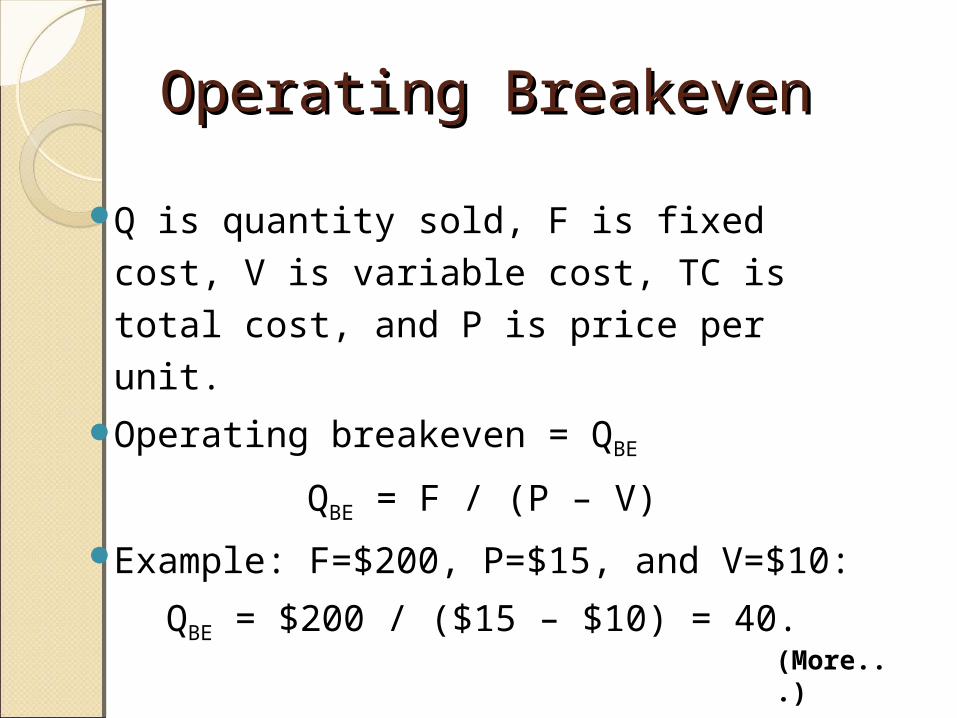
Operating BreakevenOperating Breakeven
Q is quantity sold, F is fixed cost, V is variable cost, TC is total cost, and P is price per unit.
Operating breakeven = QBE
QBE = F / (P – V)
Example: F=$200, P=$15, and V=$10:
QBE = $200 / ($15 – $10) = 40.
(More...)

Probability
EBITL
Low operating leverage
High operating leverage
EBITH
In the typical situation, higher operating leverage leads to higher expected EBIT, but also increases risk.
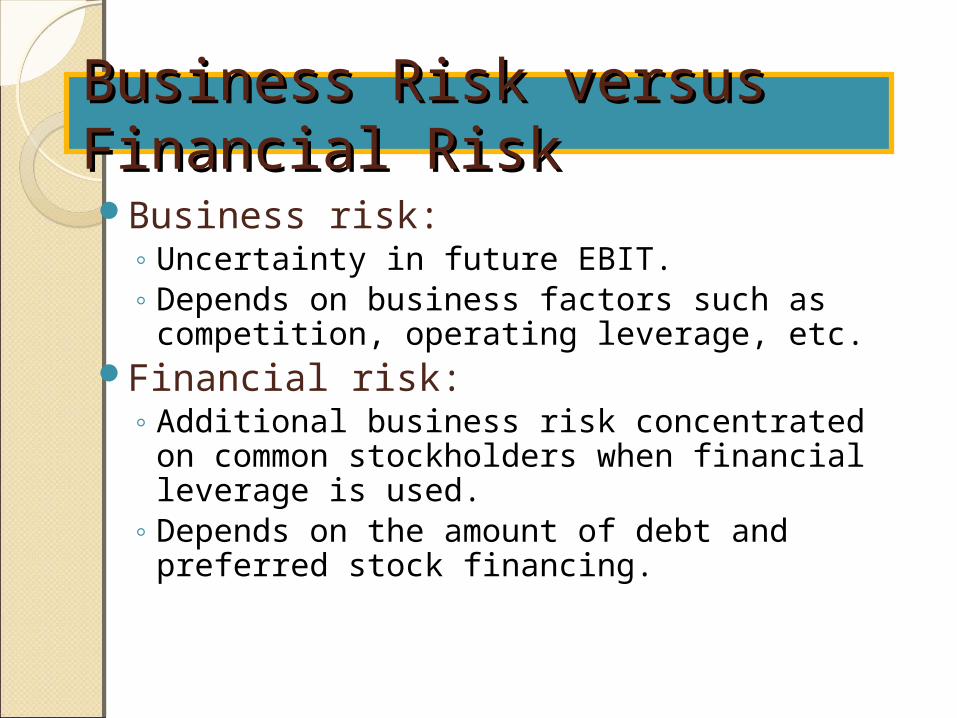
Business Risk versus Business Risk versus Financial RiskFinancial RiskBusiness risk:
◦ Uncertainty in future EBIT.◦ Depends on business factors such as
competition, operating leverage, etc.Financial risk:
◦ Additional business risk concentrated on common stockholders when financial leverage is used.
◦ Depends on the amount of debt and preferred stock financing.

Firm U Firm L
No debt $10,000 of 12% debt
$20,000 in assets $20,000 in assets
40% tax rate 40% tax rate
Consider Two Hypothetical Firms
Both firms have same operating leverage, business risk, and EBIT of $3,000. They differ only with respect to use of debt.

Impact of Leverage on Returns
EBIT $3,000 $3,000Interest 0 1,200EBT $3,000 $1,800Taxes (40%) 1 ,200 720NI $1,800 $1,080
ROE 9.0% 10.8%
Firm U Firm L

Why does leveraging increase Why does leveraging increase return?return?
More EBIT goes to investors in Firm L.◦Total dollars paid to investors: U: NI = $1,800. L: NI + Int = $1,080 + $1,200 = $2,280.
◦Taxes paid: U: $1,200; L: $720.
Equity $ proportionally lower than NI.
Now consider the fact that EBIT is not known with certainty. What is the
impact of uncertainty on stockholder profitability and risk for Firm U and
Firm L?
Continued…

Firm U: Unleveraged
Prob. 0.25 0.50 0.25EBIT $2,000 $3,000 $4,000Interest 0 0 0EBT $2,000 $3,000 $4,000Taxes (40%) 800 1,200 1,600NI $1,200 $1,800 $2,400
Economy
Bad Avg. Good
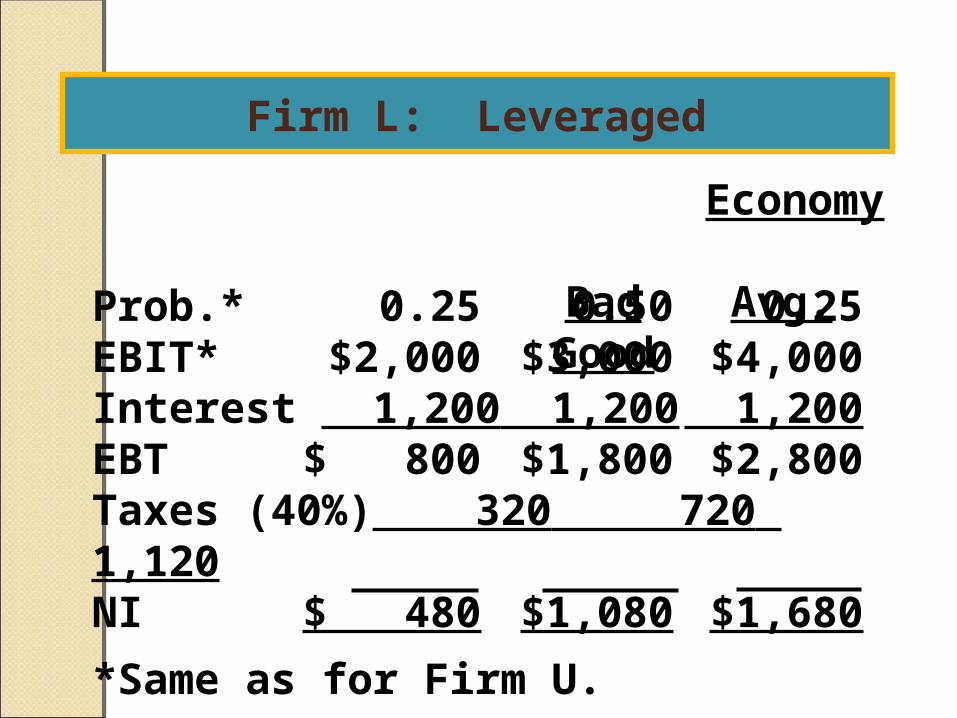
Firm L: Leveraged
Prob.* 0.25 0.50 0.25EBIT* $2,000 $3,000 $4,000Interest 1,200 1,200 1,200EBT $ 800 $1,800 $2,800Taxes (40%) 320 720 1,120NI $ 480 $1,080 $1,680
*Same as for Firm U.
Economy
Bad Avg. Good

Firm U Bad Avg. GoodBEP 10.0% 15.0% 20.0%ROIC 6.0% 9.0% 12.0%ROE 6.0% 9.0% 12.0%TIE n.a. n.a. n.a.
Firm L Bad Avg. GoodBEP 10.0% 15.0% 20.0%ROIC 6.0% 9.0% 12.0%ROE 4.8% 10.8% 16.8%TIE 1.7x 2.5x 3.3x
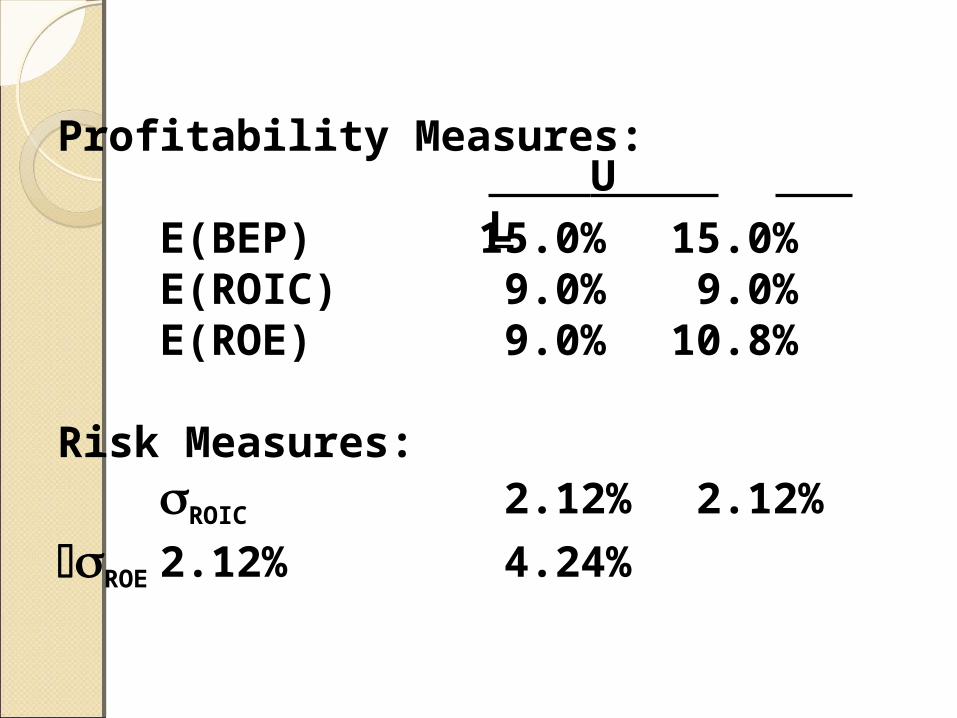
Profitability Measures:
E(BEP) 15.0% 15.0%E(ROIC) 9.0% 9.0%E(ROE) 9.0% 10.8%
Risk Measures:ROIC 2.12% 2.12%
ROE2.12% 4.24%
U L

ConclusionsConclusionsBasic earning power (EBIT/TA) and
ROIC (NOPAT/Capital = EBIT(1-T)/TA) are unaffected by financial leverage.
L has higher expected ROE: tax savings and smaller equity base.
L has much wider ROE swings because of fixed interest charges. Higher expected return is accompanied by higher risk.
(More...)

In a stand-alone risk sense, Firm L’s stockholders see much more risk than Firm U’s.
◦U and L: ROIC = 2.12%.
◦U: ROE = 2.12%.
◦L: ROE = 4.24%.
L’s financial risk is ROE - ROIC = 4.24% - 2.12% = 2.12%. (U’s is zero.)
(More...)
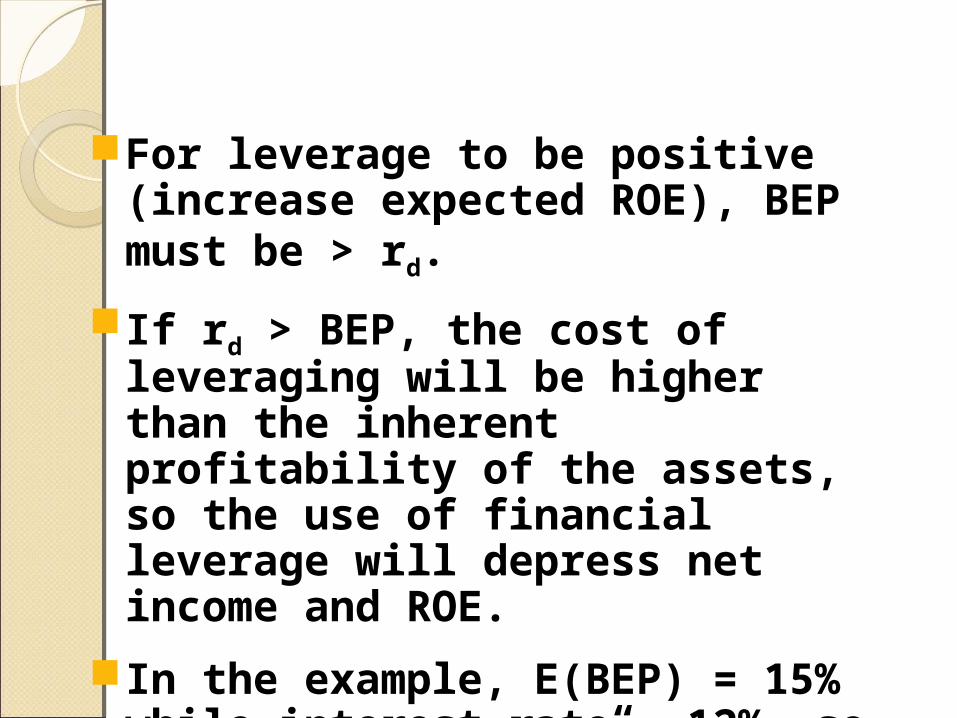
For leverage to be positive (increase expected ROE), BEP must be > rd.
If rd > BEP, the cost of leveraging will be higher than the inherent profitability of the assets, so the use of financial leverage will depress net income and ROE.
In the example, E(BEP) = 15% while interest rate = 12%, so leveraging “works.”
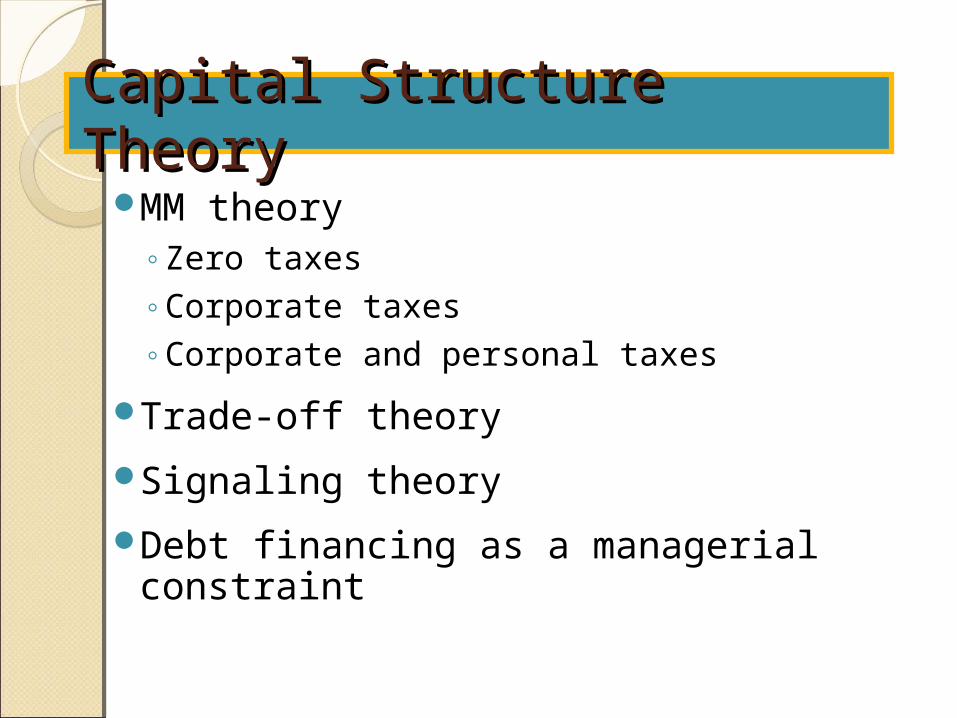
Capital Structure TheoryCapital Structure TheoryMM theory
◦Zero taxes◦Corporate taxes◦Corporate and personal taxes
Trade-off theory
Signaling theory
Debt financing as a managerial constraint

MM Theory: Zero TaxesMM Theory: Zero TaxesMM prove, under a very restrictive set of
assumptions, that a firm’s value is unaffected by its financing mix:◦ VL = VU.
Therefore, capital structure is irrelevant.Any increase in ROE resulting from
financial leverage is exactly offset by the increase in risk (i.e., rs), so WACC is constant.
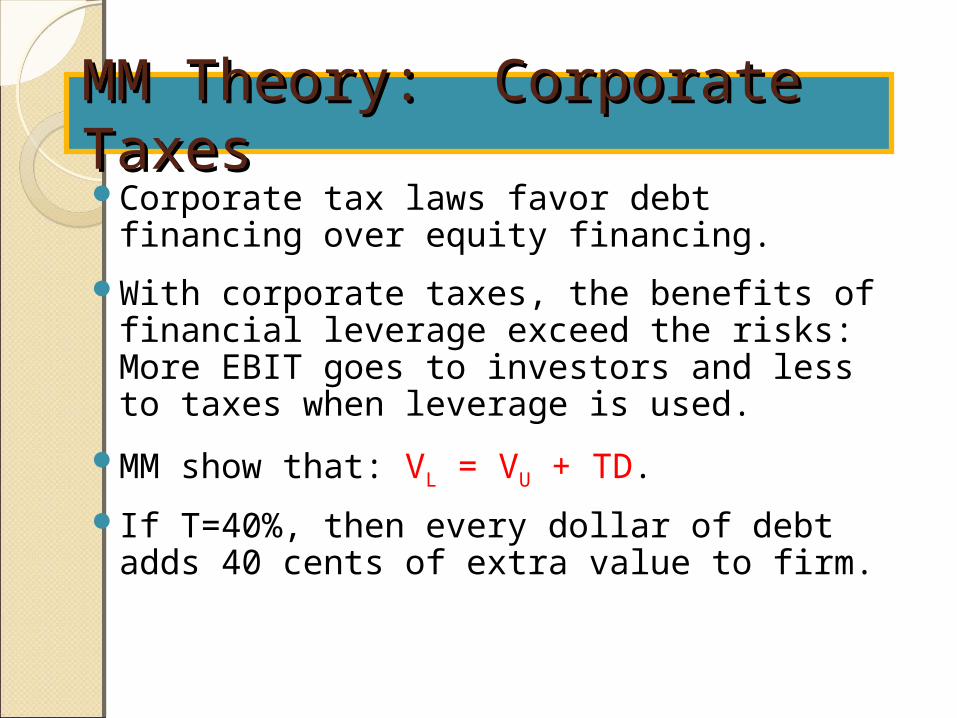
MM Theory: Corporate MM Theory: Corporate TaxesTaxesCorporate tax laws favor debt financing
over equity financing.
With corporate taxes, the benefits of financial leverage exceed the risks: More EBIT goes to investors and less to taxes when leverage is used.
MM show that: VL = VU + TD.
If T=40%, then every dollar of debt adds 40 cents of extra value to firm.
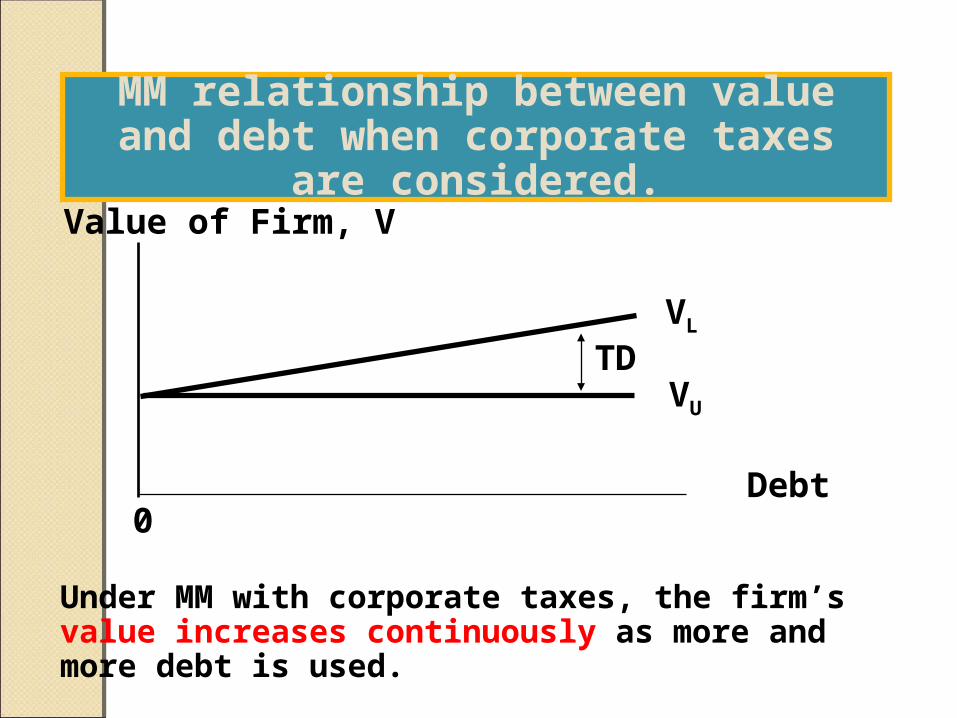
Value of Firm, V
0Debt
VL
VU
MM relationship between value and debt when corporate taxes are considered.
Under MM with corporate taxes, the firm’s value increases continuously as more and more debt is used.
TD

Cost of Capital (%)
0 20 40 60 80 100Debt/Value Ratio (%)
MM relationship between capital costs and leverage when corporate taxes are
considered.
rs
WACCrd(1 - T)

Miller’s Theory: Corporate Miller’s Theory: Corporate and and Personal TaxesPersonal TaxesPersonal taxes lessen the
advantage of corporate debt:◦Corporate taxes favor debt financing
since corporations can deduct interest expenses.
◦Personal taxes favor equity financing, since no gain is reported until stock is sold, and long-term gains are taxed at a lower rate.

Miller’s Model with Corporate and Personal Taxes
VL = VU + [1 - ]D.
Tc = corporate tax rate.Td = personal tax rate on debt income.Ts = personal tax rate on stock income.
(1 - Tc)(1 - Ts)(1 - Td)

Tc = 40%, Td = 30%, and Ts = 12%.
VL = VU + [1 - ]D= VU + (1 - 0.75)D
= VU + 0.25D.
Value rises with debt; each $1 increase in debt raises L’s value by $0.25.
(1 - 0.40)(1 - 0.12)(1 - 0.30)
Conclusions with Personal Conclusions with Personal TaxesTaxesUse of debt financing remains
advantageous, but benefits are less than under only corporate taxes.
Firms should still use 100% debt.
Note: However, Miller argued that in equilibrium, the tax rates of marginal investors would adjust until there was no advantage to debt.

Trade-off TheoryTrade-off Theory
MM theory ignores bankruptcy (financial distress) costs, which increase as more leverage is used.
At low leverage levels, tax benefits outweigh bankruptcy costs.
At high levels, bankruptcy costs outweigh tax benefits.
An optimal capital structure exists that balances these costs and benefits.

Signaling TheorySignaling TheoryMM assumed that investors and
managers have the same information.But, managers often have better
information. Thus, they would:◦ Sell stock if stock is overvalued.◦ Sell bonds if stock is undervalued.
Investors understand this, so view new stock sales as a negative signal.
Implications for managers?
Debt Financing and Agency Debt Financing and Agency CostsCostsOne agency problem is that
managers can use corporate funds for non-value maximizing purposes.
The use of financial leverage:◦Bonds “free cash flow.”◦Forces discipline on managers to avoid
perks and non-value adding acquisitions. (More...)
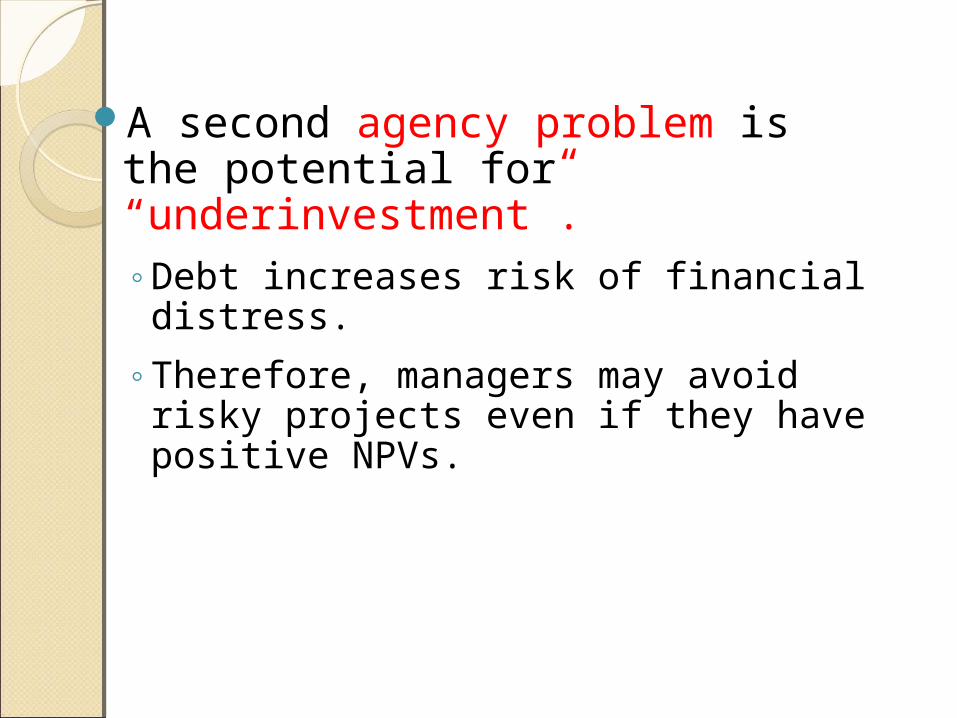
A second agency problem is the potential for “underinvestment”.◦Debt increases risk of financial
distress.
◦Therefore, managers may avoid risky projects even if they have positive NPVs.

Choosing the Optimal Capital Structure: Example
Currently is all-equity financed.
Expected EBIT = $500,000.
Firm expects zero growth.
100,000 shares outstanding; rs = 12%;
P0 = $25; T = 40%; b = 1.0; rRF = 6%;
RPM = 6%.
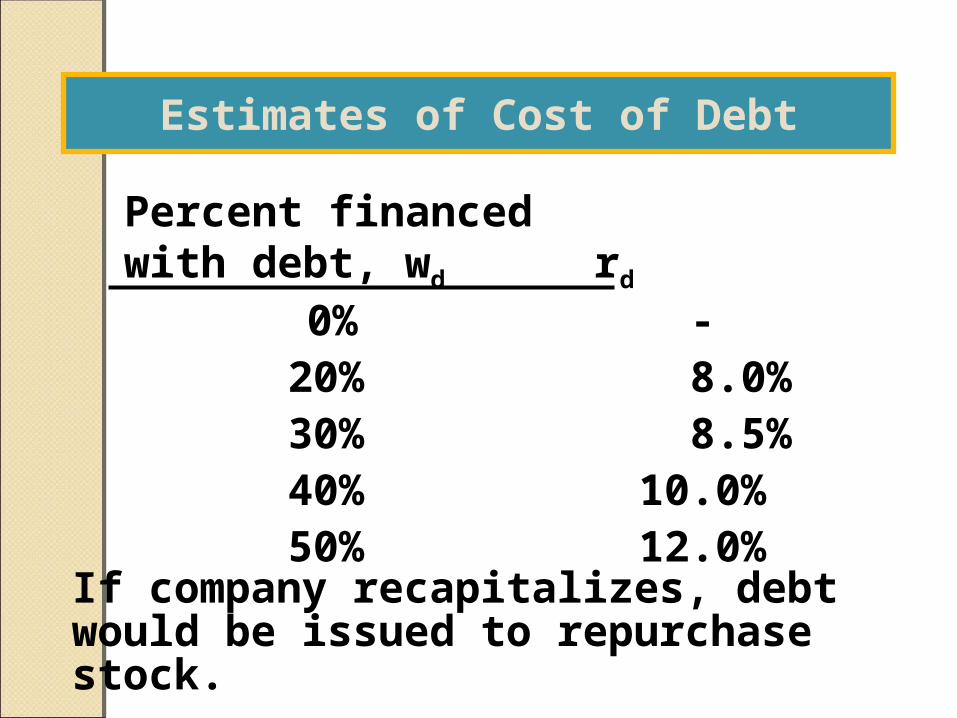
Estimates of Cost of Debt
Percent financedwith debt, wd rd
0% - 20% 8.0% 30% 8.5% 40% 10.0% 50% 12.0%
If company recapitalizes, debt would be issued to repurchase stock.
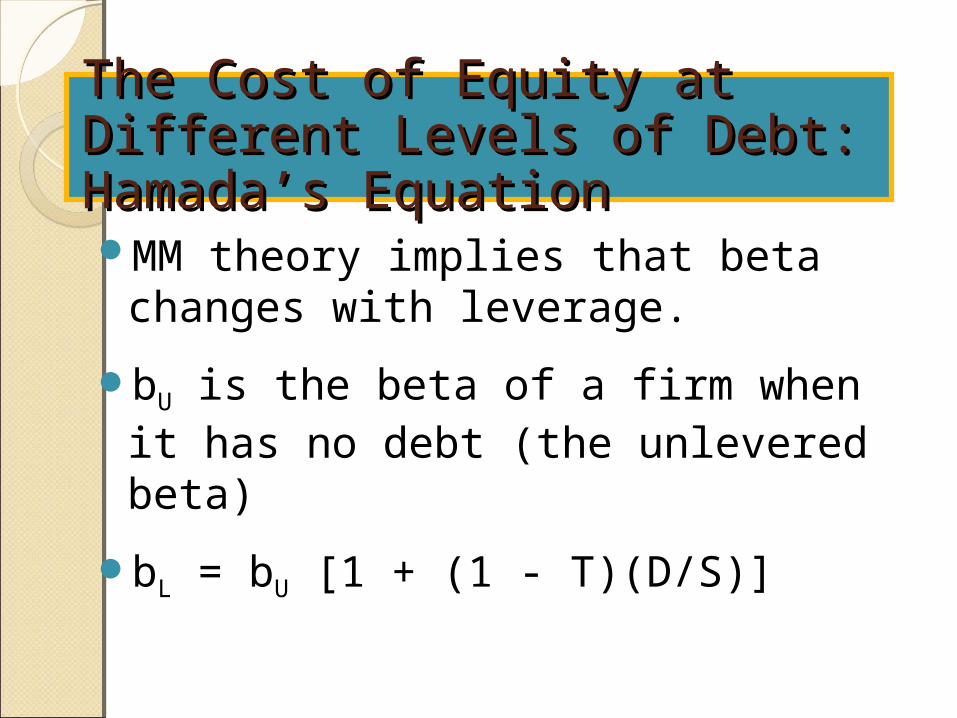
The Cost of Equity at Different The Cost of Equity at Different Levels of Debt: Hamada’s Levels of Debt: Hamada’s Equation Equation MM theory implies that beta
changes with leverage.
bU is the beta of a firm when it has no debt (the unlevered beta)
bL = bU [1 + (1 - T)(D/S)]

The Cost of Equity for wThe Cost of Equity for wdd = 20%= 20%
Use Hamada’s equation to find beta: bL = bU [1 + (1 - T)(D/S)]
= 1.0 [1 + (1-0.4) (20% / 80%) ] = 1.15Use CAPM to find the cost of equity:
rs = rRF + bL (RPM)
= 6% + 1.15 (6%) = 12.9%
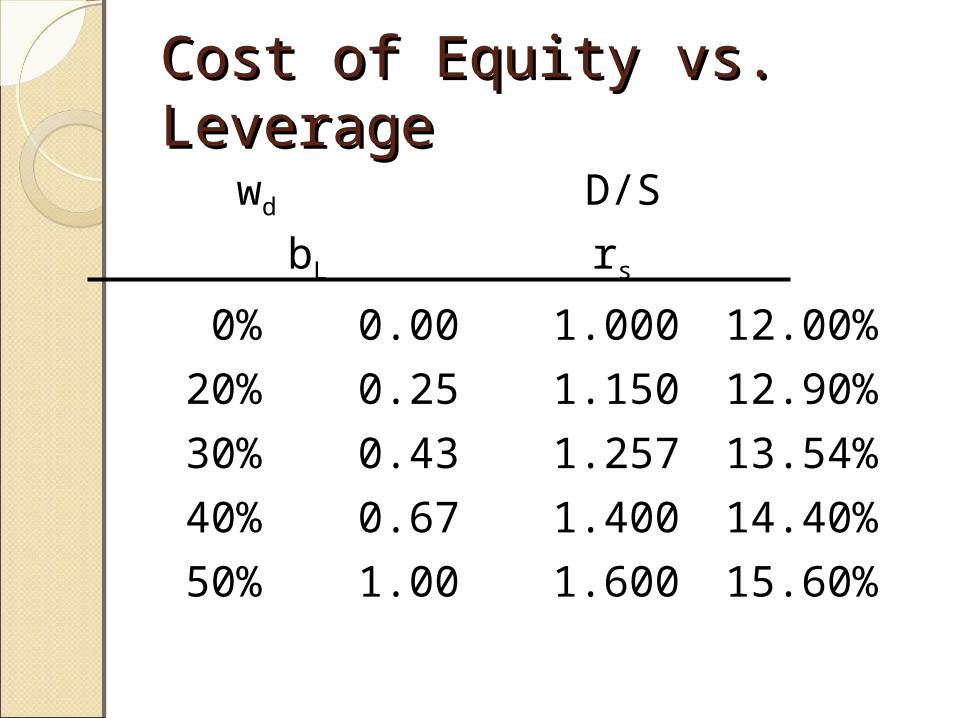
Cost of Equity vs. Cost of Equity vs. LeverageLeverage wd D/S bL rs
0% 0.00 1.000 12.00%
20% 0.25 1.150 12.90%
30% 0.43 1.257 13.54%
40% 0.67 1.400 14.40%
50% 1.00 1.600 15.60%
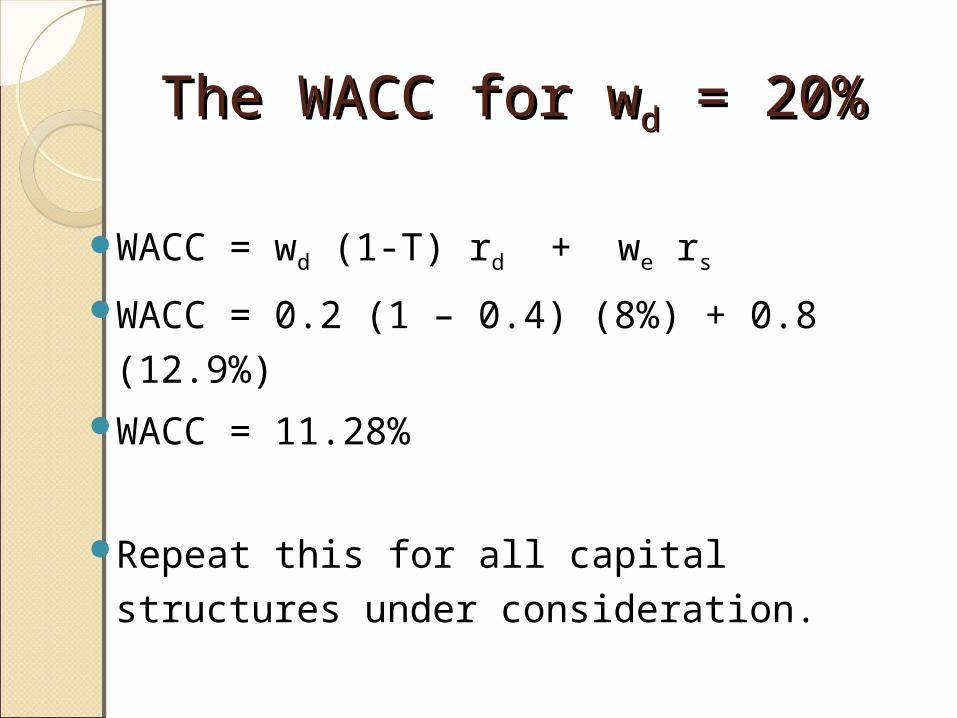
The WACC for wThe WACC for wdd = 20% = 20%
WACC = wd (1-T) rd + we rs
WACC = 0.2 (1 – 0.4) (8%) + 0.8 (12.9%)
WACC = 11.28%
Repeat this for all capital structures under consideration.
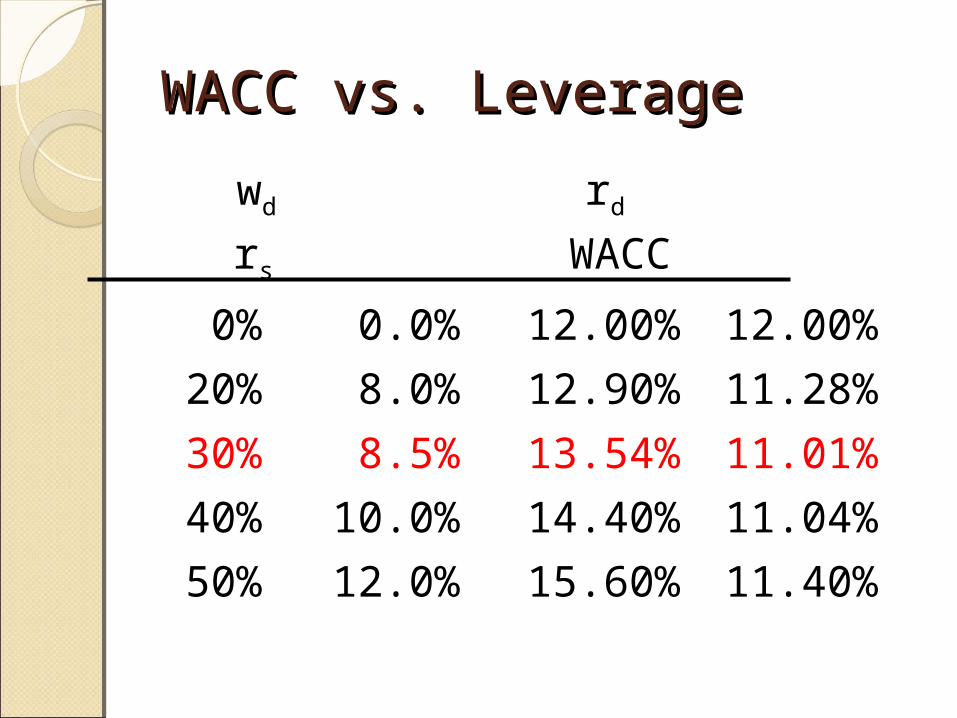
WACC vs. LeverageWACC vs. Leverage
wd rd rs WACC
0% 0.0% 12.00% 12.00%
20% 8.0% 12.90% 11.28%
30% 8.5% 13.54% 11.01%
40% 10.0% 14.40% 11.04%
50% 12.0% 15.60% 11.40%
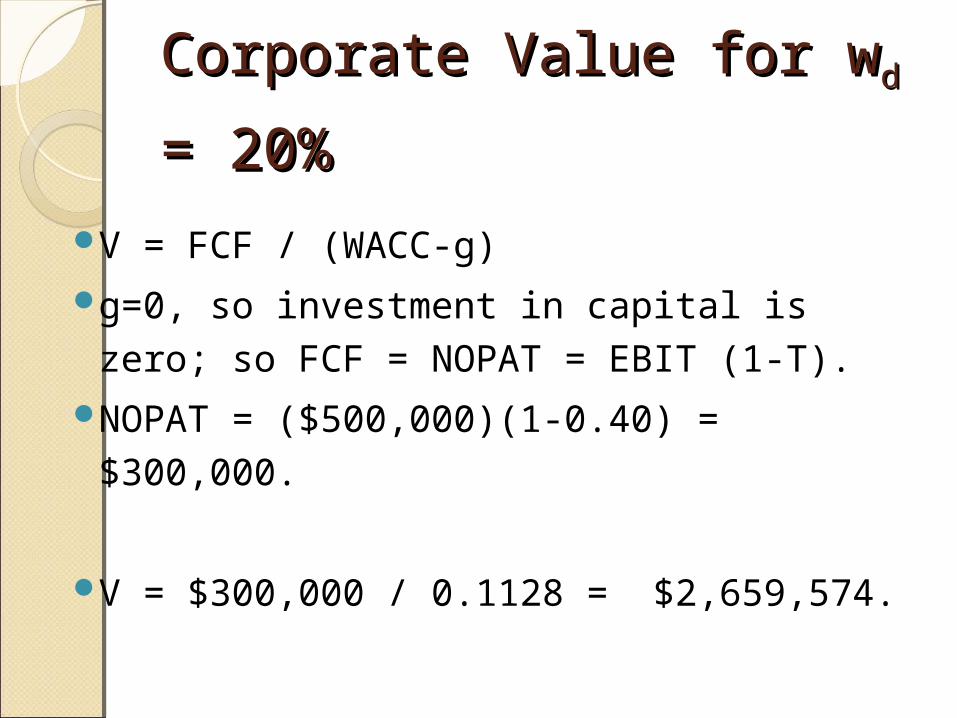
Corporate Value for wCorporate Value for wdd = =
20%20%
V = FCF / (WACC-g)g=0, so investment in capital is zero; so
FCF = NOPAT = EBIT (1-T).NOPAT = ($500,000)(1-0.40) =
$300,000.
V = $300,000 / 0.1128 = $2,659,574.

Corporate Value vs. Corporate Value vs. LeverageLeverage wd WACC Corp. Value
0% 12.00% $2,500,000
20% 11.28% $2,659,574
30% 11.01% $2,724,796
40% 11.04% $2,717,391
50% 11.40% $2,631,579

Debt and Equity for wDebt and Equity for wdd = =
20%20%The dollar value of debt is:
D = wd V = 0.2 ($2,659,574) =
$531,915.S = V – D
S = $2,659,574 - $531,915 = $2,127,659.
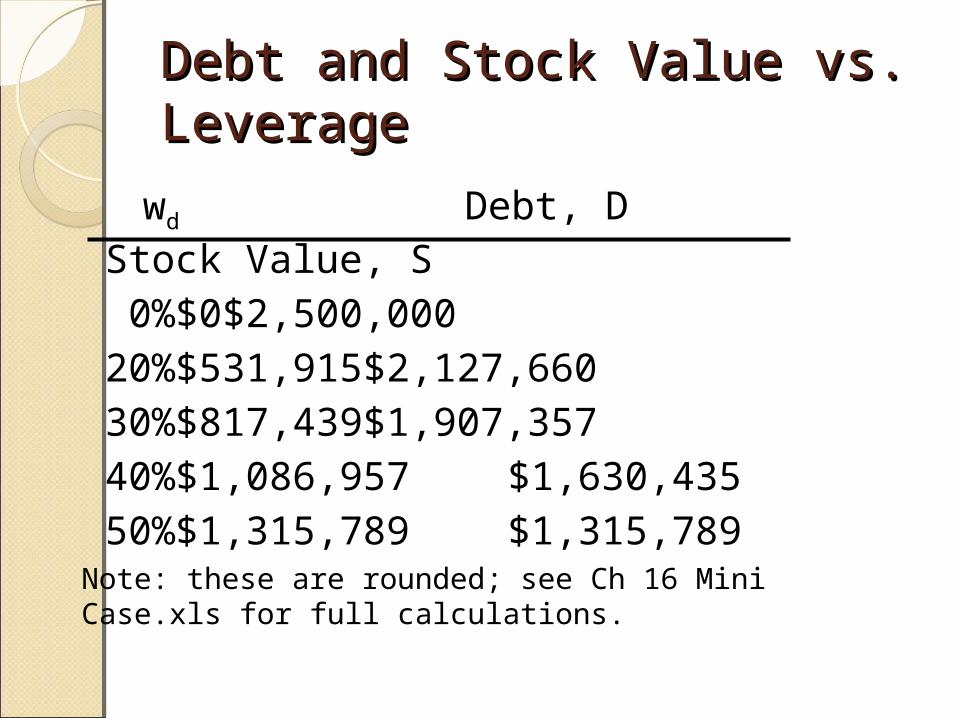
Debt and Stock Value vs. Debt and Stock Value vs. LeverageLeverage
wd Debt, D Stock Value, S
0% $0 $2,500,000
20% $531,915 $2,127,660
30% $817,439 $1,907,357
40% $1,086,957 $1,630,435
50% $1,315,789 $1,315,789Note: these are rounded; see Ch 16 Mini Case.xls for full calculations.
Wealth of ShareholdersWealth of ShareholdersValue of the equity declines as
more debt is issued, because debt is used to repurchase stock.
But total wealth of shareholders is value of stock after the recap plus the cash received in repurchase, and this total goes up (It is equal to Corporate Value on earlier slide).

Stock Price for wStock Price for wdd = 20% = 20%
The firm issues debt, which changes its WACC, which changes value.
The firm then uses debt proceeds to repurchase stock.
Stock price changes after debt is issued, but does not change during actual repurchase (or arbitrage is possible).
(More…)

Stock Price for wStock Price for wdd = 20% = 20%
(Continued)(Continued)The stock price after debt is issued but before stock is repurchased reflects shareholder wealth:◦ S, value of stock
◦Cash paid in repurchase.
(More…)

Stock Price for wStock Price for wdd = 20% = 20%
(Continued)(Continued)D0 and n0 are debt and outstanding
shares before recap.
D - D0 is equal to cash that will be
used to repurchase stock.
S + (D - D0) is wealth of shareholders’
after the debt is issued but immediately before the repurchase.
(More…)
Stock Price for wStock Price for wdd = 20% = 20%
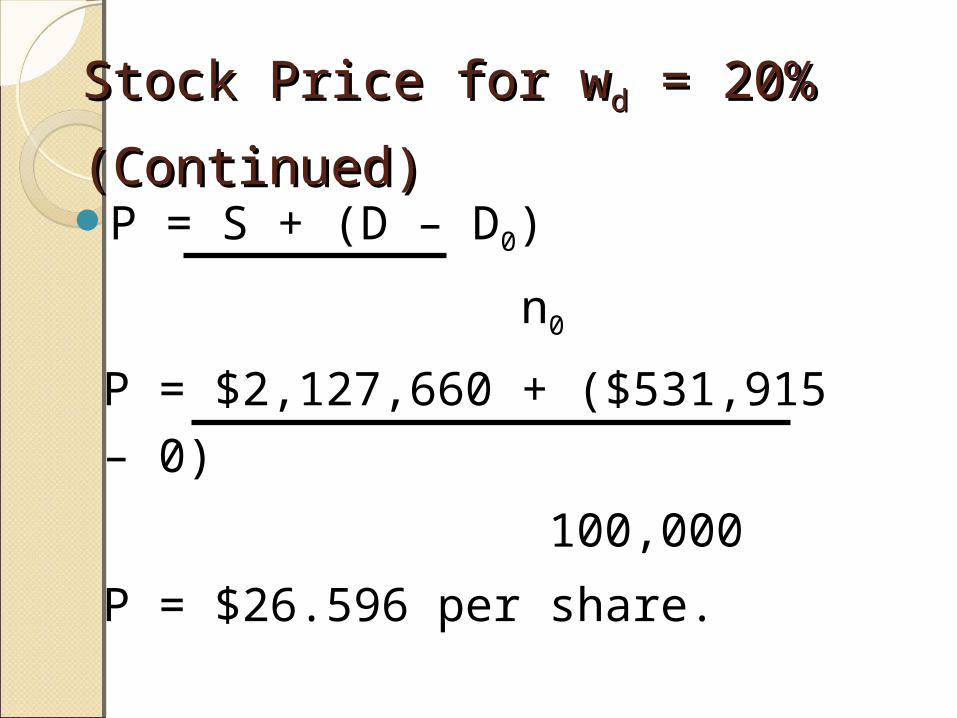
(Continued)(Continued)P = S + (D – D0)
n0
P = $2,127,660 + ($531,915 – 0)
100,000
P = $26.596 per share.

Number of Shares Number of Shares RepurchasedRepurchased# Repurchased = (D - D0) / P
# Rep. = ($531,915 – 0) / $26.596
= 20,000. # Remaining = n = S / P
n = $2,127,660 / $26.596
= 80,000.
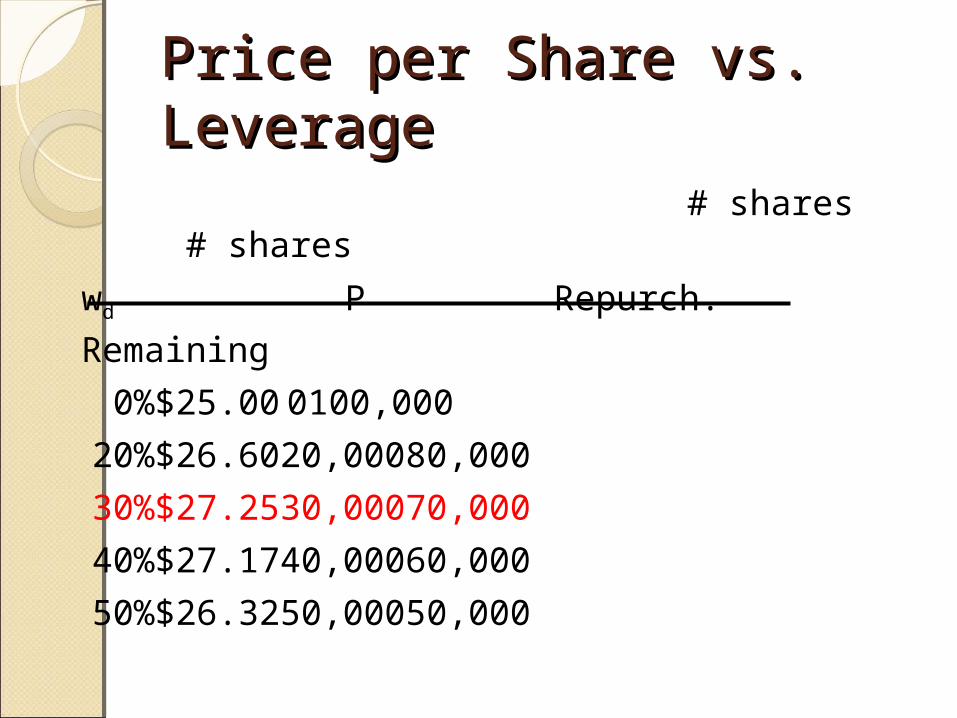
Price per Share vs. Price per Share vs. LeverageLeverage
# shares # shares
wd P Repurch. Remaining
0% $25.00 0 100,000
20% $26.60 20,000 80,000
30% $27.25 30,000 70,000
40% $27.17 40,000 60,000
50% $26.32 50,000 50,000
Optimal Capital StructureOptimal Capital Structure
wd = 30% gives:◦Highest corporate value◦Lowest WACC◦Highest stock price per share
But wd = 40% is close.
Optimal range is pretty flat.
Debt ratios of other firms in the industry.
Pro forma coverage ratios at different capital structures under different economic scenarios.
Lender and rating agency attitudes(impact on bond ratings).
What other factors would managers consider when setting the target
capital structure?

Reserve borrowing capacity.
Effects on control.
Type of assets: Are they tangible, and hence suitable as collateral?
Tax rates.