Chapter 151 Chapter 15: Weaving, Merging, and Diverging Movements on Freeways and Multilane Highways...
33
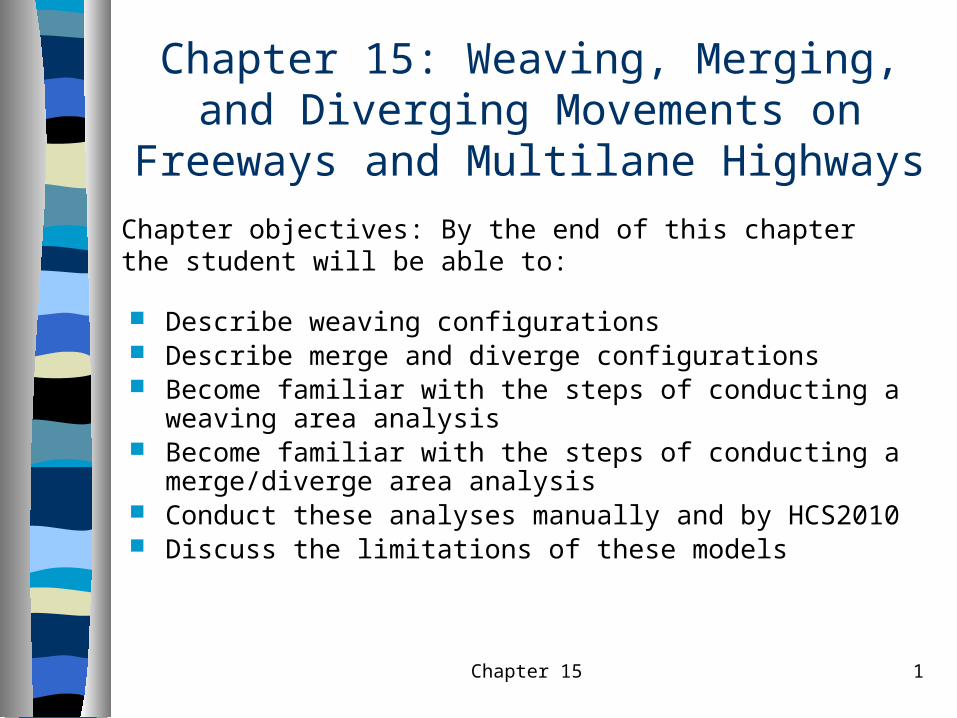
Chapter 15 1 Chapter 15: Weaving, Merging, and Diverging Movements on Freeways and Multilane Highways Describe weaving configurations Describe merge and diverge configurations Become familiar with the steps of conducting a weaving area analysis Become familiar with the steps of conducting a merge/diverge area analysis Conduct these analyses manually and by HCS2010 Discuss the limitations of these models Chapter objectives: By the end of this chapter the student will be able to:
-
Upload
leonard-walton -
Category
Documents
-
view
242 -
download
0
Transcript of Chapter 151 Chapter 15: Weaving, Merging, and Diverging Movements on Freeways and Multilane Highways...
Chapter 15 1
Chapter 15: Weaving, Merging, and Diverging Movements on Freeways and
Multilane Highways
Describe weaving configurations Describe merge and diverge configurations Become familiar with the steps of conducting a weaving area
analysis Become familiar with the steps of conducting a merge/diverge
area analysis Conduct these analyses manually and by HCS2010 Discuss the limitations of these models
Chapter objectives: By the end of this chapter the student will be able to:
Chapter 15 2
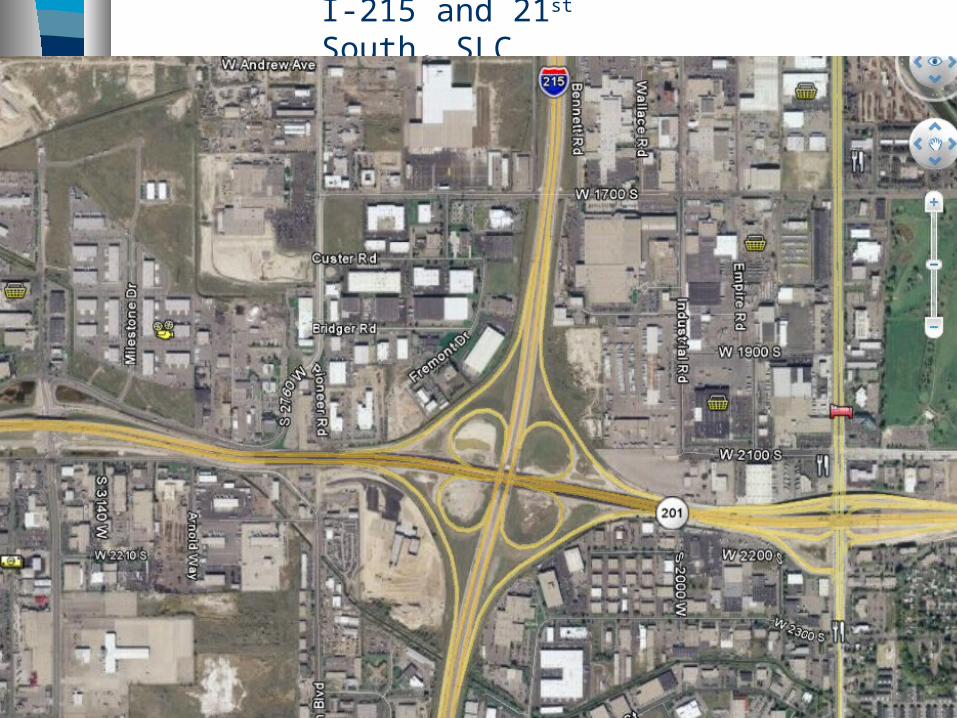
I-215 and 21st South, SLC
Chapter 15 3
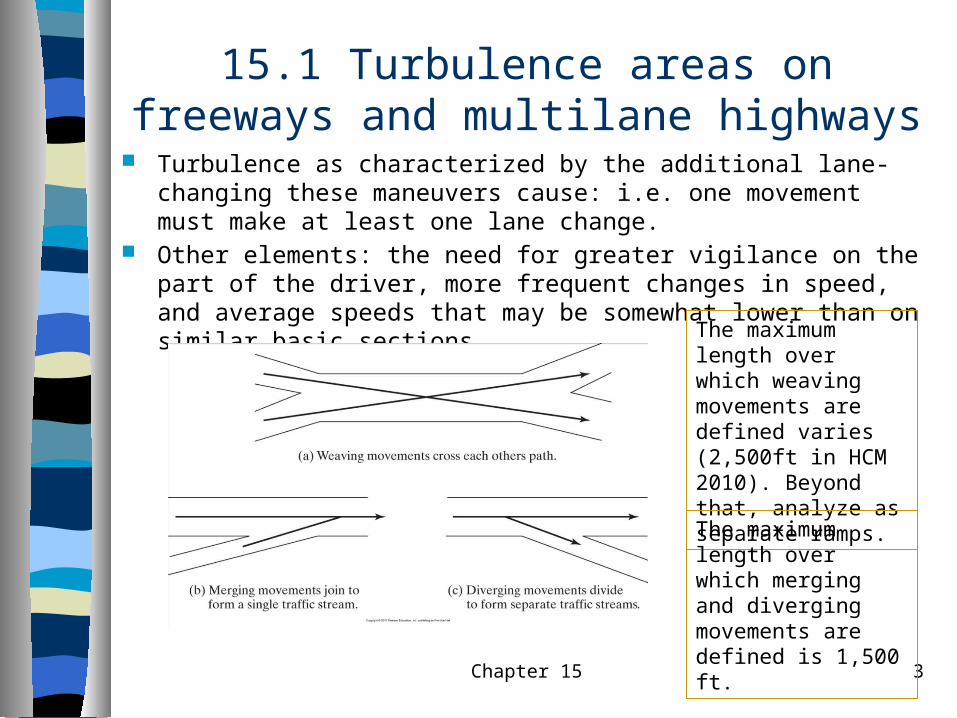
15.1 Turbulence areas on freeways and multilane highways
Turbulence as characterized by the additional lane-changing these maneuvers cause: i.e. one movement must make at least one lane change.
Other elements: the need for greater vigilance on the part of the driver, more frequent changes in speed, and average speeds that may be somewhat lower than on similar basic sections.
The maximum length over which weaving movements are defined varies (2,500ft in HCM 2010). Beyond that, analyze as separate ramps.
The maximum length over which merging and diverging movements are defined is 1,500 ft.
Chapter 15 4
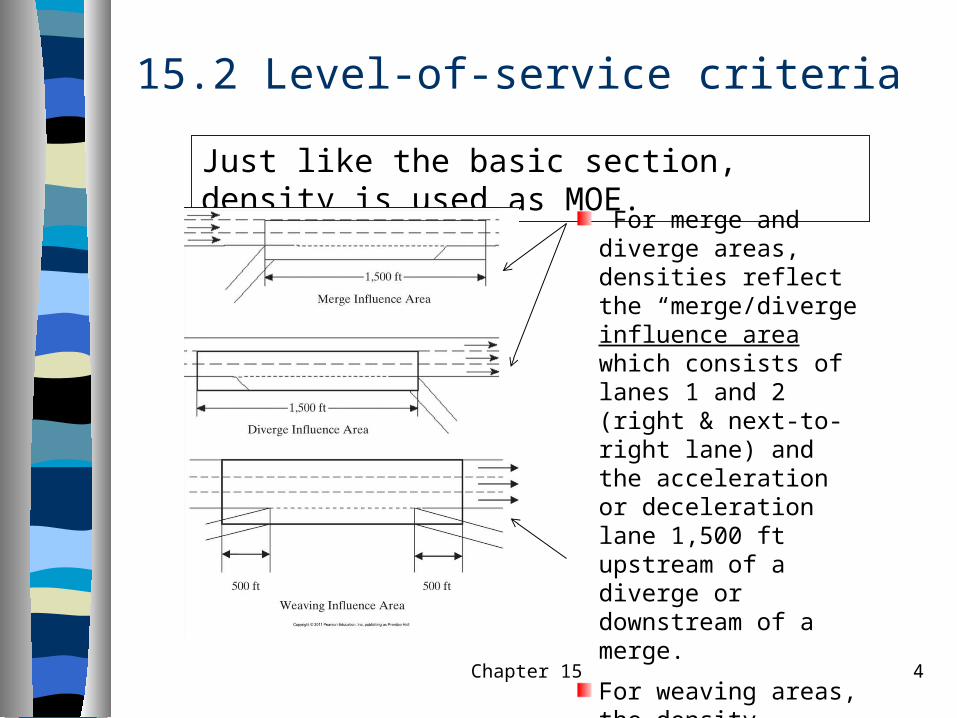
15.2 Level-of-service criteria
Just like the basic section, density is used as MOE.
For merge and diverge areas, densities reflect the “merge/diverge influence area which consists of lanes 1 and 2 (right & next-to-right lane) and the acceleration or deceleration lane 1,500 ft upstream of a diverge or downstream of a merge.
For weaving areas, the density reflects an average for all vehicles across all lanes of the segment between the entry and exit points of the segment.
Chapter 15 5LOS Basic Fwy Segment
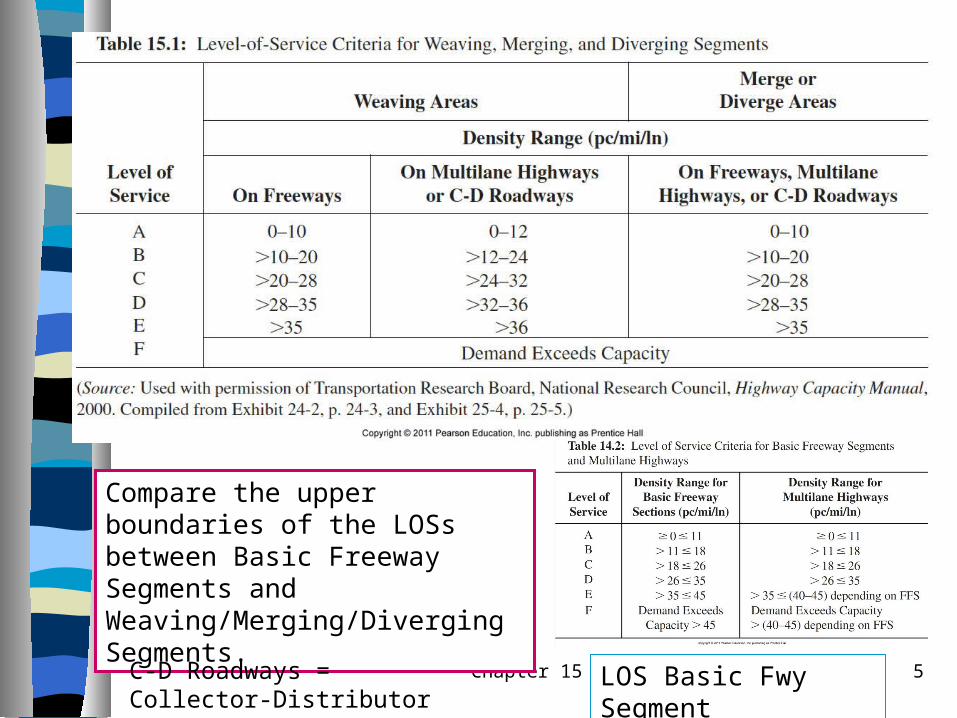
Compare the upper boundaries of the LOSs between Basic Freeway Segments and Weaving/Merging/Diverging Segments.
C-D Roadways = Collector-Distributor Roadways
Chapter 15 6
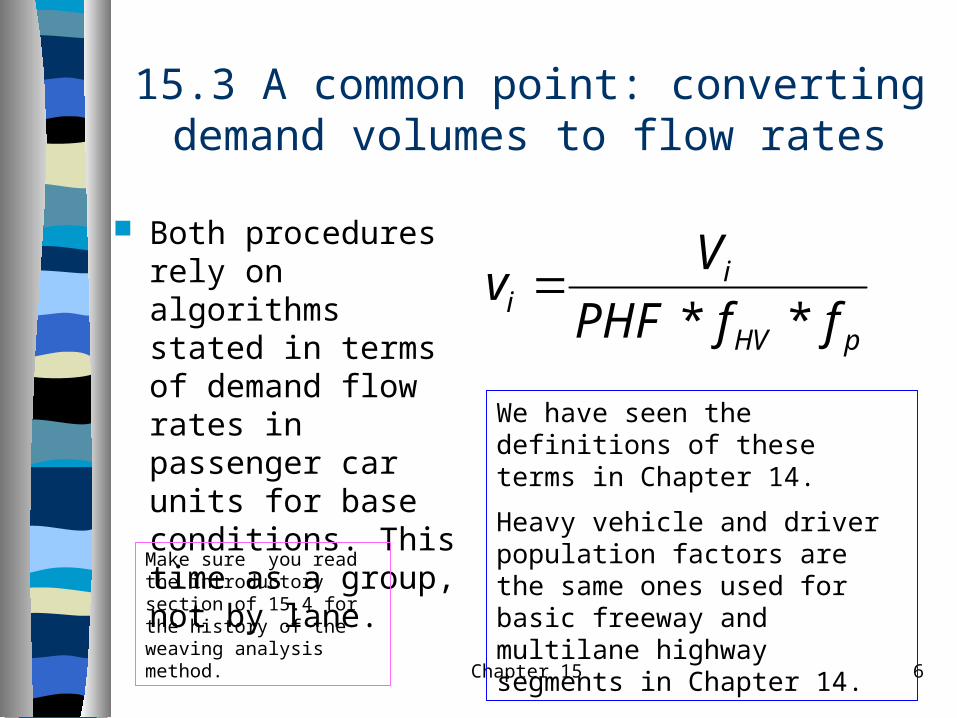
15.3 A common point: converting demand volumes to flow rates
Both procedures rely on algorithms stated in terms of demand flow rates in passenger car units for base conditions. This time as a group, not by lane.
pHV
ii ffPHF
Vv
**
We have seen the definitions of these terms in Chapter 14.
Heavy vehicle and driver population factors are the same ones used for basic freeway and multilane highway segments in Chapter 14.
Make sure you read the introductory section of 15.4 for the history of the weaving analysis method.
Chapter 15 7
15.4 Weaving Segments: Basic characteristics and Variables
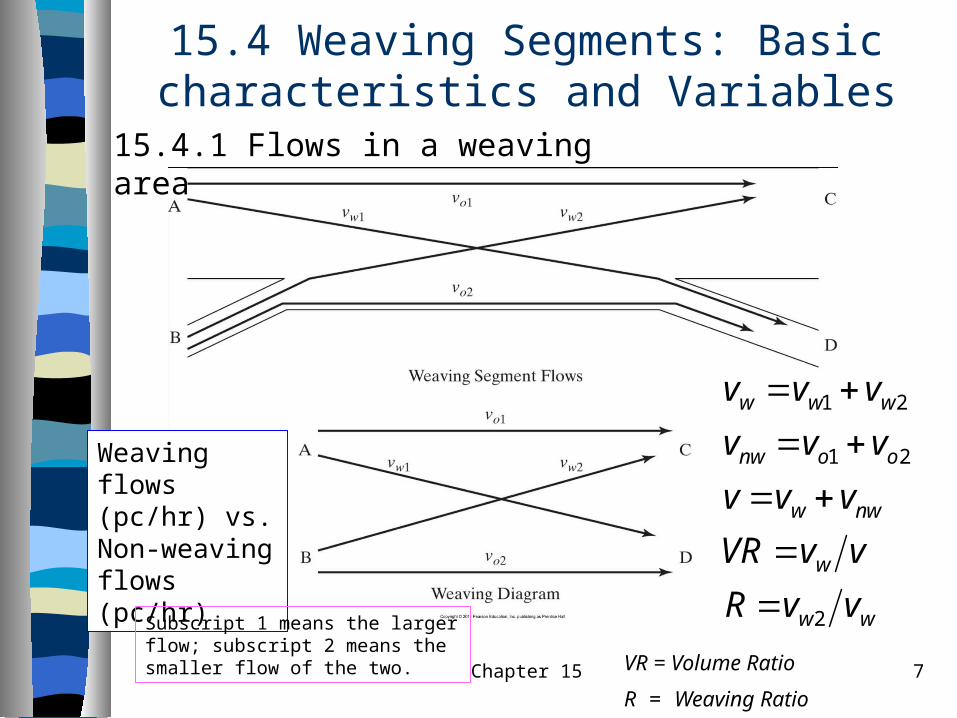
15.4.1 Flows in a weaving area
Weaving flows (pc/hr) vs. Non-weaving flows (pc/hr)
ww
w
nww
oonw
www
vvR
vvVR
vvv
vvv
vvv
2
21
21
VR = Volume Ratio
R = Weaving Ratio
Subscript 1 means the larger flow; subscript 2 means the smaller flow of the two.
Chapter 15 8
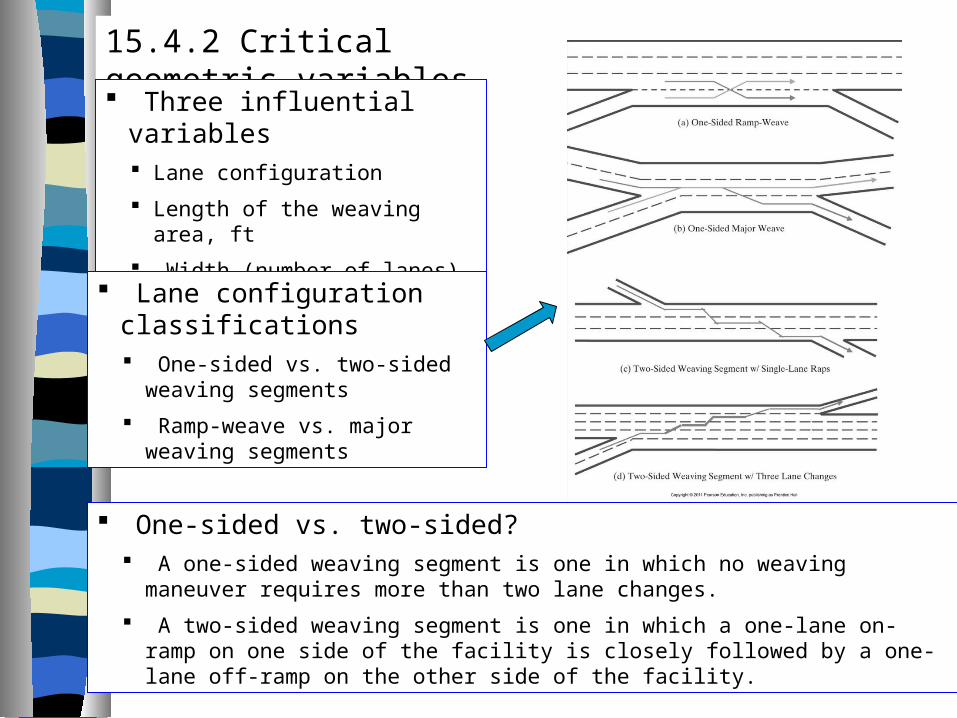
15.4.2 Critical geometric variables
Three influential variables Lane configuration
Length of the weaving area, ft
Width (number of lanes) in the weaving area
Lane configuration classifications One-sided vs. two-sided weaving
segments
Ramp-weave vs. major weaving segments
One-sided vs. two-sided? A one-sided weaving segment is one in which no weaving maneuver requires more than two
lane changes.
A two-sided weaving segment is one in which a one-lane on-ramp on one side of the facility is closely followed by a one-lane off-ramp on the other side of the facility.
Chapter 15 9
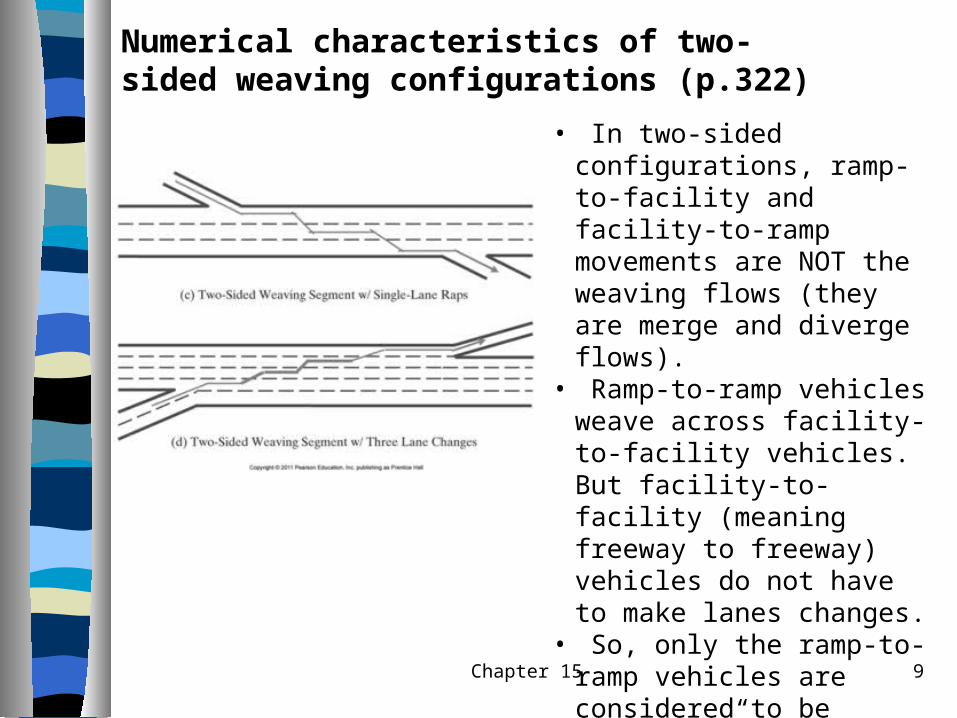
Numerical characteristics of two-sided weaving configurations (p.322)
• In two-sided configurations, ramp-to-facility and facility-to-ramp movements are NOT the weaving flows (they are merge and diverge flows).
• Ramp-to-ramp vehicles weave across facility-to-facility vehicles. But facility-to-facility (meaning freeway to freeway) vehicles do not have to make lanes changes.
• So, only the ramp-to-ramp vehicles are considered to be “weaving.”
• In (d), LCRR = 3 and NWV = 0; in (c). LCRR = 2 and NWV = 0.
Chapter 1510
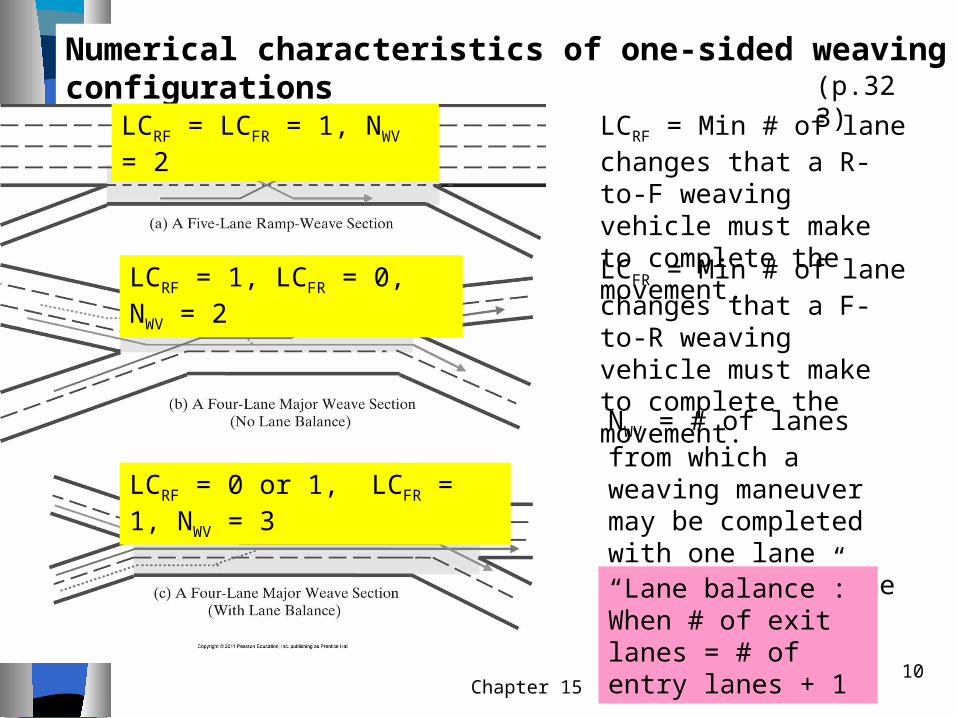
Numerical characteristics of one-sided weaving configurations
LCRF = Min # of lane changes that a R-to-F weaving vehicle must make to complete the movement.
LCFR = Min # of lane changes that a F-to-R weaving vehicle must make to complete the movement.
NWV = # of lanes from which a weaving maneuver may be completed with one lane change, or no lane change.
LCRF = LCFR = 1, NWV = 2
LCRF = 1, LCFR = 0, NWV = 2
LCRF = 0 or 1, LCFR = 1, NWV = 3
“Lane balance”: When # of exit lanes = # of entry lanes + 1
(p.323)
Chapter 15 11
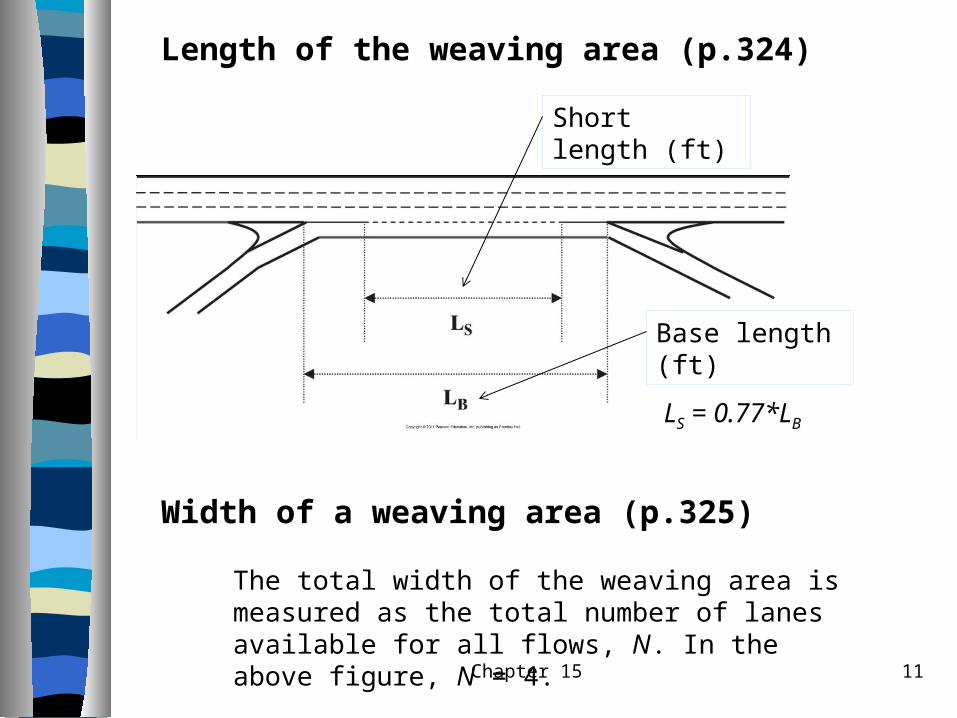
Length of the weaving area (p.324)
Short length (ft)
Base length (ft)
LS = 0.77*LB
Width of a weaving area (p.325)
The total width of the weaving area is measured as the total number of lanes available for all flows, N. In the above figure, N = 4.
Chapter 15 12
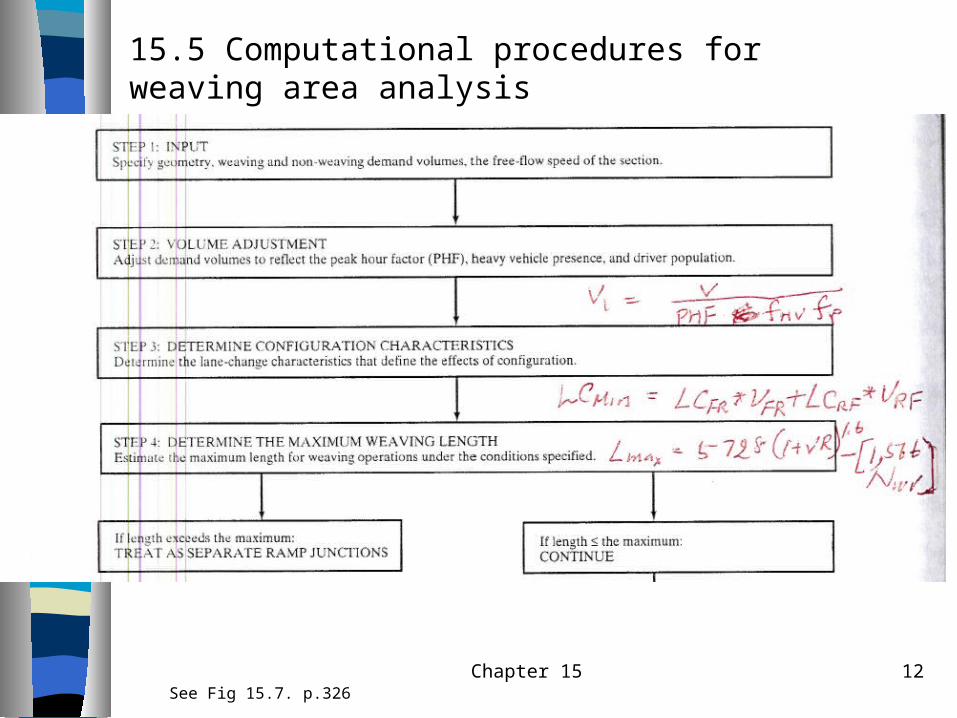
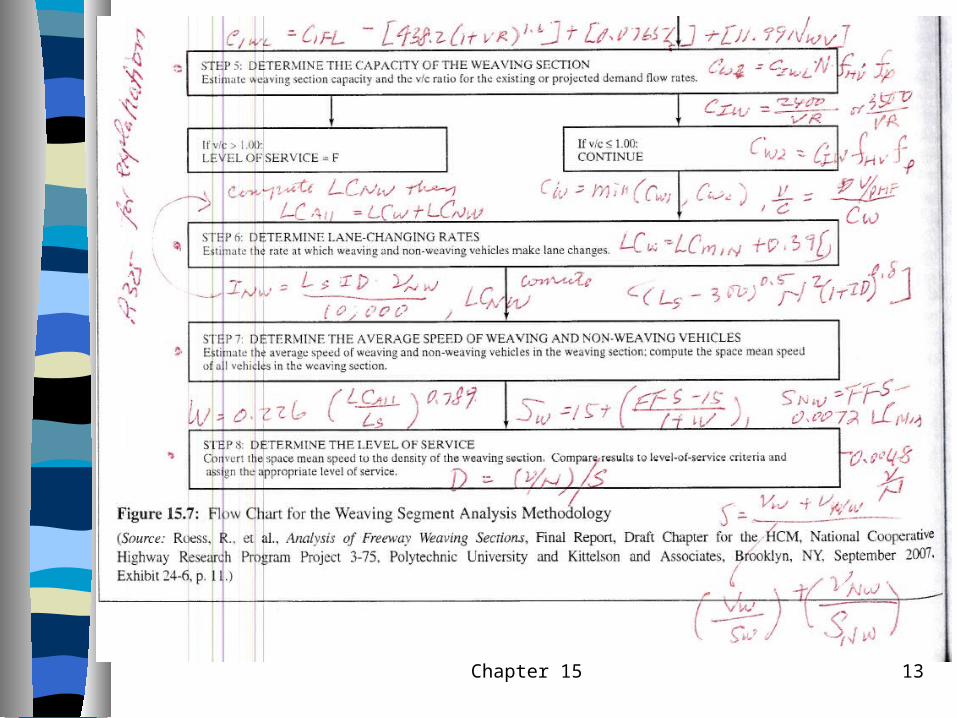
15.5 Computational procedures for weaving area analysis
See Fig 15.7. p.326
Chapter 15 13
Chapter 15 14
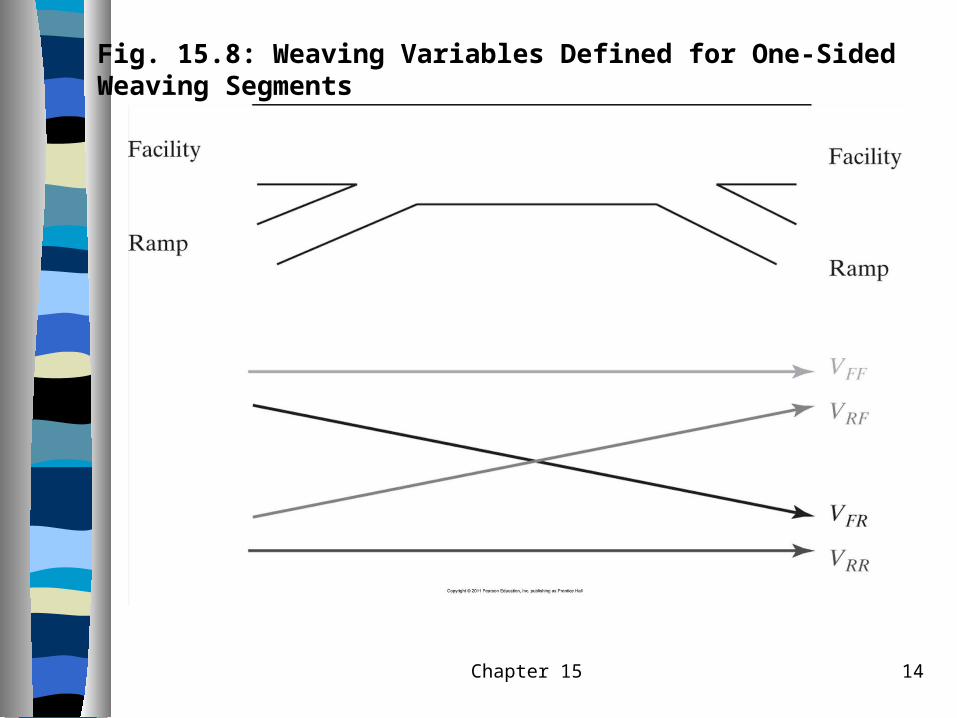
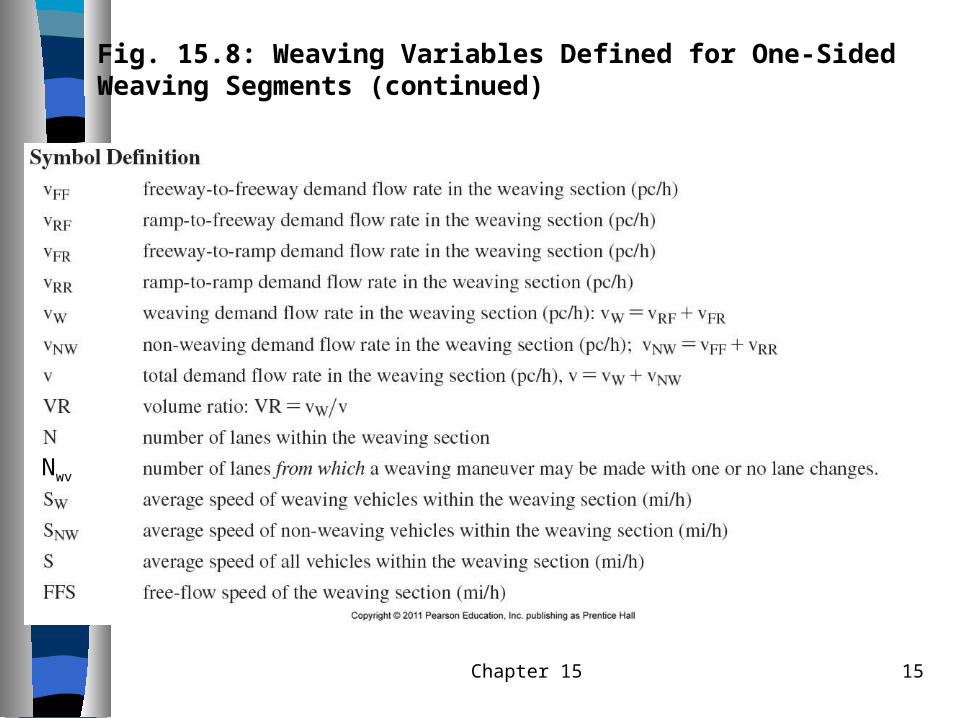
Fig. 15.8: Weaving Variables Defined for One-Sided Weaving Segments
Chapter 15 15
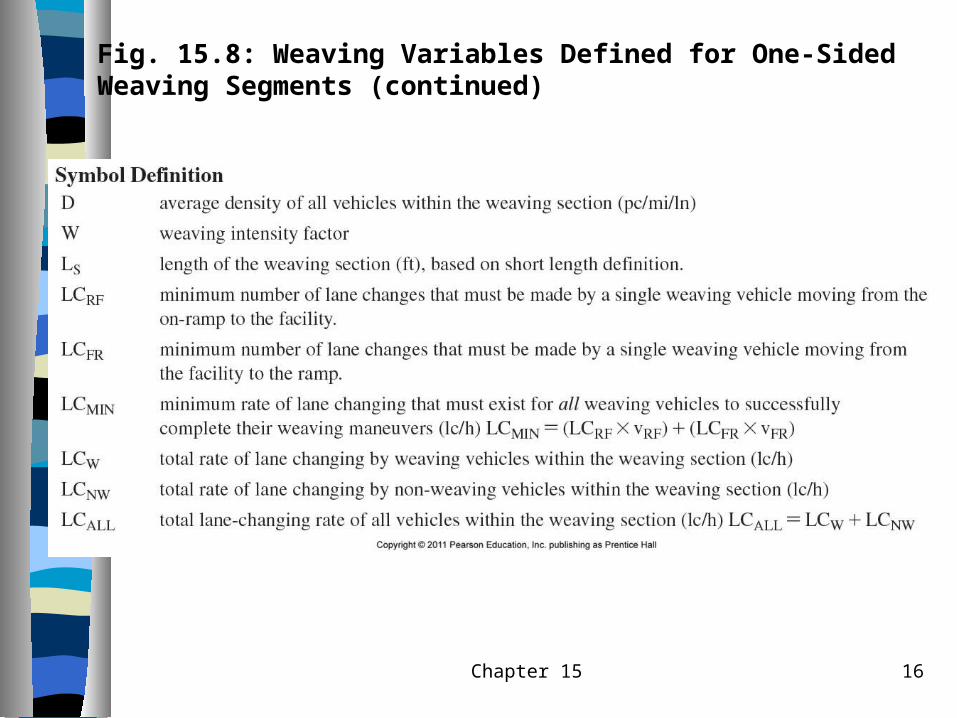
Fig. 15.8: Weaving Variables Defined for One-Sided Weaving Segments (continued)
Nwv
Chapter 15 16
Fig. 15.8: Weaving Variables Defined for One-Sided Weaving Segments (continued)
Chapter 15 17
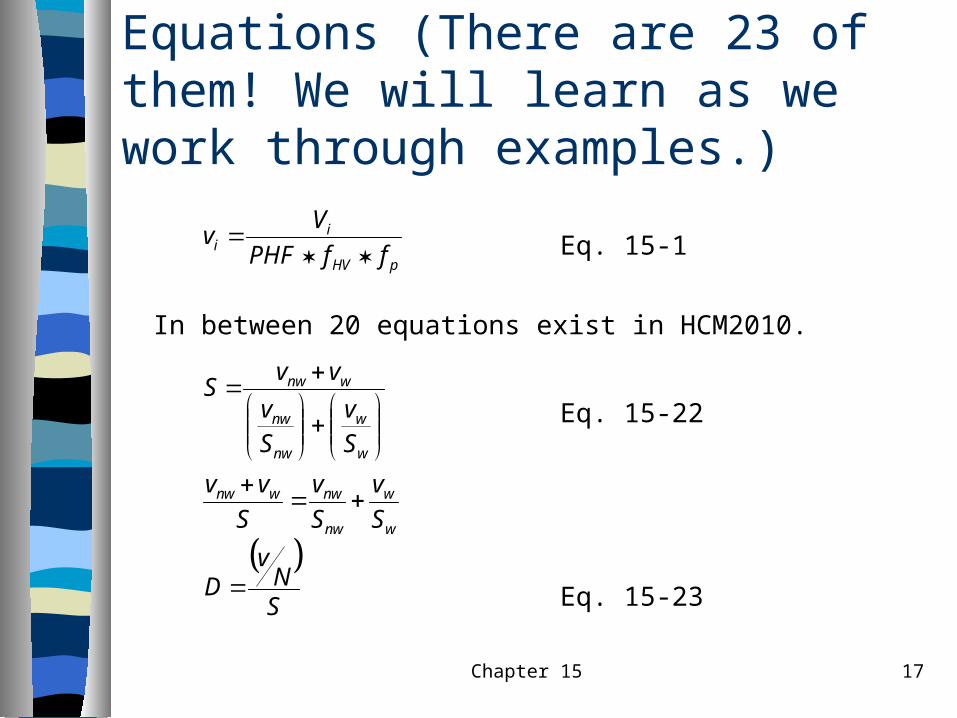
Equations (There are 23 of them! We will learn as we work through examples.)
SN
vD
S
v
S
v
S
vv
S
v
S
v
vvS
ffPHF
Vv
w
w
nw
nwwnw
w
w
nw
nw
wnw
pHV
ii
Eq. 15-1
Eq. 15-22
Eq. 15-23
In between 20 equations exist in HCM2010.
Chapter 15 18
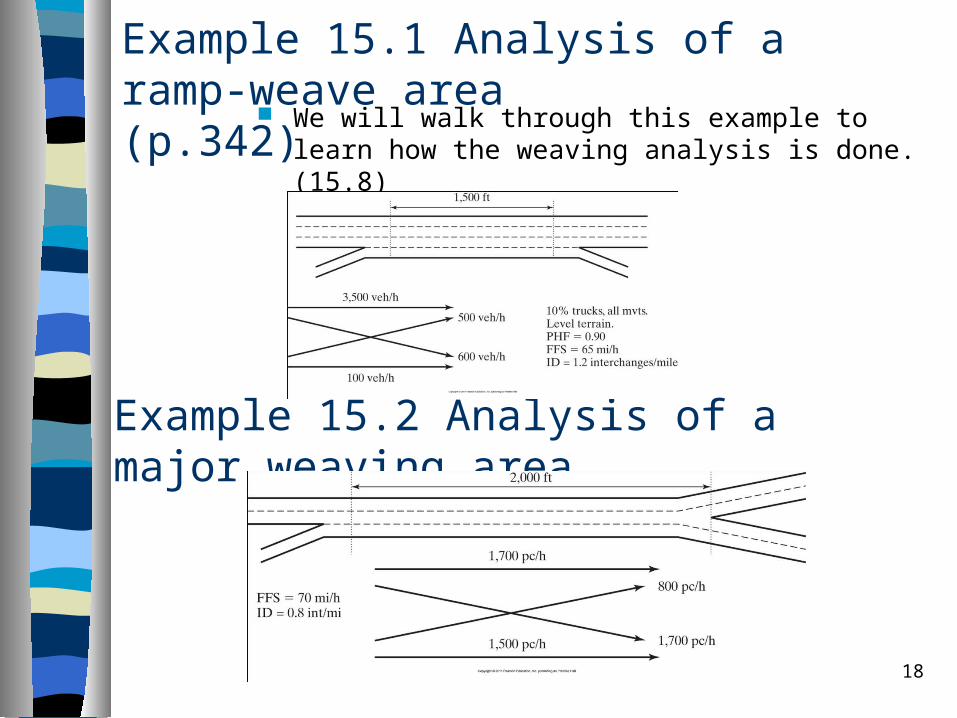
Example 15.1 Analysis of a ramp-weave area(p.342) We will walk through this example to learn how the
weaving analysis is done. (15.8)
Example 15.2 Analysis of a major weaving area
Chapter 15 19
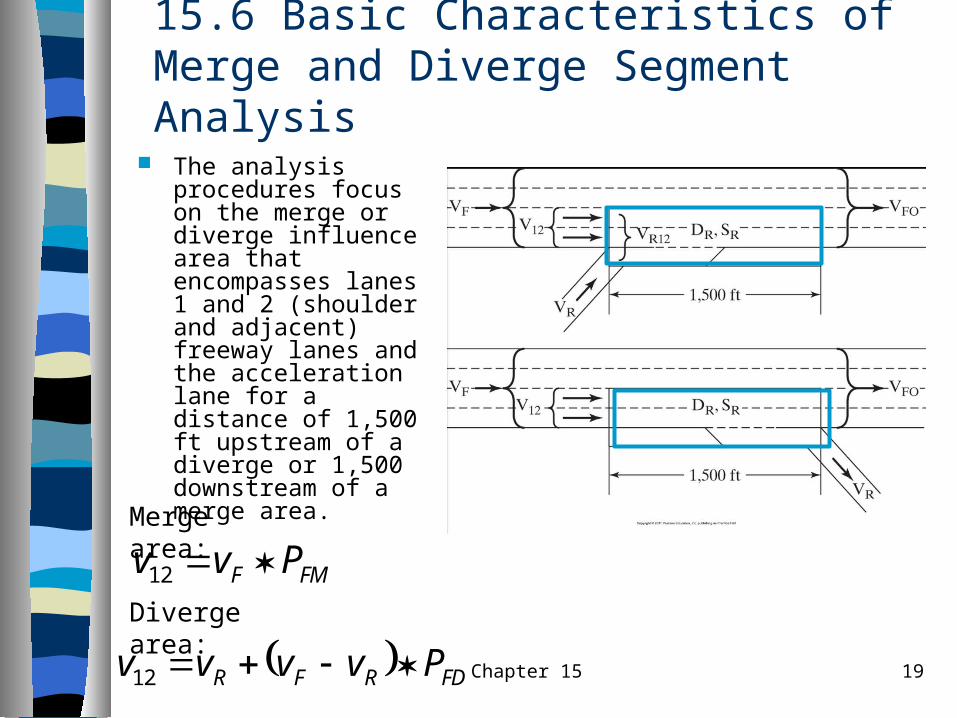
15.6 Basic Characteristics of Merge and Diverge Segment Analysis
The analysis procedures focus on the merge or diverge influence area that encompasses lanes 1 and 2 (shoulder and adjacent) freeway lanes and the acceleration lane for a distance of 1,500 ft upstream of a diverge or 1,500 downstream of a merge area.
Merge area:
Diverge area:
FMF Pvv 12
FDRFR Pvvvv 12
Chapter 15 20
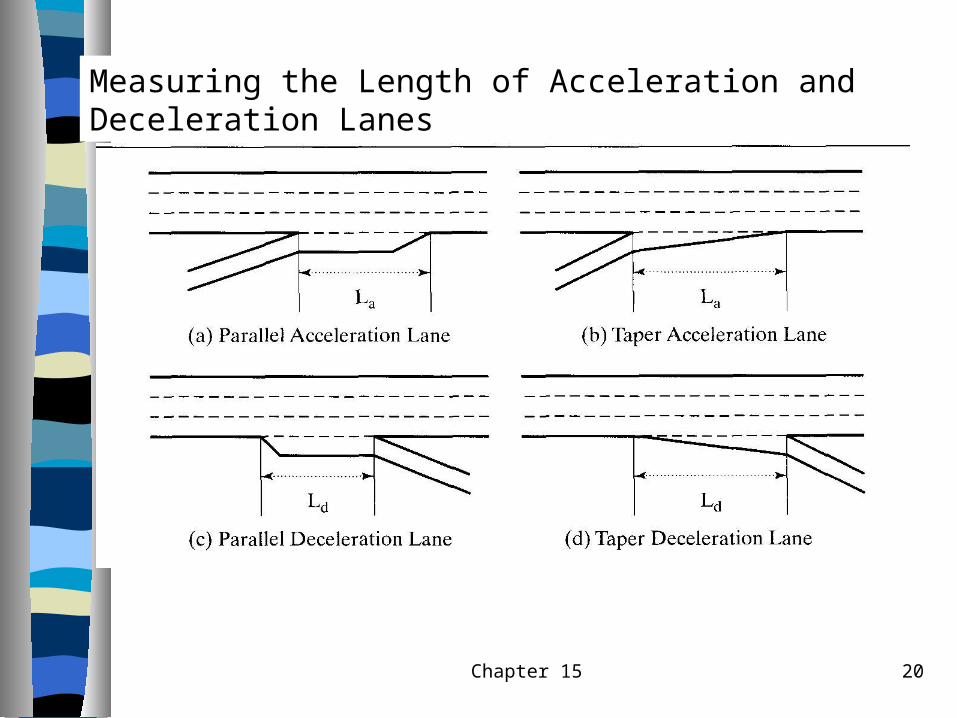
Measuring the Length of Acceleration and Deceleration Lanes
Chapter 15 21
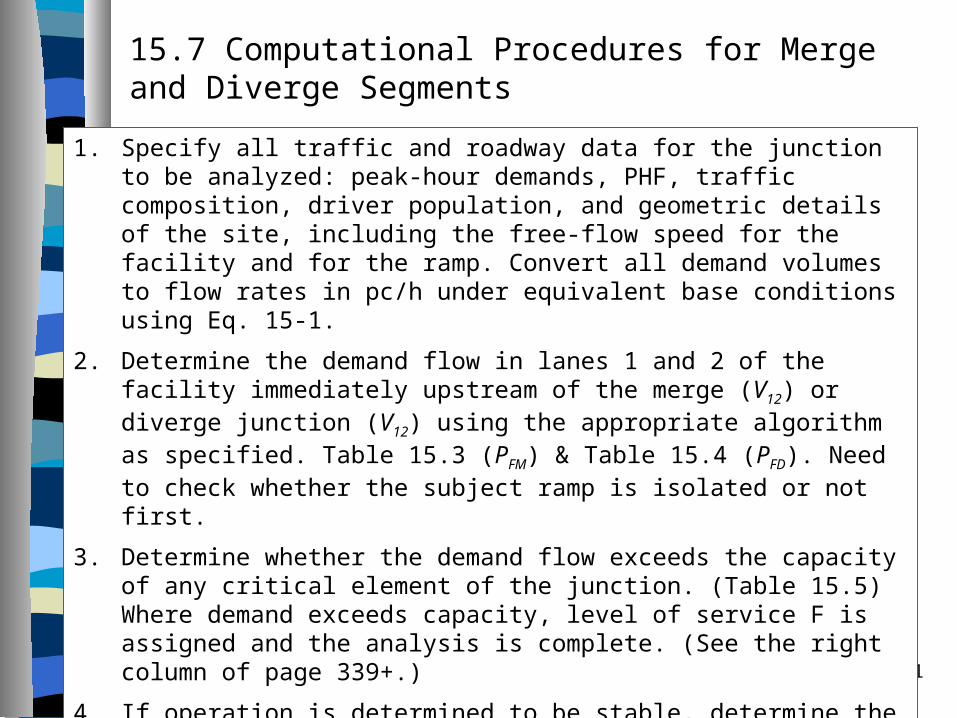
15.7 Computational Procedures for Merge and Diverge Segments
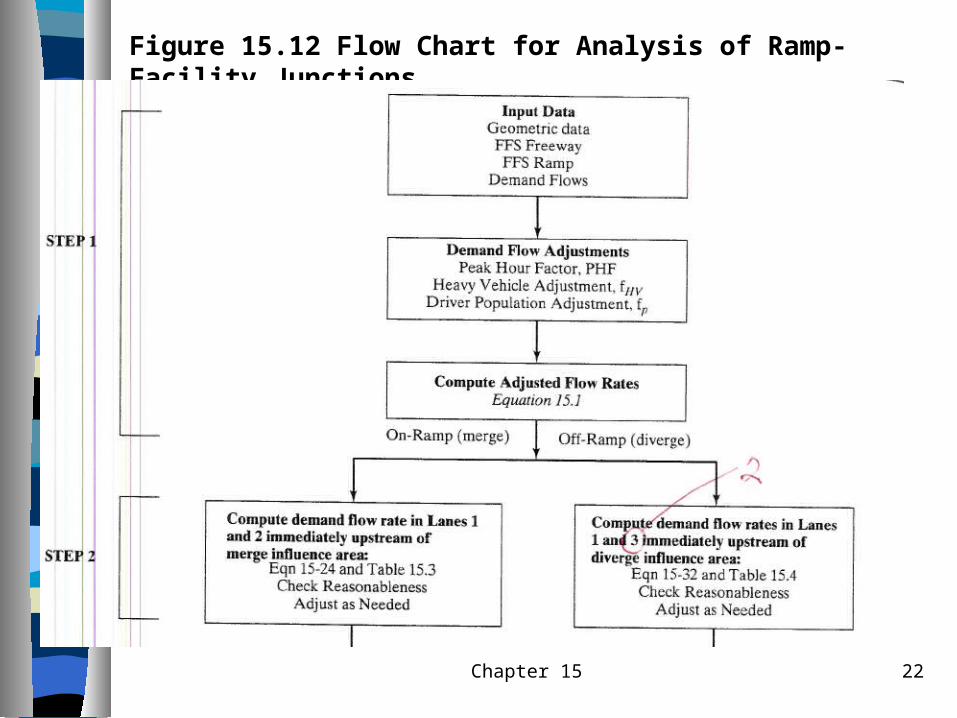
1. Specify all traffic and roadway data for the junction to be analyzed: peak-hour demands, PHF, traffic composition, driver population, and geometric details of the site, including the free-flow speed for the facility and for the ramp. Convert all demand volumes to flow rates in pc/h under equivalent base conditions using Eq. 15-1.
2. Determine the demand flow in lanes 1 and 2 of the facility immediately upstream of the merge (V12) or diverge junction (V12) using the appropriate algorithm as specified. Table 15.3 (PFM) & Table 15.4 (PFD). Need to check whether the subject ramp is isolated or not first.
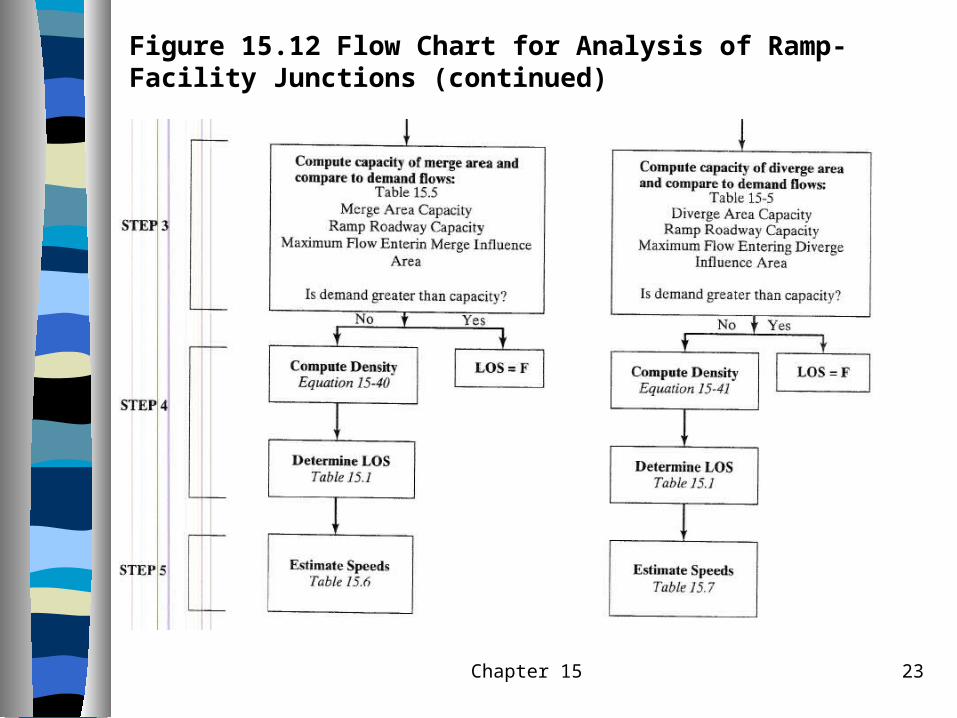
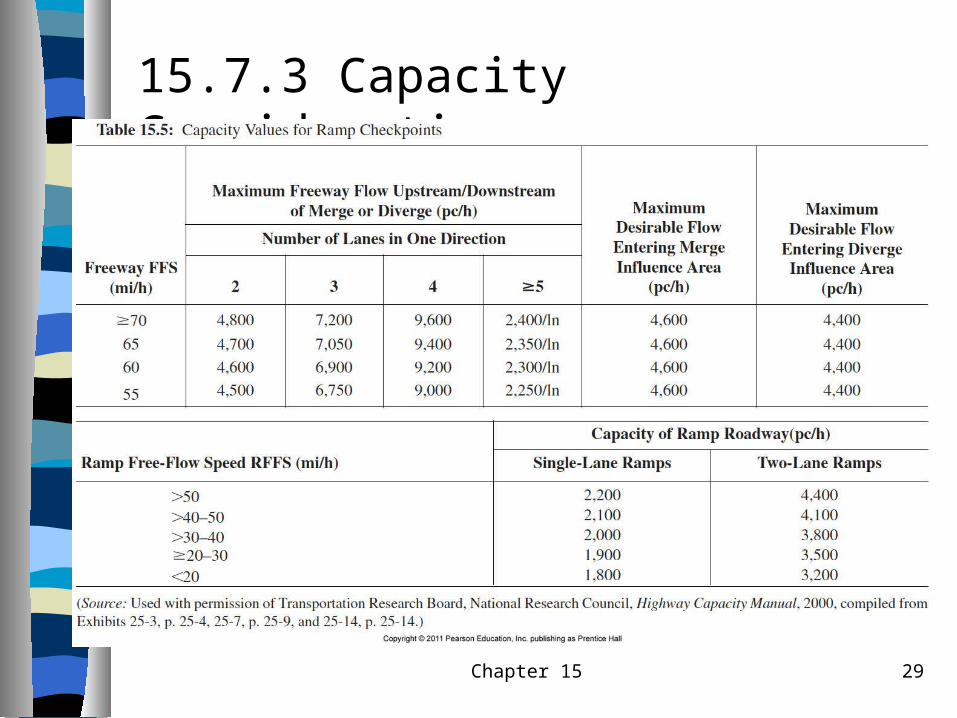
3. Determine whether the demand flow exceeds the capacity of any critical element of the junction. (Table 15.5) Where demand exceeds capacity, level of service F is assigned and the analysis is complete. (See the right column of page 339+.)
4. If operation is determined to be stable, determine the density (Eq. 15-40 for merge and Eq. 15-41 for diverge areas) in the ramp influence area.
5. Determine the speed of all vehicles within the ramp influence area and across all facility lanes as secondary measures of performance. Table 15.6 and 15.7.
Chapter 15 22
Figure 15.12 Flow Chart for Analysis of Ramp-Facility Junctions
Chapter 15 23
Figure 15.12 Flow Chart for Analysis of Ramp-Facility Junctions (continued)
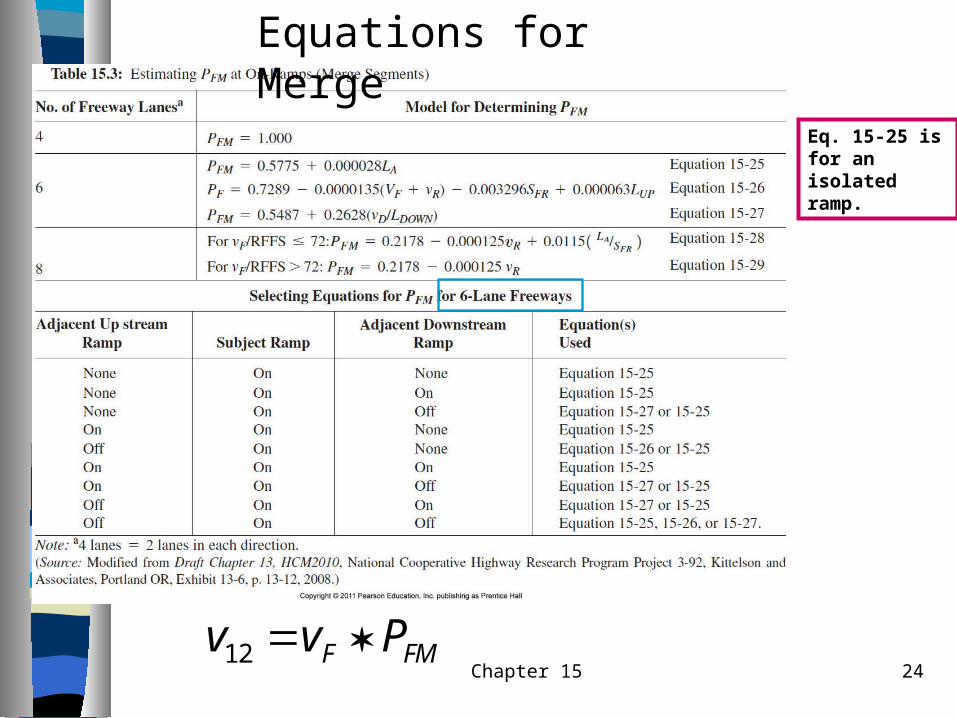
Chapter 15 24FMF Pvv 12
Eq. 15-25 is for an isolated ramp.
Equations for Merge
Chapter 15 25
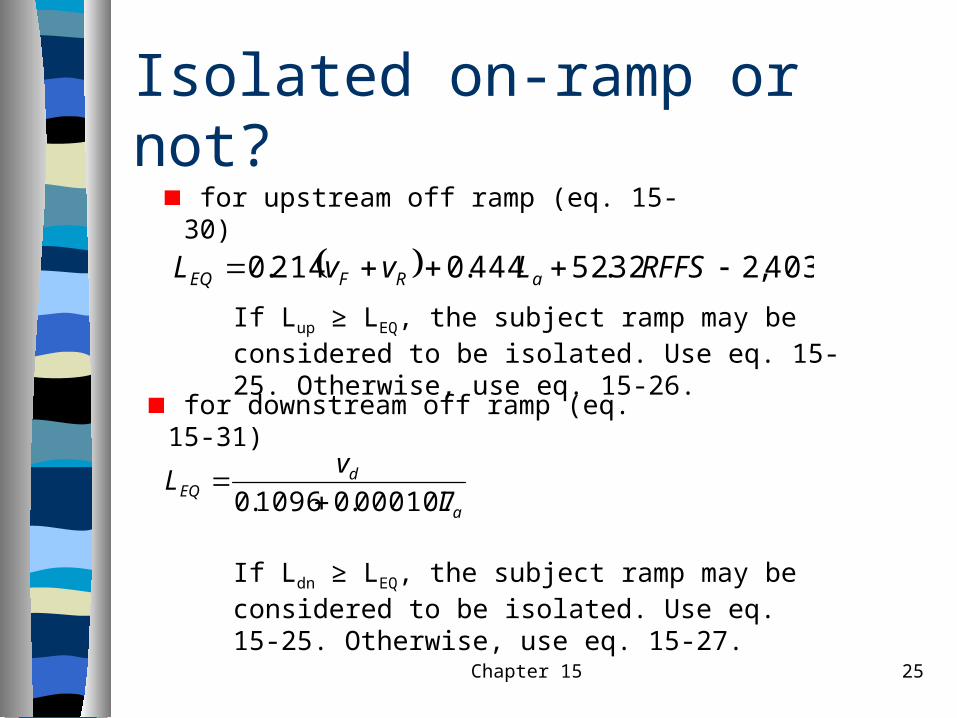
Isolated on-ramp or not?
403,232.52444.0214.0 RFFSLvvL aRFEQ
for upstream off ramp (eq. 15-30)
for downstream off ramp (eq. 15-31)
a
dEQ L
vL
000107.01096.0
If Lup ≥ LEQ, the subject ramp may be considered to be isolated. Use eq. 15-25. Otherwise, use eq. 15-26.
If Ldn ≥ LEQ, the subject ramp may be considered to be isolated. Use eq. 15-25. Otherwise, use eq. 15-27.
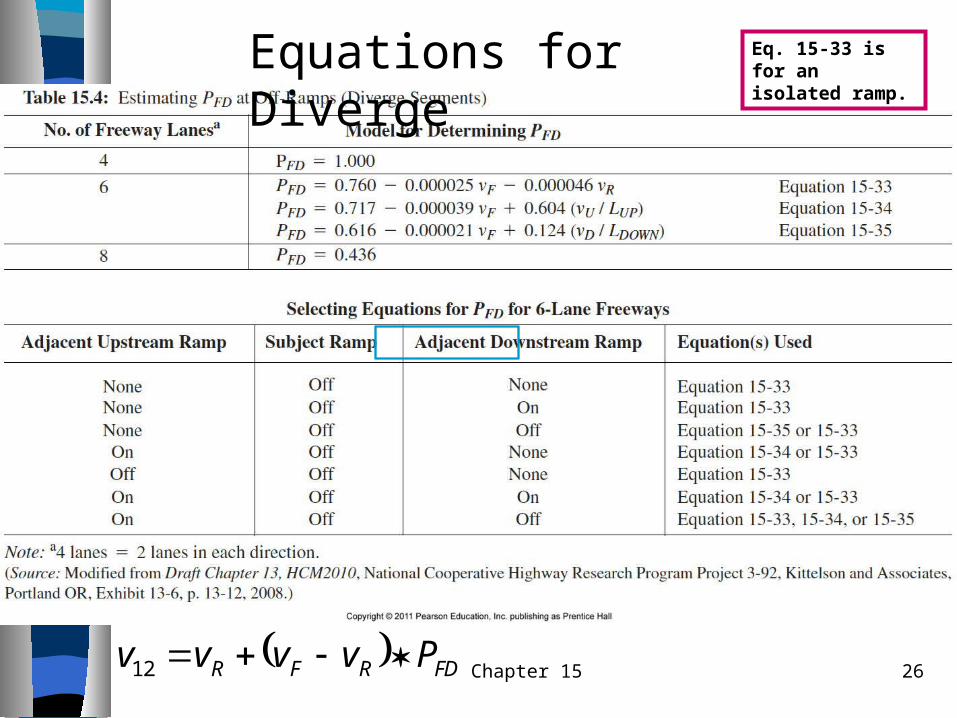
Chapter 15 26 FDRFR Pvvvv 12
Eq. 15-33 is for an isolated ramp.Equations for Diverge
Chapter 15 27
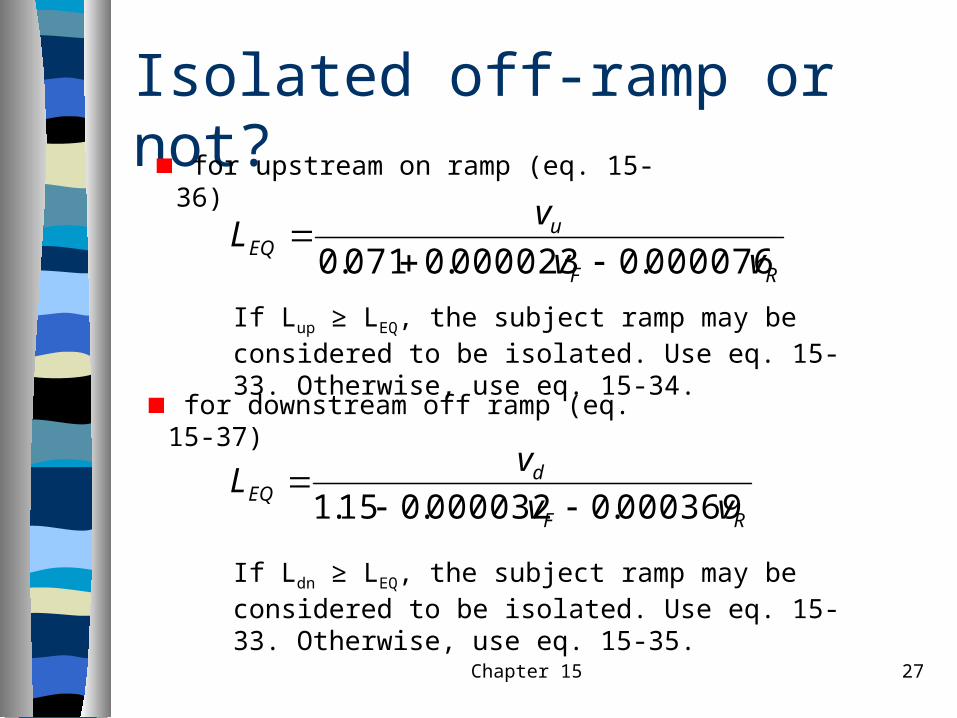
Isolated off-ramp or not?
RF
uEQ vv
vL
000076.0000023.0071.0
for upstream on ramp (eq. 15-36)
for downstream off ramp (eq. 15-37)
RF
dEQ vv
vL
000369.0000032.015.1
If Lup ≥ LEQ, the subject ramp may be considered to be isolated. Use eq. 15-33. Otherwise, use eq. 15-34.
If Ldn ≥ LEQ, the subject ramp may be considered to be isolated. Use eq. 15-33. Otherwise, use eq. 15-35.
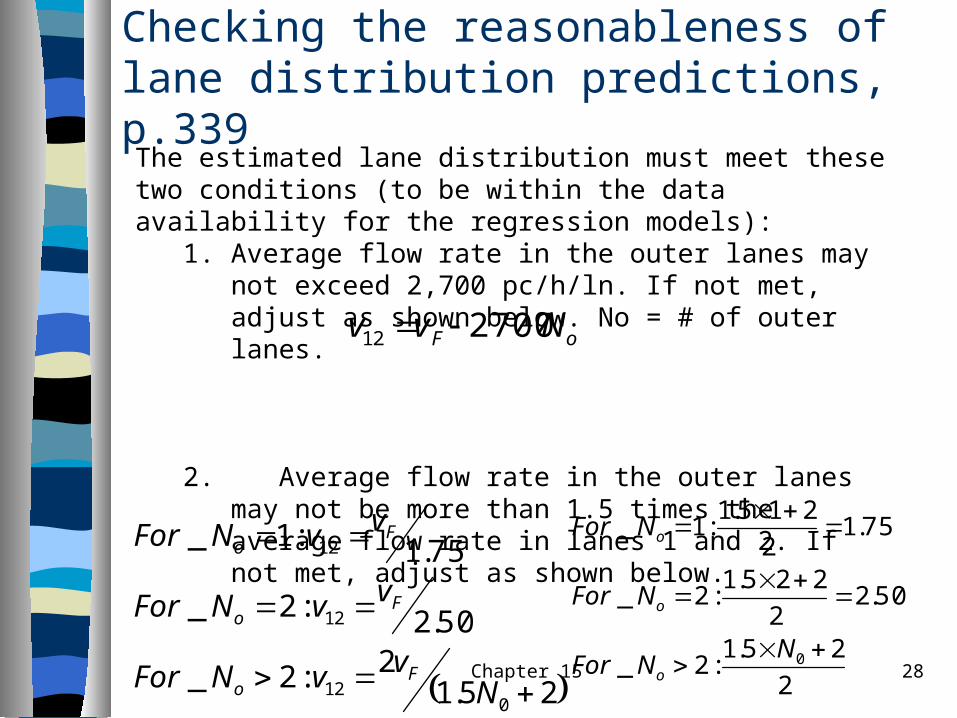
Checking the reasonableness of lane distribution predictions, p.339
Chapter 15 28
The estimated lane distribution must meet these two conditions (to be within the data availability for the regression models):
1. Average flow rate in the outer lanes may not exceed 2,700 pc/h/ln. If not met, adjust as shown below. No = # of outer lanes.
2. Average flow rate in the outer lanes may not be more than 1.5 times the average flow rate in lanes 1 and 2. If not met, adjust as shown below.
oF Nvv 270012
25.12:2_
50.2:2_
75.1:1_
012
12
12
NvvNFor
vvNFor
vvNFor
Fo
Fo
Fo
2
25.1:2_
50.22
225.1:2_
75.12
215.1:1_
0
NNFor
NFor
NFor
o
o
o
Chapter 15 29
15.7.3 Capacity Considerations
Chapter 15 30
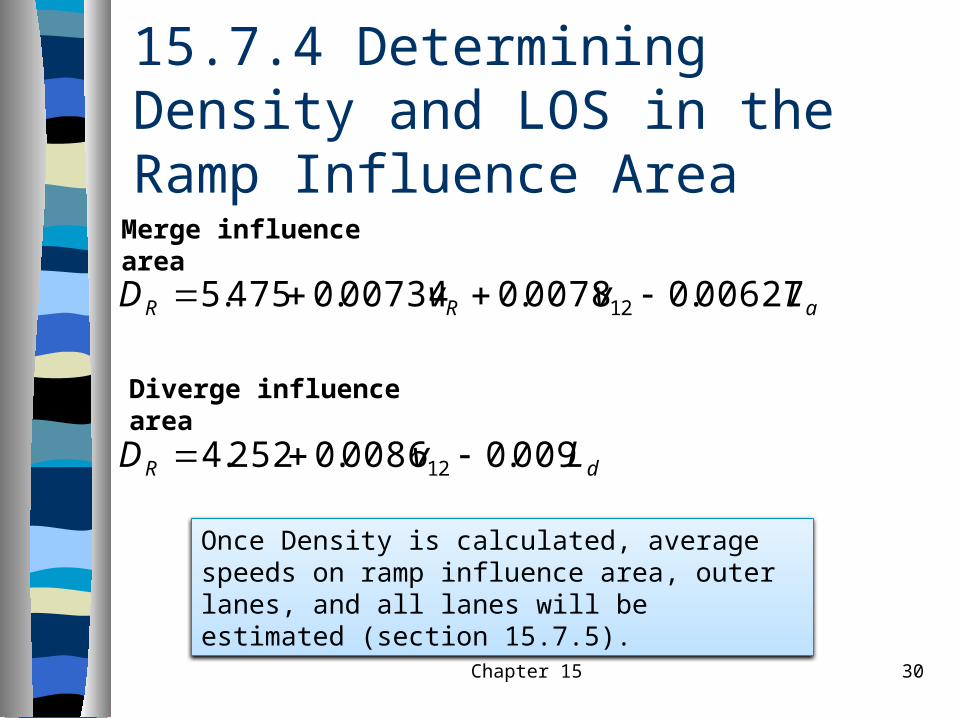
15.7.4 Determining Density and LOS in the Ramp Influence Area
dR
aRR
LvD
LvvD
009.00086.0252.4
00627.00078.000734.0475.5
12
12
Merge influence area
Diverge influence area
Once Density is calculated, average speeds on ramp influence area, outer lanes, and all lanes will be estimated (section 15.7.5).
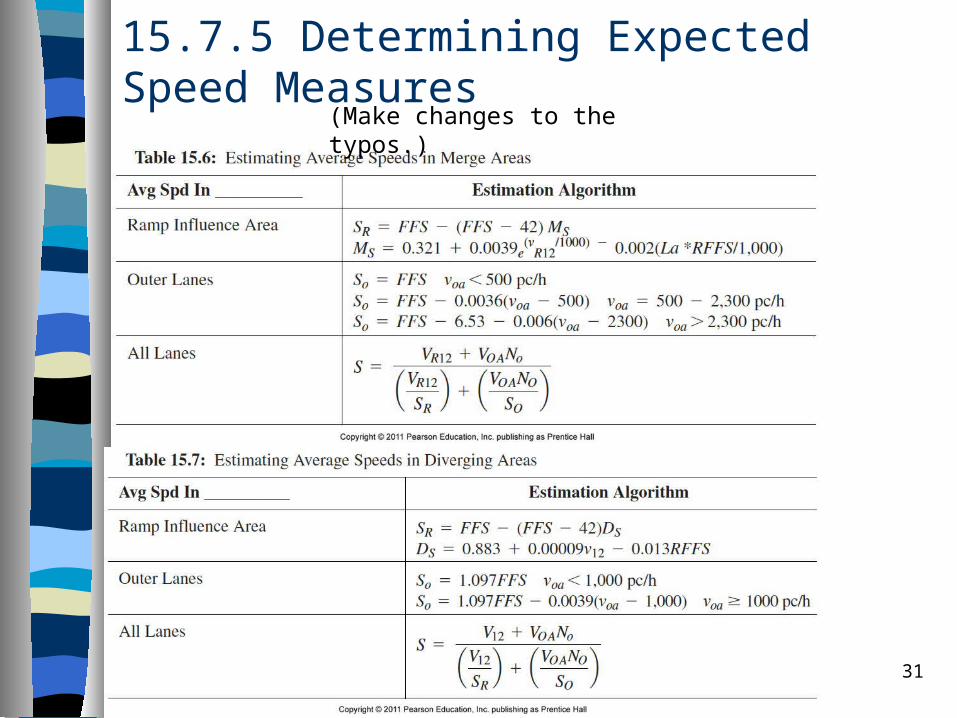
15.7.5 Determining Expected Speed Measures
Chapter 15 31
(Make changes to the typos.)
Chapter 15 32
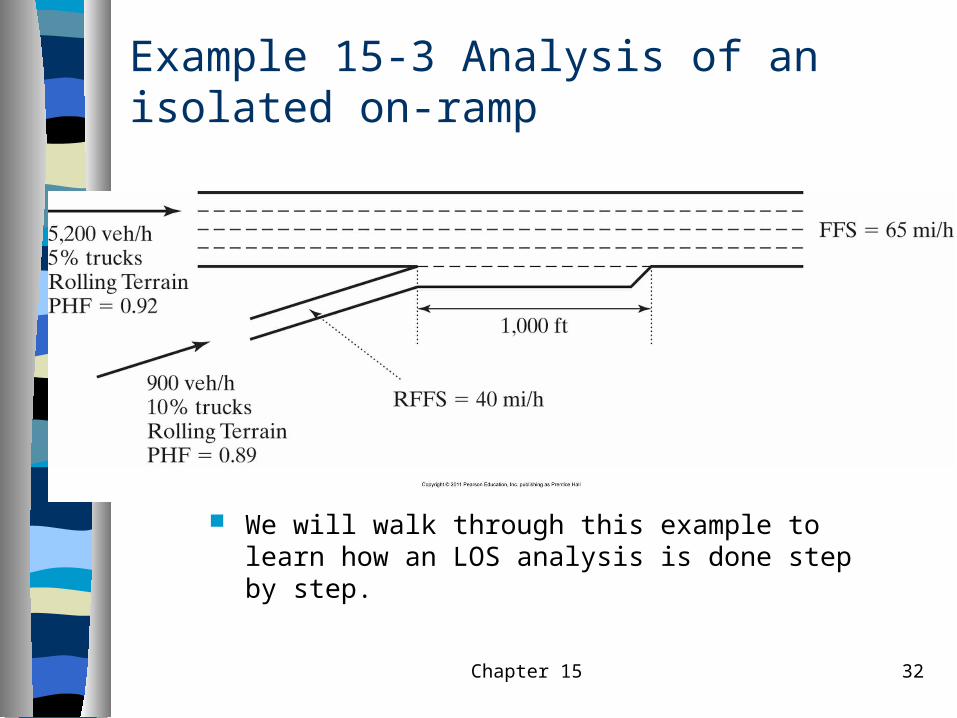
Example 15-3 Analysis of an isolated on-ramp
We will walk through this example to learn how an LOS analysis is done step by step.
Chapter 15 33
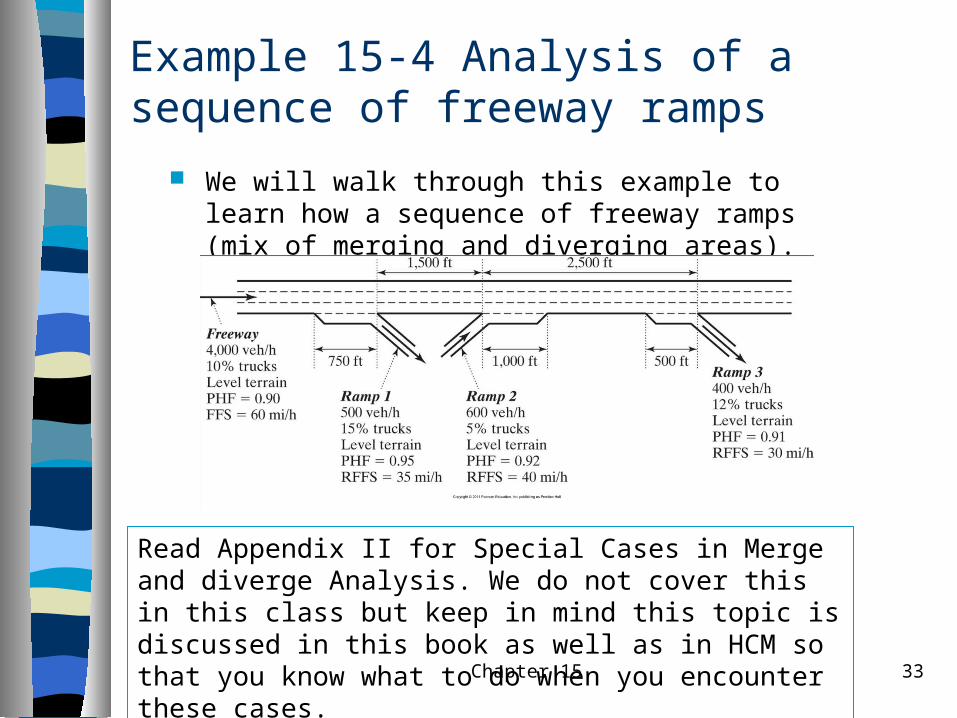
Example 15-4 Analysis of a sequence of freeway ramps
We will walk through this example to learn how a sequence of freeway ramps (mix of merging and diverging areas).
Read Appendix II for Special Cases in Merge and diverge Analysis. We do not cover this in this class but keep in mind this topic is discussed in this book as well as in HCM so that you know what to do when you encounter these cases.