Chapter 15 Visual Bart Reader VBR I and II systems
22
289 Chapter 15 Visual Bart Reader VBR I and II systems 15.1 Introduction In this “modern era” when virtually all devices have to include time saving techniques that reduce monitoring costs and improve precision and reliability. In DBI these concerns are taken very seriously and this chapter addresses the various systems and software that have been developed and is available from DBI. There are two systems that can be used for the time lapse photography of the Bart testers when they are being incubated. These are known as the visual Bart reader (VBR) systems. Both VBR systems employ two rows of nine testers which are illuminated from below. There are therefore a total of eighteen testers within a VBR system. These are monitored using a time lapse camera that records an .jpg image every fifteen minutes. There are two versions. VBR I is the basic set up that would normally operate at room temperature (generally recognized to be 22±2 o C). VBR I can be placed in a temperature controlled room but the upper temperature limit is 45 o C. VBR II has the advantage of the rack of illuminate Bart testers being placed with a temperature controlled incubator that will function at room temperatures up to 62 o C. If the VBR II is placed in a cold room then it is possible to get down to 4 o C. VBR II set is shown in Plate 15.1 and 15.2. %CBR software interpretation is shown in Plate 15.3. Software exists for the Bart testing in two distinct bundles. The first software described below is the percentage confirmatory bacterial reduction (%CBR) and is primarily linked to the development of a new approach to the more rapid testing for biochemical oxygen demand in treated effluents to be released into the environment. Here the %CBR software can only be used with the HAB- or BOD- testers. The other software package is called the VBR software and is for the interpretation the reactions and activities from the SRB-, IRB-, SLYM-, HAB-, DN-, and the FLOR- testers. Information on the VBR software is available at no charge by contacting [email protected]. %CBR software can also be obtained in this manner but instructions on its use is given below as sections 5.2 to 5.9.
Transcript of Chapter 15 Visual Bart Reader VBR I and II systems
289
Chapter 15
Visual Bart Reader VBR I and II systems
15.1 Introduction
In this “modern era” when virtually all devices have to include time saving techniques that
reduce monitoring costs and improve precision and reliability. In DBI these concerns are taken
very seriously and this chapter addresses the various systems and software that have been
developed and is available from DBI.
There are two systems that can be used for the time lapse photography of the Bart testers when
they are being incubated. These are known as the visual Bart reader (VBR) systems. Both VBR
systems employ two rows of nine testers which are illuminated from below. There are therefore a
total of eighteen testers within a VBR system. These are monitored using a time lapse camera
that records an .jpg image every fifteen minutes. There are two versions. VBR I is the basic set
up that would normally operate at room temperature (generally recognized to be 22±2oC). VBR
I can be placed in a temperature controlled room but the upper temperature limit is 45oC. VBR II
has the advantage of the rack of illuminate Bart testers being placed with a temperature
controlled incubator that will function at room temperatures up to 62oC. If the VBR II is placed
in a cold room then it is possible to get down to 4oC. VBR II set is shown in Plate 15.1 and 15.2.
%CBR software interpretation is shown in Plate 15.3.
Software exists for the Bart testing in two distinct bundles. The first software described below is
the percentage confirmatory bacterial reduction (%CBR) and is primarily linked to the
development of a new approach to the more rapid testing for biochemical oxygen demand in
treated effluents to be released into the environment. Here the %CBR software can only be used
with the HAB- or BOD- testers. The other software package is called the VBR software and is
for the interpretation the reactions and activities from the SRB-, IRB-, SLYM-, HAB-, DN-, and
the FLOR- testers. Information on the VBR software is available at no charge by contacting
[email protected]. %CBR software can also be obtained in this manner but instructions on its use is
given below as sections 5.2 to 5.9.

290
15.2 Preparation of the HAB- or BOD- tester for %CBR testing
It is recommended that latex gloves be worn during the setting up of the laboratory version of the
HAB- or BOD- Bart tester to reduce the risk of contamination. Follow the sequence of activities
as described below.
(i) Write the sample information with a fine tipped permanent black marker above the fill
line so that it can be easily viewed by the operator and/or the VBR I system. Note that
the VBR I system is required to incubate the temperature to 22±1oC as well as the time
lapse camera and software. Note 22±1oC is the recommended temperature for the
confirmatory bacterial reductions test. If the rom for the testing cannot be maintained at
22±1oC then the VBR II system can be employed to ensure that those temperatures are
maintained. In the event that the room for the testing is commonly above that
recommended temperature then the VBR II unit can be used installed within a larger
refrigerator or cooled room set to no higher than 15oC. The incubator will now maintain
the desired temperature of 22±1oC.
(ii) Unscrew the inner (dark or light blue) cap from the HAB- or BOD- tester (respectively)
and place the cap down on a clean surface without turning it over. Note also that the
contents of the tester are now exposed to possible contamination from the outside
environment and so the next steps should be done quickly. Unscrew the cap from the
sample container and slowly pour sufficient sample (to be tested) into the inner tester
vial to bring the water level up to the fill line indicating 15±0.25mL of sample has been
added. The ball will float up on the rising sample water column extending up to the fill
line. When pouring or pippetting samples into the uncapped tester vial, every effort
should be made to direct a stream of the sample water over the center of the ball rather
than allowing it to trickle down the side of the tester. Maximum tolerance for error
when filling the tester is 5% so that the amount of water sample being tested falls within
the range of 14.75 and 15.25mL. It should be noted that the sample container retains a
headspace of air over the sample so that some oxygen will diffuse down into the liquid
sample during testing.
(iii) Once the tester has been charged to the fill line then immediately screw the cap down on
to the tester. Invert the freshly charged vial for 30seconds to allow the methylene blue
291
indicator (dried in the cap) to begin the diffuse into the sample and turn it blue
(oxidative). To ensure that the blue indicator is evenly mixed into the sample and now
rotate the tester three times using a gentle wrist action.
(iv) The charged (blue) tester can now be placed in the appropriate slot on the VBR I rack.
Here for wastewater testing it is suggested that triplicate testing be performed. In this
case PE would be placed in A1, 2, and 3 slots (upper left) and FE in the B1, 2, and 3
slots (upper central three slots). Other triplicated samples may be placed in triplicate in
slots C, D, E or F. Make sure that the sample label always faces towards the camera and
so it will be readily recorded on every .jpg image.
(v) It cannot be overemphasised that preparing the testers should be done quickly with
precision and immediate loading into the VBR I as quickly as possible. Inadvertent
delays in starting can seriously impair accuracy. Once the VBR door is closed with the
testers in place then the camera should be started by moving the rotary mode switch from
“SET UP” to “AUTO” (see section 15.5). Remember to move quickly out of the field of
view to ensure that the first image is clean and does not include the odd arm, hand or eye!
Remember to make sure that the memory card inserted into the camera has been wiped
clean of all data and certainly contains no jpeg images (.i.e. is empty). The time lapse
camera will automatically take the first image on the memory card to be the first image
and all subsequent images will be set at 15 minute intervals.
Positive reactions commonly occur in wastewater using the HAB- or BOD- testers will go
positive in less than 30 hours with UP reactions in less than thirty hours at 28±1oC. As the testers
take longer to go positive then the active populations detected becomes smaller. Time lapse is
therefore inversely related to population and so a sample taking 30hours to go positive is a very
small population.
292
15.3 Comparisons with the standard BOD5 protocol
In 2002 a draft document was prepared for the Canadian Environmental Technology Verification
but was not submitted due to incompleteness of the trials to define precision. In August 2006 and
American ETV document was prepared in parallel with the completion of those trials. In
summary this document included the following findings that are still relevant in 2013:
Seeding of bacteria for the calibration and confirmation of precision was developed
although secondary testing (2010 – 12) has revealed that the primary influent (PE) from a
sanitary municipal WWTP through dilution can be successfully used for this purpose.
Correlations between BOD5 and the predicted bacteriological populations achieved using
linear regression analysis where R2 correlations ranged between 0.941 and 0.987.
However this varied with each WWTP and led to the conclusion (2012) that comparison
should be made between the Primary influent and the sample (e.g. final effluent) being
tested at the same time to determine the percentage change (commonly reduction as
%CBR) in the bacterial populations from the PI to the sample under test. This was not
considered in the previous studies (1996 to 2005).
Incubation temperatures for convenience has been set at room temperature (22±2oC) and
it was found by thermal gradient analysis of time lapses from ranges as low as 4oC to as
high as 45oC that there was less variation occurring at 22±1
oC. This temperature
generates slower growth than can be achieved at 28±1oC but initial findings indicate that
there is better precision at the lower temperature but with the disadvantage of longer
incubation times.
Sample storage conditions were found to be critical and the recommended protocol was
to have the samples come up (or down) to room temperature (22±2oC) before beginning
the test with the storage time should not normally exceed four hours before the start of
testing.
Potential of toxic agents in the samples. It has been found that the PI for the two WWTP
studied have populations that range from 4 to 78billion pac/mL. If the PI is found to have
a population of less than one billionpac/mL this could be taken as the threshold “marker
of concern” since there would be likely to be toxicity affecting the bacterial population.
This threshold would be lower than that that which could occur through dilution due to
293
excessive precipitation or with snow melt run off. This check would be specific for each
WWTP and would be affected by environmental; conditions.
Nitrification inhibition was found to cause a 3% decline in populations in the PI. Since
the protocol calls for no more than 30 hours of incubation it is highly probable that the
nitrifying bacteria would not yet have become sufficiently active (generally there is three
day start-up period needed before this is a significant concern) to generate nitrate which
could then interfere with the precision. Due to the short incubation times (<30hours) the
inhibitor was considered to be unnecessary CBR test protocol.
Replicated trials of the BOD5 and the CBR found that there was similar variability found
particularly with the percentage variance being: PI 13.7%, PE 9.5%, lagoons ranging
from 5.8 down to 2.73% in secondary effluent 2.58 to 3.27% and final effluent had a
much better precision averaging at 2.9%.
It is recommend that the VBR I be left permanently in the operable mode creating a minimum
power draw of <40watts at 110v AC with a maximum requirement of 940 watts when the
incubator heater is on which does not significantly affect the incubation temperature of 22±1oC.
15.4 Operational instructions for the VBR II, time lapse camera and %CBR software
To operate the VBR I then refer to the time lapse camera protocol using the HAB- or BOD- Bart
tester and the operation of the standard VBR I supplied software. For the %CBR protocol then
the follow the sequence of operations below assuming that the VBR I unit is powered up and
operating within the correct temperature range:
1. Obtain wastewater samples for testing and follow the standard methods for testing using
HAB- or BOD- testers to generate three (triplicate x 15mL) samples from each sample being
tested.
2. Check the time lapse camera is set up correctly for taking time lapse images of the VBR I
every fifteen minutes.
3. Confirm that the camera has at least a 4GB memory card in the required slot and that there
are no saved images on the card. IT IS ESSENTIAL TO ERASE ALL DATA AND
IMAGES FROM PREVIOUS WORK THAT MAY ON THE CARD. Note that these images
294
can be saved within a designated folder on the computer or on a memory stick before erasing
off the memory card.
4. Quickly place all of the charged triplicated HAB- or BOD- testers in the appropriate slots in
the VBR I. Remember is important to do this quickly since delays in setting up will
compromise precision. It is recommended that PI is placed in slots A1 –A3, and FE be placed
in slots B1 – B3. Slide each tester completely into the slot ensuring that the tester has been
gently pressed back as far as possible into the slot. Make sure that the camera is set to focus
at 13 to 17” to assure images are all in focus. Do not prepare testers using cold samples (at
<19oC) that have not been acclimated to room temperature since these lower temperatures
could significantly affect time lapse data and run the risk of predicting lower populations.
5. Once the testers (minimum six in slots A and B, maximum an additional twelve in slots C, D,
E, and F) then power up the camera and the move the switch from “set up” to “auto”. The
camera will now take the first image (.jpg) at zero time and then takes additional images
every fifteen minutes. Note that the camera has been pre-positioned to photograph all of the
slots in a precise and standard manner.
6. This testing can continue until all of the HAB- or BOD- testers have reacted (causing an UP
or DO reactions where positive detections occur). Once this has happened (commonly within
30 hours) then the camera can be shut down (by moving the switch from “auto” to “set up”
and then removing the 4GB memory card from the camera. Note that the VBR I system
%CBR software will only interpret images by the interpretation of the data to time lapse (in
hours), predicted populations (pac/mL) and thence to the calculation of the confirmatory
%CBR reduction as a predicted cell count fraction (as a percentile) in the FE as compared to
the PE.
7. Remove all of the testers after the completion of the run for disposal. Take the memory card
from the camera and insert it into a suitable slot on the computer into which the %CBR
software has been installed and move to interpretation protocol.
295
15.4.1 Camera Protocol
The camera is precision calibrated for the VBR I and the images do not have any “informational
border”. Calibration is applied to the setting of the first jpg image at zero time. Specifically the
interpretation involves two regions where the pixels are detected that are then used to detect
reactions in the HAB – or BOD- tester. These regions are placed 25 and 30mm up from the base
of the tester along the vertical mid-point seam. Once the calibration has been adjusted and
confirmed then it will remain constant in that particular VBR I system. Additionally calibration
is applied to the camera for the following features:
Focal length set to 13” to 17”
Time lapse set to every fifteen (15) minutes
Photo-quality is set to high at MAX 2560 x 1920
Daily Wakeup and Sleep both set at midnight
Camera will automatically shut down the LCD display after three minutes to conserve
energy
Time allocated initially is in Eastern Standard Time but that can be adjusted to match the
time zone where the VBR I is to be operated
Recommended time length for camera run (for the %CBR) if not terminated prematurely
is 30hours but if the camera is not shut down the images taken after the 120th
frame are
not used. Where these do occur (in the more effective WWTP) then the populations
generated are too low to significantly influence the %CBR being predicted.
Do not use the USB OUT port on the camera since this is not compatible with the %CBR
software. The TV OUT port can be used to examine the current picture (.jpg) on the screen. Note
that when the camera is in the “AUTO” a status/standby indicator will flash (red) every three
seconds to indicate the power is on to the camera and it is working.
The sequence for starting up a VBR I test run is as follows:
1. Insert the memory card into the camera making sure that all data and images have been
erased. Failure to do this would mean that the %CBR software would search and find
296
the earliest loaded image on the memory card and consider that to be that first image
for the interpretation and all subsequent images would be fifteen minutes apart.
2. In SET UP mode the camera is in idle with all of the calibrations retained on an internal
flash memory. Do not adjust these calibrations unless there is concern that the camera
setting may not be correct in which case go the section on confirmation of Camera
Settings.
3. When all of the testers have been placed in the VBR I then the testing should be started
immediately by moving the lower left dial on the camera from “SET UP” to “AUTO”.
Make sure that the camera is powered up which causes a red LED light to blink every
three seconds. The first picture will be taken in 5 seconds. Close and clip the cover
quickly and move back so that there is no shadow generated in the jpg image.
4. Camera will go into a passive mode until the next picture is taken. At that due time the
camera will “wake up” and after five seconds take the next frame using the camera’s
calibrated focussing and exposure control to assure even quality for the images.
5. Photographs as .jpg images will be taken every fifteen minutes until either all of the
testers are positive (i.e. moved from blue to a clouded clear or pale yellow) in which
case the camera can be moved to “SET UP” mode and the memory card removed for
interpretation; or the camera could also automatically be shut down (at 30 hours) still
retaining the data.
6. Once the operator has moved the camera to “SET UP” mode (either when all tests are
positive with the closure operator initiated, or after the 30 hours completion run if some
testers are still negative or blue then power down the camera and the memory card can
then be withdrawn from the camera slot and moved to the computer.
Camera Settings, it is recommended that the camera be run on the four AA batteries.
Manufacturers claim are that these will last for one month before being replaced. Turn the
Camera to “SET UP” using the rotary mode switch (lower left) and you can read the battery
status. Anything above 70% means there is enough reserve power in the battery for a full run.
The camera status would be displayed on the LCD screen (directly below lens). It is possible to
check on the settings by going to START UP button and the time lapse comes up for 15 minutes,
confirm by the right arrow button and next select PHOTO by pressing the right arrow button.
297
Next PHOTO Quality is displayed and the correct method uses the 3,264 x 2,448 (MAX)
resolution, press right arrow button to confirm. Next the MULTI-SHOTS is presented and that
should read “1-SHOT”. Press right button to select and then DAILY WAKE and confirm
midnight by pressing right arrow. Next come “DAILY SLEEP” and confirm the same time
(midnight) by pressing right hand arrow. This is followed by IMPRINT INFO to which the
correct response is YES which is then selected by pressing right hand arrow. This is followed by
IMPRINT INFO, DATE /TIME and CAMERA NAME. These should remain the same and so
continue to press right arrow button until set up complete. Editing should only be done in the
event the set-up is no longer appropriate. Refer to the appendixed camera guide for more
information. Note the cameras come pre-set for the VBR I and it is not recommended that these
be modified.
15.5 Calculation of the %CBR from the project populations.
Measurement of the %CBR therefore involves primarily the factorial comparison of the PI
population with the FE population (as predicted active cells per mL generated from the relevant
time lapses observed). It should be noted that these reductions can also be calculated for other
sample in the treatment stream. Present practices indicate that an effective reduction in the
bacteriological activity in the FE to achieve a suitable reduction in biochemical oxygen demands
is needed to allow discharge (e.g. <25mg/L or ppm) would involve a minimum factorial
reduction of 0.997 (or %CBR of 99.7%). This would use the equation:
%CBR = ((1 - (predicted active population, FE) / (predicted active population, PI)) x 100)
Note that percentile reductions (%CBR) could be monitored throughout the WWTP process to
determine how effectively the different stages in the treatment process are operating. For these
percentile reductions for the %CBR then the equation above could be used with the FE would be
replaced by the predicted active populations for that stage in the process (e.g. primary effluent,
PE; secondary effluent, SE; lagoon one, L1; and clarifier one, C1.).
From the aerated lagoon experience at the aerated municipal sanitary WWTP it has been found
that the PE can have %CBR values ranging from +40% down to -20%. Positive %CBR indicates
that there has been an increase in the active HAB- or BOD- populations during the primary
298
treatment occurring from the PI to the PE. In the trials at the aerated WWTP the majority of
cases there was reductions in the active populations to give %CBR values of 10% to 99%
depending on the stage in the treatment. In a minority of cases there are surges in bacteriological
activity which leads the %CBR factorial responses commonly of up to +40%. For the lagoon
systems at the trial WWTP there were generally marginal CBR declines in the range 40 to 60%
depending upon the lagoon management practices at that time. SE shows a further %CBR
decline commonly in the range of -80 to -95% reductions in the active bacterial populations.
Clarifiers when applied as a part of the tertiary treatment (e.g. C1) often showed very high
%CBR (0.99 to 99.99% but with this range reflecting the tendency for erratic mixing of the
treated effluent with other streams. In the FE it has been found with both the aerated and rapid
mixed liquor WWTPs that the final %CBR is commonly well below 99.7% indicating that there
had been minimally almost a three order of magnitude decline in the populations and the
corresponding biochemical oxygen demand is less than 15mg/L.
15.6 Decision Tree
This decision tree is based upon the interpretation of triplicated test data results in the order of
the E-tATP determination (see Chapter 14) and then %CBR as the percentile confirmatory
bacterial population reductions from the original PI collected at the time of sampling. Testing
involves the simultaneous start of the E-tATP determination (minimally of the PI and FE) and
%CBR. Respectively, these tests run with intervals of for fifteen minutes between photographs
for a maximum of thirty hours. Wastewaters are notorious for generating outlier data since the
collected samples are not microbiologically homogenous and often include complex biocolloidal
structures which can easily influence results from those particular impacted samples. During the
development of researches on the BOD system (over 28,000 sample sets) since 1996 it has been
found that on average one in eighteen (5.5%) of the samples generate results that reflect the
heterogeneity of those particular outlier samples. The decision tree takes this into account where
possible. The decision tree is as follows:
1. Does the %CBR generate a percentile bacteriological reduction value of 99.7% or
higher?
If the answer is YES then this confirms that the sample would be an FE –equivalent
and suitable for discharge then go to 5.
If the answer is NO then go to 2.
299
2. Has the %CBR given reduction data in the range of 98.0 to 99.6%?
If YES then the sample should be considered still as a sample incompletely treated
(e.g. SE) and then this would require limited further treatment before the FE is to be
suitable for discharge. Go back to 1 once the further treatment has been performed
and check the %CBR afresh.
If NO then the sample still has a very significant biochemical oxygen demand loading
and should be subjected to further secondary or tertiary treatments as may be
considered necessary before going back to 1.
Because of the risk from outliers influencing the outcome of the testing for %CBR it is
recommended that triplicated testing be routinely performed to minimise the impact of those
outliers and improve precision.
15.7 Statistical Comparison of generated %CBR values and BOD5
In classic determinations of bacterial populations the methodologies have employed some type of
agar based technology or rationalised dilution sequence to determine colony presence or activity.
The confirmation of BOD reduction by %CBR employs a new concept that involves no dilution,
the use of suitable selective culture media, and the determination of the active population
through that signal (reaction activity event displayed as an UP or DO reaction) event occurring
as the time lapse to that cultural event. The critical signal is the time length (lapse) to the shifting
from oxidative to reductive conditions in the HAB- or BOD- tester from the beginning of the test
evidenced by the change in the colour in the tester from blue to clear or pale yellow. This time
lapse is commonly measured in fractions of an hour with images being generated every fifteen
minutes. Time lapse comparisons are made between the PI (as the input primary influent) and the
FE (as the final effluents after all treatments have been completed. For the %CBR system the
time lapse sets the population size predicted at 22±1oC using the VBR I tester system coupled to
the %CBR software. Reactions are observed using floor lighting employing daylight LED
illumination. These reactions are recognised by a shifting of the methylene blue from the
oxidised blue form to the clear reduced form. If the reaction begins near or at the bottom it is
called an UP reaction and conversely if the clearing reaction begins closer to the ball then that is
a DO reaction. Time lapse images are taken every fifteen minute interval in the time lapse
300
camera until thirty hours and the CBR software upon request automatically determines the time
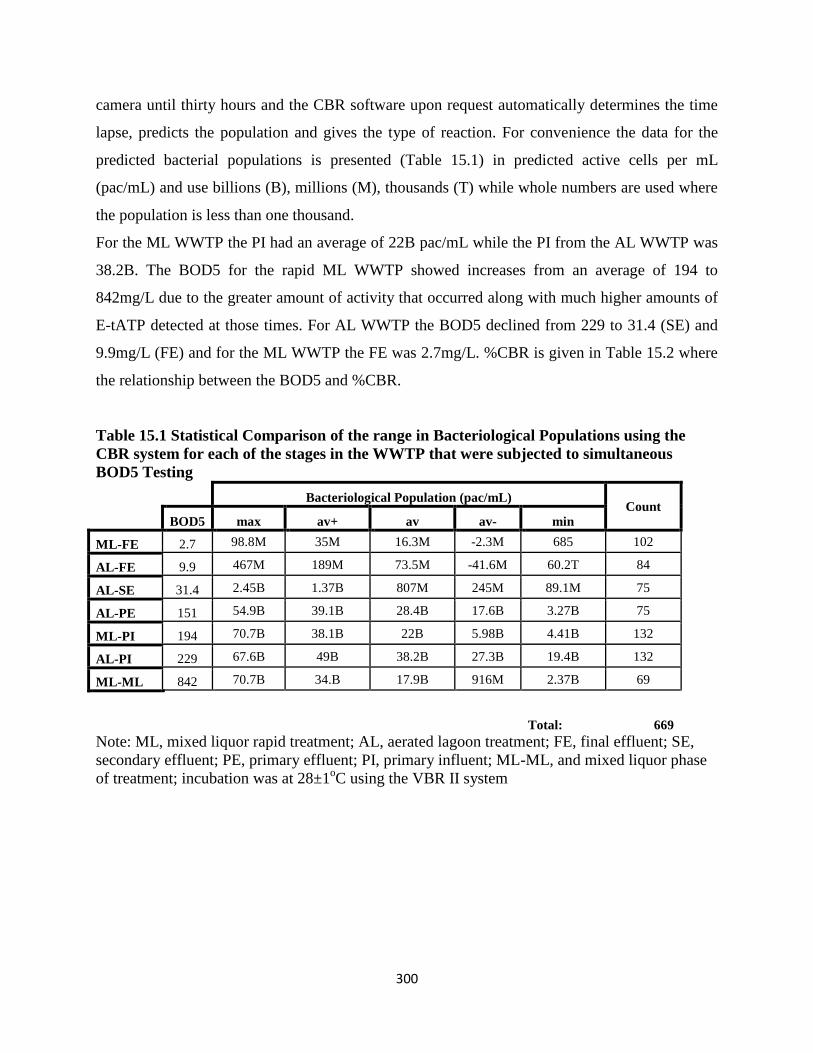
lapse, predicts the population and gives the type of reaction. For convenience the data for the
predicted bacterial populations is presented (Table 15.1) in predicted active cells per mL
(pac/mL) and use billions (B), millions (M), thousands (T) while whole numbers are used where
the population is less than one thousand.
For the ML WWTP the PI had an average of 22B pac/mL while the PI from the AL WWTP was
38.2B. The BOD5 for the rapid ML WWTP showed increases from an average of 194 to
842mg/L due to the greater amount of activity that occurred along with much higher amounts of
E-tATP detected at those times. For AL WWTP the BOD5 declined from 229 to 31.4 (SE) and
9.9mg/L (FE) and for the ML WWTP the FE was 2.7mg/L. %CBR is given in Table 15.2 where
the relationship between the BOD5 and %CBR.
Table 15.1 Statistical Comparison of the range in Bacteriological Populations using the
CBR system for each of the stages in the WWTP that were subjected to simultaneous
BOD5 Testing
Bacteriological Population (pac/mL) Count
BOD5 max av+ av av- min
ML-FE 2.7 98.8M 35M 16.3M -2.3M 685 102
AL-FE 9.9 467M 189M 73.5M -41.6M 60.2T 84
AL-SE 31.4 2.45B 1.37B 807M 245M 89.1M 75
AL-PE 151 54.9B 39.1B 28.4B 17.6B 3.27B 75
ML-PI 194 70.7B 38.1B 22B 5.98B 4.41B 132
AL-PI 229 67.6B 49B 38.2B 27.3B 19.4B 132
ML-ML 842 70.7B 34.B 17.9B 916M 2.37B 69
Total: 669
Note: ML, mixed liquor rapid treatment; AL, aerated lagoon treatment; FE, final effluent; SE,
secondary effluent; PE, primary effluent; PI, primary influent; ML-ML, and mixed liquor phase
of treatment; incubation was at 28±1oC using the VBR II system
301
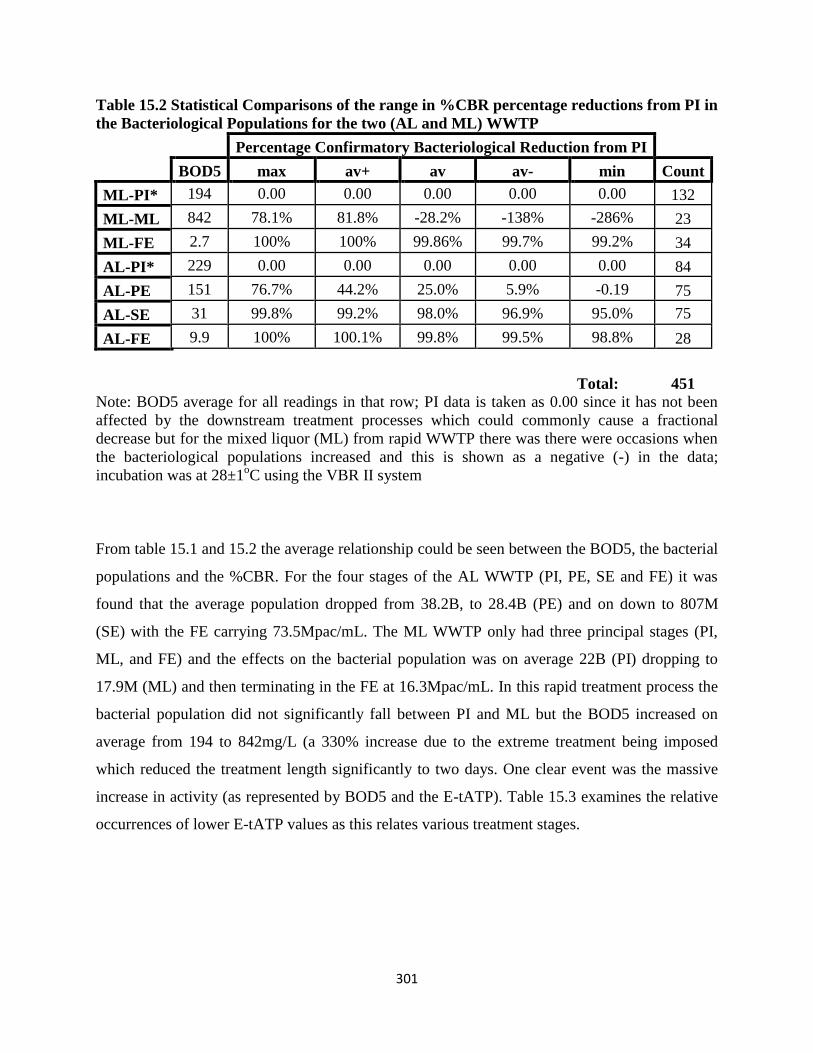
Table 15.2 Statistical Comparisons of the range in %CBR percentage reductions from PI in
the Bacteriological Populations for the two (AL and ML) WWTP
Percentage Confirmatory Bacteriological Reduction from PI
BOD5 max av+ av av- min Count
ML-PI* 194 0.00 0.00 0.00 0.00 0.00 132
ML-ML 842 78.1% 81.8% -28.2% -138% -286% 23
ML-FE 2.7 100% 100% 99.86% 99.7% 99.2% 34
AL-PI* 229 0.00 0.00 0.00 0.00 0.00 84
AL-PE 151 76.7% 44.2% 25.0% 5.9% -0.19 75
AL-SE 31 99.8% 99.2% 98.0% 96.9% 95.0% 75
AL-FE 9.9 100% 100.1% 99.8% 99.5% 98.8% 28
Total: 451
Note: BOD5 average for all readings in that row; PI data is taken as 0.00 since it has not been
affected by the downstream treatment processes which could commonly cause a fractional
decrease but for the mixed liquor (ML) from rapid WWTP there was there were occasions when
the bacteriological populations increased and this is shown as a negative (-) in the data;
incubation was at 28±1oC using the VBR II system
From table 15.1 and 15.2 the average relationship could be seen between the BOD5, the bacterial
populations and the %CBR. For the four stages of the AL WWTP (PI, PE, SE and FE) it was
found that the average population dropped from 38.2B, to 28.4B (PE) and on down to 807M
(SE) with the FE carrying 73.5Mpac/mL. The ML WWTP only had three principal stages (PI,
ML, and FE) and the effects on the bacterial population was on average 22B (PI) dropping to
17.9M (ML) and then terminating in the FE at 16.3Mpac/mL. In this rapid treatment process the
bacterial population did not significantly fall between PI and ML but the BOD5 increased on
average from 194 to 842mg/L (a 330% increase due to the extreme treatment being imposed
which reduced the treatment length significantly to two days. One clear event was the massive
increase in activity (as represented by BOD5 and the E-tATP). Table 15.3 examines the relative
occurrences of lower E-tATP values as this relates various treatment stages.
302
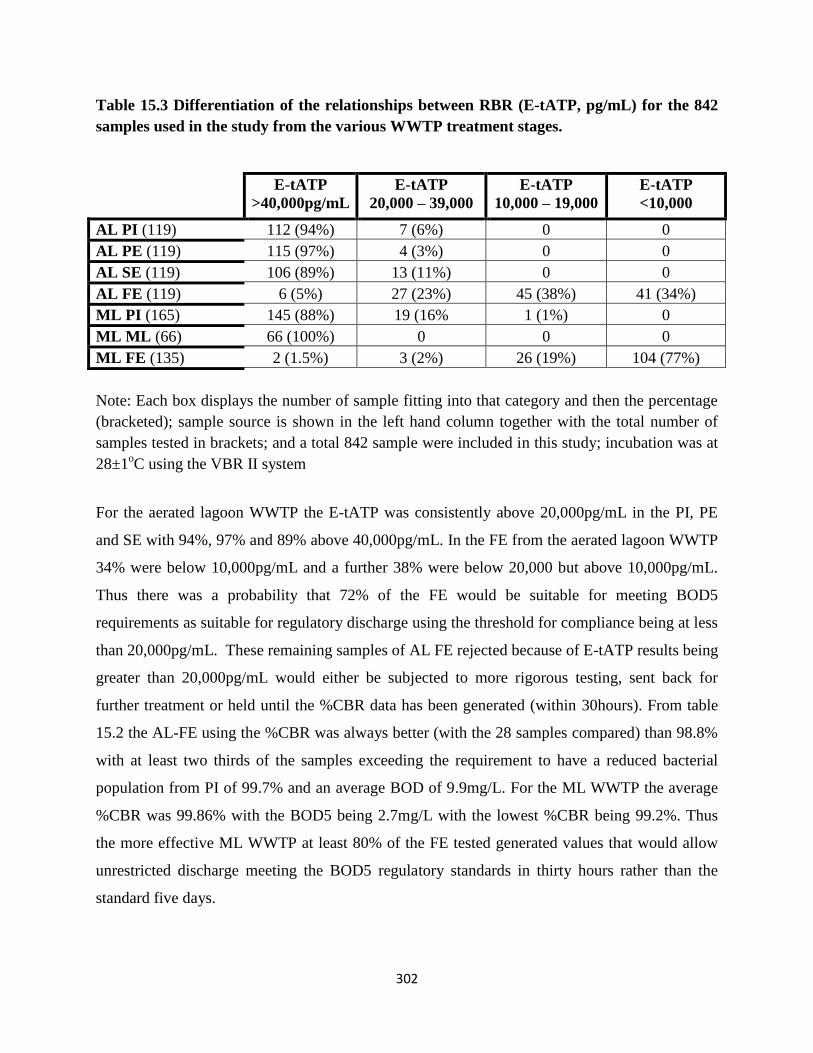
Table 15.3 Differentiation of the relationships between RBR (E-tATP, pg/mL) for the 842
samples used in the study from the various WWTP treatment stages.
E-tATP
>40,000pg/mL
E-tATP
20,000 – 39,000
E-tATP
10,000 – 19,000
E-tATP
<10,000
AL PI (119) 112 (94%) 7 (6%) 0 0
AL PE (119) 115 (97%) 4 (3%) 0 0
AL SE (119) 106 (89%) 13 (11%) 0 0
AL FE (119) 6 (5%) 27 (23%) 45 (38%) 41 (34%)
ML PI (165) 145 (88%) 19 (16% 1 (1%) 0
ML ML (66) 66 (100%) 0 0 0
ML FE (135) 2 (1.5%) 3 (2%) 26 (19%) 104 (77%)
Note: Each box displays the number of sample fitting into that category and then the percentage
(bracketed); sample source is shown in the left hand column together with the total number of
samples tested in brackets; and a total 842 sample were included in this study; incubation was at
28±1oC using the VBR II system
For the aerated lagoon WWTP the E-tATP was consistently above 20,000pg/mL in the PI, PE
and SE with 94%, 97% and 89% above 40,000pg/mL. In the FE from the aerated lagoon WWTP
34% were below 10,000pg/mL and a further 38% were below 20,000 but above 10,000pg/mL.
Thus there was a probability that 72% of the FE would be suitable for meeting BOD5
requirements as suitable for regulatory discharge using the threshold for compliance being at less
than 20,000pg/mL. These remaining samples of AL FE rejected because of E-tATP results being
greater than 20,000pg/mL would either be subjected to more rigorous testing, sent back for
further treatment or held until the %CBR data has been generated (within 30hours). From table
15.2 the AL-FE using the %CBR was always better (with the 28 samples compared) than 98.8%
with at least two thirds of the samples exceeding the requirement to have a reduced bacterial
population from PI of 99.7% and an average BOD of 9.9mg/L. For the ML WWTP the average
%CBR was 99.86% with the BOD5 being 2.7mg/L with the lowest %CBR being 99.2%. Thus
the more effective ML WWTP at least 80% of the FE tested generated values that would allow
unrestricted discharge meeting the BOD5 regulatory standards in thirty hours rather than the
standard five days.
303
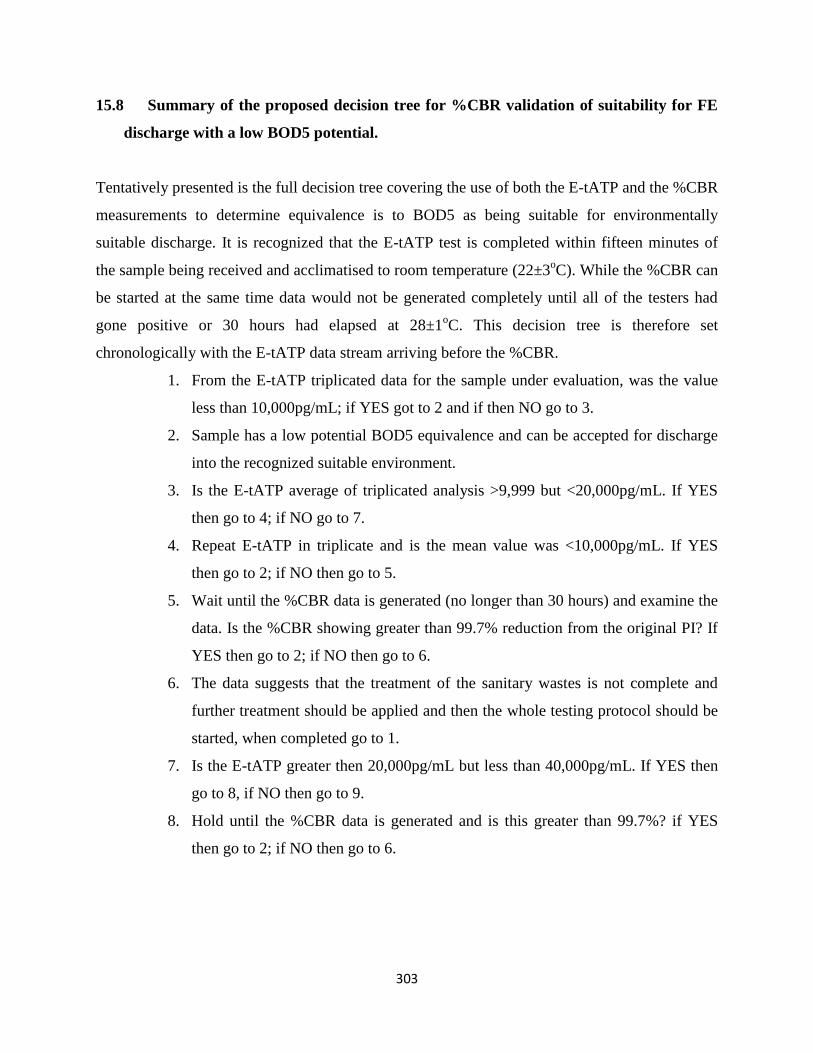
15.8 Summary of the proposed decision tree for %CBR validation of suitability for FE
discharge with a low BOD5 potential.
Tentatively presented is the full decision tree covering the use of both the E-tATP and the %CBR
measurements to determine equivalence is to BOD5 as being suitable for environmentally
suitable discharge. It is recognized that the E-tATP test is completed within fifteen minutes of
the sample being received and acclimatised to room temperature (22±3oC). While the %CBR can
be started at the same time data would not be generated completely until all of the testers had
gone positive or 30 hours had elapsed at 28±1oC. This decision tree is therefore set
chronologically with the E-tATP data stream arriving before the %CBR.
1. From the E-tATP triplicated data for the sample under evaluation, was the value
less than 10,000pg/mL; if YES got to 2 and if then NO go to 3.
2. Sample has a low potential BOD5 equivalence and can be accepted for discharge
into the recognized suitable environment.
3. Is the E-tATP average of triplicated analysis >9,999 but <20,000pg/mL. If YES
then go to 4; if NO go to 7.
4. Repeat E-tATP in triplicate and is the mean value was <10,000pg/mL. If YES
then go to 2; if NO then go to 5.
5. Wait until the %CBR data is generated (no longer than 30 hours) and examine the
data. Is the %CBR showing greater than 99.7% reduction from the original PI? If
YES then go to 2; if NO then go to 6.
6. The data suggests that the treatment of the sanitary wastes is not complete and
further treatment should be applied and then the whole testing protocol should be
started, when completed go to 1.
7. Is the E-tATP greater then 20,000pg/mL but less than 40,000pg/mL. If YES then
go to 8, if NO then go to 9.
8. Hold until the %CBR data is generated and is this greater than 99.7%? if YES
then go to 2; if NO then go to 6.
304
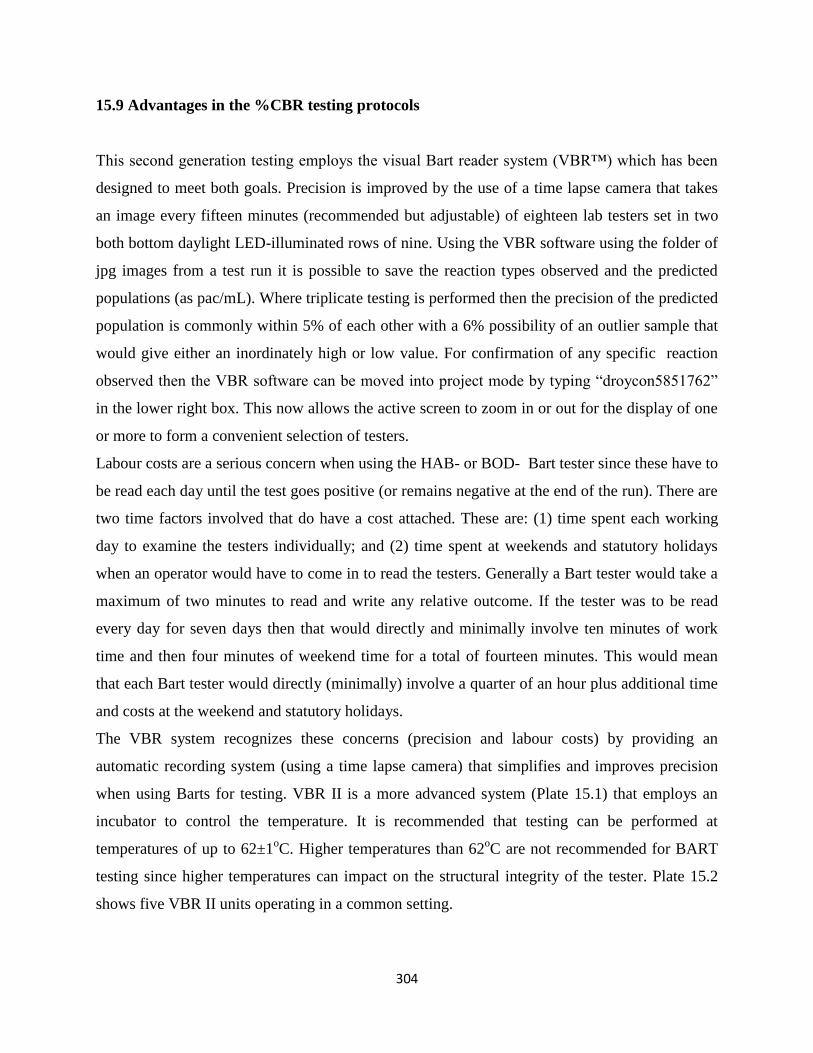
15.9 Advantages in the %CBR testing protocols
This second generation testing employs the visual Bart reader system (VBR™) which has been
designed to meet both goals. Precision is improved by the use of a time lapse camera that takes
an image every fifteen minutes (recommended but adjustable) of eighteen lab testers set in two
both bottom daylight LED-illuminated rows of nine. Using the VBR software using the folder of
jpg images from a test run it is possible to save the reaction types observed and the predicted
populations (as pac/mL). Where triplicate testing is performed then the precision of the predicted
population is commonly within 5% of each other with a 6% possibility of an outlier sample that
would give either an inordinately high or low value. For confirmation of any specific reaction
observed then the VBR software can be moved into project mode by typing “droycon5851762”
in the lower right box. This now allows the active screen to zoom in or out for the display of one
or more to form a convenient selection of testers.
Labour costs are a serious concern when using the HAB- or BOD- Bart tester since these have to
be read each day until the test goes positive (or remains negative at the end of the run). There are
two time factors involved that do have a cost attached. These are: (1) time spent each working
day to examine the testers individually; and (2) time spent at weekends and statutory holidays
when an operator would have to come in to read the testers. Generally a Bart tester would take a
maximum of two minutes to read and write any relative outcome. If the tester was to be read
every day for seven days then that would directly and minimally involve ten minutes of work
time and then four minutes of weekend time for a total of fourteen minutes. This would mean
that each Bart tester would directly (minimally) involve a quarter of an hour plus additional time
and costs at the weekend and statutory holidays.
The VBR system recognizes these concerns (precision and labour costs) by providing an
automatic recording system (using a time lapse camera) that simplifies and improves precision
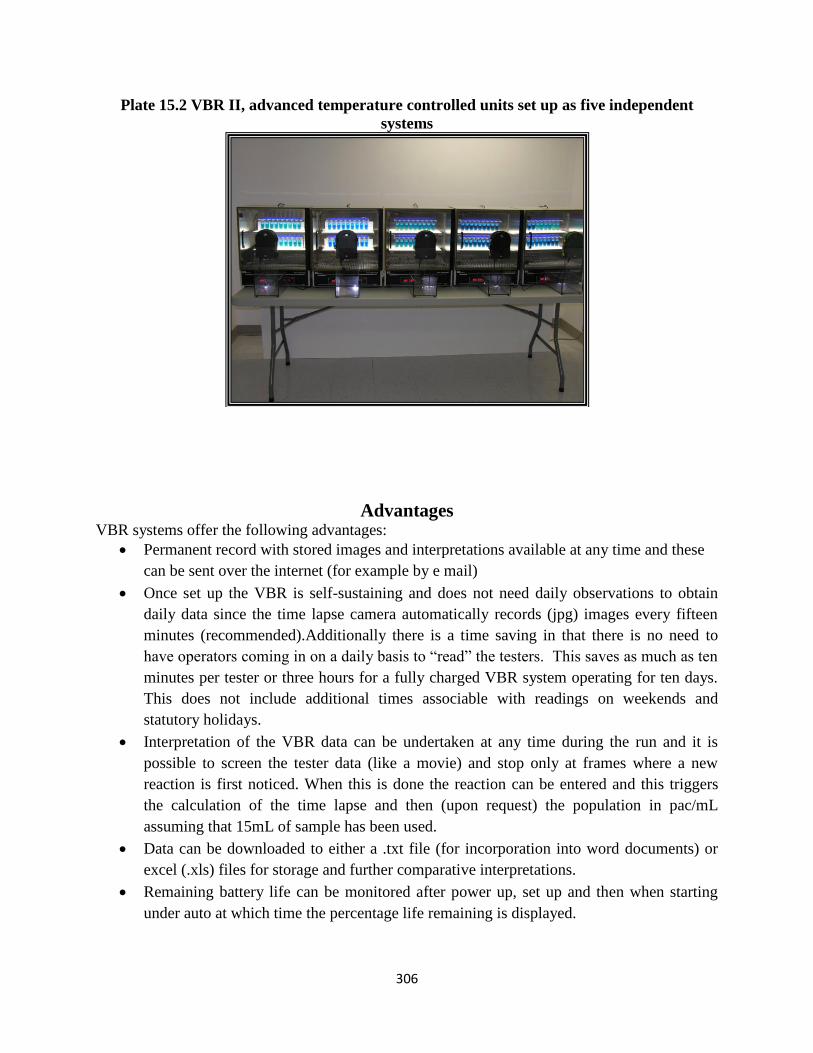
when using Barts for testing. VBR II is a more advanced system (Plate 15.1) that employs an
incubator to control the temperature. It is recommended that testing can be performed at
temperatures of up to 62±1oC. Higher temperatures than 62
oC are not recommended for BART
testing since higher temperatures can impact on the structural integrity of the tester. Plate 15.2
shows five VBR II units operating in a common setting.
305
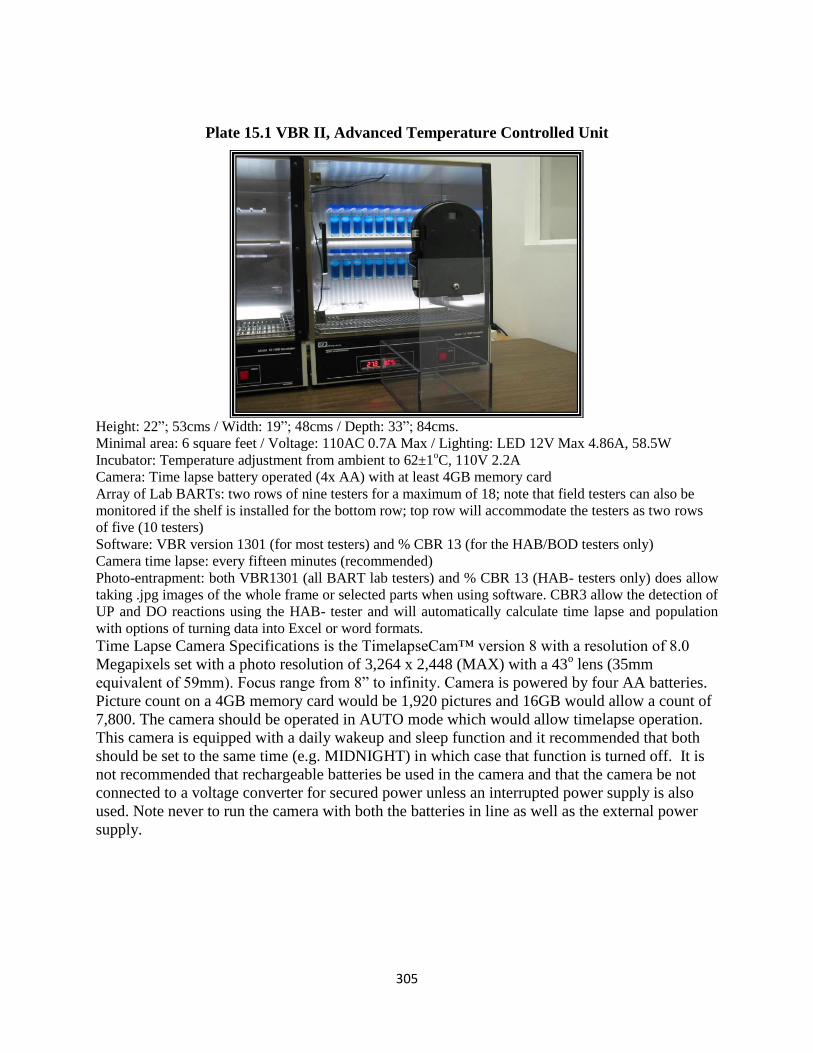
Plate 15.1 VBR II, Advanced Temperature Controlled Unit
Height: 22”; 53cms / Width: 19”; 48cms / Depth: 33”; 84cms.
Minimal area: 6 square feet / Voltage: 110AC 0.7A Max / Lighting: LED 12V Max 4.86A, 58.5W
Incubator: Temperature adjustment from ambient to 62±1oC, 110V 2.2A
Camera: Time lapse battery operated (4x AA) with at least 4GB memory card
Array of Lab BARTs: two rows of nine testers for a maximum of 18; note that field testers can also be
monitored if the shelf is installed for the bottom row; top row will accommodate the testers as two rows
of five (10 testers)
Software: VBR version 1301 (for most testers) and % CBR 13 (for the HAB/BOD testers only)
Camera time lapse: every fifteen minutes (recommended)
Photo-entrapment: both VBR1301 (all BART lab testers) and % CBR 13 (HAB- testers only) does allow
taking .jpg images of the whole frame or selected parts when using software. CBR3 allow the detection of
UP and DO reactions using the HAB- tester and will automatically calculate time lapse and population
with options of turning data into Excel or word formats.
Time Lapse Camera Specifications is the TimelapseCam™ version 8 with a resolution of 8.0
Megapixels set with a photo resolution of 3,264 x 2,448 (MAX) with a 43o lens (35mm
equivalent of 59mm). Focus range from 8” to infinity. Camera is powered by four AA batteries.
Picture count on a 4GB memory card would be 1,920 pictures and 16GB would allow a count of
7,800. The camera should be operated in AUTO mode which would allow timelapse operation.
This camera is equipped with a daily wakeup and sleep function and it recommended that both
should be set to the same time (e.g. MIDNIGHT) in which case that function is turned off. It is
not recommended that rechargeable batteries be used in the camera and that the camera be not
connected to a voltage converter for secured power unless an interrupted power supply is also
used. Note never to run the camera with both the batteries in line as well as the external power
supply.
306
Plate 15.2 VBR II, advanced temperature controlled units set up as five independent
systems
Advantages VBR systems offer the following advantages:
Permanent record with stored images and interpretations available at any time and these
can be sent over the internet (for example by e mail)
Once set up the VBR is self-sustaining and does not need daily observations to obtain
daily data since the time lapse camera automatically records (jpg) images every fifteen
minutes (recommended).Additionally there is a time saving in that there is no need to
have operators coming in on a daily basis to “read” the testers. This saves as much as ten
minutes per tester or three hours for a fully charged VBR system operating for ten days.
This does not include additional times associable with readings on weekends and
statutory holidays.
Interpretation of the VBR data can be undertaken at any time during the run and it is
possible to screen the tester data (like a movie) and stop only at frames where a new
reaction is first noticed. When this is done the reaction can be entered and this triggers
the calculation of the time lapse and then (upon request) the population in pac/mL
assuming that 15mL of sample has been used.
Data can be downloaded to either a .txt file (for incorporation into word documents) or
excel (.xls) files for storage and further comparative interpretations.
Remaining battery life can be monitored after power up, set up and then when starting
under auto at which time the percentage life remaining is displayed.
307
Limitation
VBR systems I and II are specifically designed to allow the simultaneous testing of up to
eighteen lab testers at any time. Field testers can be used in either the VBR I or II systems to a
maximum of ten (2 rows of 5) using the table supplied for the bottom row
Warranty
This is one year on the VBR unit itself but the camera (both VBR I and II) and incubator (VBR
II only) are covered by the manufacturer’s warranties for those components.
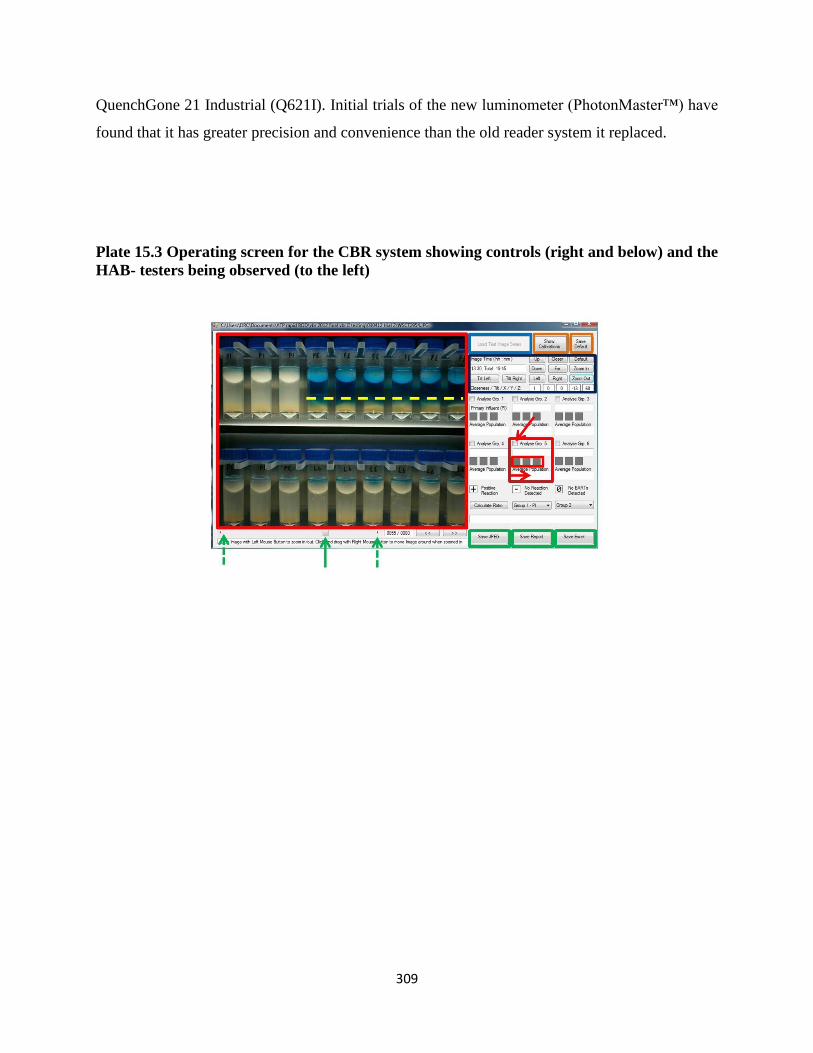
15.10 %CBR program management
%CBR program (percentage confirmatory bacterial reduction) function with both the VBR I and
II systems to allow the interpretation of the jpg image saved in the time lapse sequence on the
memory card in the camera during the data collection phase. Plate 15.3 (below) shows the
display of (up to) eighteen testers racked within the incubator. To bring in the correct folder it is
necessary to load the test image series (blue box). Clicking on this box opens up the computers
directories to find the correct folder, open that folder and click on the first .jpg image in that
folder. %CBR assumes that this .jpg image will be the first in the series that will then be
displayed to the left showing the initial testers before any incubation (time zero). On, or close to,
each tester are two vertical red circles. To allow calibration (red circles shown in each tester
when requested for calibration and confirmation) it is necessary to confirm that the red circles
are correctly positioned in the testers. If the red circles are not visible then click on the top left
hand (shown as orange) square for the red circles to be displayed ready for calibration. When
calibrated all of the red circles should be aligned in both rows to the centre of each tester. The
upper red circle should be positioned just below the midpoint of the liquid column in the tester.
Using the various buttons within the calibration (upper dark blue rectangle) the buttons can be
used to attain the correct position using the up, down, zoom, left and right functions. When the
circles are correctly aligned for all eighteen testers then clicking on save default (right hand
orange square) will save the calibration code (shown lower part of the dark blue box) as the
default. Once this has been set then that is the calibration for that that particular VBR system.
Calibration can however be changed if required. To scroll through the images then use the curser
(lower left) and move it (green vertical arrow) between the start to the left (broken green arrow
308
left) and right (broken green arrow right). Moving this curser creates a “movie” – like effect and
as the .jpg images change so does the time lapse (now displayed in the on the upper left side of
the dark blue square). It is now possible to determine the time at which each tester actually goes
positive. In plate 15.3 the yellow dashed line passes laterally through the upper six testers to the
right shows that these are all going positive with UP reactions. It is recommended for
convenience that the primary influent (PI) be performed in triplicate in the upper three left hand
slots and the final effluent (FE) triplicated testers are on the center three slots in the upper row.
Analysis is done in clusters of three (triplicated). For example the lower mid red square shows
the button (red arrow) that allows the analysis of that triplicate set of testers. To conduct the
analysis click on the upper box and that will initiate a scan of all the testers until all three have
been detected as positive. As the curser (green vertical arrow) moves across then positive UP and
DO reactions are recognised and the predicted population is determined. When this has happened
then that box will display a plus sign. If no reaction is detected then a negative reaction (-, not
detected) is displayed. If the scan shows no tester to be in that slot then a diagonally crossed “0”
is displayed. Once that scan is completed then the average population is projected (horizontal red
arrow). When all of the testers have turned positive or at 30 hours the final data can be saved as
word compatible text file (middle green broken arrow) or spreadsheet file in excel (right hand
green broken arrow). An additional useful feature for the CBR software is the ability to save a
.jpg image of any part of the testers’ images clicking on the image and then moving the curser
until it displays that image you would like to save. Clicking on the left hand curser (left hand
green broken arrow) allows you to save the image as it is displayed in the left hand red square.
Data from the testing can be saved in three modes: (txt, xls, and jpg). All of the data is saved
automatically when the program is closed (upper right white x on red). If there is any concern
about a particular or groups of reactions then the relevant .txt, .xls or .jpg files can be sent via the
internet for appraisal. %CBR (percentage confirmatory bacterial reduction) can also be
calculated once the evaluation period is over (i.e. all testers are positive, or 30 hours has passed).
Questions, concerns and independent assessments can be e mailed to [email protected], by phone to
306 585 1762, or by fax to 306 585 3000 attention support at rapidbod.
Note that in 2013 Luminultra Technologies Ltd introduced some improvements to the ATP
system making it more efficient with changes to both the process and the method of reading that
data. The total ATP discussed in the book is the old methodology and the replacement is the
309
QuenchGone 21 Industrial (Q621I). Initial trials of the new luminometer (PhotonMaster™) have
found that it has greater precision and convenience than the old reader system it replaced.
Plate 15.3 Operating screen for the CBR system showing controls (right and below) and the
HAB- testers being observed (to the left)

310