Chapter 15
23
M t. H ua (H uashan)islocated nearthe southeastcornerof the O rdosLoop section ofthe Y ellow Riverbasin, south of the W eiRivervalley, atthe eastern end ofthe Qinling M ountains, in southern Shaanxiprovince. M t. H ua is usually referred to one ofthe birthplacesofthe ancestorsof the H ua-X ia (H an)Chinese now living in H ong K ong, M acau, Taiw an, and m ainland China. Mt. Hua, Shaanxi Source: http://en.wikipedia.org/wiki/Mount_ Hua Chapter 15
-
Upload
britanni-kinney -
Category
Documents
-
view
26 -
download
0
description
Chapter 15. Mt. Hua, Shaanxi Source : http://en.wikipedia.org/wiki/Mount_Hua. 15. Understanding the Chinese-Speaking Economies. 15.1 The greater China area 15.2 A multiregional economic comparison 15.3 Cross-Strait economic relations 15.4 Overseas Chinese economics. Keywords :. - PowerPoint PPT Presentation
Transcript of Chapter 15

Mt. Hua (Huashan) is located near the southeast corner of
the Ordos Loop section of the Yellow River basin, south of
the Wei River valley, at the eastern end of the Qinling
Mountains, in southern Shaanxi province. Mt. Hua is
usually referred to one of the birthplaces of the ancestors of
the Hua-Xia (Han) Chinese now living in Hong Kong,
Macau, Taiwan, and mainland China.
Mt. Hua, ShaanxiSource: http://en.wikipedia.org/wiki/Mount_Hua
Chapter 15

15. Understanding the Chinese-Speaking Economies
15.1 The greater China area
15.2 A multiregional economic comparison
15.3 Cross-Strait economic relations
15.4 Overseas Chinese economics

Keywords:
• greater China,
• spatial (dis)economies,
• complementary condition,
• Hong Kong,
• Macau,
• Taiwan,
• cross-Strait relations,
• peaceful reunification,
• overseas Chinese

15.1 The greater China area
15.1.1 Hong Kong
15.1.2 Macau
15.1.3 Taiwan
15.1.4 Summary

Figure 15.1 Hong Kong and Macau

Figure 15.2 The Taiwan Strait

15.2 A multiregional economic comparison
15.2.1 Social and economic differences
15.2.2 Complementary conditions
15.2.3 Summary

Indicator Taiwan Hong Kong Macau Mainland
Area (sq. km) 36188 1098 19 9600000
Population (million persons) 22.5 6.8 0.4 1284.5
GDP (2003, billion US$) 286.8 158.6 7.9 1416
GDP per capita (2003, US$) 12751 23311 17782 1090
Average growth rate of GDP per capita (1978–2002, %)
5.50 3.98 2.03a 8.04
Exports (2003, billion US$) 144.2 224.6(15.7b) 2.6 438.4Life expectancy (1990s, Female/male, years)
77/71.8 81.2/75.8 71/68
Adult literacy rate (1990s, Female/male, %)c 86/96 88/96 95.7d 73/90
(a): Growth rate for 1982–2002.(b): Exports of Hong Kong goods (re-exports are excluded).(c): ADB (1996, pp. 11 and 28), SSB (1996, pp. 769, 781 and 803);(d): Xie (1992, p. 115) for labor population.Source: websites of the respective governments except those that are noted otherwise.
Table 15.1 Basic indicators of the greater China area

Economy Advantages Disadvantages
Mainland China
Adequate and various agricultural products, energy, industrial materials, excess labor, some high-tech products, and huge domestic market.
Relatively shortage of advanced equipments; shortage of international management experience and economic infrastructures, especially in the western, inland provinces.
Taiwan High capital saving, advanced equipment ready to move out, vanguard agricultural and industrial products, and management experience.
Shortage of energy and industrial resources, limited domestic market, and insufficiency of and high costs of labor supply.
Hong Kong and Macau
Capital surplus, favorable convenient conditions for international trade, the freest economic environment, and management experience in commercial and financial markets.
Severe shortage of agricultural and industrial resources, especially fresh water, foodstuff, energy, and land and deficiency of labor; limited domestic market.
Table 15.2 Mutually complementary conditions in the greater China area

15.3 Cross-Strait economic relations
15.3.1 Historical evolution
15.3.2 Bilateral economic cooperation
15.3.3 Direct air and shipping services
15.3.4 Future perspective

Item TaiwanMainland
China
Defense expense (US$ 100 million) 104 562
Forces (1000 persons) 442 3,031
Defense expense as % of GNP 4.7 2.7
Defense expense as % of budget 20.0 16.2
Per capita defense (US$) 494 48
Forces per 1000 population 21.0 2.6
Sources: The US Academy of Defense Agency (1993) and SSB (1996, pp. 230 and 580).
Table 15.3 Military expenses, Taiwan and mainland China

Figure 15.3 Links for air and shipping services between Taiwan and mainland China

15.4 Overseas Chinese economics
15.4.1 A history of Chinese emigration
15.4.2 Distribution of overseas Chinese
15.4.3 Global economic contributions

Explaining the remarkable growth of the overseas Chinese economy:
• (1) the thriftiness and hard-working nature of the overseas Chinese;
• (2) an elite group of intellectuals;• (3) a positive role of overseas Chinese
organizations; and• (4) closer socioeconomic ties with mainland
China.

Case study 9
Location, size and political economy of Chinese dynastic cycles

Unified Shilla (AD 668-933)
Koryo (AD 915-1391)
Chosen (AD 1392-1910)
Tang
(AD 618-907)
Song
(AD 960-1279)
Ming
(AD 1368-1644)
Qing
(AD 1644-1911) Yua
n (A
D 1
279-
1368
)
Figure 15.4 A comparison of the Chinese and Korean dynasties

0
100
200
300
400
500
600
700
0 1 2 3 4 5 6 7 8 9 10 11 12 13 14 15 16 17 18
Land area (million sq. km)
Lif
e sp
an (
year
s)
Zhou
Shang
Xia
Song
Han
Ming Tang
Jin
Qing
Yuan
(a) Chinese dynasties: lifespan versus territorial sizeSource: Tables 15.4 and 15.5 and the author’s calculation.

0
100
200
300
400
500
600
700
0 1000 2000 3000 4000 5000
Distance between capital and farthest frontier (km)
Lif
e sp
an (
year
)
Zhou
Shang
Song
Xia
Han
Ming
Tang
Yuan
Qing
Jin
(b) Chinese dynasties: lifespan versus distanceFigure 15.5 Location, territorial size and Chinese dynastiesSource: Tables 15.4 and 15.5 and the author’s calculation.

IndicatorZhou
(1046--221BC)
Han(206BC--AD220)
Jin(265--420)
Tang(619--907)
Song(960--1279)
Ming(1368--1644)
Qing(1644--1911)
Capital city
Hao (Xi’an)a;
Luoyi (Luoyang)b
Chang’an (Xi’an)c; Luoyangd
Luoyange; Jiankang
(Nanjing)f
Chang’an (Xi’an)
Kaifengg;Lin’an
(Hangzhou)h
Nanjingi;Beijingj Beijing
Distance between capital and farthest frontier (km)k
1200a; 950b 3200c; 3300d
3500e; 2000f 3500 2000g; 1700h 2000i;
2600j 3900
Area of territory (million km2)l 3.4 8.9 9.2e; 2.3f 12.5--8.0 4.6g; 4.0h 7.1 13.1
Length of existence (years)
825 (571)m 426 155 289 319 276 267
Major force(s) for collapse
Endogenous EndogenousExogenous
& Endogenous
Endo-genous
Exogenous
Endo-genous &
Exo-genous
Endo-genous
Notes: (a): from 1046 to 771 BC. (b): from 771 to 221 BC. (c): from 206 BC to AD 25. (d): from AD 25 to 220. (e): from 265 to 316. (f): from 317 to 420. (g): from AD 960 to 1127. (h): from AD 1127 to 1279. (i): from AD 1368 to 1420. (j): from AD 1421 to 1644. (k): estimated by the author based on the maps of ancient China. (l): available at http://bbs.zanba.com/message/122377/122377304.html. (m): figure within parenthesis does not include the “Warring States” period (from 475 to 221 BC).Source: Calculated by the author except those that are specifically cited.
Table 15.4 A comparison of selected Chinese dynasties in terms of location, size and other parameters
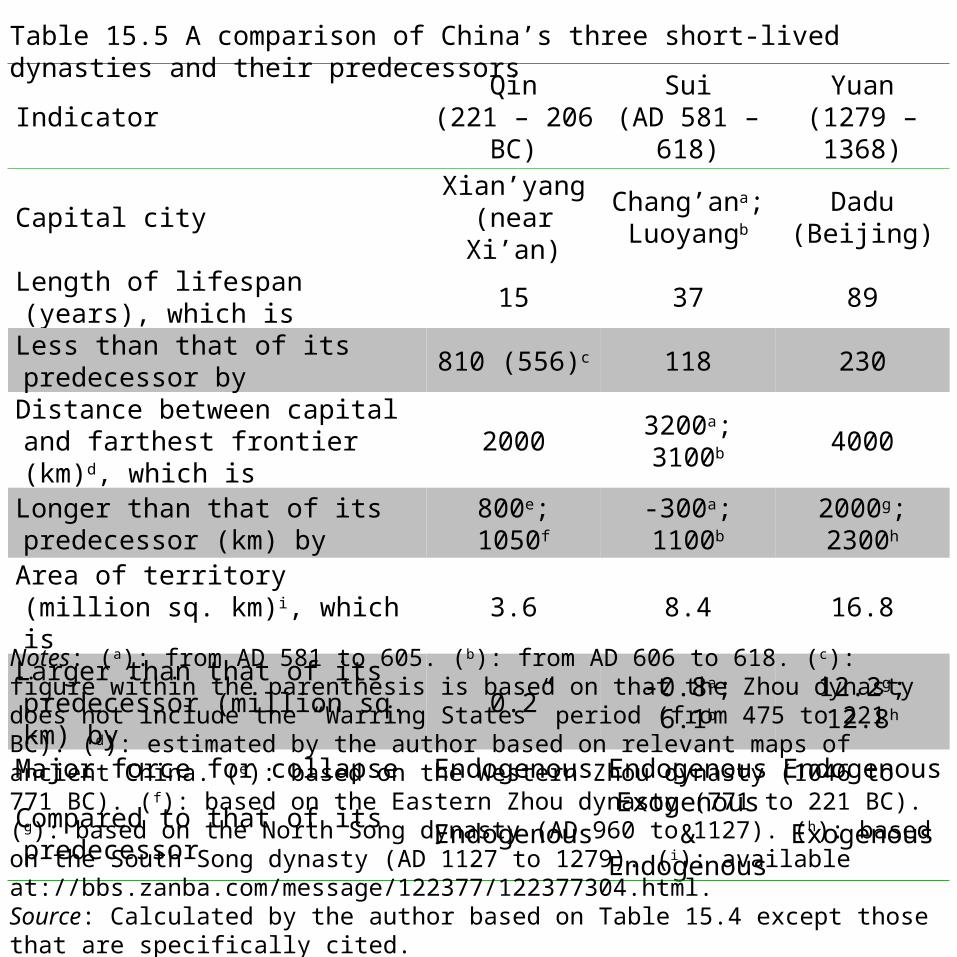
IndicatorQin
(221 – 206 BC)
Sui(AD 581 –
618)
Yuan(1279 – 1368)
Capital cityXian’yang
(near Xi’an)Chang’ana; Luoyangb
Dadu (Beijing)
Length of lifespan (years), which is 15 37 89Less than that of its predecessor by 810 (556)c 118 230Distance between capital and farthest frontier (km)d, which is
2000 3200a; 3100b 4000
Longer than that of its predecessor (km) by
800e; 1050f -300a; 1100b 2000g; 2300h
Area of territory (million sq. km)i, which is
3.6 8.4 16.8
Larger than that of its predecessor (million sq. km) by
0.2 -0.8a; 6.1b 12.2g; 12.8h
Major force for collapse Endogenous Endogenous Endogenous
Compared to that of its predecessor EndogenousExogenous & Endogenous
Exogenous
Notes: (a): from AD 581 to 605. (b): from AD 606 to 618. (c): figure within the parenthesis is based on that the Zhou dynasty does not include the “Warring States” period (from 475 to 221 BC). (d): estimated by the author based on relevant maps of ancient China. (e): based on the Western Zhou dynasty (1046 to 771 BC). (f): based on the Eastern Zhou dynasty (771 to 221 BC). (g): based on the North Song dynasty (AD 960 to 1127). (h): based on the South Song dynasty (AD 1127 to 1279). (i): available at://bbs.zanba.com/message/122377/122377304.html. Source: Calculated by the author based on Table 15.4 except those that are specifically cited.
Table 15.5 A comparison of China’s three short-lived dynasties and their predecessors

Chapter conclusion:
Despite their common history and cultural homogeneity, the greater China area has followed during the past decades divergent political and economic systems, from which different social and economic performances have resulted. In this chapter, the social and economic influences of Hong Kong, Macau, Taiwan, and overseas Chinese, as well as their influences on the economic development of mainland China, are examined. Our focus is due to the great potential of comparative advantages as well as the close cultural linkages between Hong Kong, Macau, Taiwan and mainland China. The remaining part of this chapter analyzes the cross-Strait economic relations and the overseas Chinese economics.
Suggested reading
Alesina, A. and E. Spolaore (1997). “On the Number and Size of Nations,” The Quarterly Journal of Economics, Volume 112 (Nov.), pp. 1027-56.
Alesina, A., E. Spolaore, and R. Wacziarg (2000). “Economic integration and political disintegration,” American Economic Review, Volume 90, pp. 1276–96.
Bolton, P., and E. Spolaore (1996). “ Economic Theories of Integration and Break-up of Nations,” European Economic Review, Volume 81, pp. 697-705.
Bolton, P., and G. Roland (1997). “The Breakup of Nations: A Political Economy Analysis,” The Quarterly Journal of Economics, Volume 112, pp. 1057-89.
Friedman, D. (1977). “A Theory of the Size and Shape of Nations,” Journal of Political Economy, Volume 85(1), pp. 59-77.
Gao, T. (2003). “Ethnic Chinese networks and international investment: evidence from inward FDI in China,” Journal of Asian Economics, Volume 14, pp. 611–629

Suggested reading
Goyal, S. and K. Staal (2003). “The political economy of regionalism,” European Economic Review, Volume 48, pp. 563-93.
Harding, Harry (1993). "The Concept of 'Greater China': Themes, Variations and Reservations," The China Quarterly, Volume 136 (Special Issue: Greater China), pp. 660-84.
Rauch, James E. and Vitor Trindade (2002). “Ethnic Chinese Networks in International Trade,” Review of Economics and Statistics, Volume 84, Issue 1, 116-30.
Shambaugh, David (1993). "Introduction: The Emergence of 'Greater China'," The China Quarterly, Volume 136 (Special Issue: Greater China).
Smart, A. and J. Hsu (2004) “The Chinese Diaspora, Foreign Investment and Economic Development in China,” The Review of International Affairs, Volume 3, Issue 4, pp. 544 – 566
So, Alvin Y. (2011). “‘One Country, Two Systems’ and Hong Kong-China National Re-unification: A Crisis-Transformation Perspective,” Journal of Contemporary Asia, Volume 41, Issue 1, pp. 99-116.