Chapter 14: Simulative Friction and Wear Testing -...
12
14 Simulative Friction and Wear Testing 14.1 Introduction 14.2 Defining the Problem 14.3 Selecting a Scale of Simulation Levels of Tribosimulation 14.4 Defining Field-Compatible Metrics 14.5 Selecting or Constructing the Test Apparatus 14.6 Conducting Baseline Testing Using Established Metrics and Refining Metrics as Needed 14.7 Case Studies An Oil Pump Gear Set with Several Wear Modes • Wear of Gravure Rollers on Doctor Blades • Scoring of Spur Gears • Wear of Plastic Parts in an Optical Disk Drive • Wear of Rotary Slitter Knife Blades • Erosive Wear of Piping 14.8 Conclusions 14.1 Introduction The selection of lubricants, materials, or surface treatments for friction and wear-critical applications often involves validation or screening tests before final decisions are made. Testing is particularly valuable during the development of new machines for which operating conditions are much different than existing designs. An example of the latter might be a new design that cannot use off-the-shelf bearings or gears because the temperatures are too high or the surrounding environments are too corrosive. The steps involved in developing tribosimulations of current or newly designed systems are, with only one signif- icant exception, essentially the same. The exception is that for an existing friction of wear problem, there is prior experience in the response of the materials and lubricants to the operating conditions. In a new design, however, there may be no direct prior experience in the behavior of candidate materials, although there may be some relevant experience from machinery of a similar kind. There are two types of tribosimulations: computer simulations and physical simulations. The computer simulation uses a virtual mechanical assembly that consists of several components defined in terms of a set of properties, spatial relationships, and assumed rules of interaction. Known or estimated properties of the materials and/or lubricants are provided to the model, and the expected responses of the virtual tribosystem to such variables as load cycles, deflections, temperature excursions, etc., are calculated. Such programs have been prepared by both academic researchers and industry engineers for tribological components like bearings, face seals, brakes, and gears. Component designers have also developed sophis- ticated design tools for automotive valve trains, engines, and pumping systems as well. The second type of tribosimulation is the physical simulation. Here, materials and lubricants are screened in an apparatus that is intended to provide the essential operating characteristics of the intended Peter J. Blau Tribomaterials Investigative Systems
Transcript of Chapter 14: Simulative Friction and Wear Testing -...
14Simulative Friction
and Wear Testing
14.1 Introduction14.2 Defining the Problem 14.3 Selecting a Scale of Simulation
Levels of Tribosimulation
14.4 Defining Field-Compatible Metrics14.5 Selecting or Constructing the Test Apparatus 14.6 Conducting Baseline Testing Using Established
Metrics and Refining Metrics as Needed 14.7 Case Studies
An Oil Pump Gear Set with Several Wear Modes • Wear of Gravure Rollers on Doctor Blades • Scoring of Spur Gears • Wear of Plastic Parts in an Optical Disk Drive • Wear of Rotary Slitter Knife Blades • Erosive Wear of Piping
14.8 Conclusions
14.1 Introduction
The selection of lubricants, materials, or surface treatments for friction and wear-critical applicationsoften involves validation or screening tests before final decisions are made. Testing is particularly valuableduring the development of new machines for which operating conditions are much different than existingdesigns. An example of the latter might be a new design that cannot use off-the-shelf bearings or gearsbecause the temperatures are too high or the surrounding environments are too corrosive. The stepsinvolved in developing tribosimulations of current or newly designed systems are, with only one signif-icant exception, essentially the same. The exception is that for an existing friction of wear problem, thereis prior experience in the response of the materials and lubricants to the operating conditions. In a newdesign, however, there may be no direct prior experience in the behavior of candidate materials, althoughthere may be some relevant experience from machinery of a similar kind.
There are two types of tribosimulations: computer simulations and physical simulations. The computersimulation uses a virtual mechanical assembly that consists of several components defined in terms of aset of properties, spatial relationships, and assumed rules of interaction. Known or estimated propertiesof the materials and/or lubricants are provided to the model, and the expected responses of the virtualtribosystem to such variables as load cycles, deflections, temperature excursions, etc., are calculated. Suchprograms have been prepared by both academic researchers and industry engineers for tribologicalcomponents like bearings, face seals, brakes, and gears. Component designers have also developed sophis-ticated design tools for automotive valve trains, engines, and pumping systems as well.
The second type of tribosimulation is the physical simulation. Here, materials and lubricants arescreened in an apparatus that is intended to provide the essential operating characteristics of the intended
Peter J. BlauTribomaterials Investigative Systems
application. An additional use of virtual and physical simulations is to observe how a certain materialor lubricant might react in a situation when the opportunity to observe the material or lubricant is notpractical. For example, bearings for use in unmanned orbiting satellites might be observed in an ultra-high vacuum, space-like environmental chamber created in the laboratory for that purpose.
This article focuses on the development and use of physical tribosimulations. It describes the processinvolved in developing and validating laboratory bench-scale simulations for friction and wear-criticalmachine components. The steps in developing a physical tribosimulation are similar in some respects tothose used to set up a computer simulation. They are:
1. Define the nature of the friction or wear problem to be investigated2. Select a scale of simulation3. Define field-compatible metrics to use to assess the results of the simulation4. Select or build the apparatus (the model, in the case of the computer simulation)5. Conduct baseline tests to establish the repeatability and characteristics of the method6. Analyze baseline test results using the established metrics7. Refine as needed to achieve an acceptable engineering confidence level
14.2 Defining the Problem
Defining the nature of the friction or wear problem is critical before any test method can be selected,developed, or successfully employed. Rushing ahead to testing without proper analysis of the problem isakin to sitting down at a table to play cards without knowing what game is to be played and what itsrules are. At the first level of problem definition, one answers the following questions:
1. What are the physical attributes of the tribosystem?2. Is it an open or closed tribosystem?3. What form or forms of friction or wear are likely to be involved?4. What quantitative measures, if any, are there to describe the behavior of the materials in the
situation of interest?5. What materials or lubricants are currently under consideration for this application?6. What time and resources are available to use to solve the current problem?
By defining the physical limits of the tribosystem, we are forced to make the first judgment. At whatdistance from the tribological interface will the surroundings still affect the tribological function? Forexample, if we limit our focus to a pair of wearing gears in isolation from their surroundings, we mightinadvertently neglect externally produced mechanical vibrations, sources of abrasive debris, or temper-ature excursions from surrounding components as potential contributions to the gears’ wear environ-ment. Thus our simulation could omit critical, wear life-limiting elements which come from thesurroundings, elements which might in fact be just as important to include in the simulation as theimposed load on the gear teeth or the speed of relative rotation. Closed tribosystems involve, for example,recirculating lubricants or contact environments which are contained within a certain portion of themachine. Open tribosystems are more complicated and difficult to simulate because materials of unfore-seen origin might enter the area of contact from sources external to the machine and cause strong frictionor wear responses. An example of an open tribosystem is the bucket teeth on construction equipmentthat must dig through all kinds of dirt, soil, and rock under wet and dry, hot and cold conditions.
The forms of friction or wear must be defined early. It is common to observe more than one type ofwear or mechanical surface damage in different locations, even on the same part. Therefore, the locationsand wear types most damaging to the satisfactory operation of the component must be identified andprioritized. It is possible that more than one type of test will be required to ensure that the proposedmaterials or lubricants will respond suitably to all the critical contact conditions on various surfaces ofthe component. For example, the side of a pump gear may slide against its case while the teeth of thesame gear may experience contact fatigue worsened by a small amount of tangential slip.
In existing applications, identifying the type of wear involves examining field-worn parts which havebeen protected from the environment after having been removed from the machine. Surfaces of wornparts which have stood unprotected for some time may be corroded and difficult to analyze. Othercomplications include removing surface deposits of degraded or heat-altered lubricants without destroy-ing the most telling clues as to the dominant mode of wear damage. In new designs, the engineer isplaced in a position of speculating what the environment of the tribosystem will be, and adjusting thesimulation appropriately. Some guidance can, however, be obtained by analyzing existing systems withsimilar mechanical, thermal, and chemical aspects in the key areas of tribocontact.
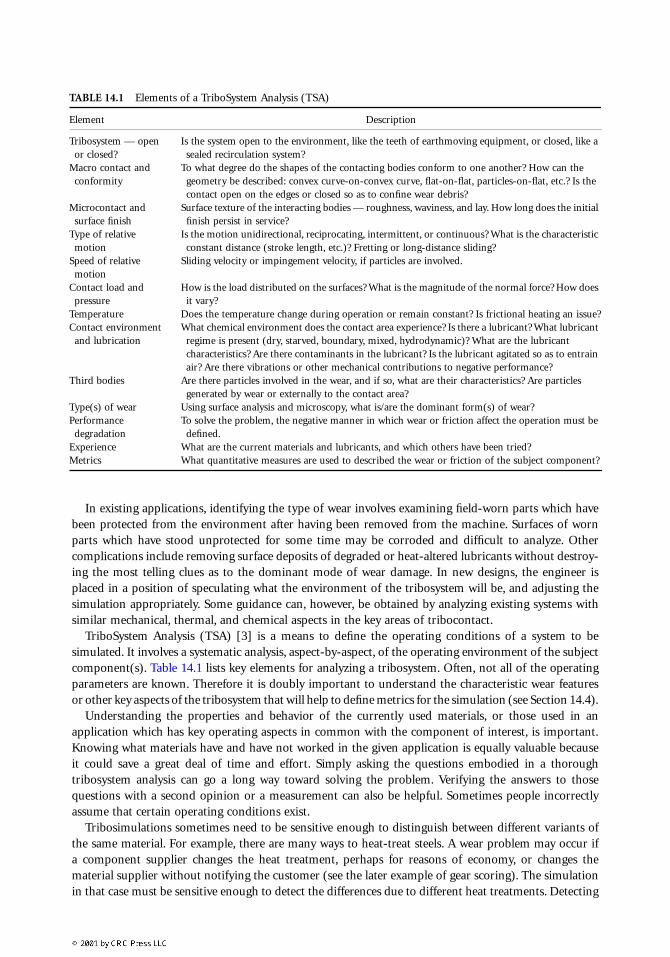
TriboSystem Analysis (TSA) [3] is a means to define the operating conditions of a system to besimulated. It involves a systematic analysis, aspect-by-aspect, of the operating environment of the subjectcomponent(s). Table 14.1 lists key elements for analyzing a tribosystem. Often, not all of the operatingparameters are known. Therefore it is doubly important to understand the characteristic wear featuresor other key aspects of the tribosystem that will help to define metrics for the simulation (see Section 14.4).
Understanding the properties and behavior of the currently used materials, or those used in anapplication which has key operating aspects in common with the component of interest, is important.Knowing what materials have and have not worked in the given application is equally valuable becauseit could save a great deal of time and effort. Simply asking the questions embodied in a thoroughtribosystem analysis can go a long way toward solving the problem. Verifying the answers to thosequestions with a second opinion or a measurement can also be helpful. Sometimes people incorrectlyassume that certain operating conditions exist.
Tribosimulations sometimes need to be sensitive enough to distinguish between different variants ofthe same material. For example, there are many ways to heat-treat steels. A wear problem may occur ifa component supplier changes the heat treatment, perhaps for reasons of economy, or changes thematerial supplier without notifying the customer (see the later example of gear scoring). The simulationin that case must be sensitive enough to detect the differences due to different heat treatments. Detecting
TABLE 14.1 Elements of a TriboSystem Analysis (TSA)
Element Description
Tribosystem — open or closed?
Is the system open to the environment, like the teeth of earthmoving equipment, or closed, like a sealed recirculation system?
Macro contact and conformity
To what degree do the shapes of the contacting bodies conform to one another? How can the geometry be described: convex curve-on-convex curve, flat-on-flat, particles-on-flat, etc.? Is the contact open on the edges or closed so as to confine wear debris?
Microcontact and surface finish
Surface texture of the interacting bodies — roughness, waviness, and lay. How long does the initial finish persist in service?
Type of relative motion
Is the motion unidirectional, reciprocating, intermittent, or continuous? What is the characteristic constant distance (stroke length, etc.)? Fretting or long-distance sliding?
Speed of relative motion
Sliding velocity or impingement velocity, if particles are involved.
Contact load and pressure
How is the load distributed on the surfaces? What is the magnitude of the normal force? How does it vary?
Temperature Does the temperature change during operation or remain constant? Is frictional heating an issue?Contact environment
and lubricationWhat chemical environment does the contact area experience? Is there a lubricant? What lubricant
regime is present (dry, starved, boundary, mixed, hydrodynamic)? What are the lubricant characteristics? Are there contaminants in the lubricant? Is the lubricant agitated so as to entrain air? Are there vibrations or other mechanical contributions to negative performance?
Third bodies Are there particles involved in the wear, and if so, what are their characteristics? Are particles generated by wear or externally to the contact area?
Type(s) of wear Using surface analysis and microscopy, what is/are the dominant form(s) of wear?Performance
degradationTo solve the problem, the negative manner in which wear or friction affect the operation must be
defined.Experience What are the current materials and lubricants, and which others have been tried?Metrics What quantitative measures are used to described the wear or friction of the subject component?

small variations in friction or wear using short-term laboratory tests can be challenging, but it can befacilitated through the use of statistical methods for data analysis. Therefore, multiple tests of eachmaterial or lubricant combination are needed to establish the characteristics of the laboratory test method;particularly, if the test method is new and has no historical record of performance. Using ASTM andother standardized tests offers the benefit of having previous data available from tests conducted in thesame manner.
14.3 Selecting a Scale of Simulation
Field-trials evaluate materials and lubricants under actual operating environments. Sometime field trialsinvolve monitoring components as they are used in normal service. These instrumented components canbe subjected to certain prescribed patterns of use. For example, some automotive companies haveinstrumented the brakes of test vehicles and returned those vehicles to their owners for a period of time,treating the driver’s behavior as a variable. In other cases, instrumented vehicles have been run in severalcities, but over carefully prescribed driving routes. Both types of field tests provide valuable information,but interpreting the wealth of data that obtains in these situations is difficult and complicated due to themany uncontrolled variables present in the field. For example, test drivers on city routes might be forcedto break rapidly to avoid hitting a child or a dog. They could wind up behind a slow moving vehicle. Intruth, the more “channels of information” that are collected, the more challenging is the task of inter-preting the results and determining the underlying relationships in material and lubricant behavior.
Like the automotive and truck brakes in the foregoing example, a great many tribological componentsare not operated under steady-state conditions. Some machine parts may experience short start-up andslow-down intervals but spend most of their lives under constant conditions. A classic example is thepiston ring in an internal combustion engine that experiences hydrodynamic fluid film breakdown atthe ends of the stroke. Other interfaces may be in a constant state of change and never reach what mightbe termed steady-state. Perhaps the contact pressure is not constant, the contact velocity is not constant,the temperature is not constant, and the direction of relative motion is not constant. In addition,tribosystems tend to age. Lubricants change properties as their additives degrade on exposure to hightemperatures, react with the surfaces and other chemical species in the environment, and becomecontaminated with wear particles. The degree to which these factors affect the validity of a tribosimula-tion’s results is not easy to determine a priori, but they can be taken into account to some degree in awell-designed tribosimulation.
14.3.1 Levels of Tribosimulation
For the purposes of this chapter, we shall consider four levels of tribosimulation. Figure 14.1 shows theselevels, indicating the parallels between physical and computer tribosimulations. Generally, the morerealistic the simulation, the more costly and complicated it becomes.
Level 1 tribosimulations use full-scale machines, such as entire automobiles, trucks, aircraft, ships,manufacturing machinery, and consumer products. These machines may be instrumented to measureloads, temperatures, strains, power demands on motors, and vibrations. In physical simulations, full-scale machines are operated under controlled conditions, such as on a test stand or inside an environ-mental chamber. For example, an entire communications satellite might be placed in a high-vacuumchamber and its antennas caused to rotate to determine whether the bearing lubricants will performeffectively in space. A truck might be rolled onto a chassis dynamometer and its wheels subjected tovarious braking loads and cycles. However, even the high-level simulations of Level 1 might omit certainfactors present in the field. For example, the effects of zero-gravity on the aforementioned satellite cannotbe completely simulated in a vacuum chamber on Earth. The effects of random potholes, loose gravel,and uneven road surfaces cannot easily be simulated on a test stand, but recent developments in computer-controlled test stands are making such simulations increasingly realistic.
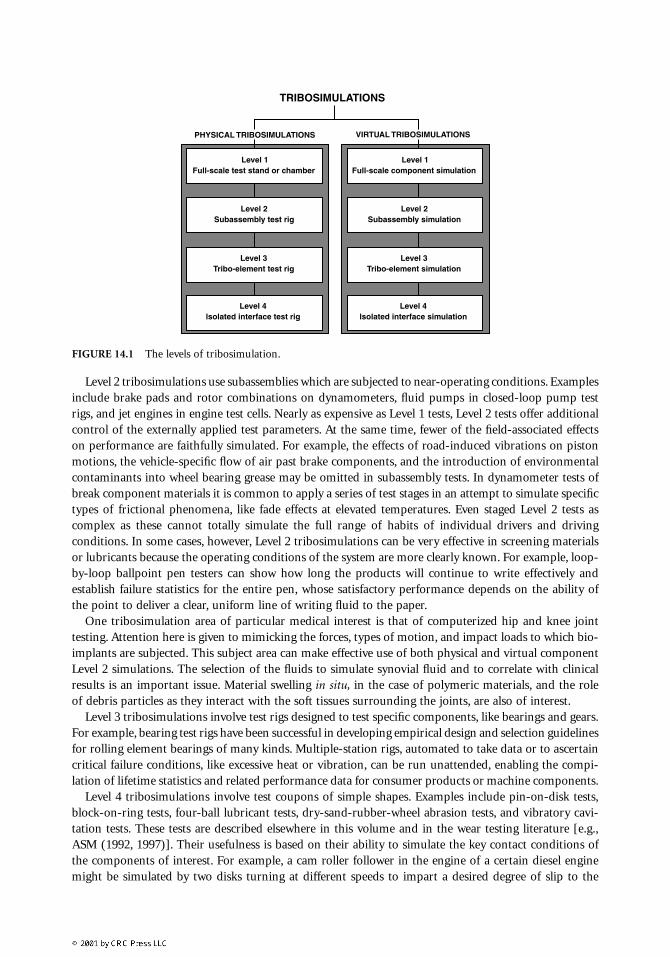
Level 2 tribosimulations use subassemblies which are subjected to near-operating conditions. Examplesinclude brake pads and rotor combinations on dynamometers, fluid pumps in closed-loop pump testrigs, and jet engines in engine test cells. Nearly as expensive as Level 1 tests, Level 2 tests offer additionalcontrol of the externally applied test parameters. At the same time, fewer of the field-associated effectson performance are faithfully simulated. For example, the effects of road-induced vibrations on pistonmotions, the vehicle-specific flow of air past brake components, and the introduction of environmentalcontaminants into wheel bearing grease may be omitted in subassembly tests. In dynamometer tests ofbreak component materials it is common to apply a series of test stages in an attempt to simulate specifictypes of frictional phenomena, like fade effects at elevated temperatures. Even staged Level 2 tests ascomplex as these cannot totally simulate the full range of habits of individual drivers and drivingconditions. In some cases, however, Level 2 tribosimulations can be very effective in screening materialsor lubricants because the operating conditions of the system are more clearly known. For example, loop-by-loop ballpoint pen testers can show how long the products will continue to write effectively andestablish failure statistics for the entire pen, whose satisfactory performance depends on the ability ofthe point to deliver a clear, uniform line of writing fluid to the paper.
One tribosimulation area of particular medical interest is that of computerized hip and knee jointtesting. Attention here is given to mimicking the forces, types of motion, and impact loads to which bio-implants are subjected. This subject area can make effective use of both physical and virtual componentLevel 2 simulations. The selection of the fluids to simulate synovial fluid and to correlate with clinicalresults is an important issue. Material swelling in situ, in the case of polymeric materials, and the roleof debris particles as they interact with the soft tissues surrounding the joints, are also of interest.
Level 3 tribosimulations involve test rigs designed to test specific components, like bearings and gears.For example, bearing test rigs have been successful in developing empirical design and selection guidelinesfor rolling element bearings of many kinds. Multiple-station rigs, automated to take data or to ascertaincritical failure conditions, like excessive heat or vibration, can be run unattended, enabling the compi-lation of lifetime statistics and related performance data for consumer products or machine components.
Level 4 tribosimulations involve test coupons of simple shapes. Examples include pin-on-disk tests,block-on-ring tests, four-ball lubricant tests, dry-sand-rubber-wheel abrasion tests, and vibratory cavi-tation tests. These tests are described elsewhere in this volume and in the wear testing literature [e.g.,ASM (1992, 1997)]. Their usefulness is based on their ability to simulate the key contact conditions ofthe components of interest. For example, a cam roller follower in the engine of a certain diesel enginemight be simulated by two disks turning at different speeds to impart a desired degree of slip to the
FIGURE 14.1 The levels of tribosimulation.

contact. Furthermore, the test disks could be supplied with a lubricant and heated to simulate engineconditions.
The linkage between tribosimulation levels can be important to establish the validation of Level 3 and4 tests as effective screening methods. For example, if a set of Level 4 rankings agrees with relative rankingsof the same set of materials or lubricants in Level 3 tests, and the validity of Level 3 tests in a certainapplication has been confirmed, then the usefulness of Level 4 tests will be greatly extended.
14.4 Defining Field-Compatible Metrics
A metric is a measurable quantity or unique observational feature that can be used to rank or otherwisedistinguish the performance of a material or lubricant in a tribosystem. Table 14.2 lists a few metricscommonly used in the field and in tribology laboratories. Wear and friction measurement methods aredescribed in more detail elsewhere in this volume and in ASM publications (ASM, 1992, 1997).
Ideally, metrics for assessing friction or wear problems should be quantitative, accurate, straightforwardto measure, and not subject to the investigator’s judgment. In practice, however, some or all of theforegoing criteria cannot be met. Furthermore, as Table 14.2 shows, there is often a significant differencebetween the parameters or observations that can be made in the field and those that can be made in thelaboratory. Therefore, an important issue in assessing the usefulness and validity of simulations involvesarriving at a set of common metrics which laboratory investigators and field engineers can agree on.There is no point in developing a laboratory test if field engineers refuse to believe that the results of thetests are relevant or cannot relate the test results to what they observe. Some key wear and surface damagemetrics, in order of preference, follow:
1. Quantitative measures, like weight loss or dimensional changes, that can be measured both in thefield and in the laboratory
2. A series of reference materials that rank in similar order of merit in the field and laboratory tests.3. Visual wear features that appear similar in field-worn and laboratory-generated surfaces.4. Wear debris that looks similar in field and laboratory-collected samples.
TABLE 14.2 Common Metrics for Assessing Friction and Wear Situations
Situation Tribological Problem Typical Metrics
Field component High friction Seizure; galling or scuffing marks; power draw of a motor; overheating of bearings or slideways; irregular motions; excessive wear of bearing or sealing surfaces; unusual noises or vibrations; marring of a formed product’s surface, as in metalworking; irregular speed fluctuations in a bearing
Surface damage Scuffing marks; galling and other visual indicationsWear Fluid leakage in a seal; loss of compression in a piston; erosive perforation
of a pipe elbow; presence of wear particles in a lubricant; loss of fit between parts; excessive or unusual noise from gears or bearings; excessive or unusual vibrations; changes in the appearance of contact surfaces (abrasive grooves, scuff marks, etc.); signal drop-out in electrical contacts; loss of cutting performance of a tooling insert.
Laboratory specimen High friction Friction force or torque measurementsSurface damage Visual inspection or profilometric measurementsWear Weight loss; displacement relative to another specimen or reference plane,
wear scar size; wear depth; wear volume calculated by surface measurements or by weight change; visual examination; changes in friction force, surface temperature, or vibrations as detected by sensors; surface reflection characteristics measured by sensors

14.5 Selecting or Constructing the Test Apparatus
Well-equipped tribology laboratories usually contain a variety of testing machines, capable of testing fora range of tribological behavior. One or more of these machines might be suitable for conducting thegiven tribosimulation. Commercially manufactured wear testing machines may be a cost-effective alter-natives to designing and building new, special-purpose machines for the problem at hand. But commercialmachines should be used only if they serve the required purposes, including simulating specific wear offriction conditions. It may also be possible to modify an existing machine to perform the requisitesimulation. It is beyond the scope of this chapter to provide guidance on the design and construction offriction and wear testing machines because there is an enormous number of alternative designs.
Well-equipped tribology laboratories also contain auxiliary equipment for measuring and character-izing wear, such as precision microbalances, profiling instruments, hardness testers, and microscopes ofvarious types. Special techniques and highly trained personnel experienced in cross-sectioning wearsurfaces or performing surface chemical analysis populate a well-equipped tribology laboratory.
When selecting or designing a friction or wear testing apparatus for a specific purpose, it is importantthat the reason for testing, and the metrics selected for validating the results, are firmly in mind. Forexample, if weight loss is a metric, specimen fixturing and handling procedures should be designed toavoid sources of error in mounting specimens, treating them after exposure to wear, and transferringthem to the weighing system. If surface appearance is a metric, protection of wear features from demount-ing and handling artifacts must be a part of the procedure.
14.6 Conducting Baseline Testing Using Established Metrics and Refining Metrics as Needed
Baseline tests with the materials and lubricants in current use, or believed to be the leading candidatesfor a new application, are helpful in establishing the repeatability and characteristics of the test methoditself. It is worthwhile to conduct a series of replicated tests to establish the repeatability of the baselineconditions. Knowing this, the performance of other materials or lubricants can be analyzed to determineif it is statistically different from the normal scatter in the test results. One test per materials couple orset of test conditions does not provide very strong evidence on which to make engineering decisions.
If wear is measured quantitatively, then the wear factors or other metrics from baseline tests can beused in the denominator of a figure of merit. For example, the lifetime of a baseline cutting tool material,expressed as the number of workpieces produced before tool replacement is required, is divided into thelifetime of another candidate tool material to give the relative lifetime of the candidate. The higher thenumber is above 1.0, the greater the wear benefits of substitution, other factors being equal. An alternativeengineering metric might be the tooling cost per unit part machined.
Sometimes suitable quantitative metrics cannot be found. It may then be possible to compare theappearance of the test specimen to a worn part to establish the success of the simulation. An example isgiven in 14.7.1.
It is likely that laboratory simulations will not be able to reproduce every aspect of the part operatingconditions. Therefore, it is, in general, unreasonable to expect that precisely the same wear rates or metricswill be obtained in the laboratory and in the field. From the standpoint of screening, however, it is veryimportant that candidate materials rank in very much the same order in the field and in the laboratory.Since there are many ways to measure wear in the laboratory (weight loss, wear profile, wear scardimensions, etc.), there may be one metric that correlates better with the field wear results than another.Therefore if one method of laboratory wear measurement does not correlate well with field results,another may work better.
The following section describes several laboratory simulations that used different kinds of metrics andtesting procedures depending on the nature of the parts being simulated.
14.7 Case Studies
Six case studies on the selection and use of simulative friction and wear tests are provided below. Thefirst case, which is described by Blau (1998), involves an automotive application in which new simulativetest fixtures and procedures were developed. In the latter five case studies, summarized from an articleby Blau and Budinski (1999), existing or slightly modified ASTM test methods were used to solveindustrial plant wear issues and product-related wear problems.
14.7.1 An Oil Pump Gear Set with Several Wear Modes
An initiative was undertaken to replace certain steel fluid pump gears with a lighter-weight, aluminum-based alloy. One criterion for the acceptability of the new gear material was that it possess acceptablewear characteristics when substituted for the current steel. The gears were of a gerotor type in which awedge of fluid is trapped between the teeth of eccentrically mounted inner and outer gears. As the gearsturn, the fluid is forced between them, pressurized, and then out of a pocket in the pump housing. Thistype of pump is typical of automotive oil pumps and automatic transmission fluid pumps.
Based on the results of a TSA, described in Section 14.2, and with input from both pump part makersand pump users, the two wear-critical areas were determined to be the teeth contact points and the flatgerotor gear faces which can rub intermittently against the inside faces of the housing. In the latter case,little or nothing was known about the surface contact pressures or loads. In addition, specimens of gearsrun in actual service and in full-sized gear pump test rigs were carefully examined by optical microscopyand cross-sectioned for subsurface study.
Based on the relatively small quantities of candidate materials available for use in the material selectionprocess, it was necessary to devise a simulative test method which used small, round disks, about 20 mmin diameter and 10 mm thick. These were about 1/4 the diameter of the actual gear disks. To simplify thetesting process and make the best use of limited materials, it was decided to use the same specimendimensions for tests of both tooth wear and the flat face-on-casing wear. It was desired to use quantitativemetrics to screen the various candidate materials, but as described later, some of the wear metrics turnedout to be only semiquantitative.
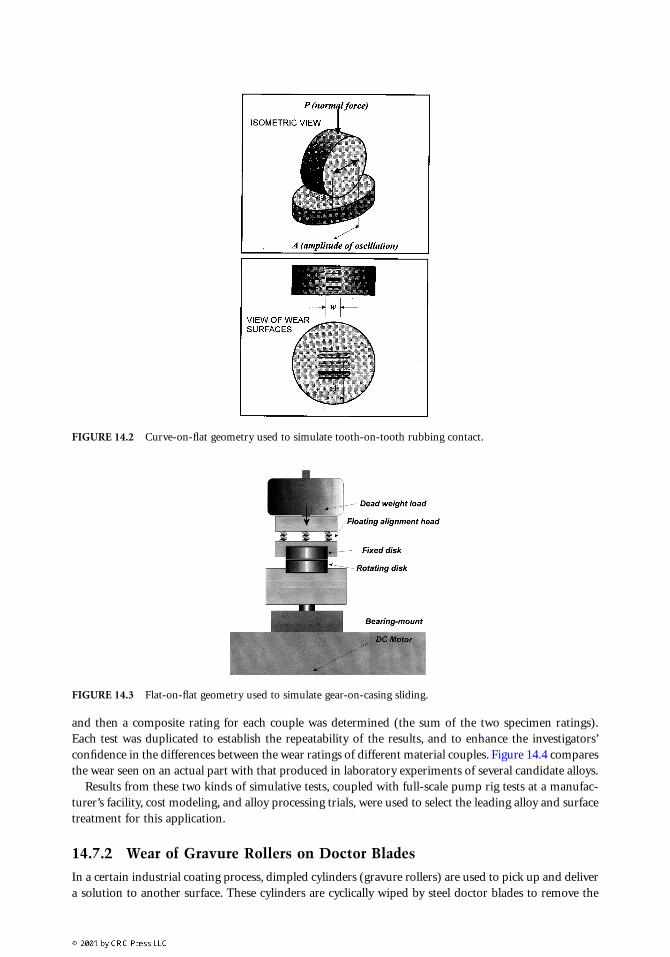
Several testing configurations were developed. Eventually, the wear simulation evolved into a config-uration that emphasized tooth-to-tooth slip which resulted in combined adhesive and three-body abrasivewear and subsequent loss of the gear tooth profile. One disk was rigidly held vertically with its curvedouter diameter, simulating the curvature of the tooth face. It was oscillated against the flat face of asecond disk of the same material (Figure 14.2). Hot, lubricated tests were performed at temperaturessimilar to that of the application. The length of the test was determined by the time needed to producewear features similar to those seen in actual gears. The width of the wear scar on the curved disk’s outerdiameter was measured and converted to a wear volume. This wear volume was normalized by dividingby the product of the applied load and the number of cycles to obtain a wear rate (mm3/N-cycle).
The gear face-on-casing sliding wear mode was simulated by placing the flat faces of two disk specimenstogether in a thrust-washer-type geometry (Figure 14.3). Circular insets were machined into one or bothdisk specimens to produce an annular contact. The upper specimen was held fixed in a spring-loadedarrangement to assure good flat-on-flat seating with the lower rotating disk. The rotating disk was madeof the candidate lightweight gear material and the upper was made of typical casting alloy. Tests wererun with oil-coated surfaces. Each test consisted of four segments in which the test was stopped and oilwas replenished on the contact surfaces.
Weight losses and dimensional changes were unsatisfactory quantities for measuring the small amountof wear produced in this type of flat-on-flat test. Therefore, a semiquantitative method for determiningthe wear severity was used. This involved cataloging the types of wear damage, such as scuffing, abrasion,gouging, etc., and assigning several severity levels to each. Table 14.3 shows the wear damage rating scale.Each level was defined sufficiently well so that two people independently obtained the same numericalrankings on the same test specimens. The wear damage ratings for each disk specimen were determined,
and then a composite rating for each couple was determined (the sum of the two specimen ratings).Each test was duplicated to establish the repeatability of the results, and to enhance the investigators’confidence in the differences between the wear ratings of different material couples. Figure 14.4 comparesthe wear seen on an actual part with that produced in laboratory experiments of several candidate alloys.
Results from these two kinds of simulative tests, coupled with full-scale pump rig tests at a manufac-turer’s facility, cost modeling, and alloy processing trials, were used to select the leading alloy and surfacetreatment for this application.
14.7.2 Wear of Gravure Rollers on Doctor Blades
In a certain industrial coating process, dimpled cylinders (gravure rollers) are used to pick up and delivera solution to another surface. These cylinders are cyclically wiped by steel doctor blades to remove the
FIGURE 14.2 Curve-on-flat geometry used to simulate tooth-on-tooth rubbing contact.
FIGURE 14.3 Flat-on-flat geometry used to simulate gear-on-casing sliding.

excess coating material, and were experiencing unacceptable wear as a result. It was decided to try ion-implanting the surfaces of the rollers to improve their wear. ASTM standards G-99 (pin-on-disk test)was used to compare the implanted and unimplanted (current) materials. While the wear of the rollermaterial was markedly improved, the wear of the doctor blade material increased to an unacceptablelevel. Therefore, it was decided that ion implantation would not be an acceptable solution in this case.
While the pin-on-disk method was not an exact simulation of the doctor blade operating conditions,it was felt to be adequate to evaluate one potential solution for this wear problem, and to determine thatalternative methods of surface engineering or materials substitution would be required.
14.7.3 Scoring of Spur Gears
An expensive steel gear set in production equipment began to exhibit signs of significant scoring. It waslearned that the supplier had modified his processing and that the hardness of the new gears varied fromthat of the previous sets. ASTM standard G-98 (the button-on-block galling test) was used to determinethe critical level of Rockwell hardness to avoid the onset of galling. This ASTM test method is based onusing visual observations to obtain a numerical metric; namely, the threshold stress for galling. Usingobservations of test coupon surfaces subjected to increasing levels of normal force, one assesses the normalpressure at which galling begins. It turned out that a difference of only 1 or 2 units on the Rockwell Chardness scale made the difference between steel gears that ran acceptably and those that did not. Costlyfuture failures were therefore avoided by tightening the hardness specifications on the gear steels.
Increasing the hardness of a material to improve its surface durability and wear resistance is a long-standing, intuitive notion that is not always substantiated by testing. That is because other factors, suchas the type of wear being experienced, the material’s fracture toughness, fatigue resistance, and chemicalreactivity with the environment can also affect the surface response to contact conditions. In the presentfortuitous example, the suitability of the steels for use as gear teeth could be directly correlated to theirRockwell hardness numbers with the help of a standardized test method that captured the essentialelements of surface contact in the application.
TABLE 14.3 Wear Damage Rating (WDR) Scale Used to Assess Flat-on-Flat Wear
Factor Severity Description
Light abrasion 1.0 Faint, widely spaced grooves aligned parallel to the sliding direction. Grooves may not be continuous around the track and are similar in depth to the original grinding marks.
Moderate abrasion
4.0 Multiple, parallel wear grooves extending across a substantial portion of the contact area. Some of the original surface finish visible between the abrasion grooves.
Severe abrasion 6.0 Deep abrasive wear grooves across the entire contact face. Little or no trace of the original surface finish.
Light scuffing 1.5 Polished-looking areas with little or no original surface finish within their boundaries. Scuffed area < 25% of the nominal contact area.
Moderate scuffing 3.0 Scuffed area 25 to 75% of the nominal contact area.Scoring 5.0 Localized, relatively deep grooves (� depth of original machining marks), suggesting
plowing by large hard particles.Pull-out 5.0 Removal of particles or entire grains from the surface. Regions of pull-out may be associated
with scoring by the removal material.Delamination 5.0 Detachment of thin, flat platelets; typically associated with fatigue crack growth parallel to
the free surface.Burning 5.0 Production of dark oxides or tarnishes suggestive of exposure to excessive frictional heating.Severe metallic
wear6.0 Significant plastic deformation accompanied by deep grooving. No traces of the original
surface finish. Often accompanied by shiny flake-like wear particles.Microwelding 1.0 Presence of tiny flecks of highly adherent, transferred material from the opposing surface.Major transfer 2.0 Presence of relatively large particles or patches of highly adherent material from the
opposing surface.

14.7.4 Wear of Plastic Parts in an Optical Disk Drive
Not only wear, but the presence of wear products (debris particles) can seriously affect the performanceof imaging and computer equipment. This was the case for contacting plastic parts in an optical diskdrive. The ASTM G-133 reciprocating pin-on-flat test was used to screen plastic pairs for those whichnot only had the best material-to-material compatibility, but also produced the least harmful debrisinsofar as the surrounding machinery was concerned. Therefore, an additional metric was an observa-tionally bases scale of the distribution of wear debris in the vicinity of the contact area on the pin andflat specimens.
14.7.5 Wear of Rotary Slitter Knife Blades
Rotary slitter knives were used to cut plastic sheeting to size. The edges of the knives slid against oneanother repeatedly as they worked. Excessive wear led to unsatisfactory performance, costly equipmentshutdowns, and product damage. In this case, the development of acceptable metrics for laboratoryscreening was complicated by the lack of a clear definition for the blade “sharpness.” A decrease in productcut-edge quality is the result of worn blades, but edge quality is difficult to quantify in a way that canbe used in cost-effective laboratory tests.
The ASTM G-83 crossed cylinders wear test was eventually selected to screen materials for knife bladeapplications. This test produces a concentrated contact at the intersection of two orthogonal cylindrical
FIGURE 14.4 (a) Wear features on a gear side face tested in a commercial producers’ testing facility under severeoperating conditions. (b–d) Different levels of wear damage observed on laboratory test specimens in the flat-on-flat simulator test shown in Figure 14.3.

specimens. While not exhibiting the exact geometry of the application, the small, highly-loaded contactbetween test specimens contained enough of the essential elements of rotary slitter knife interactions toproduce a useful screening test. Wear volume is used as the metric and is computed from the test materials’densities and their weight losses.
By examining a great deal of crossed-cylinders laboratory wear test data that would have been imprac-tical to obtain on the production floor, it was discovered that at least one of the blades had to be composedof carbide material in order for the slitter knives to perform satisfactorily. Since more than one materialcombination with satisfactory wear rates was identified in the course of the testing campaign, it waspossible to select the most affordable solution to the problem from among several alternatives.
14.7.6 Erosive Wear of Piping
During the process of designing a new plant involving the piping of dicalcium phosphate, it was necessaryto know what material would be the best choice for the piping. Issues were not only erosion resistance,but corrosion resistance as well. The G-32 solid particle impingement erosion test was selected. Severalcandidate materials were exposed to dicalcium phosphate and other erodants using a pressurized air jetapparatus, such as that prescribed in the standard. It was determined that a soft stainless steel wouldwork adequately in this application, and the decision was made to use that material for construction.Significantly, higher hardness did not ensure wear resistance, as it did in the case described in Section 14.7.3.Therefore, the selection of materials for wear applications based on properties like hardness depends onthe type of wear involved and on other performance requirements.
14.8 Conclusions
The development of simulative friction and wear tests requires an interdisciplinary approach, beginningwith a tribosystem analysis to define the problem and to establish key metrics that can be used to testthe validity of simulations. Laboratory simulations using either custom-designed apparatus or standardtest methods can be successfully applied to save time and money in solving friction and wear problems.No single test method will solve all problems, and proper test selection is critical for success. Sometimes,more than one test method will be needed to establish an engineering solution; especially, if more thanone form of wear or surface damage is present in the application of interest.
References
ASM Handbook (1992), Friction Lubrication and Wear Technology, 18, ASM International Materials Park,OH.
ASM (1997), Source Book on Friction and Wear Testing, ASM International, Materials Park, OH.Blau, P.J. (1998), Development of bench-scale test methods for screening P/M aluminum alloys for wear
resistance, in Powder Metallurgy Aluminum and Light Alloys for Automotive Applications, Jandeska,Jr., W.F. and Chernenkoff, R.A. (Eds.), Metal Powder Industries Federation, Princeton, NJ, 97.
Blau, P.J. and Budinski, K.G. (1999), Use of ASTM standard wear tests for solving practical industrialwear problems, Wear, 225-229, 1159.