Chapter 14 From Randomness to Probability · PDF fileChapter 14 From Randomness to Probability...
18
1 Chapter 14 From Randomness to Probability How to measure a “likelihood” of an event? How likely is it to answer correctly one out of two true-false questions on a quiz? Is it more, less, or equally likely as guessing five out of ten true-false questions? Is it likely or unlikely to answer all ten true-false questions on a quiz if all answers are simply guessed? If you roll two dice, is it more likely to roll the sum of ten, or the sum of eight? What does it mean “There is thirty percents chance for a rain tomorrow”? You will be able to answer the questions above with confidence when we finish this and the next chapter. Consider the following experiment: Adam has taken a 10 True-False questions quiz. He claims that he came totally unprepared and had to select each answer by tossing a coin. And he got a B! Can you believe it? Rare Event Rule for Inferential Statistics: If under given assumptions (like truly random guessing) the probability of an observed event (like guessing randomly, and getting all 10 answers correct) is very small, then we should conclude that the assumption was wrong. So, if a chance to guess most of the true-false answers on a quiz is small, then reject the assumption of random guessing and conclude that Adam was bragging: he must have known at least some answers! Probability deals with modeling of random phenomena (phenomena or experiments whose outcomes may vary) Each observation of a random phenomenon is called a trial. The value of the random phenomenon, and call it an outcome. When we combine outcomes, the resulting combination is an event. The collection of all possible outcomes is called the sample space. Examples of random phenomena: 1. A toss of a coin 2. A roll of a die 3. A random selection of an individual from a population
Transcript of Chapter 14 From Randomness to Probability · PDF fileChapter 14 From Randomness to Probability...

1
Chapter 14 From Randomness to Probability How to measure a “likelihood” of an event? How likely is it to answer correctly one out of two true-false questions on a quiz? Is it more, less, or equally likely as guessing five out of ten true-false questions? Is it likely or unlikely to answer all ten true-false questions on a quiz if all answers are simply guessed? If you roll two dice, is it more likely to roll the sum of ten, or the sum of eight? What does it mean “There is thirty percents chance for a rain tomorrow”? You will be able to answer the questions above with confidence when we finish this and the next chapter. Consider the following experiment: Adam has taken a 10 True-False questions quiz. He claims that he came totally unprepared and had to select each answer by tossing a coin. And he got a B! Can you believe it? Rare Event Rule for Inferential Statistics: If under given assumptions (like truly random guessing) the probability of an observed event (like guessing randomly, and getting all 10 answers correct) is very small, then we should conclude that the assumption was wrong. So, if a chance to guess most of the true-false answers on a quiz is small, then reject the assumption of random guessing and conclude that Adam was bragging: he must have known at least some answers!
Probability deals with modeling of random phenomena (phenomena or experiments whose outcomes may vary)
Each observation of a random phenomenon is called a trial. The value of the random phenomenon, and call it an outcome. When we combine outcomes, the resulting combination is an event. The collection of all possible outcomes is called the sample space. Examples of random phenomena: 1. A toss of a coin 2. A roll of a die 3. A random selection of an individual from a population

2
Intuitively probability of an event is a long-run proportion of times the event occurs in many independent repetitions of the experiment. Law of Large Numbers: the long-run relative frequency of repeated event gets closer and closer to a single value called the probability of the event. This definition of probability is often called empirical probability
)(#
#AP
srepetitionof
occuredhasAtimesof
Proportion and probability. Let p be a proportion of population having certain property S. If one individual is selected from this population at random, then the probability that it has the property S is p Example: In a given very large batch of calculators 5% are defective. Therefore, the probability of selecting at random a defective calculator is 5%.
Here is a nice link which might help you understand the frequency distribution of the outcomes on an example of throwing a die (or two) many times:
http://gwydir.demon.co.uk/jo/probability/dice.htm
It is often HARD to find the probability of a given event! But we can approximate it quite
well by simulating the event.
Have you heard of the Three Doors game? Check below and try yourself.
http://www.stat.sc.edu/%7Ewest/javahtml/LetsMakeaDeal.html

3
Model of a random phenomenon 1. The sample space S = the set of all possible outcomes 2. Events = subsets of the sample space Venn Diagram If A is an event, the event that "A does not occur" is denoted Ac and is called the complement of A
Two events are called disjoint, if they cannot occur simultaneously Combined events: A and B, A or B A and B A or B
A
A
B
Union of A and B Union of A and
B
AC
A

4
3. Probability = a function that assigns a number to each event A. That number is denoted as P(A) (called the probability of an event A) with the following properties:
0 P(A) 1
P(S) = 1 (S represents the set of all possible outcomes.)
Events A and AC are complementary events if they are disjoint (mutually exclusive, no common outcomes), and P(Ac) = 1- P(A)
if A are B are disjoint then P(A or B) = P(A) + P(B) Definition: Events A and B are independent if P(A and B) = P(A)·P(B) Examples: A coin is tossed three times. a) Find S (sample space) of this experiment Solutions: The sample space S = {HHH, HHT, HTH, THH, HTT, THT, TTH, TTT} b) Let A = "two heads (H) in three tosses"
B = "H in first toss" C = "H in second toss"
Find the probability of the events A, B, C. Solutions: First find the list of simple events from sample space matching each description: A= {HHT, HTH, THH} B= {HHH, HHT, HTH, HTT } C= {HHH, HHT, THH, THT } Probability of each outcome = 1/8: equally likely outcomes with the total of 8 outcomes P(A) = 3/8 P(B) = 4/8 = 1/2 P(C) = 4/8 = ½ More examples of combined events: E={B and C} = “ H in first toss and H in second toss” = {HHH, HHT} F={B or C} = “ H in first toss or H in second toss” =

5
= { HHH, HHT, HTH, HTT, THH, THT } Independence of the events. Read the descriptions of events A and B in the example above. Are A and B independent? How to check if two events E and F are independent? Show that P(A and B)=P(A)·P(B) Are the events E and F independent? The event {A and B} =" two heads in three tosses and H in the first toss} H" = {HHH, HHT} P(A and B) = 2/8 =1/4 P(A)=3/8 P(F) =2/8 P(E and F) =? =P(E)· P(F) No What Can Go Wrong?
Beware of probabilities that don’t add up to 1.To be a legitimate probability assignment, the sum of the probabilities for all possible outcomes must total 1.
Don’t add probabilities of events if they’re not disjoint. Events must be disjoint to use the Basic Addition Rule.
Don’t multiply probabilities of events if they’re not independent. Direct multiplication of probabilities of events that are not independent is one of the most common errors people make in dealing with probabilities.
Don’t confuse disjoint and independent—disjoint events can’t be independent (why?)

6
STT 200 Classwork Chapter 14 A A white and colored dice are tossed
1. Identify the events:
A ="sum equals 6",
B = "sum is at most 5" ,
C= "same number on each die",
D ="at least one shows 4"
and find their probabilities
2. Find the probability of the event that "the sum is at least 6"
3. Find the probability of A or B. Are the events A and B independent? Are they
disjoint?
4. Let W=" white shows 4" and V=" colored shows 4" Are the events W and V independent? Are they disjoint?

7
STT 200 Classwork Chapter 14 B
8

9

10
Chapter 15 Probability Rules! Model of a random occurrence (discussed in Chapter 14)
1. The sample space S = the set of all possible outcomes 2. Events = subsets of the sample space
Ac = "A does not occurs" - the complement of A
Two events are called disjoint, if they cannot occur simultaneously
Combined events: A or B, A and B 3. Probability = a function that to each event A assigns a number P(A)
0 P(A) 1
P(S) = 1
P(Ac) = 1-P(A)
if A are B are disjoint, then P(A or B) = P(A) + P(B) Example (Model with Equally Likely Outcomes) If the sample space has finitely many possible outcomes and all outcomes are equally likely, then the probability of an event A is
( )count of outcomes in A
P Acount of all possible outcomes
Many models do not have this property. General addition rule
P(A or B) = P(A) + P(B) - P(A and B) Examples: 1. Let’s count how many people in our classroom have dogs. How many have cats. How many have both. Find the probability that a randomly selected person in our class has a dog or a cat. Are the two events: “having a dog” and “having a cat” disjoin? Are they independent?
11
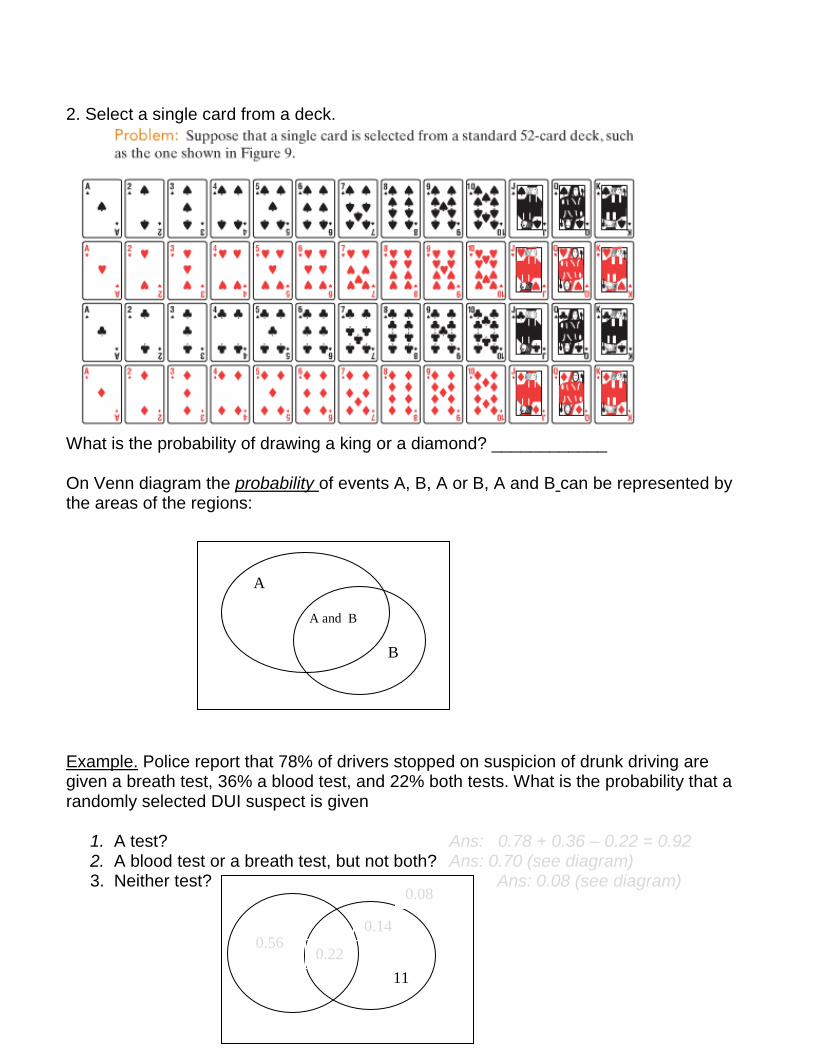
2. Select a single card from a deck.
What is the probability of drawing a king or a diamond? ____________ On Venn diagram the probability of events A, B, A or B, A and B can be represented by the areas of the regions:
Example. Police report that 78% of drivers stopped on suspicion of drunk driving are given a breath test, 36% a blood test, and 22% both tests. What is the probability that a randomly selected DUI suspect is given
1. A test? Ans: 0.78 + 0.36 – 0.22 = 0.92 2. A blood test or a breath test, but not both? Ans: 0.70 (see diagram) 3. Neither test? Ans: 0.08 (see diagram)
B
A
A and B
0.08
0.14
0.22 0.56

12
Conditional Probability
Example. Given is a contingency table of students cross-classified by their school goal and gender
Goals G
ender Grades Popular Sports Total
Boy 24 10 13 47
Girl 27 19 7 53
Total 51 29 20 100
A student is selected at random. Let G ="a girl is selected" and S = "wants to excel at sports" 1. Find P(G) Ans: 53/100 = 0.53 2. Find P(S) Ans: 20/100 = 0.20 3. Find the probability that "a girl is selected and she wants to excel at sports"
P(G and S) = 7/100 = 0.07 4. Find the probability that "a student wants to excel at sports, given that a girl is
selected ".
P(S | G) )(#
)(#
G
GandS= 7/53 = 0.13
Conditional probability of B given that A has occurred is defined by
)(
)()|(
AP
BandAPABP
Conditional probability of A given that B has occurred is defined by

13
)(
)()|(
BP
BandAPBAP
Recall that events A and B are independent, if P(A and B) = P(A) P(B).
So, if A and B are independent, then ( | )P B A ( )P B
General multiplication rule
From )(
)()|(
AP
BandAPABP it follows that
)|()()( ABPAPBandAP or
)|()()( BAPBPBandAP
Example. In a lot of 10 elements there are two defectives. Two elements are selected at random and without replacement, one after another. 1. What is the probability that the first is good and the second is defective? 2. What is the probability that both are defective? 3. What is the probability that the second is defective?
Tree Diagram A tree diagram helps us think through conditional probabilities by showing sequences of events as paths that look like branches of a tree. 7/9 G2
8/10 G1
2/9 D2
● 8/9 G2
2/10 D1
1/9 D2
Answers: Let G=”selecting good one” and D=”selecting a defective one” 1. P(G1 and D2)= (8/10) * (2/9) = 8/45 2. P(D1 and D2)= (2/10)*(1/9)=1/45 P(G1 and D2) + P(D1 and D2) = (8/10)*(2/9) + (2/10)*(1/9) = 8/45+1/45=9/45=0.2 or 20%

14
Reversing Conditional Probability Suppose we want to know P(A|B), but we know only P(A), P(B), and P(B|A). We can compute P(A and B) from the formula P(A and B) = P(A)·P(B|A)= P(B)·P(A|B)= From this information, we can find P(A|B):
(or, by relabeling, find P(B|A))
(A and B)(A|B)(B)
PPP

15
Reversing the Conditioning (Bayes’ Rule)
Example. In April 2003 Science magazine reported a new test for ovarian cancer. Ovarian cancer afflicts 1 out of 5000 women. The test is highly sensitive, correctly detecting 99.97% of women who have the disease. But it’s unlikely that it will be used because it gives false positives 5% of the time. Why is it a big problem? Draw a probability tree and determine the probability that a woman who tests positive actually has ovarian cancer.
0.9997 +
C 0.0002 0.0003 - ● 0.9998 0.05 +
H
0.95 - What have we learned?
The probability rules from Chapter 14 only work in special cases—when events are disjoint or independent.
We now know the General Addition Rule and General Multiplication Rule.
We also know about conditional probabilities and that reversing the conditioning can give surprising results.
Venn diagrams, tables, and tree diagrams help organize our thinking about probabilities.
We now know more about independence—a sound understanding of independence will be important throughout the rest of this course.

16
Classwork Chapter 15

17

18