Chapter 14 - Co.it Analysis
68
arson, Wild, Chiapetta, Ropidah, Haslinda, Aryati, Liana © The McGraw-Hill Companies, Inc., 2007 Cost-Volume- Profit Analysis Chapte r 14 100 Shares $1 par value CVP Analysis???
Transcript of Chapter 14 - Co.it Analysis

Larson, Wild, Chiapetta, Ropidah, Haslinda, Aryati, Liana © The McGraw-Hill Companies, Inc., 2007
Cost-Volume-Profit Analysis
Chapter
1414 100 Shares
$1 par value
CVP Analysis???

Larson, Wild, Chiapetta, Ropidah, Haslinda, Aryati, Liana © The McGraw-Hill Companies, Inc., 2007
Describe different types of cost
behavior in relation to
production and sales volume.
Determine cost estimates using
three different methods.
Compute the break-even point
for a single product company.
Graphs costs and sales for a
single product company.
Learning ObjectivesLearning Objectives
Identify assumptions in cost
volume profit analysis and
explain their impact.
Describe several applications
of cost-volume–profit analysis.
Compute break-even point
for a multiproduct company.
Analyze changes in sales
using the degree of operating
leverage.
Larson, Wild, Chiapetta, Ropidah, Haslinda, Aryati, Liana © The McGraw-Hill Companies, Inc., 2007
CVP analysis is used to answer questionssuch as:• How much must I sell to earn my desired
income?• How will income be affected if I reduce
selling prices to increase sales volume?• How will income be affected if I change the
sales mix of my products?
CVP analysis is used to answer questionssuch as:• How much must I sell to earn my desired
income?• How will income be affected if I reduce
selling prices to increase sales volume?• How will income be affected if I change the
sales mix of my products?
Questions Addressed byCost-Volume-Profit Analysis
Questions Addressed byCost-Volume-Profit Analysis

Larson, Wild, Chiapetta, Ropidah, Haslinda, Aryati, Liana © The McGraw-Hill Companies, Inc., 2007
• Refers to the manner in which a cost changes as a related activity changes.
• 3 common classifications: Fixed Cost Variable Cost Mixed Cost
Identifying Cost BehaviorIdentifying Cost Behavior

Larson, Wild, Chiapetta, Ropidah, Haslinda, Aryati, Liana © The McGraw-Hill Companies, Inc., 2007Volume (units produced)
Cos
t ($)
• Total fixed costs remain unchanged when activity
changes.• Eg: Factory Insurance, Factory Rent
Your monthly rent for a factory buildings does not
change at any level of production.
Total Fixed CostTotal Fixed Cost
Larson, Wild, Chiapetta, Ropidah, Haslinda, Aryati, Liana © The McGraw-Hill Companies, Inc., 2007
Volume (units produced)
Cos
t ($)
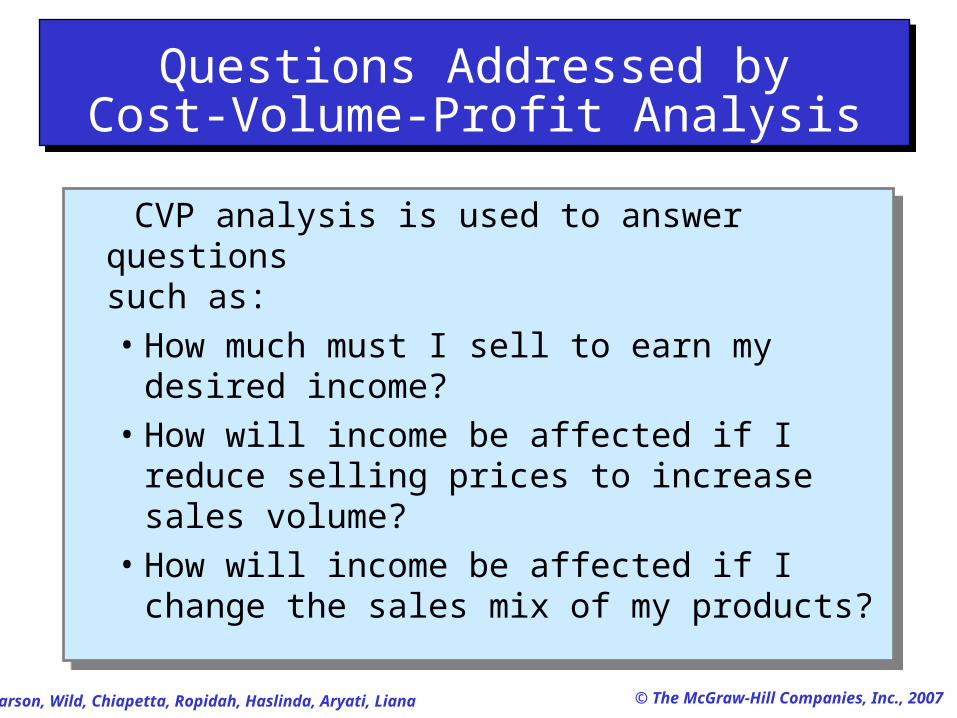
• Fixed costs per unit decline as activity increases.
Your average cost perunit decreases as
production increases.
Fixed Cost Per UnitFixed Cost Per Unit

Larson, Wild, Chiapetta, Ropidah, Haslinda, Aryati, Liana © The McGraw-Hill Companies, Inc., 2007
Volume (units produced)
Cos
t ($)
• Total variable costs change when activity changes.
• Eg: Direct materials, Direct labor
Your direct materials cost changes with the level of
productions
Total Variable CostTotal Variable Cost

Larson, Wild, Chiapetta, Ropidah, Haslinda, Aryati, Liana © The McGraw-Hill Companies, Inc., 2007
Volume (units produced)
Cos
t ($)
• Variable costs per unit do not change as activity
increases.
Variable Cost Per UnitVariable Cost Per Unit
Your average cost perunit doest not change at any level of production.

Larson, Wild, Chiapetta, Ropidah, Haslinda, Aryati, Liana © The McGraw-Hill Companies, Inc., 2007
Mixed Cost Mixed Cost
• Mixed cost includes both fixed and variable cost components. It is greater than zero when volume is zero, but increases when production is increased.
• Eg: Utility charge
Facility costs is incurred even when facility is unused, and
increases with usage.

Larson, Wild, Chiapetta, Ropidah, Haslinda, Aryati, Liana © The McGraw-Hill Companies, Inc., 2007
Variable
Utility Charge
Volume (units produced)
Cos
t ($
)
Total mixed cost
Fixed Monthly
Utility Charge
Total Mixed CostsTotal Mixed Costs

Larson, Wild, Chiapetta, Ropidah, Haslinda, Aryati, Liana © The McGraw-Hill Companies, Inc., 2007
Volume (unit produced)
Co
st
Total cost remainsconstant within anarrow range of
activity.
Step-Wise CostsStep-Wise Costs

Larson, Wild, Chiapetta, Ropidah, Haslinda, Aryati, Liana © The McGraw-Hill Companies, Inc., 2007
Co
st
Total cost increases to a new higher cost for the next
higher range of activity.
Step-Wise CostsStep-Wise Costs
Volume (unit produced)

Larson, Wild, Chiapetta, Ropidah, Haslinda, Aryati, Liana © The McGraw-Hill Companies, Inc., 2007
• Costs that increase when production increases, but in a nonlinear manner.
Volume (units produced)
Cos
t ($)
Curvilinear CostsCurvilinear Costs

Larson, Wild, Chiapetta, Ropidah, Haslinda, Aryati, Liana © The McGraw-Hill Companies, Inc., 2007
• The objective is to classify all costs as either fixed or variable.
• Analysis of past cost behavior is required in order to identify costs.
• 3 different methods can be used to determine cost estimates:
1. Scatter Diagram2. High-Low Method3. Least-Squares Regression
Measuring Cost BehaviorMeasuring Cost Behavior
Larson, Wild, Chiapetta, Ropidah, Haslinda, Aryati, Liana © The McGraw-Hill Companies, Inc., 2007
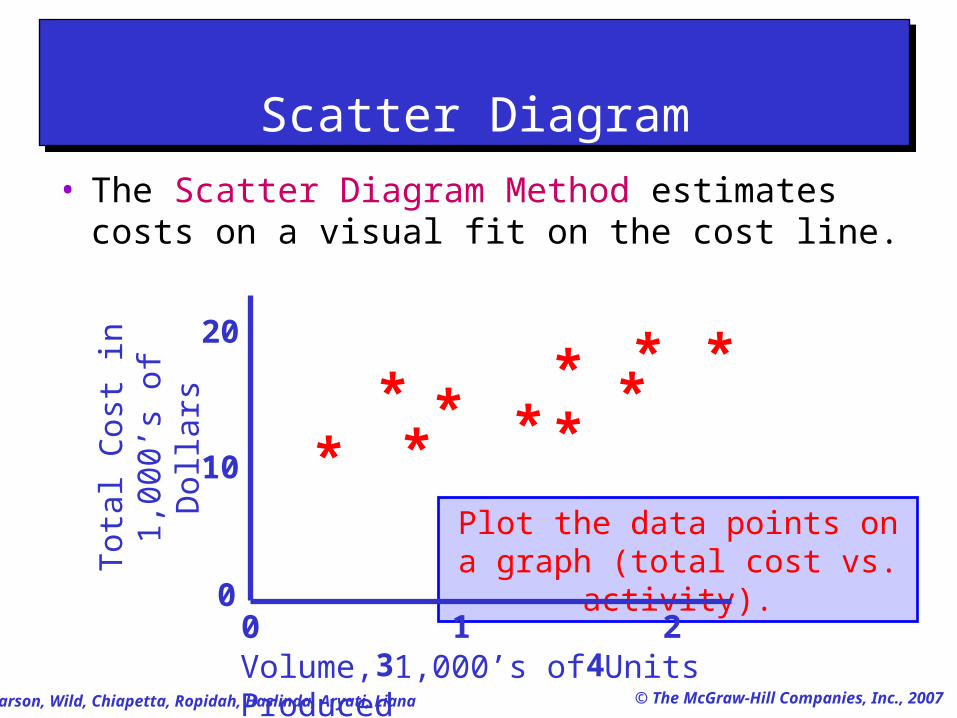
Plot the data points on a graph (total cost vs. activity).
0 1 2 3 4
*
Tot
al C
ost
in1,
000’
s of
Dol
lars
10
20
0
***
**
**
*
*
Volume, 1,000’s of Units Produced
Scatter DiagramScatter Diagram
• The Scatter Diagram Method estimates costs on a visual fit on the cost line.
Larson, Wild, Chiapetta, Ropidah, Haslinda, Aryati, Liana © The McGraw-Hill Companies, Inc., 2007
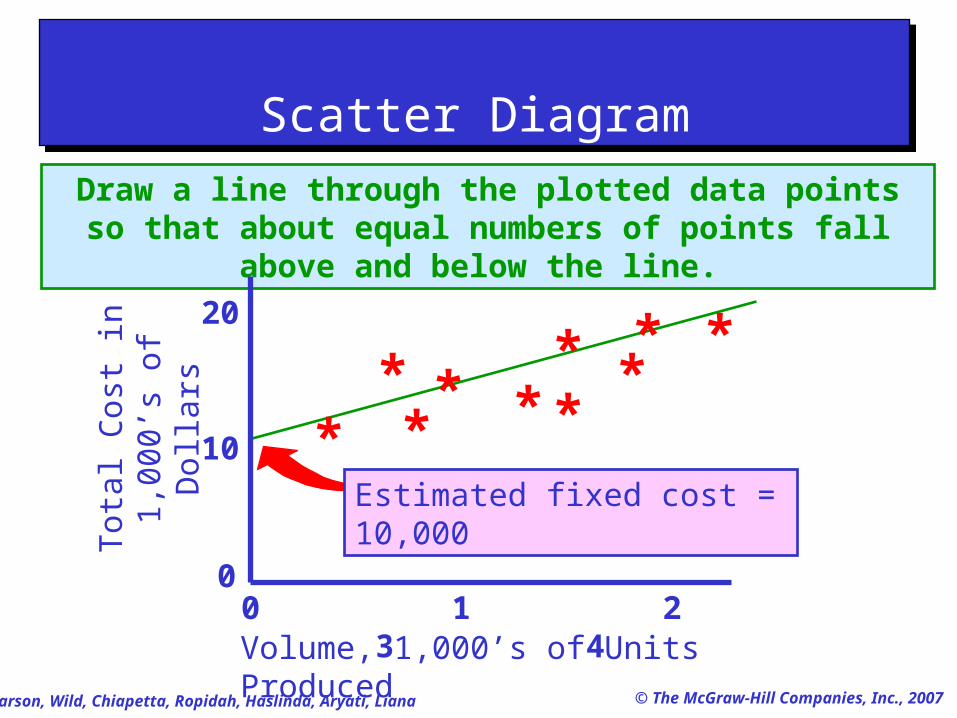
Draw a line through the plotted data points so that about equal numbers of points fall above and below the line.
Estimated fixed cost = 10,000
0 1 2 3 4
*
Tot
al C
ost
in1,
000’
s of
Dol
lars
10
20
0
***
**
**
*
*
Volume, 1,000’s of Units Produced
Scatter DiagramScatter Diagram

Larson, Wild, Chiapetta, Ropidah, Haslinda, Aryati, Liana © The McGraw-Hill Companies, Inc., 2007
Vertical distance
is the change in cost.
Horizontal distance is the change in activity.
Unit Variable Cost = Slope = in costin units
0 1 2 3 4
*
Tot
al C
ost
in1,
000’
s of
Dol
lars
10
20
0
***
**
**
*
*
Volume, 1,000’s of Units Produced
Scatter DiagramScatter Diagram
Larson, Wild, Chiapetta, Ropidah, Haslinda, Aryati, Liana © The McGraw-Hill Companies, Inc., 2007
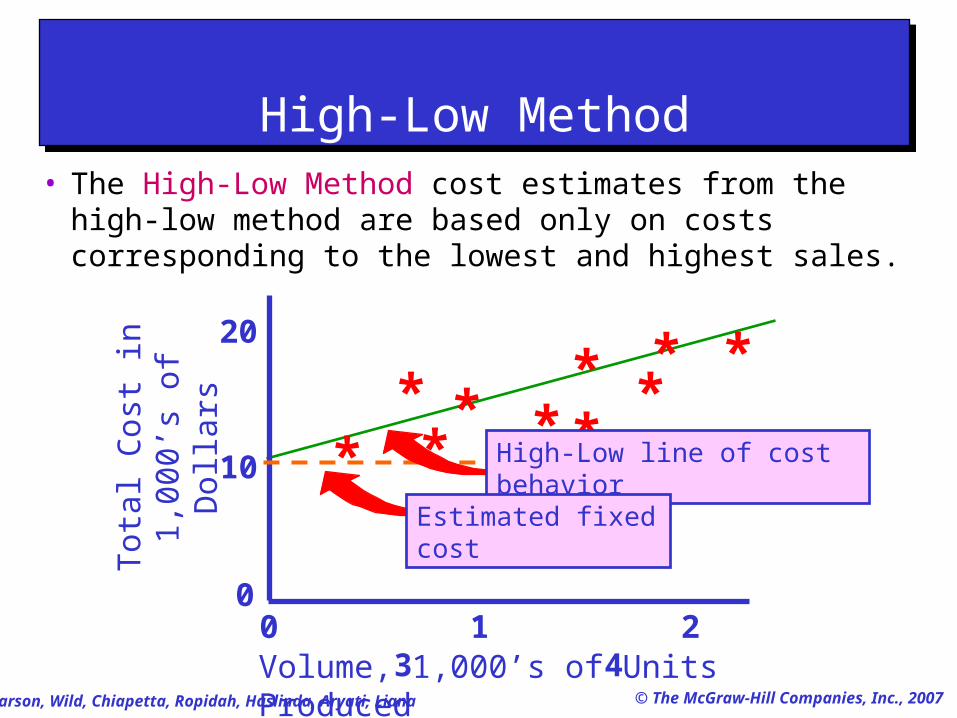
High-Low MethodHigh-Low Method• The High-Low Method cost estimates from the high-low
method are based only on costs corresponding to the lowest and highest sales.
0 1 2 3 4
*
Tot
al C
ost
in1,
000’
s of
Dol
lars
10
20
0
***
**
**
*
*
Volume, 1,000’s of Units Produced
High-Low line of cost behavior
Estimated fixed cost

Larson, Wild, Chiapetta, Ropidah, Haslinda, Aryati, Liana © The McGraw-Hill Companies, Inc., 2007
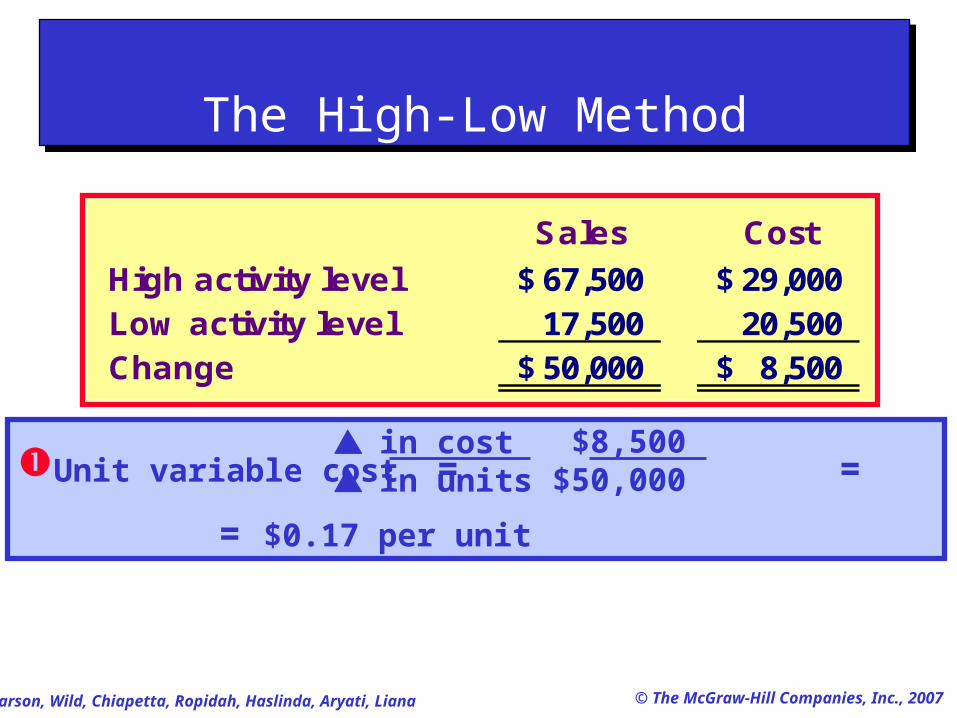
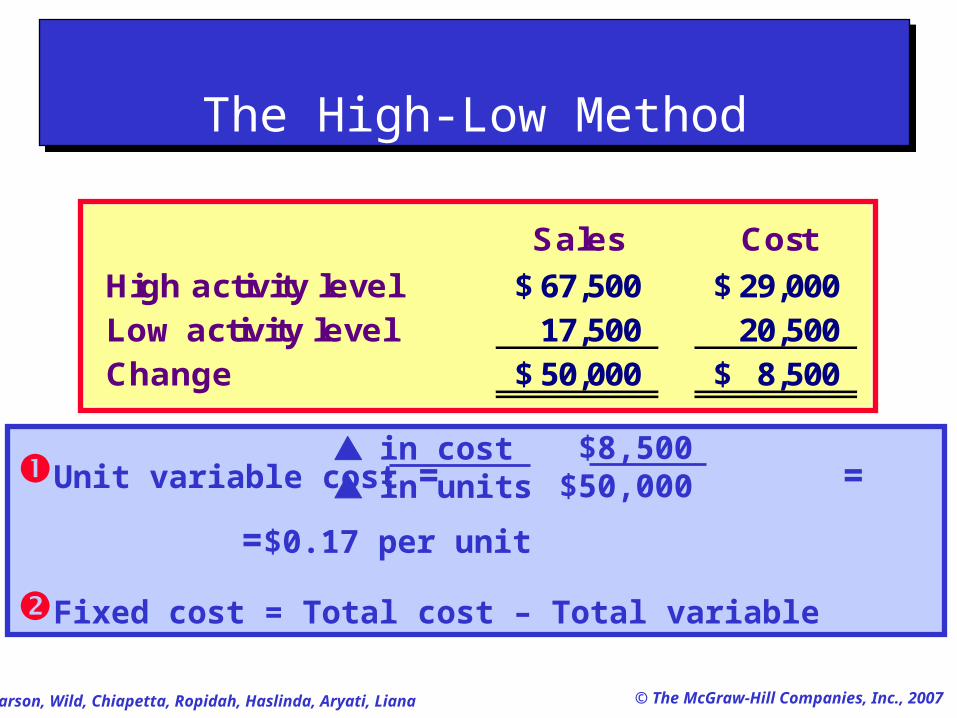
The following relationships between salesand costs are observed:
Using these two levels of activity, compute: the variable cost per unit. the total fixed cost.
Sales Cost
High activity level 67,500$ 29,000$ Low activity level 17,500 20,500 Change 50,000$ 8,500$
High-Low MethodHigh-Low Method
Larson, Wild, Chiapetta, Ropidah, Haslinda, Aryati, Liana © The McGraw-Hill Companies, Inc., 2007
Unit variable cost = = = $0.17 per unitin costin units
$8,500$50,000
Sales Cost
High activity level 67,500$ 29,000$ Low activity level 17,500 20,500 Change 50,000$ 8,500$
The High-Low MethodThe High-Low Method
Larson, Wild, Chiapetta, Ropidah, Haslinda, Aryati, Liana © The McGraw-Hill Companies, Inc., 2007
Sales Cost
High activity level 67,500$ 29,000$ Low activity level 17,500 20,500 Change 50,000$ 8,500$
Unit variable cost = = =$0.17 per unit
Fixed cost = Total cost – Total variable
in costin units
$8,500$50,000
The High-Low MethodThe High-Low Method

Larson, Wild, Chiapetta, Ropidah, Haslinda, Aryati, Liana © The McGraw-Hill Companies, Inc., 2007
Sales Cost
High activity level 67,500$ 29,000$ Low activity level 17,500 20,500 Change 50,000$ 8,500$
Unit variable cost = = = $0.17 per unit
Fixed cost = Total cost – Total variable cost
Fixed cost = $29,000 – ($0.17 per sales $ × $67,500)
Fixed cost = $29,000 – $11,475 = $17,525
in costin units
$8,500$50,000
The High-Low MethodThe High-Low Method

Larson, Wild, Chiapetta, Ropidah, Haslinda, Aryati, Liana © The McGraw-Hill Companies, Inc., 2007
Least-Squares RegressionLeast-Squares Regression• The least-squares regression method is a statistical technique and uses all data
points.• It is commonly used with computer software because of the large number of
calculations required.
0 1 2 3 4
*
Tot
al C
ost
in1,
000’
s of
Dol
lars
10
20
0
***
**
**
*
*
Volume, 1,000’s of Units Produced
Regression Line of Cost Behavior
Estimated fixed cost

Larson, Wild, Chiapetta, Ropidah, Haslinda, Aryati, Liana © The McGraw-Hill Companies, Inc., 2007
• The break-even point (expressed in units of product or dollars of sales) is the unique sales level at which a company earns neither a profit nor incurs a loss which total revenues equal to total costs.
• To compute a break even point in terms of sales unit, we divide total fixed costs by the contribution margin per unit.
• To compute a break even point in terms of sales dollars, we divide total fixed costs by the contribution margin ratio.
Break Even AnalysisBreak Even Analysis
Larson, Wild, Chiapetta, Ropidah, Haslinda, Aryati, Liana © The McGraw-Hill Companies, Inc., 2007
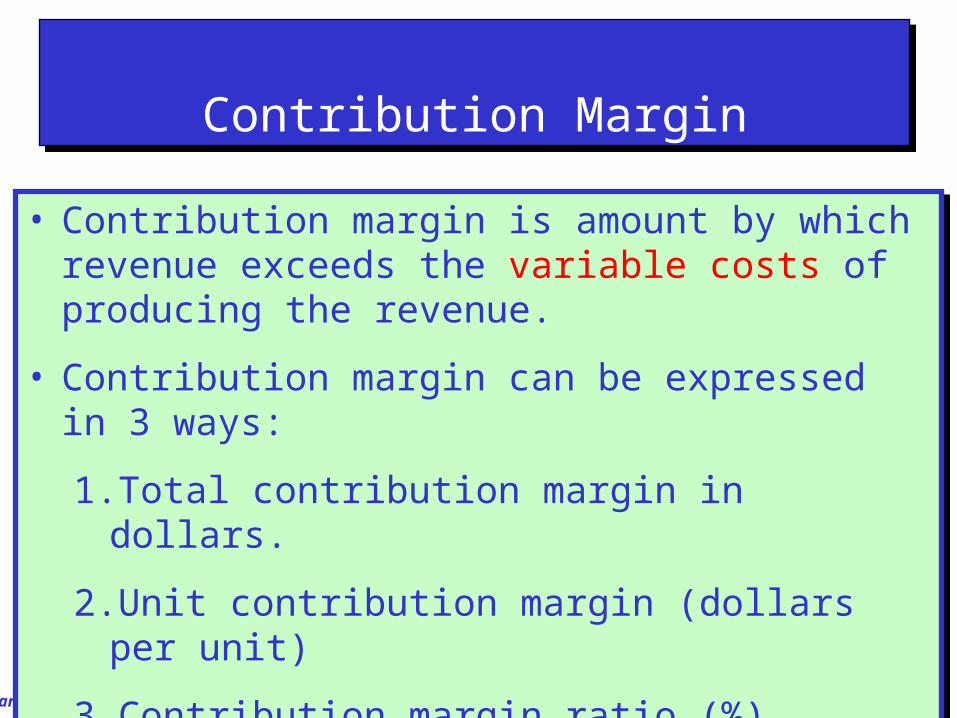
• Contribution margin is amount by which revenue exceeds the variable costs of producing the revenue.
• Contribution margin can be expressed in 3 ways:
1.Total contribution margin in dollars.
2.Unit contribution margin (dollars per unit)
3.Contribution margin ratio (%)
• Contribution margin is amount by which revenue exceeds the variable costs of producing the revenue.
• Contribution margin can be expressed in 3 ways:
1.Total contribution margin in dollars.
2.Unit contribution margin (dollars per unit)
3.Contribution margin ratio (%)
Contribution MarginContribution Margin

Larson, Wild, Chiapetta, Ropidah, Haslinda, Aryati, Liana © The McGraw-Hill Companies, Inc., 2007
Contribution Margin Per UnitContribution Margin Per Unit
• Selling price per unit less unit variable cost.
• Dollar from each unit of sales available to cover
fixed cost and income from operation.
• Useful when increase / decrease in sales volume
is measured in sales unit (quantity)Contribution Margin per Unit = Selling price per unit –
Variable cost per unit.
Contribution Margin per Unit = Selling price per unit –
Variable cost per unit.

Larson, Wild, Chiapetta, Ropidah, Haslinda, Aryati, Liana © The McGraw-Hill Companies, Inc., 2007
Contribution Margin RatioContribution Margin Ratio
• Contribution margin per unit divide by selling price per unit.• It measures the effect on income from operations of an increase or a decrease in sales volume.• Useful when sales volume is measured in sales dollars.
Contribution Margin = Unit Selling price – Variable cost per unit.
Ratio Selling price per unit
Contribution Margin = Unit Selling price – Variable cost per unit.
Ratio Selling price per unit
Larson, Wild, Chiapetta, Ropidah, Haslinda, Aryati, Liana © The McGraw-Hill Companies, Inc., 2007
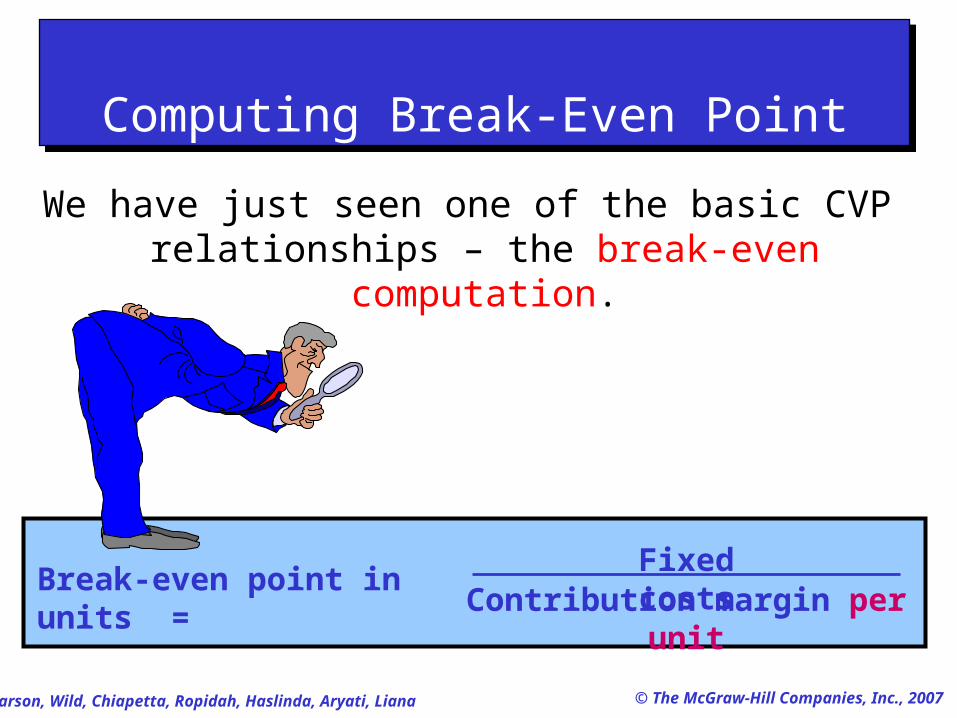
Computing Break-Even PointComputing Break-Even Point
We have just seen one of the basic CVP relationships – the break-even computation.
Break-even point in units = Fixed costs
Contribution margin per unit

Larson, Wild, Chiapetta, Ropidah, Haslinda, Aryati, Liana © The McGraw-Hill Companies, Inc., 2007
The break-even formula may also be expressed sales dollars.
Computing Break-Even PointComputing Break-Even Point
Break-even point in dollars = Fixed costs
Contribution margin ratio
Larson, Wild, Chiapetta, Ropidah, Haslinda, Aryati, Liana © The McGraw-Hill Companies, Inc., 2007
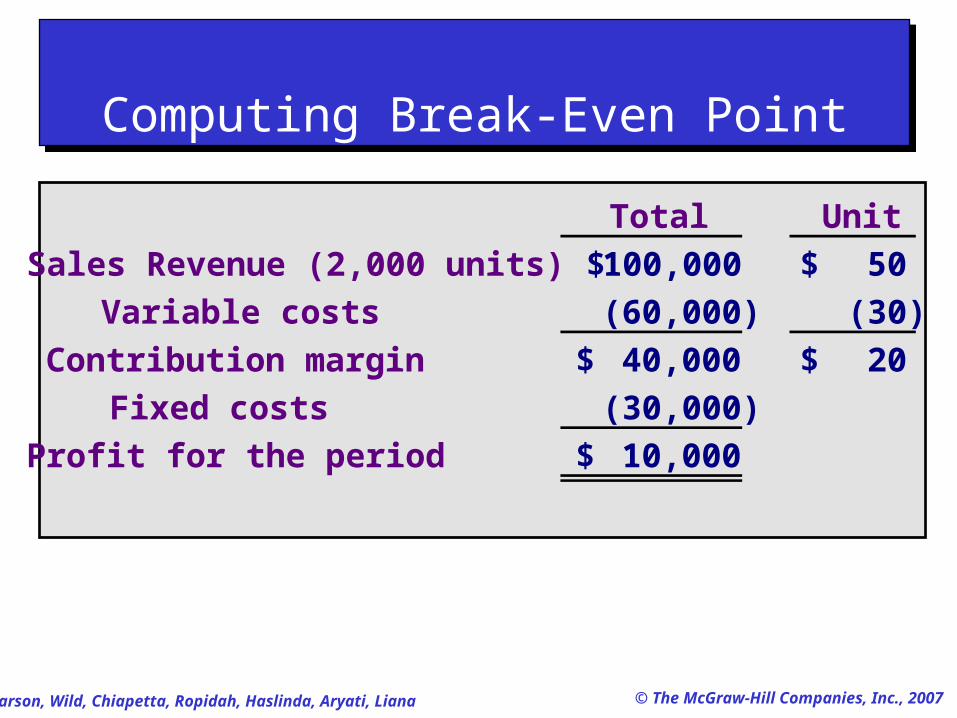
Computing Break-Even PointComputing Break-Even Point
Total Unit
Sales Revenue (2,000 units) 100,000$ 50$
Variable costs (60,000) (30)
Contribution margin 40,000$ 20$
Fixed costs (30,000)
Profit for the period 10,000$

Larson, Wild, Chiapetta, Ropidah, Haslinda, Aryati, Liana © The McGraw-Hill Companies, Inc., 2007
How much contribution margin must this company have to cover its fixed costs (break even)?
Answer: $30,000
Computing Break-Even PointComputing Break-Even Point
Total Unit
Sales Revenue (2,000 units) 100,000$ 50$
Variable costs (60,000) (30)
Contribution margin 40,000$ 20$
Fixed costs (30,000)
Profit for the period 10,000$

Larson, Wild, Chiapetta, Ropidah, Haslinda, Aryati, Liana © The McGraw-Hill Companies, Inc., 2007
How many units must this company sell to cover its fixed costs (break even)?
Answer: $30,000 ÷ $20 per unit = 1,500 units
Computing Break-Even PointComputing Break-Even Point
Total Unit
Sales Revenue (2,000 units) 100,000$ 50$
Variable costs (60,000) (30)
Contribution margin 40,000$ 20$
Fixed costs (30,000)
Profit for the period 10,000$

Larson, Wild, Chiapetta, Ropidah, Haslinda, Aryati, Liana © The McGraw-Hill Companies, Inc., 2007
ABC Co. sells product XYZ at $5.00 per unit. If fixed costs are $200,000 and variable costs are $3.00 per unit, how many units must be sold to
break even?
a. 100,000 units
b. 40,000 units
c. 200,000 units
d. 66,667 units
ABC Co. sells product XYZ at $5.00 per unit. If fixed costs are $200,000 and variable costs are $3.00 per unit, how many units must be sold to
break even?
a. 100,000 units
b. 40,000 units
c. 200,000 units
d. 66,667 units
Computing Break-Even Point – Illustration 1
Computing Break-Even Point – Illustration 1
Larson, Wild, Chiapetta, Ropidah, Haslinda, Aryati, Liana © The McGraw-Hill Companies, Inc., 2007
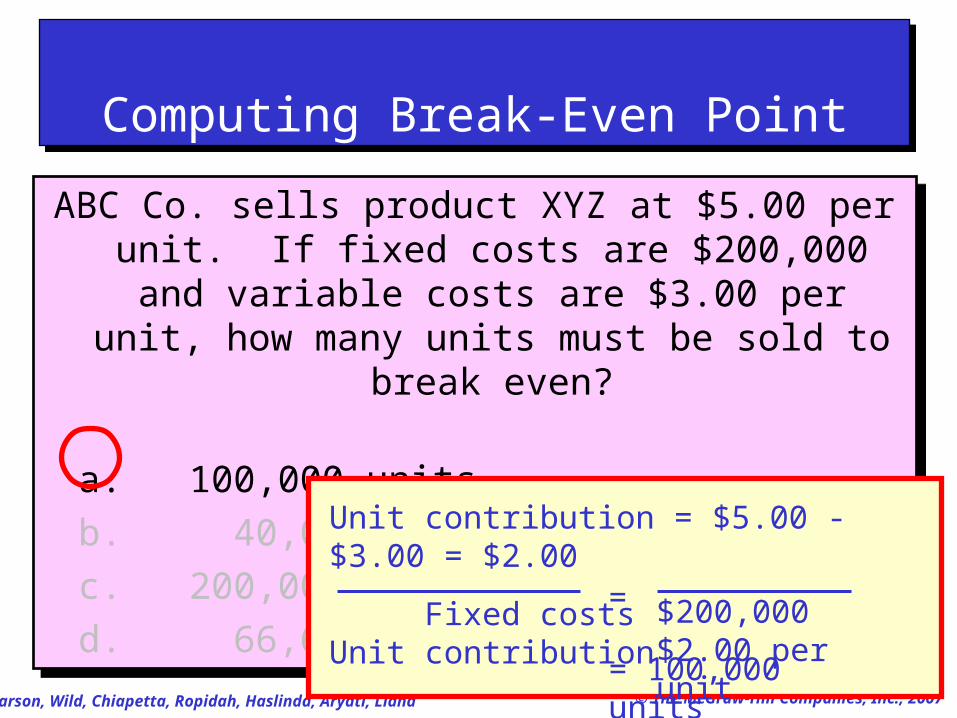
ABC Co. sells product XYZ at $5.00 per unit. If fixed costs are $200,000 and variable costs are $3.00 per unit, how many units must be sold to
break even?
a. 100,000 units
b. 40,000 units
c. 200,000 units
d. 66,667 units
ABC Co. sells product XYZ at $5.00 per unit. If fixed costs are $200,000 and variable costs are $3.00 per unit, how many units must be sold to
break even?
a. 100,000 units
b. 40,000 units
c. 200,000 units
d. 66,667 units
Unit contribution = $5.00 - $3.00 = $2.00
Fixed costsUnit contribution =
$200,000$2.00 per unit
= 100,000 units
Computing Break-Even PointComputing Break-Even Point

Larson, Wild, Chiapetta, Ropidah, Haslinda, Aryati, Liana © The McGraw-Hill Companies, Inc., 2007
Use the contribution margin ratio formula to determine the amount of sales revenue ABC must have to break even. All information remains unchanged: fixed costs are $200,000; Selling price per unit is $5.00; and unit
variable cost is $3.00.
a. $200,000
b. $300,000
c. $400,000
d. $500,000
Use the contribution margin ratio formula to determine the amount of sales revenue ABC must have to break even. All information remains unchanged: fixed costs are $200,000; Selling price per unit is $5.00; and unit
variable cost is $3.00.
a. $200,000
b. $300,000
c. $400,000
d. $500,000
Computing Break-Even Point – Illustration 2
Computing Break-Even Point – Illustration 2
Larson, Wild, Chiapetta, Ropidah, Haslinda, Aryati, Liana © The McGraw-Hill Companies, Inc., 2007
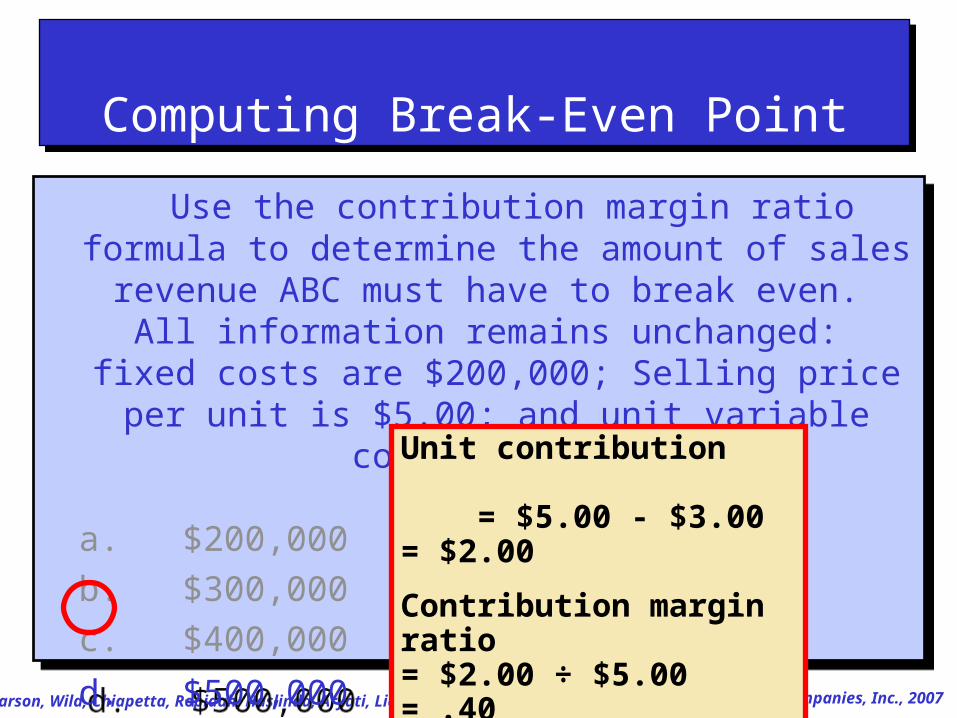
Use the contribution margin ratio formula to determine the amount of sales revenue ABC must have to break even. All information remains unchanged: fixed costs are $200,000; Selling price per unit is $5.00; and unit
variable cost is $3.00.
a. $200,000
b. $300,000
c. $400,000
d. $500,000
Use the contribution margin ratio formula to determine the amount of sales revenue ABC must have to break even. All information remains unchanged: fixed costs are $200,000; Selling price per unit is $5.00; and unit
variable cost is $3.00.
a. $200,000
b. $300,000
c. $400,000
d. $500,000
Unit contribution = $5.00 - $3.00 = $2.00
Contribution margin ratio = $2.00 ÷ $5.00 = .40
Break-even revenue = $200,000 ÷ .4 = $500,000
Computing Break-Even PointComputing Break-Even Point

Larson, Wild, Chiapetta, Ropidah, Haslinda, Aryati, Liana © The McGraw-Hill Companies, Inc., 2007
Volume in Units
Cos
ts a
nd R
even
uein
Dol
lars Total fixed costs
Total costs
Draw the total cost line with a slopeequal to the unit variable cost.
Plot total fixed costs on the vertical axis.
Preparing a CVP ChartPreparing a CVP Chart

Larson, Wild, Chiapetta, Ropidah, Haslinda, Aryati, Liana © The McGraw-Hill Companies, Inc., 2007
Sales
Volume in Units
Cos
ts a
nd R
even
ue (
$) Starting at the origin, draw the sales line
with a slope equal to the Selling price per unit.
Preparing a CVP ChartPreparing a CVP Chart
Break-even Point
Total costsTotal fixed costs
Larson, Wild, Chiapetta, Ropidah, Haslinda, Aryati, Liana © The McGraw-Hill Companies, Inc., 2007
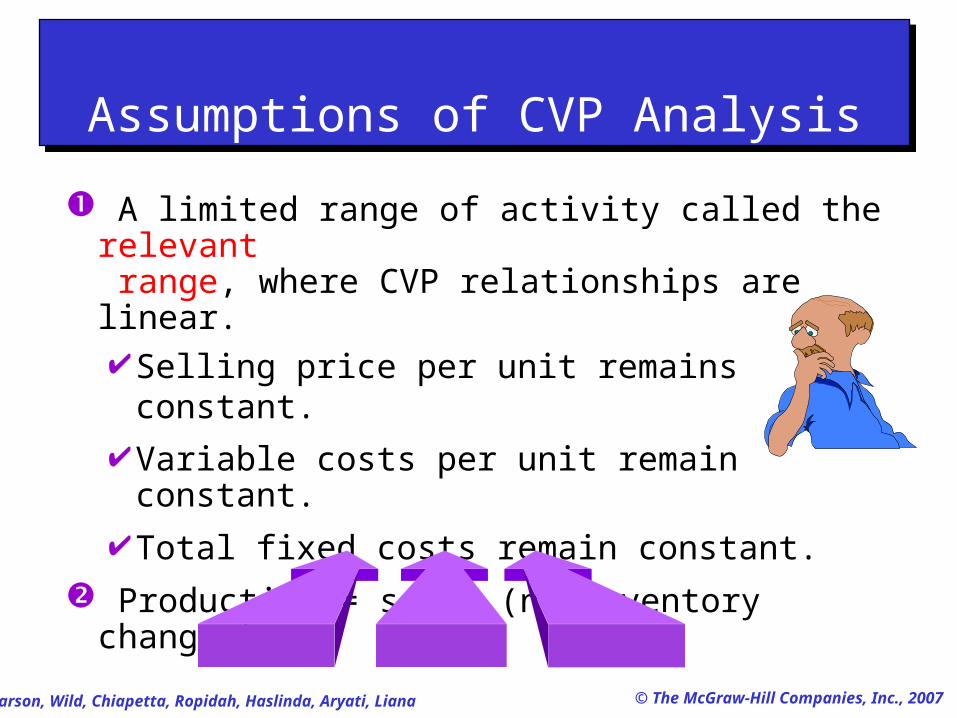
A limited range of activity called the relevant range, where CVP relationships are linear. Selling price per unit remains constant.
Variable costs per unit remain constant.
Total fixed costs remain constant.
Production = sales (no inventory changes).
Assumptions of CVP AnalysisAssumptions of CVP Analysis

Larson, Wild, Chiapetta, Ropidah, Haslinda, Aryati, Liana © The McGraw-Hill Companies, Inc., 2007
Profit (pretax) = Sales – Variable costs – Fixed costsProfit (pretax) = Sales – Variable costs – Fixed costs
Sensitivity AnalysisSensitivity Analysis
• Cost-Volume-Profit Analysis can be used to predict what can happen under alternatives strategies concerning sales volume, selling prices, variable costs or fixed costs.

Larson, Wild, Chiapetta, Ropidah, Haslinda, Aryati, Liana © The McGraw-Hill Companies, Inc., 2007
Rydell expects to sell 1,500 units at $100 each next month. Fixed costs are $24,000 per month and the unit variable cost is $70. What amount of income should Rydell expect?
Profit (pretax) = Sales – Variable costs – Fixed costs
= [1,500 units × $100] – [1,500 units × $70] – $24,000
= $21,000
Profit (pretax) = Sales – Variable costs – Fixed costs
= [1,500 units × $100] – [1,500 units × $70] – $24,000
= $21,000
Computing Profit from Expected Sales – Illustration 1
Computing Profit from Expected Sales – Illustration 1

Larson, Wild, Chiapetta, Ropidah, Haslinda, Aryati, Liana © The McGraw-Hill Companies, Inc., 2007
Unit sales = Fixed costs + Target profitContribution margin per unit
Dollar sales = Fixed costs + Target profit
Contribution margin ratio
Computing Sales for a Target ProfitComputing Sales for a Target Profit
Break-even formulas may be adjusted to show the sales volume needed to earn
any amount of income.

Larson, Wild, Chiapetta, Ropidah, Haslinda, Aryati, Liana © The McGraw-Hill Companies, Inc., 2007
ABC Co. sells product XYZ at $5.00 per unit. If fixed costs are $200,000 and variable costs are $3.00 per unit, how many units must be sold to
earn income of $40,000?
a. 100,000 units
b. 120,000 units
c. 80,000 units
d. 200,000 units
ABC Co. sells product XYZ at $5.00 per unit. If fixed costs are $200,000 and variable costs are $3.00 per unit, how many units must be sold to
earn income of $40,000?
a. 100,000 units
b. 120,000 units
c. 80,000 units
d. 200,000 units
Computing Sales for a Target Profit – Illustration2
Computing Sales for a Target Profit – Illustration2

Larson, Wild, Chiapetta, Ropidah, Haslinda, Aryati, Liana © The McGraw-Hill Companies, Inc., 2007
ABC Co. sells product XYZ at $5.00 per unit. If fixed costs are $200,000 and variable costs are $3.00 per unit, how many units must be sold to
earn income of $40,000?
a. 100,000 units
b. 120,000 units
c. 80,000 units
d. 200,000 units
ABC Co. sells product XYZ at $5.00 per unit. If fixed costs are $200,000 and variable costs are $3.00 per unit, how many units must be sold to
earn income of $40,000?
a. 100,000 units
b. 120,000 units
c. 80,000 units
d. 200,000 units = 120,000 units
Unit contribution = $5.00 - $3.00
= $2.00
Fixed costs + Target profit Unit contribution
$200,000 + $40,000 $2.00 per unit
Computing Sales for a Target ProfitComputing Sales for a Target Profit

Larson, Wild, Chiapetta, Ropidah, Haslinda, Aryati, Liana © The McGraw-Hill Companies, Inc., 2007
Dollar sales =
Fixed Target Incomecosts profit taxes
Contribution margin ratio
+ +
Computing Sales (Dollars) for aTarget Profit
Computing Sales (Dollars) for aTarget Profit
Target profit is income after income tax.
Larson, Wild, Chiapetta, Ropidah, Haslinda, Aryati, Liana © The McGraw-Hill Companies, Inc., 2007
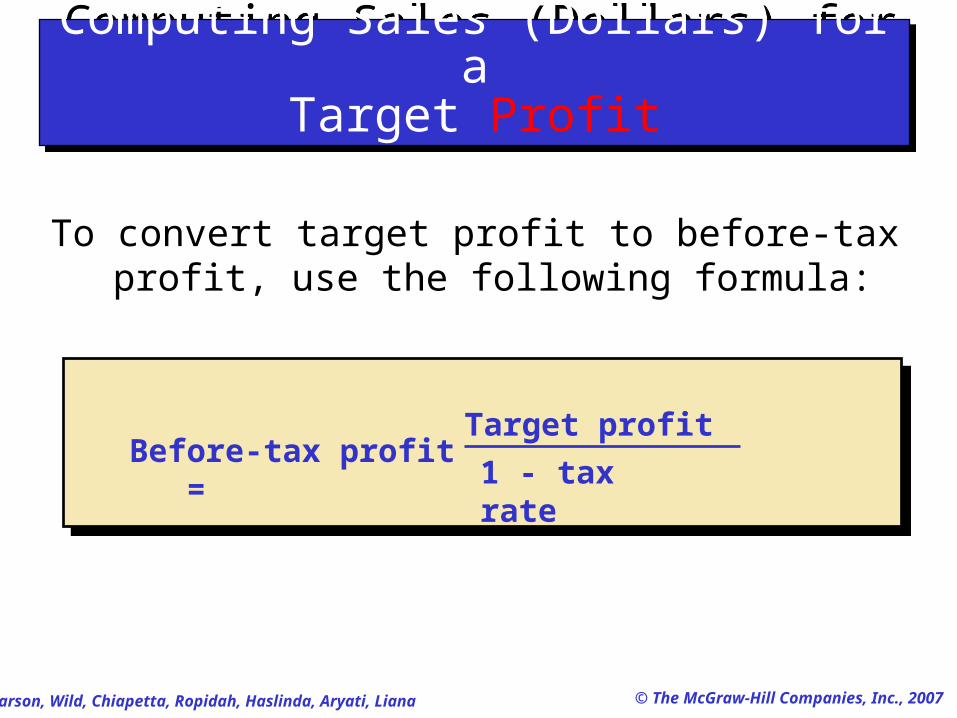
To convert target profit to before-tax profit, use the following formula:
Before-tax profit = Target profit
1 - tax rate
Computing Sales (Dollars) for aTarget Profit
Computing Sales (Dollars) for aTarget Profit

Larson, Wild, Chiapetta, Ropidah, Haslinda, Aryati, Liana © The McGraw-Hill Companies, Inc., 2007
Rydell has a monthly target profit of $18,000. The unit selling price is $100. Monthly fixed costs are $24,000, the unit variable cost is $70, and the tax rate is 25 percent.
What is Rydell’s before-tax profit andincome tax expense?
Computing Sales (Dollars) for aTarget Profit – Illustration 1
Computing Sales (Dollars) for aTarget Profit – Illustration 1

Larson, Wild, Chiapetta, Ropidah, Haslinda, Aryati, Liana © The McGraw-Hill Companies, Inc., 2007
Before-tax profit = Target profit
1 - tax rate
Before-tax profit = = $24,000$18,000
1 - .25
Income tax = .25 × $24,000 = $6,000
Rydell has a monthly target profit of $18,000. The unit selling price is $100. Monthly fixed costs are $24,000, the unit variable cost is $70, and the tax rate is 25 percent.
What is Rydell’s before-tax profit andincome tax expense?
Computing Sales (Dollars) for aTarget Profit
Computing Sales (Dollars) for aTarget Profit
Larson, Wild, Chiapetta, Ropidah, Haslinda, Aryati, Liana © The McGraw-Hill Companies, Inc., 2007
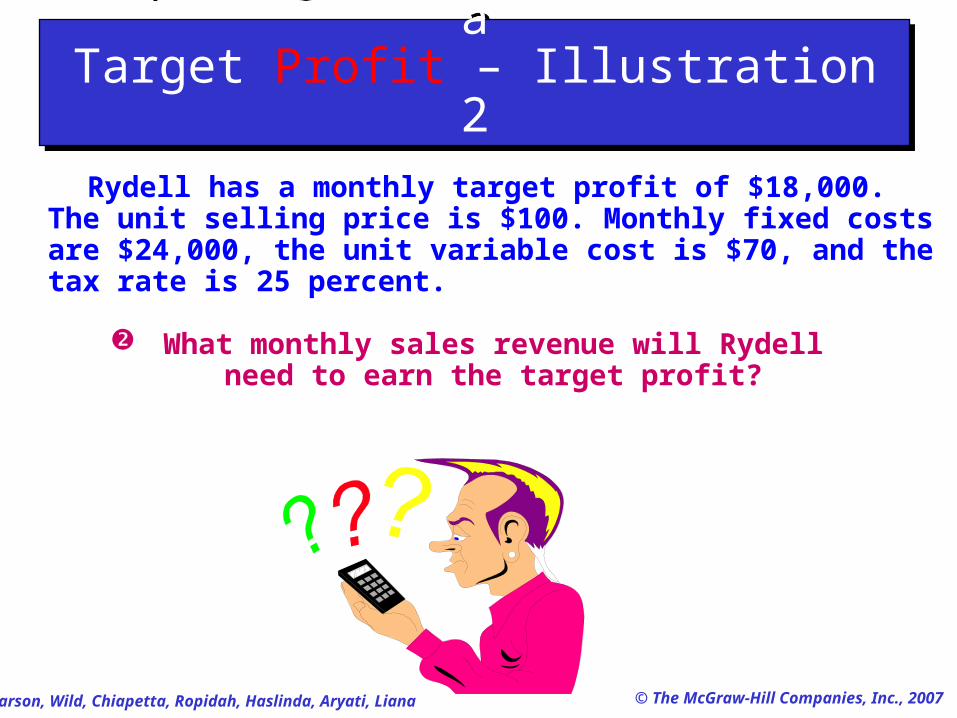
Rydell has a monthly target profit of $18,000. The unit selling price is $100. Monthly fixed costs are $24,000, the unit variable cost is $70, and the tax rate is 25 percent.
What monthly sales revenue will Rydellneed to earn the target profit?
Computing Sales (Dollars) for aTarget Profit – Illustration 2
Computing Sales (Dollars) for aTarget Profit – Illustration 2

Larson, Wild, Chiapetta, Ropidah, Haslinda, Aryati, Liana © The McGraw-Hill Companies, Inc., 2007
Dollar sales =
Fixed Target Incomecosts profit taxes
Contribution margin ratio
+ +
Dollar sales = = $160,000
$24,000 + $18,000 + $6,00030%
Rydell has a monthly target profit of $18,000. The unit selling price is $100. Monthly fixed costs are $24,000, the unit variable cost is $70, and the tax rate is 25 percent.
What monthly sales revenue will Rydellneed to earn the target profit?
Computing Sales (Dollars) for aTarget Profit
Computing Sales (Dollars) for aTarget Profit
Larson, Wild, Chiapetta, Ropidah, Haslinda, Aryati, Liana © The McGraw-Hill Companies, Inc., 2007
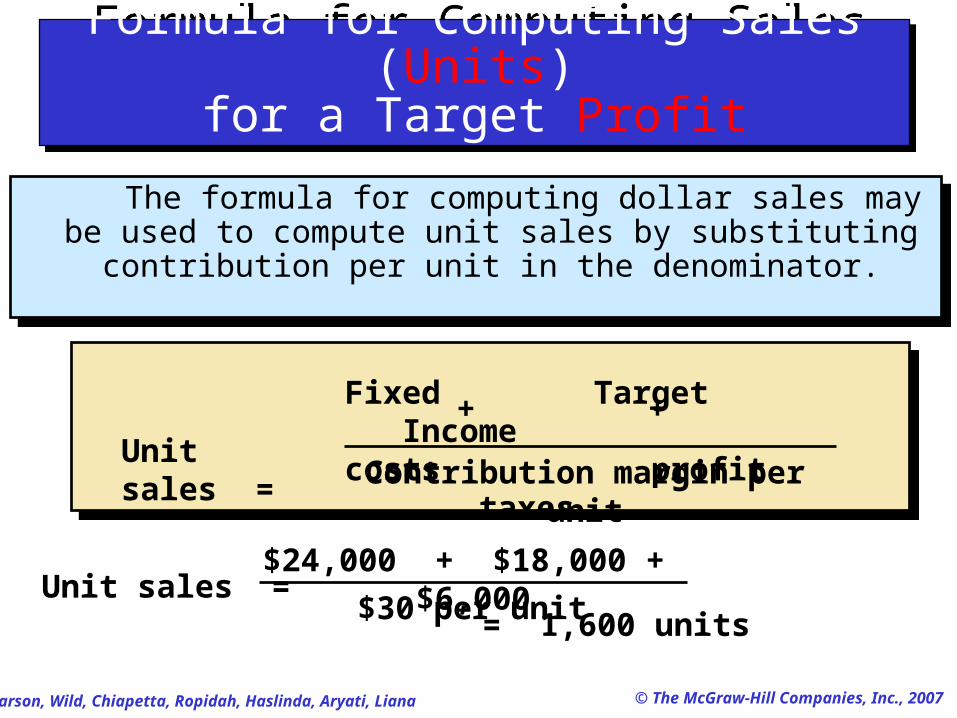
The formula for computing dollar sales may be used to compute unit sales by substituting contribution per
unit in the denominator.
The formula for computing dollar sales may be used to compute unit sales by substituting contribution per
unit in the denominator.
Contribution margin per unitUnit sales =
Fixed Target Incomecosts profit taxes
+ +
Unit sales = = 1,600 units$24,000 + $18,000 + $6,000
$30 per unit
Formula for Computing Sales (Units)for a Target Profit
Formula for Computing Sales (Units)for a Target Profit

Larson, Wild, Chiapetta, Ropidah, Haslinda, Aryati, Liana © The McGraw-Hill Companies, Inc., 2007
• Margin of safety is the amount by which sales may decline before reaching break-even sales.
• Margin of safety may be expressed as a percentage of expected sales.
Computing the Margin of SafetyComputing the Margin of Safety
Margin of safety Expected sales - Break-even sales percentage Expected sales
=

Larson, Wild, Chiapetta, Ropidah, Haslinda, Aryati, Liana © The McGraw-Hill Companies, Inc., 2007
Margin of safety Expected sales - Break-even sales percentage Expected sales
=
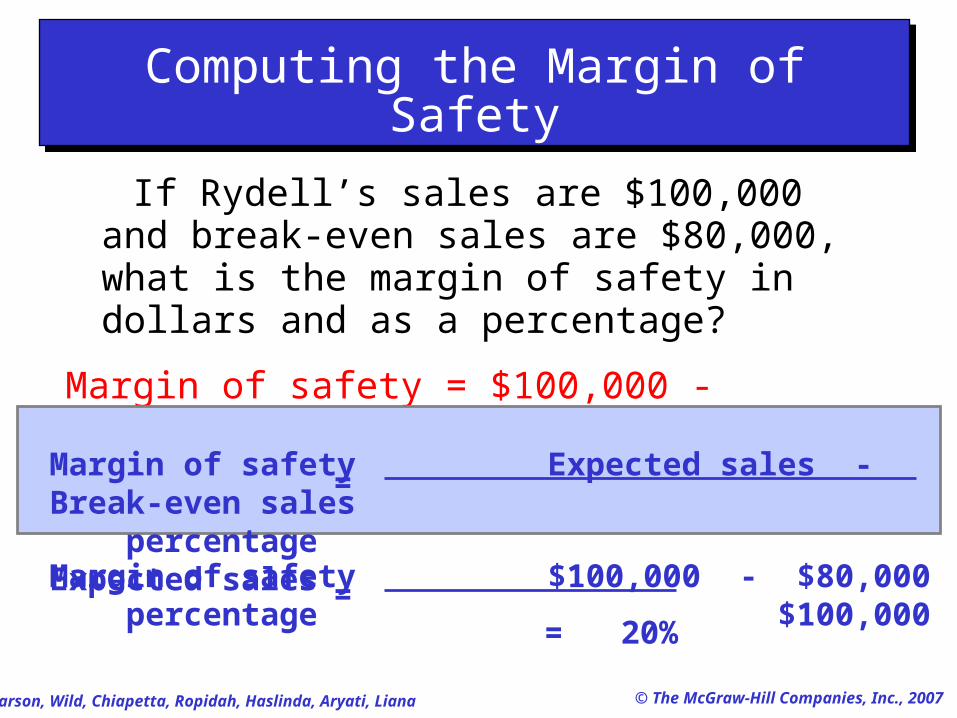
If Rydell’s sales are $100,000 and break-even sales are $80,000, what is the margin of safety
in dollars and as a percentage?
Computing the Margin of Safety – Illustration
Computing the Margin of Safety – Illustration
Larson, Wild, Chiapetta, Ropidah, Haslinda, Aryati, Liana © The McGraw-Hill Companies, Inc., 2007
If Rydell’s sales are $100,000 and break-even sales are $80,000, what is the margin of safety in dollars and as a percentage?
Margin of safety = $100,000 - $80,000 = $20,000
Margin of safety Expected sales - Break-even sales percentage Expected sales
=
Margin of safety $100,000 - $80,000 percentage $100,000
= = 20%
Computing the Margin of SafetyComputing the Margin of Safety
Larson, Wild, Chiapetta, Ropidah, Haslinda, Aryati, Liana © The McGraw-Hill Companies, Inc., 2007
The CVP formulas may be modified for use when a company sells more than one product. • The unit contribution margin is replaced with the
contribution margin for a composite unit.
• A composite unit is composed of specific numbers of each product in proportion to the product sales mix.
• Sales mix is the ratio of the volumes of the various products.
Computing MultiproductBreak-Even Point
Computing MultiproductBreak-Even Point

Larson, Wild, Chiapetta, Ropidah, Haslinda, Aryati, Liana © The McGraw-Hill Companies, Inc., 2007
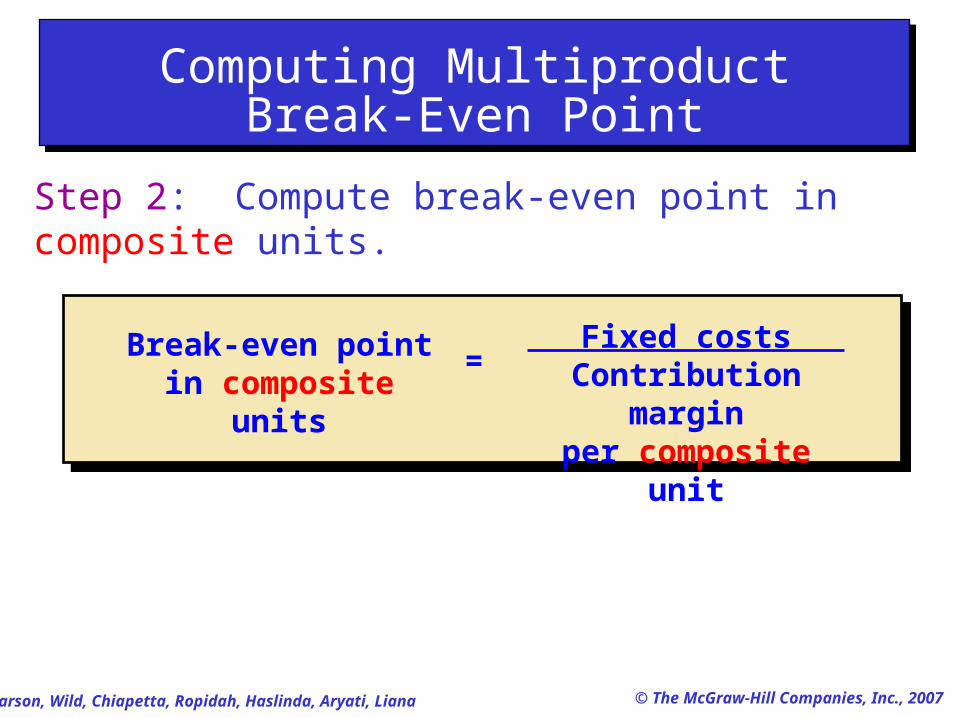
The resulting break-even formula for composite unit sales is:
Break-even pointin composite units
Fixed costsContribution marginper composite unit
=
Consider the following example:
Computing MultiproductBreak-Even Point
Computing MultiproductBreak-Even Point
Larson, Wild, Chiapetta, Ropidah, Haslinda, Aryati, Liana © The McGraw-Hill Companies, Inc., 2007
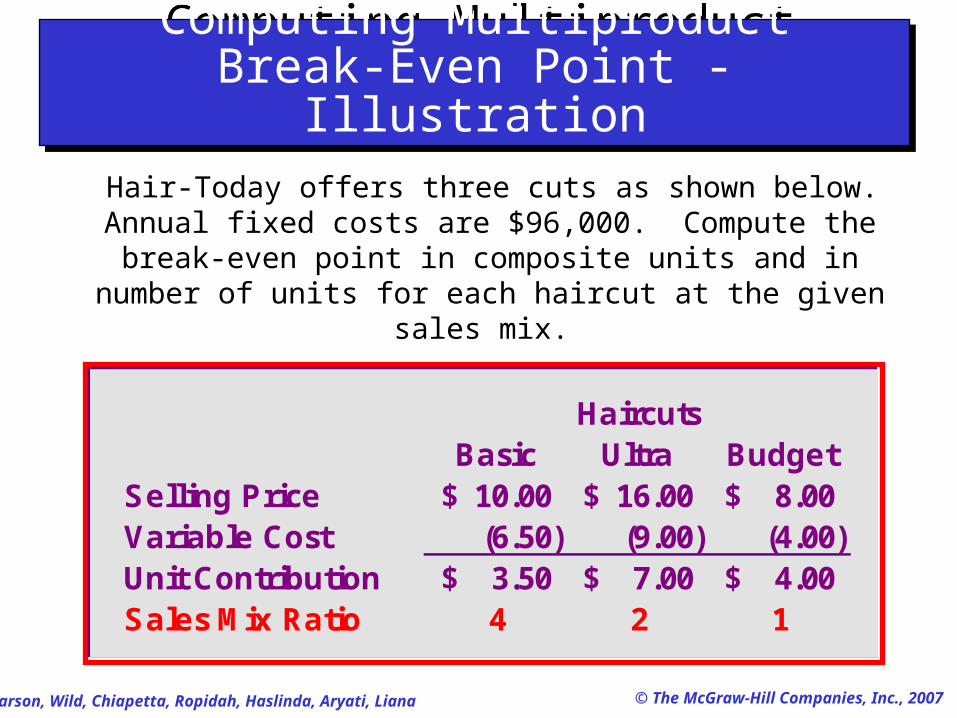
Hair-Today offers three cuts as shown below. Annual fixed costs are $96,000. Compute the break-even point in composite units and in number of units for
each haircut at the given sales mix.
Haircuts Basic Ultra Budget
Selling Price 10.00$ 16.00$ 8.00$ Variable Cost (6.50) (9.00) (4.00) Unit Contribution 3.50$ 7.00$ 4.00$ Sales Mix Ratio 4 2 1
Computing MultiproductBreak-Even Point - Illustration
Computing MultiproductBreak-Even Point - Illustration
Larson, Wild, Chiapetta, Ropidah, Haslinda, Aryati, Liana © The McGraw-Hill Companies, Inc., 2007
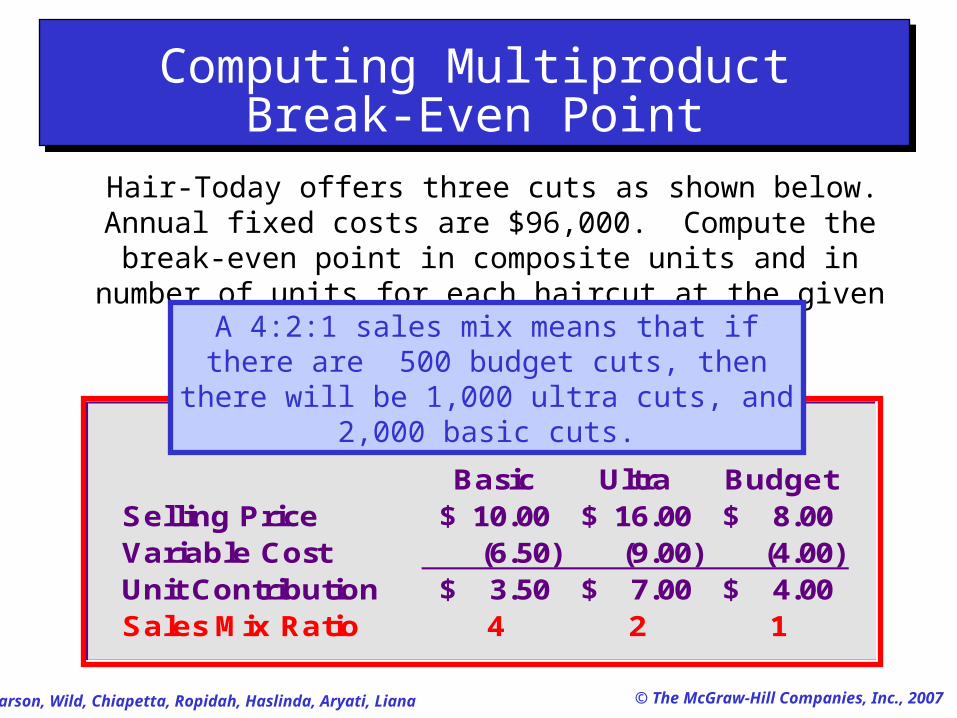
Hair-Today offers three cuts as shown below. Annual fixed costs are $96,000. Compute the break-even point in composite units and in number of units for
each haircut at the given sales mix.
Haircuts Basic Ultra Budget
Selling Price 10.00$ 16.00$ 8.00$ Variable Cost (6.50) (9.00) (4.00) Unit Contribution 3.50$ 7.00$ 4.00$ Sales Mix Ratio 4 2 1
A 4:2:1 sales mix means that if there are 500 budget cuts, then there will be 1,000 ultra cuts,
and 2,000 basic cuts.
Computing MultiproductBreak-Even Point
Computing MultiproductBreak-Even Point

Larson, Wild, Chiapetta, Ropidah, Haslinda, Aryati, Liana © The McGraw-Hill Companies, Inc., 2007
HaircutsBasic Ultra Budget
Selling Price $10.00 $16.00 $8.00Variable Cost (6.50) (9.00) (4.00) Unit Contribution $3.50 $7.00 $4.00Sales Mix Ratio × 4 × 2 × 1
14.00$ 14.00$ 4.00$
Step 1: Compute contribution margin per composite unit.
Computing MultiproductBreak-Even Point
Computing MultiproductBreak-Even Point

Larson, Wild, Chiapetta, Ropidah, Haslinda, Aryati, Liana © The McGraw-Hill Companies, Inc., 2007
HaircutsBasic Ultra Budget
Selling Price $10.00 $16.00 $8.00Variable Cost (6.50) (9.00) (4.00) Unit Contribution $3.50 $7.00 $4.00Sales Mix Ratio × 4 × 2 × 1Weighted Contribution 14.00$ + 14.00$ + 4.00$ = 32.00$
Contribution margin per composite unit
Step 1: Compute contribution margin per composite unit.
Computing MultiproductBreak-Even Point
Computing MultiproductBreak-Even Point
Larson, Wild, Chiapetta, Ropidah, Haslinda, Aryati, Liana © The McGraw-Hill Companies, Inc., 2007
Break-even pointin composite units
Fixed costsContribution marginper composite unit
=
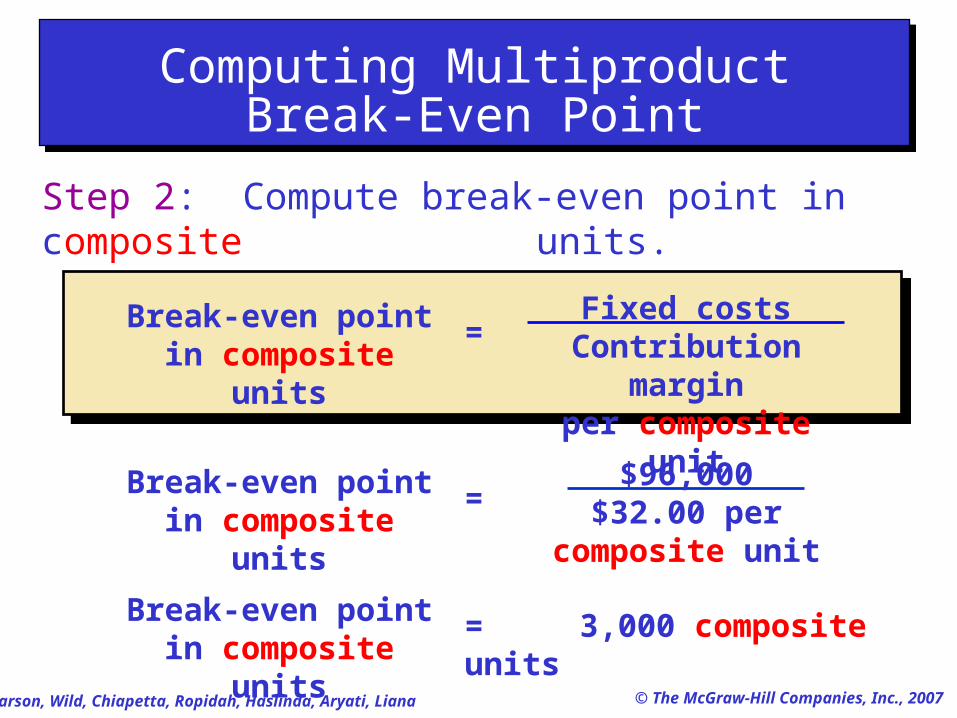
Step 2: Compute break-even point in composite units.
Computing MultiproductBreak-Even Point
Computing MultiproductBreak-Even Point
Larson, Wild, Chiapetta, Ropidah, Haslinda, Aryati, Liana © The McGraw-Hill Companies, Inc., 2007
Break-even pointin composite units
Fixed costsContribution marginper composite unit
=
Step 2: Compute break-even point in composite units.
Break-even pointin composite units
$96,000$32.00 per
composite unit
=
Break-even pointin composite units
= 3,000 composite units
Computing MultiproductBreak-Even Point
Computing MultiproductBreak-Even Point

Larson, Wild, Chiapetta, Ropidah, Haslinda, Aryati, Liana © The McGraw-Hill Companies, Inc., 2007
Sales CompositeProduct Mix Cuts Haircuts
Basic 4 × 3,000 = 12,000Ultra 2 × 3,000 = 6,000
Budget 1 × 3,000 = 3,000
Step 3: Determine the number of each haircut that must be sold to break even.
Computing MultiproductBreak-Even Point
Computing MultiproductBreak-Even Point
Larson, Wild, Chiapetta, Ropidah, Haslinda, Aryati, Liana © The McGraw-Hill Companies, Inc., 2007
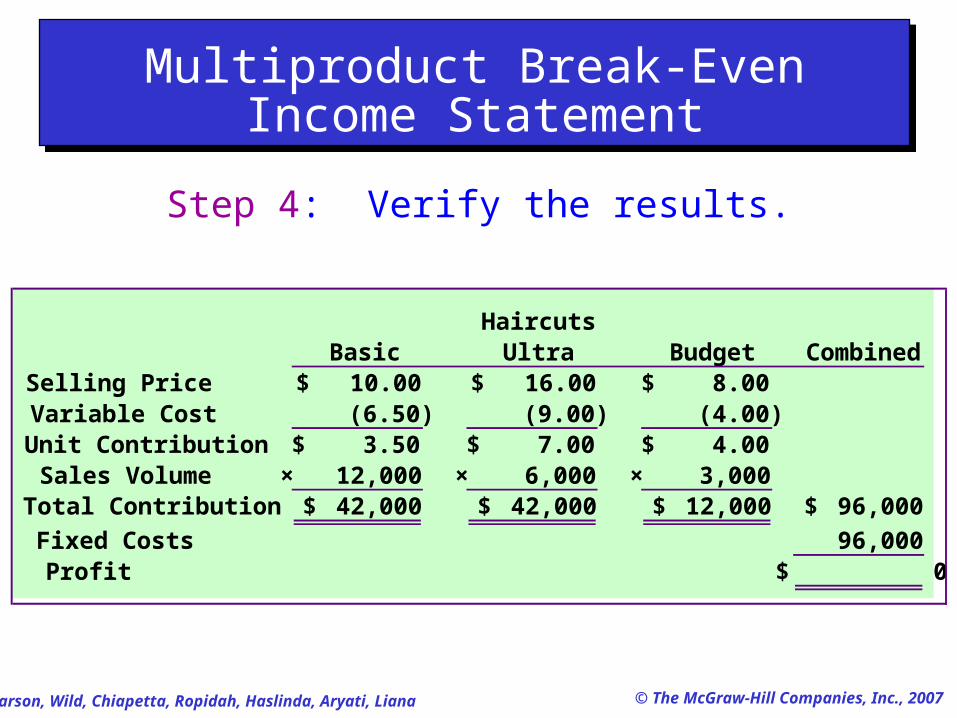
Step 4: Verify the results.
Multiproduct Break-EvenIncome Statement
Multiproduct Break-EvenIncome Statement
HaircutsBasic Ultra Budget Combined
Selling Price 10.00$ 16.00$ 8.00$ Variable Cost (6.50) (9.00) (4.00) Unit Contribution 3.50$ 7.00$ 4.00$ Sales Volume × 12,000 × 6,000 × 3,000 Total Contribution 42,000$ 42,000$ 12,000$ 96,000$
Fixed Costs 96,000 Profit $ 0
Larson, Wild, Chiapetta, Ropidah, Haslinda, Aryati, Liana © The McGraw-Hill Companies, Inc., 2007
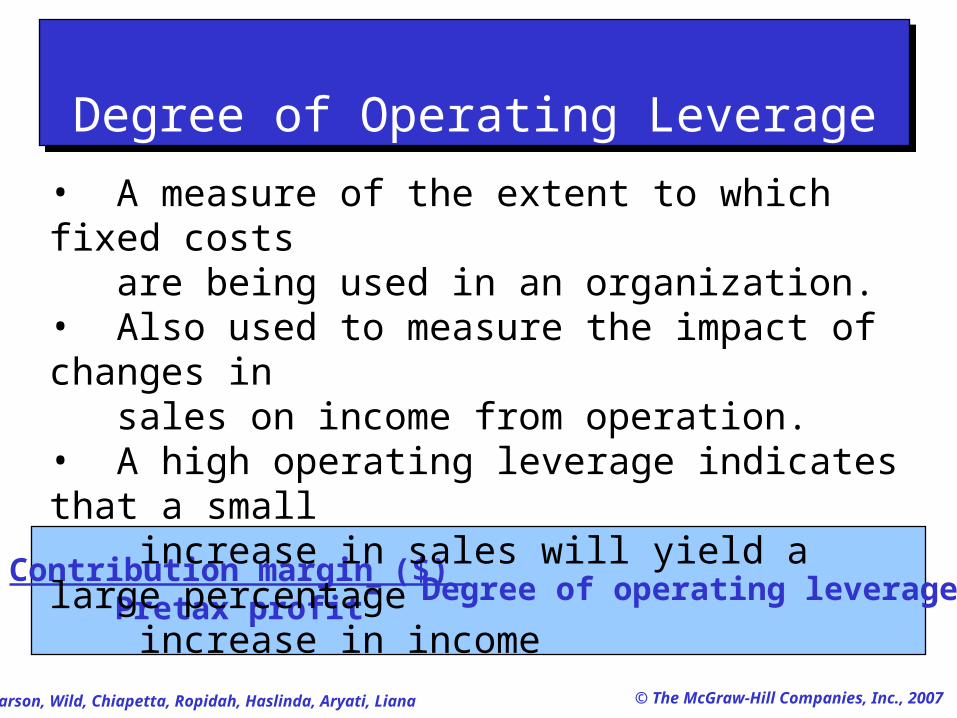
Contribution margin ($) Pretax profit
= Degree of operating leverage
Degree of Operating LeverageDegree of Operating Leverage
• A measure of the extent to which fixed costs are being used in an organization.• Also used to measure the impact of changes in sales on income from operation.• A high operating leverage indicates that a small increase in sales will yield a large percentage increase in income

Larson, Wild, Chiapetta, Ropidah, Haslinda, Aryati, Liana © The McGraw-Hill Companies, Inc., 2007
$48,000 $24,000
= 2.0
Contribution margin Profit
= Degree of operating leverage
If Rydell increases sales by 10percent, what will the percentage
increase in income be?
Operating Leverage - IllustrationOperating Leverage - Illustration
Rydell Company
Sales (1,600 units) 160,000$ Variable expenses (112,000)
Contribution margin 48,000 Fixed expenses (24,000)
Profit for the period 24,000$

Larson, Wild, Chiapetta, Ropidah, Haslinda, Aryati, Liana © The McGraw-Hill Companies, Inc., 2007
Percent increase in sales 10%
Degree of operating leverage × 2
Percent increase in income 20%
Operating LeverageOperating Leverage
Rydell Company
Sales (1,600 units) 160,000$ Variable expenses (112,000)
Contribution margin 48,000 Fixed expenses (24,000)
Profit for the period 24,000$

Larson, Wild, Chiapetta, Ropidah, Haslinda, Aryati, Liana © The McGraw-Hill Companies, Inc., 2007
End of Chapter 14End of Chapter 14