Chapter 14-Bridge Hydraulics
102
SOUTH DAKOTA DRAINAGE MANUAL October 2011 Chapter 14 BRIDGE HYDRAULICS
Transcript of Chapter 14-Bridge Hydraulics
SOUTH DAKOTA DRAINAGE MANUAL
October 2011
Chapter 14
BRIDGE HYDRAULICS

South Dakota Drainage Manual Bridge Hydraulics
14-i
Table of Contents
Section Page 14.1 INTRODUCTION ..........................................................................................14-1
14.1.1 Chapter Objectives ..........................................................................14-1 14.1.2 Bridge Definition ..............................................................................14-1 14.1.3 Hydraulic Design (Culvert or Bridge) ...............................................14-1 14.1.4 Design Goals ...................................................................................14-2 14.1.5 Data Collection ................................................................................14-2
14.2 HYDRAULIC PERFORMANCE CRITERIA ..................................................14-3
14.2.1 General Considerations ..................................................................14-3 14.2.2 Flood Frequencies ..........................................................................14-3
14.2.2.1 Design Flood (State Highways) .......................................14-3 14.2.2.2 Design Flood (Non-State Highways) ...............................14-3 14.2.2.3 NFIP-Mapped Floodplains ..............................................14-3 14.2.2.4 Review Frequency ..........................................................14-4 14.2.2.5 Risk Assessment/Analysis ..............................................14-4
14.2.3 Freeboard .......................................................................................14-6 14.2.4 Backwater .......................................................................................14-10
14.3 BRIDGE LOCATION ....................................................................................14-11
14.3.1 General Considerations ..................................................................14-11 14.3.2 Location Considerations ..................................................................14-11 14.3.3 Auxiliary/Relief Openings ................................................................14-11
14.4 STREAM STABILITY ....................................................................................14-13
14.4.1 Objective .........................................................................................14-13 14.4.2 Levels of Assessment .....................................................................14-13
14.4.2.1 Level 1 ............................................................................14-13 14.4.2.2 Level 2 ............................................................................14-13 14.4.2.3 Level 3 ............................................................................14-16
14.4.3 Factors that Affect Stream Stability .................................................14-16
South Dakota Drainage Manual Bridge Hydraulics
14-ii
Table of Contents (Continued)
Section Page 14.4.3.1 Geomorphic Factors ........................................................14-16 14.4.3.2 Hydraulic Factors ............................................................14-16
14.4.4 Stream Response to Change ..........................................................14-17 14.4.5 Meander Migration ..........................................................................14-19 14.4.6 Countermeasures for Stream Instability ..........................................14-19
14.4.6.1 Channel Braiding ............................................................14-20 14.4.6.2 Degradation ....................................................................14-20 14.4.6.3 Aggradation .....................................................................14-20
14.5 HYDRAULIC ANALYSIS OF STREAM CHANNEL CROSSINGS ................14-22
14.5.1 Documentation ................................................................................14-22
14.5.1.1 New/Replaced Bridges ....................................................14-22 14.5.1.2 Existing Bridges ..............................................................14-23
14.5.2 Hydraulic Nature of Existing Stream Channel .................................14-24
14.5.2.1 Typical Assumptions for Natural Channels .....................14-24 14.5.2.2 Cross Sections ................................................................14-24 14.5.2.3 Manning’s n Value Selection ...........................................14-25 14.5.2.4 Calibration .......................................................................14-25
14.5.3 Bridge Waterway Opening Analysis ................................................14-27
14.5.3.1 General ...........................................................................14-27 14.5.3.2 Computational Methodologies .........................................14-27 14.5.3.3 Waterway Enlargement ...................................................14-29
14.6 BRIDGE SCOUR ..........................................................................................14-30
14.6.1 Introduction .....................................................................................14-30 14.6.2 General Considerations ..................................................................14-30 14.6.3 Flood Magnitudes ............................................................................14-31 14.6.4 Scour Types ....................................................................................14-31
South Dakota Drainage Manual Bridge Hydraulics
14-iii
Table of Contents (Continued)
Section Page 14.6.4.1 Long-Term Profile Changes ............................................14-31 14.6.4.2 Contraction ......................................................................14-32 14.6.4.3 Local Scour .....................................................................14-32
14.6.5 Natural Armoring .............................................................................14-32 14.6.6 Scour-Resistant Materials ...............................................................14-33 14.6.7 Cumulative Scour Analysis..............................................................14-33 14.6.8 Pressure Flow Scour .......................................................................14-33 14.6.9 Scour Countermeasures .................................................................14-34 14.6.10 Case Studies ...................................................................................14-36
14.7 DECK DRAINAGE ........................................................................................14-37
14.7.1 Importance of Bridge Deck Drainage ..............................................14-37 14.7.2 SDDOT Responsibilities ..................................................................14-37
14.7.2.1 Design of Deck Drainage System ...................................14-37 14.7.2.2 Bridge End Drainage .......................................................14-38
14.7.3 Design Considerations (Open Drainage) ........................................14-38
14.7.3.1 Type of Drainage System ................................................14-38 14.7.3.2 Deck Slope ......................................................................14-38 14.7.3.3 Sag Vertical Curves ........................................................14-38 14.7.3.4 Downspouts ....................................................................14-38 14.7.3.5 Maximum Length of Bridge Without Inlets .......................14-39 14.7.3.6 Location of Inlets .............................................................14-40 14.7.3.7 Structural Considerations ................................................14-42 14.7.3.8 Maintenance Considerations ...........................................14-42 14.7.3.9 Bridge End Drainage .......................................................14-43
14.8 REFERENCES .............................................................................................14-44 APPENDIX 14.A CASE STUDY FOR ESTIMATING BRIDGE SCOUR .............14-46 APPENDIX 14.B CASE STUDY FOR REVIEWING BRIDGE SCOUR ...............14-65 APPENDIX 14.C HYDRAULICS FOR TEMPORARY FACILITIES .....................14-74 APPENDIX 14.D ROCK RIPRAP AT BRIDGE ABUTMENTS ............................14-81
South Dakota Drainage Manual Bridge Hydraulics
14-iv
List of Figures
Figure Page Figure 14.2-A PRELIMINARY RISK ASSESSMENT FORM (Reference (1)) ...... 14-5 Figure 14.2-B DESIGN RISK ASSESSMENT FORM (Reference (1)) ................ 14-7 Figure 14.3-A ECCENTRIC STREAM CROSSINGS ........................................ 14-12 Figure 14.4-A GEOMORPHIC FACTORS THAT AFFECT STREAM
STABILITY (Section references are to HEC 20, Reference (6)) . 14-14 Figure 14.4-B HYDRAULIC, LOCATION AND DESIGN FACTORS THAT
AFFECT STREAM STABILITY (Section references are to HEC 20, Reference (6)) .............................................................. 14-15
Figure 14.4-C SINUOSITY VERSUS SLOPE WITH CONSTANT DISCHARGE .............................................................................. 14-18
Figure 14.4-D SLOPE-DISCHARGE FOR BRAIDING OR MEANDERING BED STREAMS (Reference(6)) .................................................. 14-19
Figure 14.5-A HYPOTHETICAL CROSS SECTION SHOWING REACHES,
SEGMENTS AND SUBSECTIONS USED IN ASSIGNING n VALUES ................................................................................... 14-26
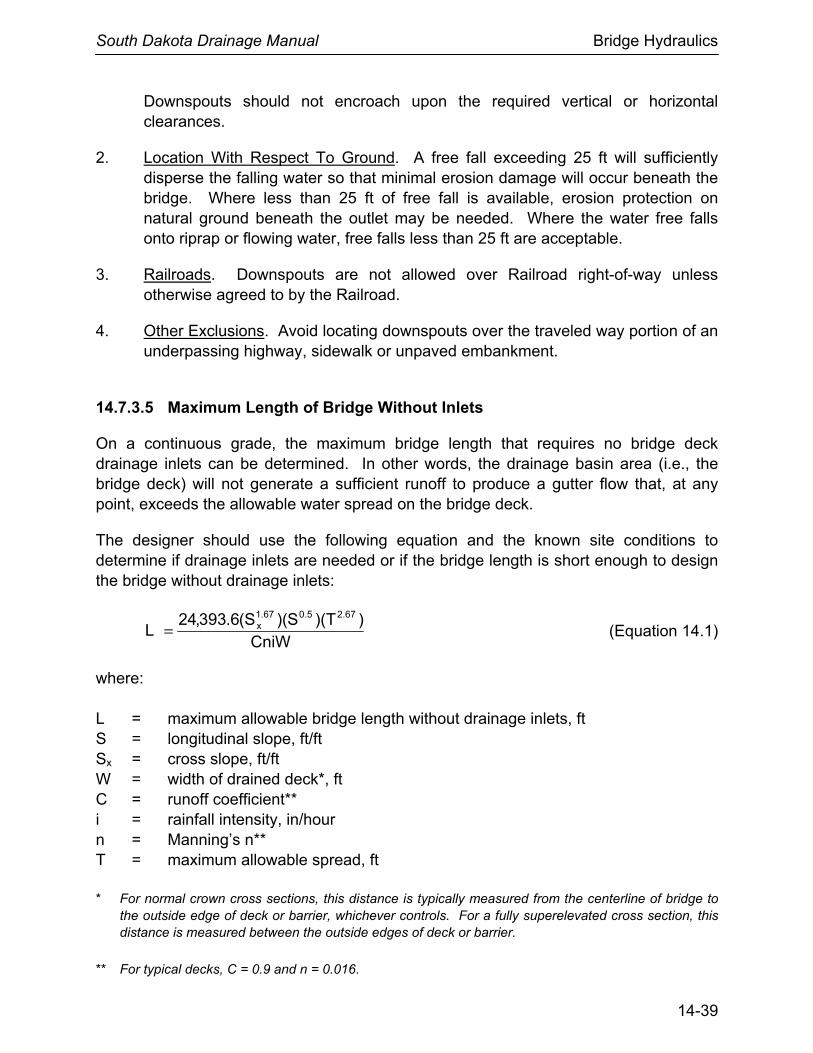
Figure 14.6-A SCOUR PROTECTION METHODS (after Reference (13)) ........ 14-34 Figure 14.6-B SUITABLE RIVER ENVIRONMENT (after Reference (13)) ........ 14-35 Figure 14.7-A EFFICIENCY CURVES FOR CIRCULAR SCUPPERS
(Reference (18)) ......................................................................... 14-41 Figure 14.7-B INTERSECTION CAPACITY (4-in Scupper Inlets on
Continuous Grade) ..................................................................... 14-41 Figure 14.7-C INTERSECTION CAPACITY (4-in Scupper Inlet in
Sump Locations) ......................................................................... 14-42
South Dakota Drainage Manual Bridge Hydraulics
14-1
Chapter 14 BRIDGE HYDRAULICS
14.1 INTRODUCTION
A stream is a dynamic natural system that, as a result of the encroachment caused by elements of a stream crossing system, will respond in a manner that may challenge even an experienced hydraulic engineer. The complexities of the stream response to encroachment require that hydraulic engineers be involved from the outset in the choice of location and design considerations. Hydraulic engineers should also be involved in the solution of stream stability problems at existing structures.
Chapter 14 is based on the AASHTO Drainage Manual, Chapter 10 (Reference (1)), which provides recommended guidelines and procedures. To these guidelines, SDDOT specific criteria and practices have been added. Additional guidance can be found in the AASHTO Highway Drainage Guidelines, Chapter 7 (Reference (2)).
14.1.1 Chapter Objectives
This Chapter provides design guidance for stream crossing systems for the following:
• location, • stream stability, • hydraulic performance, • hydraulic analysis requirements, • scour, and • deck drainage. 14.1.2 Bridge Definition
From a hydraulic perspective, a bridge is defined as:
• A structure built over a depression or obstacle for passageway.
• Part of a stream crossing system that includes the approach roadway across the floodplain and any openings.
14.1.3 Hydraulic Design (Culvert or Bridge)
Any structure designed hydraulically to operate in free surface flow at the design event is treated as a bridge in this Chapter, regardless of actual length. A structure designed hydraulically as a culvert is treated in Chapter 10 “Culverts” regardless of its span

South Dakota Drainage Manual Bridge Hydraulics
14-2
length. For example, a bridge-size box culvert should be reviewed using the procedures in Chapter 10 if the deck will be submerged at the design discharge and if insurable buildings may be affected. If the Chapter 10 procedures produce a higher headwater, it should be used. In rural locations, the HEC-RAS software, which will accommodate bridge submergence, can be used.
14.1.4 Design Goals
Proper hydraulic analysis and design of bridges is as vital as the structural design. Stream crossing systems should be designed for:
• minimum cost subject to design criteria; • desired level of hydraulic performance; • mitigation of impacts on the stream environment; • safe movement of desired traffic volume for an acceptable level of service; and • accomplishment of social, economic and environmental goals.
14.1.5 Data Collection
Data collection is vital and requires the gathering of all necessary information for hydraulic analysis. This should include such information as topography and other physical features, land use and culture, any existing flood studies of the stream, historical flood data, basin characteristics, precipitation data, geotechnical data, historical high-water marks, existing structures, channel characteristics and environmental data. A site plan showing the bridge location should be developed on which much of the data can be presented. Refer to Chapter 5 “Data Collection” for additional data collection information.
South Dakota Drainage Manual Bridge Hydraulics
14-3
14.2 HYDRAULIC PERFORMANCE CRITERIA
This Section presents SDDOT design criteria that establish the basic hydraulic performance for the bridge. Sections 14.2.1 through 14.2.4 apply to bridge waterway openings on State highways; Section 14.2.2.2 applies to those on non-State highways. Appendix 14.C “Hydraulics for Temporary Facilities” can be used to determine a design frequency that is appropriate for the risk at the site.
14.2.1 General Considerations
The conveyance of the proposed stream crossing should be calculated to determine the flow distribution and to establish the location of the bridge opening(s). The proposed facility should not cause any significant change in the existing flow distribution.
14.2.2 Flood Frequencies
14.2.2.1 Design Flood (State Highways)
Figure 7.6-A presents SDDOT criteria for the design flood (or return period) for bridge waterway openings. The Figure presents separate criteria for the design headwater and hydraulic scour based on the highway classification. The notes to the table and accompanying text provide critical information for the selection of the design flood at bridge waterway openings.
14.2.2.2 Design Flood (Non-State Highways)
Hydraulic design will normally be for the 10-year flood on local rural road bridge replacement projects with an overflow section in the approach grade. Bridge replacement projects on non-State highway rural collector roads and urban collector streets will normally be designed to pass the 25-year flood. If the ADT is less than 100, use the 10-year flood. Low-water crossing design guidance is found in the United States Forest Service publication (Reference (3)).
14.2.2.3 NFIP-Mapped Floodplains
For bridge waterway openings on NFIP-mapped floodplains, see the following:
• Section 7.6.2.2 “Design Frequency and Headwater for NFIP-Mapped Floodplains,” and
• Section 17.3 “National Flood Insurance Program (NFIP).”
South Dakota Drainage Manual Bridge Hydraulics
14-4
14.2.2.4 Review Frequency
See Section 7.6.2.3 “Review Frequency and Headwater.”
14.2.2.5 Risk Assessment/Analysis
FHWA has published the following clarification of 23 CFR 659 Subpart A: Design Standards for Flood Plain Encroachments (23 CFR 650.115(a)(1)):
“The intent of the statement, "as appropriate, a risk analysis or assessment," in Section 23 CFR 650.115(a)(1) is to allow judgment as to the detail of design studies. Where site conditions or structural requirements substantially limit practicable design alternatives, the conventional hydraulic analysis coupled with a risk assessment should meet the requirements of the design standards. Where site conditions permit a range of design alternatives and flood losses are anticipated, an abbreviated or partial risk analysis may be appropriate. We would anticipate that use of the full scale detailed economic (risk) analysis as described in Hydraulic Engineering Circular Number 17 would not be necessary for normal stream crossings, but would apply to unusual, complex or high cost encroachments involving flood losses.”
SDDOT practice, which is outlined below, is to apply risk assessment if needed. If a site-specific risk assessment indicates that a risk analysis may be useful, it will be considered.
14.2.2.5.1 No Risk Assessment Needed
No risk assessment documentation is necessary for the following encroachments, which are considered to have minimal or acceptable risk:
• if the SDDOT design criteria are used and if no insurable buildings are in the 100-year floodplain, or
• if the encroachment is designed consistent with NFIP criteria.
14.2.2.5.2 Consider Risk Assessment
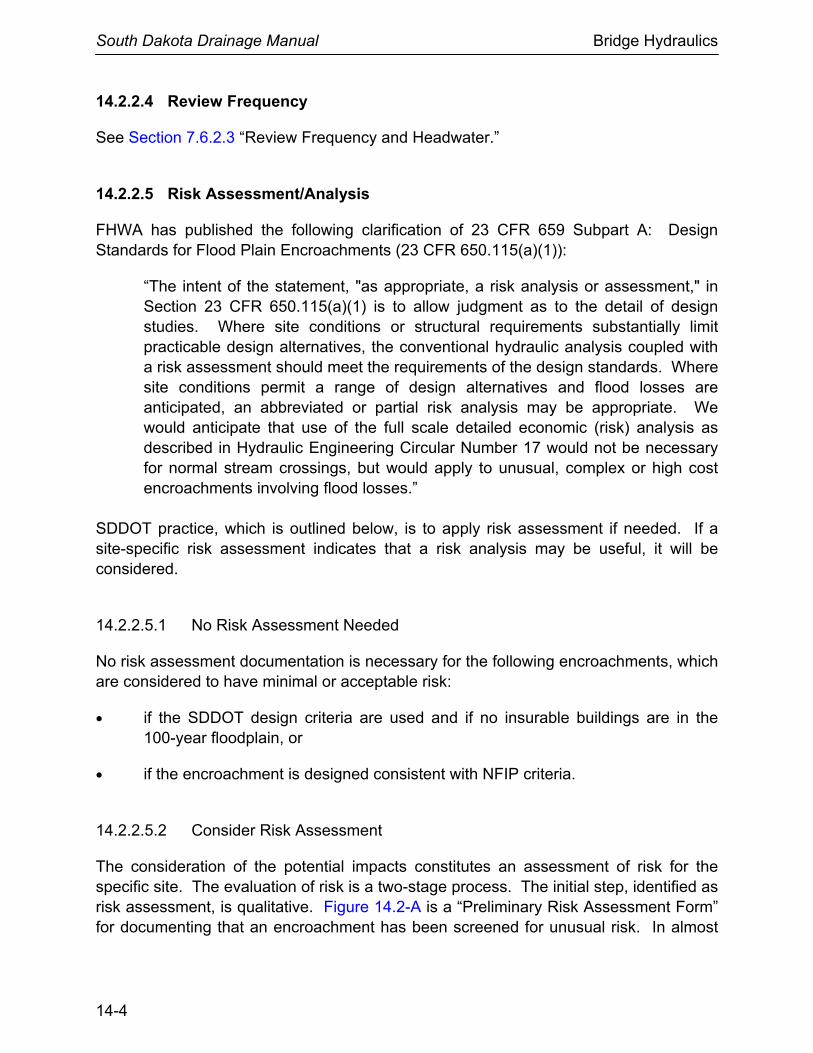
The consideration of the potential impacts constitutes an assessment of risk for the specific site. The evaluation of risk is a two-stage process. The initial step, identified as risk assessment, is qualitative. Figure 14.2-A is a “Preliminary Risk Assessment Form” for documenting that an encroachment has been screened for unusual risk. In almost
South Dakota Drainage Manual Bridge Hydraulics
14-5
Preliminary Risk Assessment Checklist
(Predicated on Engineering Judgment based on Survey and Plans)
Check Off 1. Potential risk to human life due to flood pool upstream and/or
“Dam Break – Flood Wave” downstream.
2. Damage to adjacent property by changes in hydraulic characteristics.
3. Damage to highway facility
4. Traffic Service AADT Detours Available Describe detour (i.e., Rte… to Rte… to Rte…, Length… mi)
5. Floodplain Management Criteria Specify:
6. Floodplain Impacts
7. Other Pertinent Factors
Figure 14.2-A ⎯ PRELIMINARY RISK ASSESSMENT FORM (Reference (1))
South Dakota Drainage Manual Bridge Hydraulics
14-6
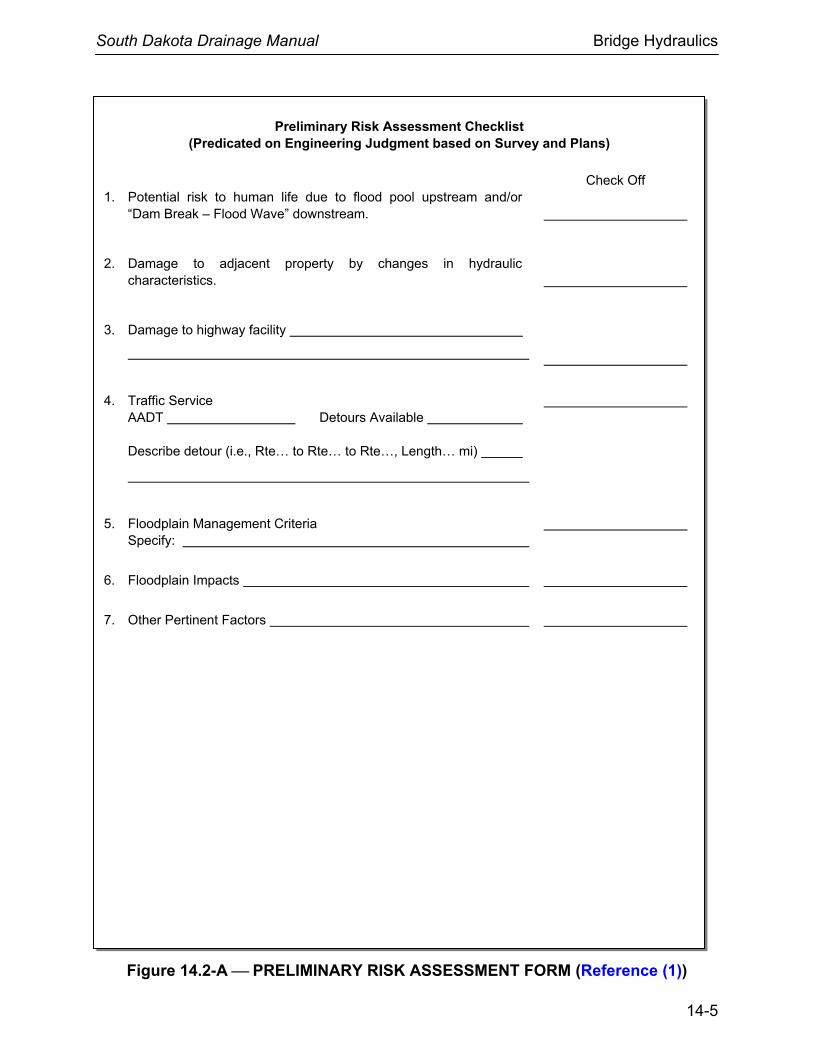
all cases, where the risks are low and/or threshold design values can be met, it is unnecessary to perform a detailed assessment. Where the risks are assumed to be high and/or threshold design values cannot be met, the second stage of the process is to perform a more detailed assessment using Figure 14.2-B “Design Risk Assessment Form,” which documents threshold values that should be met by the hydraulic design. If the design criteria are not flexible or if significant risk exists, consider a risk analysis.
14.2.2.5.3 Consider Risk Analysis
The risk analysis process determines the least-total-expected-cost (LTEC) alternative using the analytical procedures provided in HEC 17 (Reference (4)). This analysis provides a comparison between various alternatives developed in response to considerations such as environmental, regulatory and political constraints.
The evaluation of the consequence of risk associated with the probability of flooding attributed to a stream crossing system is a tool by which site-specific design criteria can be developed. This evaluation considers capital cost, traffic service, environmental and property impacts and hazards to human life. It is necessary to document the risk to the structure.
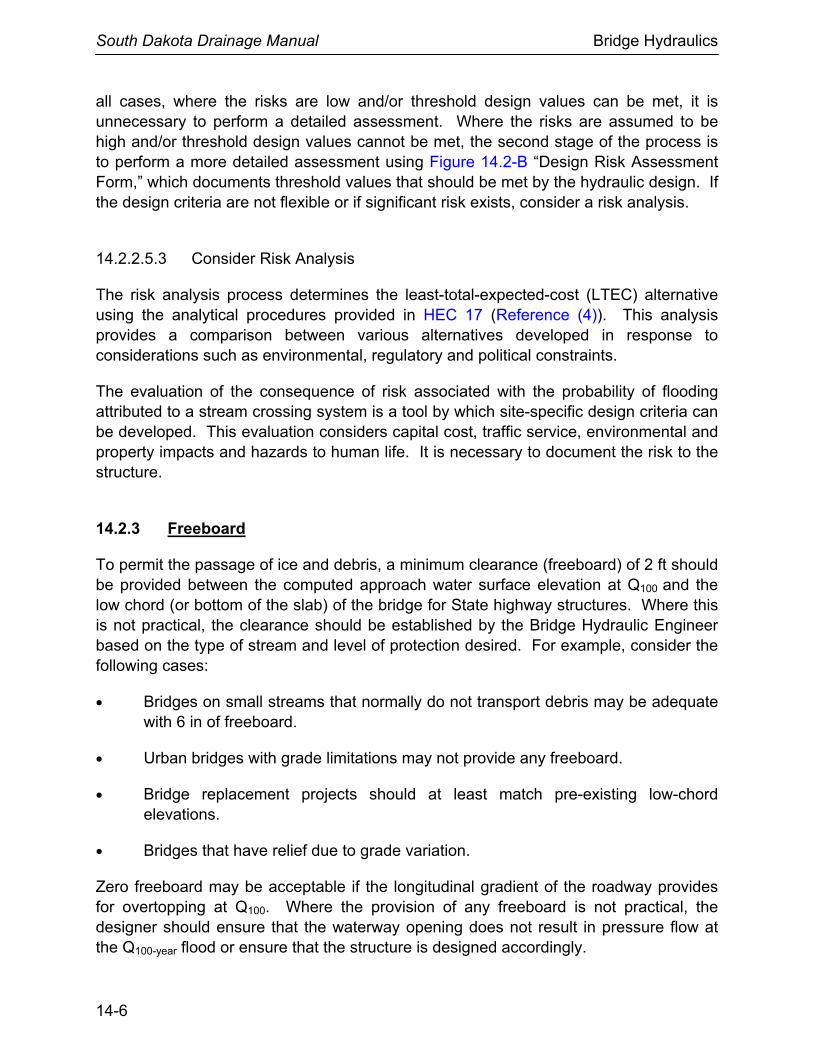
14.2.3 Freeboard
To permit the passage of ice and debris, a minimum clearance (freeboard) of 2 ft should be provided between the computed approach water surface elevation at Q100 and the low chord (or bottom of the slab) of the bridge for State highway structures. Where this is not practical, the clearance should be established by the Bridge Hydraulic Engineer based on the type of stream and level of protection desired. For example, consider the following cases:
• Bridges on small streams that normally do not transport debris may be adequate with 6 in of freeboard.
• Urban bridges with grade limitations may not provide any freeboard.
• Bridge replacement projects should at least match pre-existing low-chord elevations.
• Bridges that have relief due to grade variation.
Zero freeboard may be acceptable if the longitudinal gradient of the roadway provides for overtopping at Q100. Where the provision of any freeboard is not practical, the designer should ensure that the waterway opening does not result in pressure flow at the Q100-year flood or ensure that the structure is designed accordingly.

South Dakota Drainage Manual Bridge Hydraulics
14-7
Design Risk Assessment Checklist
LOCATION
County Sec. Twp Range Over (River, Cr, Dr, Ditch) Road No. Project No. PCN Number Assessment Prepared by Date
1. HYDROLOGIC EVALUATION A. Nearest Gaging Station on this stream (None ) B. Are flood studies available on this stream? C. Flood Data
Drainage Area Method used to compute Q
Q10 cfs, Est. Bkwtr. ft Q25 cfs, Est. Bkwtr. ft
Q50 cfs, Est. Bkwtr. ft Q100 cfs, Est. Bkwtr. ft
Q500 cfs, or Overtopping cfs Est. Bkwtr. ft
D. Does the crossing require outside Agency approval? Yes No. List Agencies:
2. PROPERTY-RELATED EVALUATIONS A. Damage potential: Low Moderate High List buildings in floodplain Location Floor Elevation Upstream Land Use Anticipate any change? B. Any flood zoning? (NFIP Studies, etc.) Yes No Type of Study Base Flood Elevation (100 year) Regulatory Floodway Width (As noted in NFIP studies) Comments;
3. ENVIRONMENTAL CONSIDERATIONS A. List commitments in Environmental Documents that affect Hydraulic Design. (None )
Figure 14.2-B ⎯ DESIGN RISK ASSESSMENT FORM (Reference (1))
South Dakota Drainage Manual Bridge Hydraulics
14-8
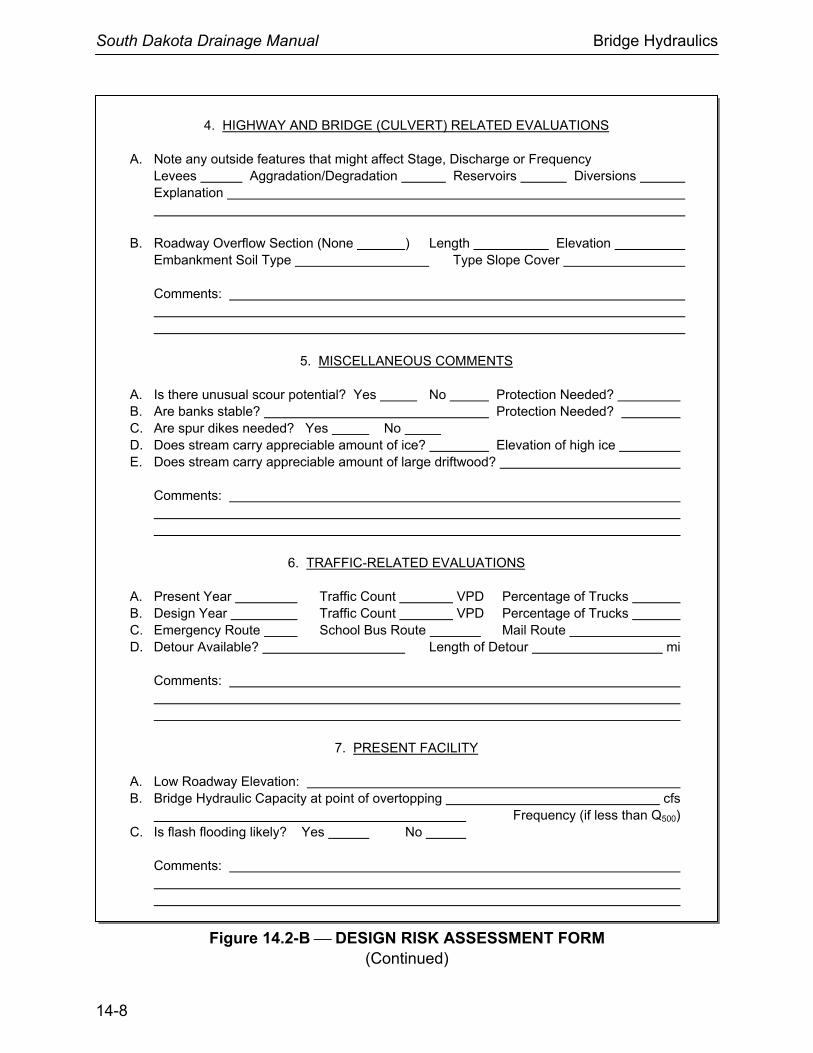
4. HIGHWAY AND BRIDGE (CULVERT) RELATED EVALUATIONS
A. Note any outside features that might affect Stage, Discharge or Frequency
Levees Aggradation/Degradation Reservoirs Diversions Explanation
B. Roadway Overflow Section (None ) Length Elevation Embankment Soil Type Type Slope Cover Comments:
5. MISCELLANEOUS COMMENTS
A. Is there unusual scour potential? Yes No Protection Needed? B. Are banks stable? Protection Needed? C. Are spur dikes needed? Yes No D. Does stream carry appreciable amount of ice? Elevation of high ice E. Does stream carry appreciable amount of large driftwood?
Comments:
6. TRAFFIC-RELATED EVALUATIONS
A. Present Year Traffic Count VPD Percentage of Trucks B. Design Year Traffic Count VPD Percentage of Trucks C. Emergency Route School Bus Route Mail Route D. Detour Available? Length of Detour mi
Comments:
7. PRESENT FACILITY
A. Low Roadway Elevation: B. Bridge Hydraulic Capacity at point of overtopping cfs Frequency (if less than Q500) C. Is flash flooding likely? Yes No
Comments:
Figure 14.2-B ⎯ DESIGN RISK ASSESSMENT FORM (Continued)
South Dakota Drainage Manual Bridge Hydraulics
14-9
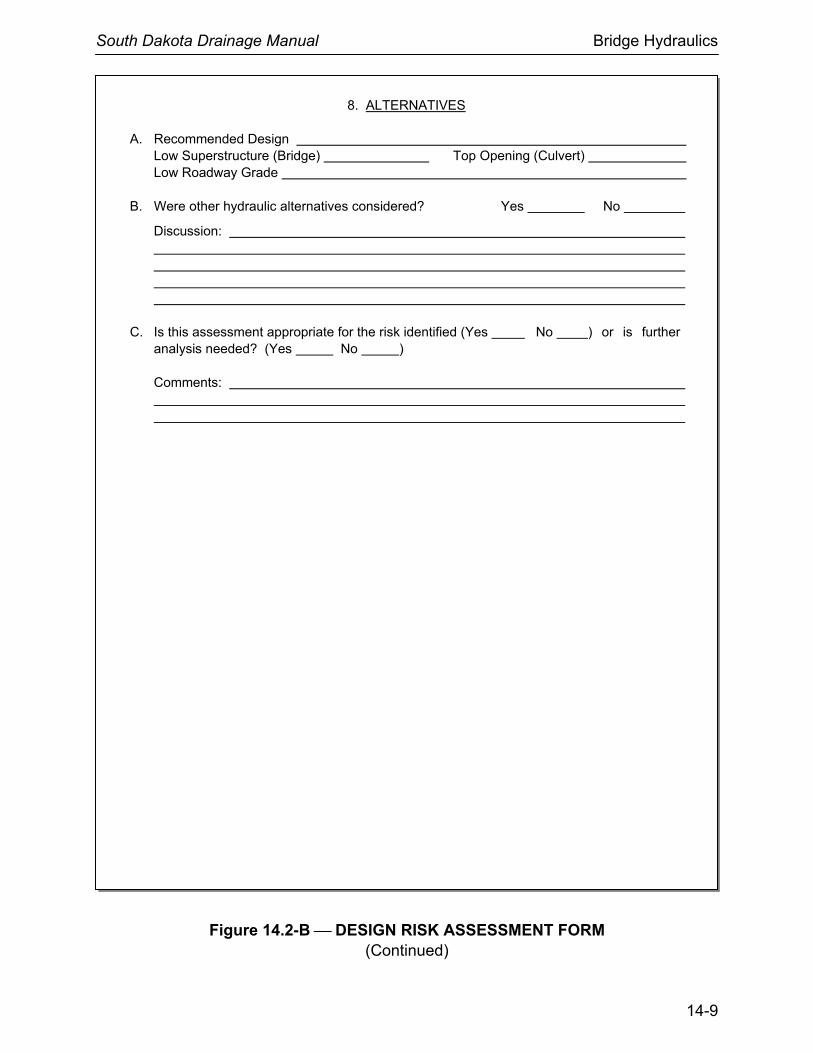
8. ALTERNATIVES
A. Recommended Design
Low Superstructure (Bridge) Top Opening (Culvert) Low Roadway Grade
B. Were other hydraulic alternatives considered? Yes No
Discussion:
C. Is this assessment appropriate for the risk identified (Yes No ) or is further
analysis needed? (Yes No )
Comments:
Figure 14.2-B ⎯ DESIGN RISK ASSESSMENT FORM (Continued)
South Dakota Drainage Manual Bridge Hydraulics
14-10
For navigational channels, vertical and horizontal clearance should be provided based on normally expected flows during the navigation season.
14.2.4 Backwater
The hydraulic design should conform to NFIP requirements, State regulations and local ordinances for stream crossings with flood elevations provided by the NFIP studies. Increases in backwater are not to exceed 1 ft during the passage of the 100-year flood, if practical, for sites not covered by NFIP. However, no additional study is required for bridge rehabilitation work where bridge replacement is not being considered. See Section 17.3 for more discussion.
The 100-year backwater should not significantly increase flood damage to property upstream of the crossing. The 100-year velocities through the structure(s) should not damage the highway facility nor increase damages to adjacent property.
South Dakota Drainage Manual Bridge Hydraulics
14-11
14.3 BRIDGE LOCATION
14.3.1 General Considerations
Although many factors, including non-technical ones, influence the final location of a stream crossing system (see Section 4.2.6 and HDS 6 (Reference (5)), the hydraulics of the proposed location must have a high priority. Hydraulic considerations in selecting the location include floodplain width and roughness, flow distribution and direction, stream type (braided, straight or meandering), stream regime (aggrading, degrading or equilibrium) and stream controls. The hydraulics of a proposed location also affect environmental considerations (e.g., aquatic life, wetlands, sedimentation and stream stability). Finally, the hydraulics of a particular site determine whether certain national objectives, such as the wise use of floodplains, reduction of flooding losses and preservation of wetlands, can be met.
14.3.2 Location Considerations
Situating the bridge at the proper location within the floodplain can greatly influence the performance and service life of the crossing. If possible, the crossing should:
• minimize skew, • be located at the narrowest portion of the floodplain, • be located on a stable reach of stream, • minimize impacts of meander migration, and • have appropriately located auxiliary/relief openings (if needed). The selection of hydraulic design criteria for determining the waterway opening, roadway grade, scour potential, riprap and other features should also consider the potential impacts to:
• traffic flow patterns, • adjacent properties, • the environment, and • NFIP regulatory floodplains and floodways.
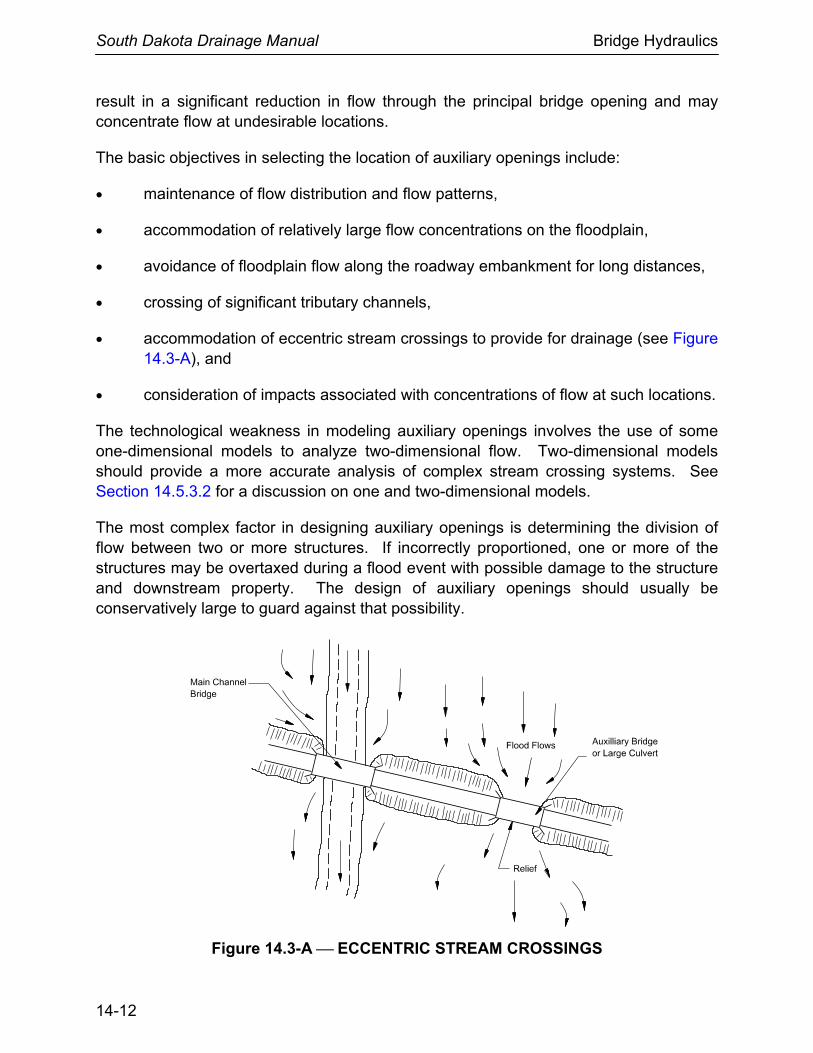
14.3.3 Auxiliary/Relief Openings
The need for auxiliary waterway openings, or relief openings, arises on streams with wide floodplains. The purpose of the openings is to pass a portion of the flood flow that travels in the floodplain when the stream reaches a certain stage. The openings do not provide relief for the principal waterway opening as an emergency spillway of a dam does, but it has predictable capacity during flood events. However, the hydraulic engineer should be aware that the presence of overtopping or relief openings may not
South Dakota Drainage Manual Bridge Hydraulics
14-12
result in a significant reduction in flow through the principal bridge opening and may concentrate flow at undesirable locations.
The basic objectives in selecting the location of auxiliary openings include:
• maintenance of flow distribution and flow patterns,
• accommodation of relatively large flow concentrations on the floodplain,
• avoidance of floodplain flow along the roadway embankment for long distances,
• crossing of significant tributary channels,
• accommodation of eccentric stream crossings to provide for drainage (see Figure 14.3-A), and
• consideration of impacts associated with concentrations of flow at such locations.
The technological weakness in modeling auxiliary openings involves the use of some one-dimensional models to analyze two-dimensional flow. Two-dimensional models should provide a more accurate analysis of complex stream crossing systems. See Section 14.5.3.2 for a discussion on one and two-dimensional models.
The most complex factor in designing auxiliary openings is determining the division of flow between two or more structures. If incorrectly proportioned, one or more of the structures may be overtaxed during a flood event with possible damage to the structure and downstream property. The design of auxiliary openings should usually be conservatively large to guard against that possibility.
Figure 14.3-A ⎯ ECCENTRIC STREAM CROSSINGS
South Dakota Drainage Manual Bridge Hydraulics
14-13
14.4 STREAM STABILITY
14.4.1 Objective
The basic objective of evaluating the stability of a stream channel is to confirm that the stream reach can be assumed to be stable over the design life of the bridge. The initial assumption is that a study reach is stable. This assumption is tested by reviewing the reach with progressively more detailed study if instabilities are found. The process is described in HEC 20 (Reference (6)) and is outlined in the following section.
14.4.2 Levels of Assessment
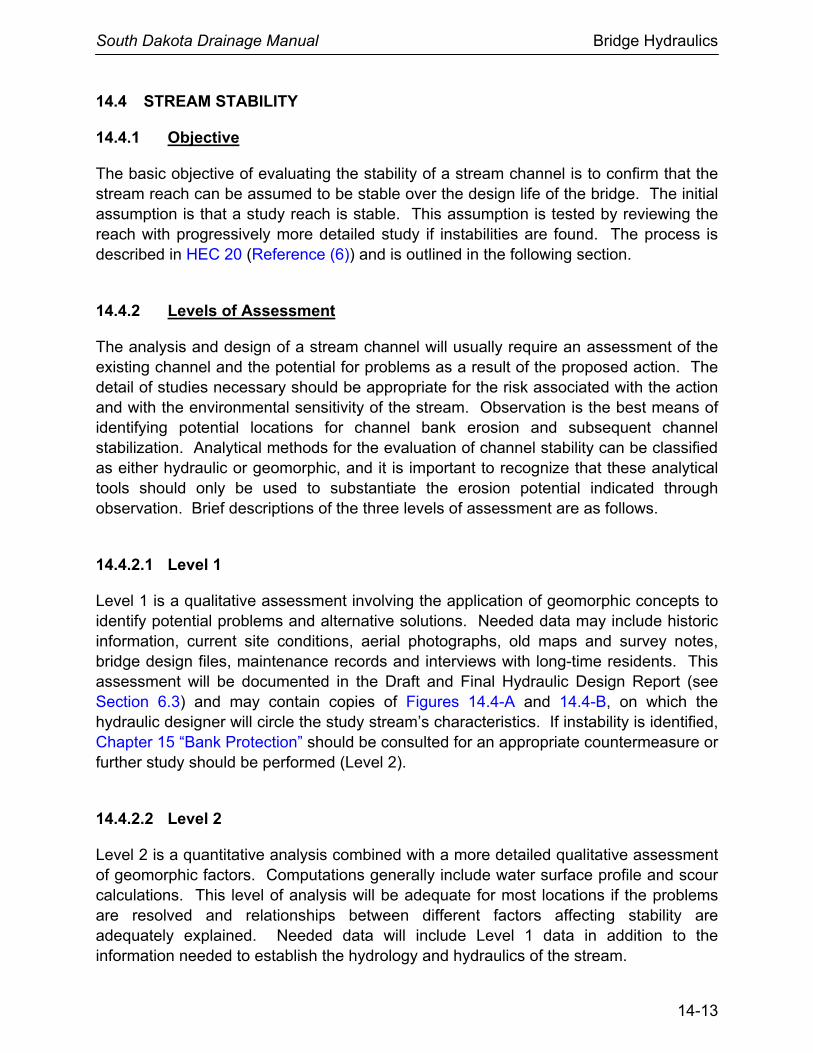
The analysis and design of a stream channel will usually require an assessment of the existing channel and the potential for problems as a result of the proposed action. The detail of studies necessary should be appropriate for the risk associated with the action and with the environmental sensitivity of the stream. Observation is the best means of identifying potential locations for channel bank erosion and subsequent channel stabilization. Analytical methods for the evaluation of channel stability can be classified as either hydraulic or geomorphic, and it is important to recognize that these analytical tools should only be used to substantiate the erosion potential indicated through observation. Brief descriptions of the three levels of assessment are as follows.
14.4.2.1 Level 1
Level 1 is a qualitative assessment involving the application of geomorphic concepts to identify potential problems and alternative solutions. Needed data may include historic information, current site conditions, aerial photographs, old maps and survey notes, bridge design files, maintenance records and interviews with long-time residents. This assessment will be documented in the Draft and Final Hydraulic Design Report (see Section 6.3) and may contain copies of Figures 14.4-A and 14.4-B, on which the hydraulic designer will circle the study stream’s characteristics. If instability is identified, Chapter 15 “Bank Protection” should be consulted for an appropriate countermeasure or further study should be performed (Level 2).
14.4.2.2 Level 2
Level 2 is a quantitative analysis combined with a more detailed qualitative assessment of geomorphic factors. Computations generally include water surface profile and scour calculations. This level of analysis will be adequate for most locations if the problems are resolved and relationships between different factors affecting stability are adequately explained. Needed data will include Level 1 data in addition to the information needed to establish the hydrology and hydraulics of the stream.
South Dakota Drainage Manual Bridge Hydraulics
14-14
Figure 14.4-A ⎯ GEOMORPHIC FACTORS THAT AFFECT STREAM STABILITY (Section references are to HEC 20, Reference (6))
South Dakota Drainage Manual Bridge Hydraulics
14-15
Figure 14.4-B ⎯ HYDRAULIC, LOCATION AND DESIGN FACTORS THAT AFFECT
STREAM STABILITY (Section references are to HEC 20, Reference (6))
South Dakota Drainage Manual Bridge Hydraulics
14-16
14.4.2.3 Level 3
Level 3 is a complex quantitative analysis based on detailed mathematical modeling and possibly physical hydraulic modeling. A Level 3 analysis is necessary only for high-risk locations, extraordinarily complex problems and possibly after-the-fact analysis where losses and liability costs are high. A Level 3 analysis may require professionals experienced with mathematical modeling techniques for sediment routing and/or physical modeling. Needed data will include Level 1 and Level 2 data and field data on bed load and suspended load transport rates and properties of bed and bank materials (e.g., size, shape, gradation, fall velocity, cohesion, density, angle of repose).
14.4.3 Factors that Affect Stream Stability
Factors that affect stream stability, and potentially bridge and highway stability at stream crossings, can be classified as geomorphic factors and hydraulic factors.
14.4.3.1 Geomorphic Factors
These include:
• stream size, • flow habit • bed material, • valley setting, • floodplains, • natural levees, • apparent incision, • channel boundaries, • tree cover on banks, • sinuosity, • degree of braiding, • degree of anabranching, and • variability of width, • development of bars. Figure 14.4-A depicts examples of the various geomorphic factors.
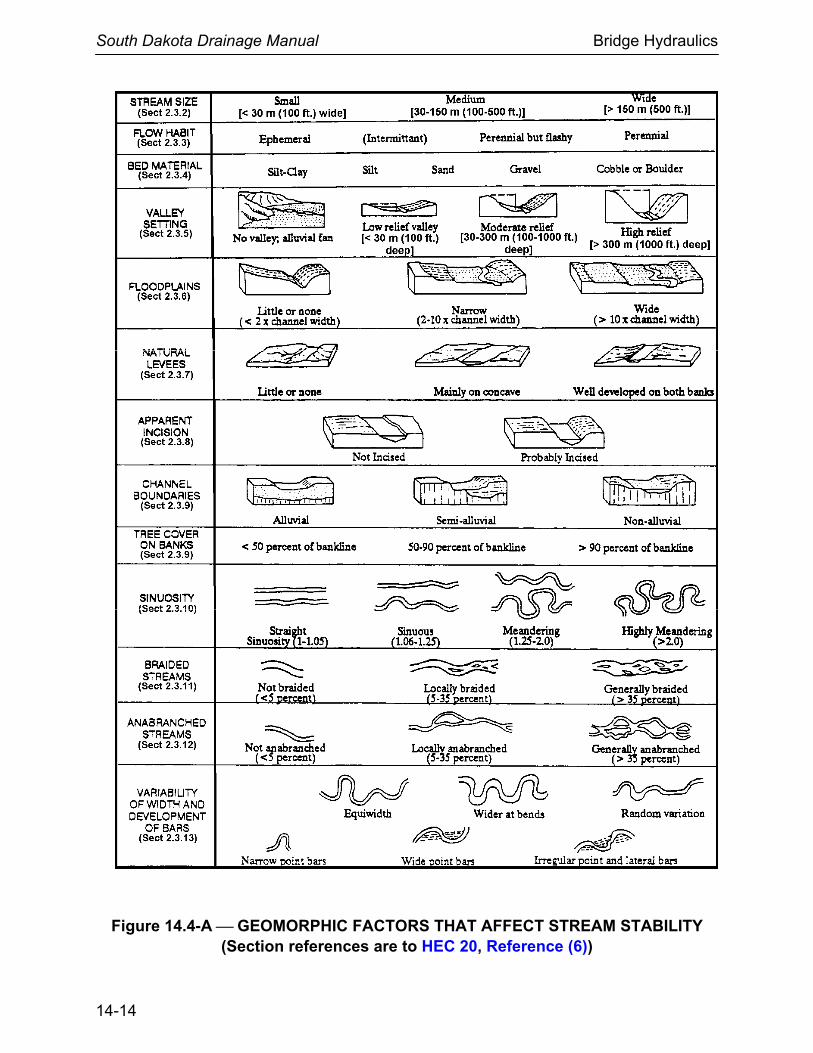
14.4.3.2 Hydraulic Factors
These include:
• magnitude, frequency and duration of floods; • bed configuration; • resistance to flow; • water surface profiles, • problems at bends, • problems at confluences, • backwater effects of alignment and location, • effects of highway profile, and • bridge design.
South Dakota Drainage Manual Bridge Hydraulics
14-17
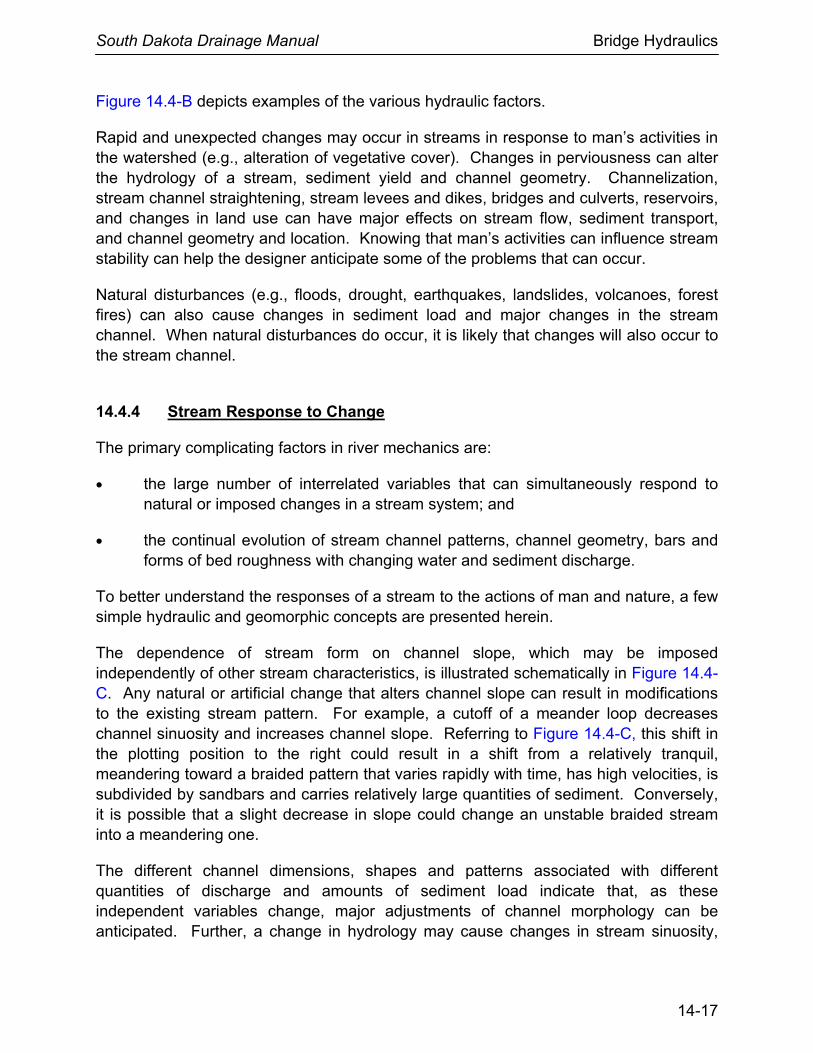
Figure 14.4-B depicts examples of the various hydraulic factors.
Rapid and unexpected changes may occur in streams in response to man’s activities in the watershed (e.g., alteration of vegetative cover). Changes in perviousness can alter the hydrology of a stream, sediment yield and channel geometry. Channelization, stream channel straightening, stream levees and dikes, bridges and culverts, reservoirs, and changes in land use can have major effects on stream flow, sediment transport, and channel geometry and location. Knowing that man’s activities can influence stream stability can help the designer anticipate some of the problems that can occur.
Natural disturbances (e.g., floods, drought, earthquakes, landslides, volcanoes, forest fires) can also cause changes in sediment load and major changes in the stream channel. When natural disturbances do occur, it is likely that changes will also occur to the stream channel.
14.4.4 Stream Response to Change
The primary complicating factors in river mechanics are:
• the large number of interrelated variables that can simultaneously respond to natural or imposed changes in a stream system; and
• the continual evolution of stream channel patterns, channel geometry, bars and forms of bed roughness with changing water and sediment discharge.
To better understand the responses of a stream to the actions of man and nature, a few simple hydraulic and geomorphic concepts are presented herein.
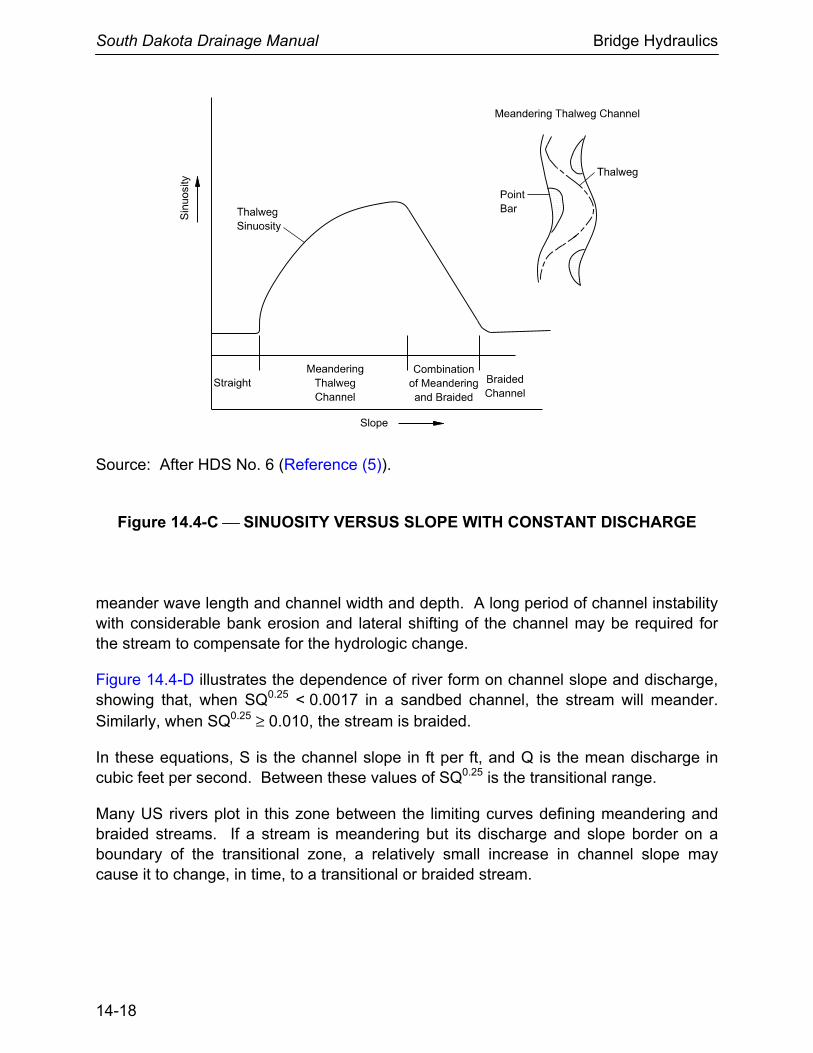
The dependence of stream form on channel slope, which may be imposed independently of other stream characteristics, is illustrated schematically in Figure 14.4-C. Any natural or artificial change that alters channel slope can result in modifications to the existing stream pattern. For example, a cutoff of a meander loop decreases channel sinuosity and increases channel slope. Referring to Figure 14.4-C, this shift in the plotting position to the right could result in a shift from a relatively tranquil, meandering toward a braided pattern that varies rapidly with time, has high velocities, is subdivided by sandbars and carries relatively large quantities of sediment. Conversely, it is possible that a slight decrease in slope could change an unstable braided stream into a meandering one.
The different channel dimensions, shapes and patterns associated with different quantities of discharge and amounts of sediment load indicate that, as these independent variables change, major adjustments of channel morphology can be anticipated. Further, a change in hydrology may cause changes in stream sinuosity,
South Dakota Drainage Manual Bridge Hydraulics
14-18
Source: After HDS No. 6 (Reference (5)).
Figure 14.4-C ⎯ SINUOSITY VERSUS SLOPE WITH CONSTANT DISCHARGE
meander wave length and channel width and depth. A long period of channel instability with considerable bank erosion and lateral shifting of the channel may be required for the stream to compensate for the hydrologic change.
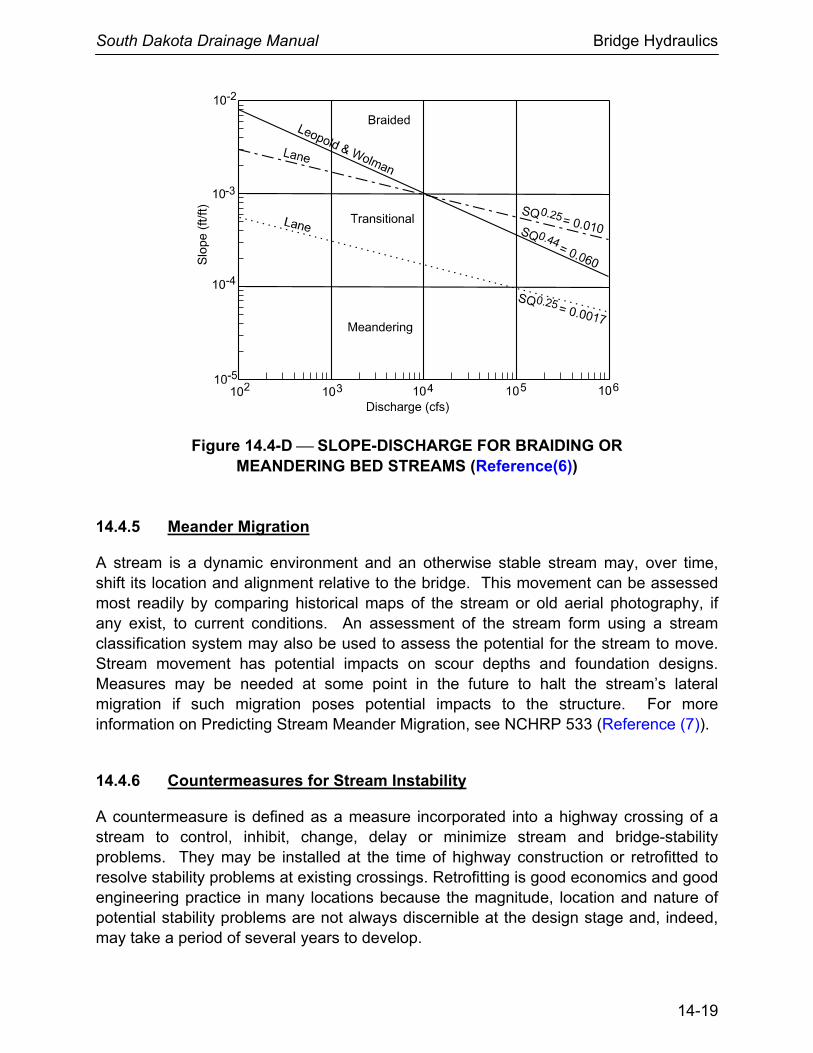
Figure 14.4-D illustrates the dependence of river form on channel slope and discharge, showing that, when SQ0.25 < 0.0017 in a sandbed channel, the stream will meander. Similarly, when SQ0.25 ≥ 0.010, the stream is braided.
In these equations, S is the channel slope in ft per ft, and Q is the mean discharge in cubic feet per second. Between these values of SQ0.25 is the transitional range.
Many US rivers plot in this zone between the limiting curves defining meandering and braided streams. If a stream is meandering but its discharge and slope border on a boundary of the transitional zone, a relatively small increase in channel slope may cause it to change, in time, to a transitional or braided stream.
South Dakota Drainage Manual Bridge Hydraulics
14-19
Figure 14.4-D ⎯ SLOPE-DISCHARGE FOR BRAIDING OR
MEANDERING BED STREAMS (Reference(6)) 14.4.5 Meander Migration
A stream is a dynamic environment and an otherwise stable stream may, over time, shift its location and alignment relative to the bridge. This movement can be assessed most readily by comparing historical maps of the stream or old aerial photography, if any exist, to current conditions. An assessment of the stream form using a stream classification system may also be used to assess the potential for the stream to move. Stream movement has potential impacts on scour depths and foundation designs. Measures may be needed at some point in the future to halt the stream’s lateral migration if such migration poses potential impacts to the structure. For more information on Predicting Stream Meander Migration, see NCHRP 533 (Reference (7)).
14.4.6 Countermeasures for Stream Instability
A countermeasure is defined as a measure incorporated into a highway crossing of a stream to control, inhibit, change, delay or minimize stream and bridge-stability problems. They may be installed at the time of highway construction or retrofitted to resolve stability problems at existing crossings. Retrofitting is good economics and good engineering practice in many locations because the magnitude, location and nature of potential stability problems are not always discernible at the design stage and, indeed, may take a period of several years to develop.
South Dakota Drainage Manual Bridge Hydraulics
14-20
The selection of an appropriate countermeasure for a specific bank erosion problem is dependent on factors such as the erosion mechanism, stream characteristics, construction and maintenance requirements, adjacent property, potential for vandalism and costs (see matrix in Section 15.9).
The following is a brief discussion of possible countermeasures for some common river-stability problems. The countermeasures used by SDDOT are found in Section 15.9.
14.4.6.1 Channel Braiding
Countermeasures used at braided streams are usually intended to confine the multiple channels to one channel. This tends to increase sediment transport capacity in the principal channel and encourage deposition in secondary channels.
The measures usually consist of dikes constructed from the limits of the multiple channels to the channel over which the bridge is constructed. Successful counter-measures include:
• guide dikes at bridge ends (see Section 15.9) used in combination with revetment on highway fill slopes,
• riprap on highway fill slopes only (see Appendix 14.D), and
• spurs arranged in the stream channels to constrict flow to one channel (see Section 15.9).
14.4.6.2 Degradation
Degradation in streams can cause the loss of bridge piers in stream channels and piers and abutments in caving banks. A grade control or check dam (see Section 15.9), which is a low dam or weir constructed across a channel, is one of the most successful techniques for halting degradation on small to medium streams. Caution should be used when designing a check dam because there may be consequences downstream.
Longitudinal stone dikes placed at the toe of channel banks can be effective countermeasures for bank caving in degrading streams. Precautions to prevent outflanking (e.g., tiebacks to the banks) may be necessary where installations are limited to the vicinity of the highway stream crossing. In general, channel lining alone is not a successful countermeasure against degradation problems (see Reference (6)).
14.4.6.3 Aggradation
Current measures in use to alleviate aggradation problems at highways include channelization, bridge modification, continued maintenance or combinations of these.

South Dakota Drainage Manual Bridge Hydraulics
14-21
Channelization may include excavating and cleaning channels, constructing cutoffs to increase the local slope, constructing flow-control structures to reduce and control the local channel width, and constructing relief channels to improve flow capacity at the crossing. Except for relief channels, these measures are intended to increase the sediment transport capacity of the channel, thus reducing or eliminating problems with aggradation in the vicinity of the bridge.
South Dakota Drainage Manual Bridge Hydraulics
14-22
14.5 HYDRAULIC ANALYSIS OF STREAM CHANNEL CROSSINGS
14.5.1 Documentation
14.5.1.1 New/Replaced Bridges
Section 6.3.8.3 presents the information that should be documented in the Hydraulic Design Report for new and replaced bridges. The following presents supplementary information.
I. Draft Hydraulic Design Report In addition to the items discussed in Section 6.3.8.3, the Report should include
the following, as appropriate:
A. Site-Specific Hydraulic Performance Criteria (see Section 14.2)
B. Risk Assessment (see Section 14.2.2.5)
• Floodplain land use • Environmentally sensitive areas (e.g., fisheries, wetlands)
C. Stream Stability Assessment
• Level I qualitative analysis (see Section 14.4.2.1)
• Geomorphic factors (see Figure 14.4-A) and hydraulic factors (see Figure 14.4-B) that affect stream stability
• Identification of existing bed or bank instability (see HEC 20, Reference (6))
D. Hydrologic Computations
• Discharges for specified frequencies (see Section 14.2.2)
• Discharge and frequency for historical flood that complements the high-water marks used for calibration
E. Hydraulic Computations
• Computational method (see Section 14.5.3.2) • Computer model selection (see Section 18.2.7) • Hydraulic performance for existing conditions • Hydraulic performance of proposed designs • Scour computations, if appropriate (see Section14.6)
South Dakota Drainage Manual Bridge Hydraulics
14-23
II. Final Hydraulic Design Report
In addition to the items already included in the Draft Hydraulic Design Report and the items discussed in Section 6.3.8.3, the Final Hydraulic Design Report should include the following, as appropriate:
• Risk analysis documentation, if applicable (see Section 14.2.2.5)
• Erosion protection details (see Sections 15.7, 15.8)
• Scour computations (see Section 14.6)
• Bridge deck drainage, if needed (see Section 14.7)
• Countermeasure design details (see Section 15.9)
• Scour countermeasure design details (see Section 14.6.9)
• Scour monitoring plan or instrumentation, if applicable (see Section 14.6.9)
III. Records and Files (see Section 6.4) 14.5.1.2 Existing Bridges
The hydraulic designer will decide on a case-by-case basis when it is necessary to prepare a Hydraulic Design Report for an existing bridge that is within the project limits. The following presents factors that should be considered:
1. Nature of Work. Does the proposed work impact the hydraulics of the existing bridge? For example, if the project will only rehabilitate the bridge deck, then the answer is almost certainly no and a Hydraulic Design Report would not be necessary. A Hydraulic Design Report is likely needed if the proposed work will modify the hydraulic opening; for example, increasing the size of piers for a scour countermeasure.
2. History of Site. Is there a known history of hydraulic-related problems at the bridge site (e.g., frequent overtopping, large scour holes). If yes, then a Hydraulic Design Report may be appropriate.
3. Type of Facility. Is the facility on the State Highway system? If yes, then a Hydraulic Design Report is more likely to be appropriate than for an off-system facility.
South Dakota Drainage Manual Bridge Hydraulics
14-24
4. Scour. SDDOT mandates that all bridges within the project limits must be evaluated for hydraulic scour and documented in a Hydraulic Design Report.
5. Cost of Work. If the cost of the bridge rehabilitation work is substantial in comparison to the replacement cost of the bridge, then a Hydraulic Design Report may be appropriate. This Report could reveal hydraulic problems that prompt the bridge designer to replace the bridge rather than rehabilitate the existing bridge.
14.5.2 Hydraulic Nature of Existing Stream Channel
14.5.2.1 Typical Assumptions for Natural Channels
Open channel flows are classified as steady or unsteady. Unsteady flow is further classified as rapidly or gradually varied. Additionally, flow through a stream crossing system is subject to either free surface or pressure flow through one or more bridges with possible roadway overtopping. An overview of hydraulic factors that affect stream crossings is found in HEC 20 (Reference (6)), and a complete treatment is found in HDS 6 (Reference (5)).
Most open channel flows in nature are unsteady regarding some aspect of the flow (e.g., depth or velocity changing with time). Because unsteady flow solutions can be very complicated and time consuming, these problems have typically been solved by assuming a steady flow condition. The result is an approximate solution that is adequate for most types of planning or hydraulic design challenges but may be inadequate for other types of problems (e.g., crossings of streams that have broad floodplains or highly skewed crossings).
Gradually varied, unsteady flow creates a water surface profile wave with mild curvature and a gradual change in depth. In rapidly varying unsteady flow, the change in depth is large, and the curvature of the profile is very sharp. Typically, flow through a bridge is rapidly varying, unsteady flow.
14.5.2.2 Cross Sections
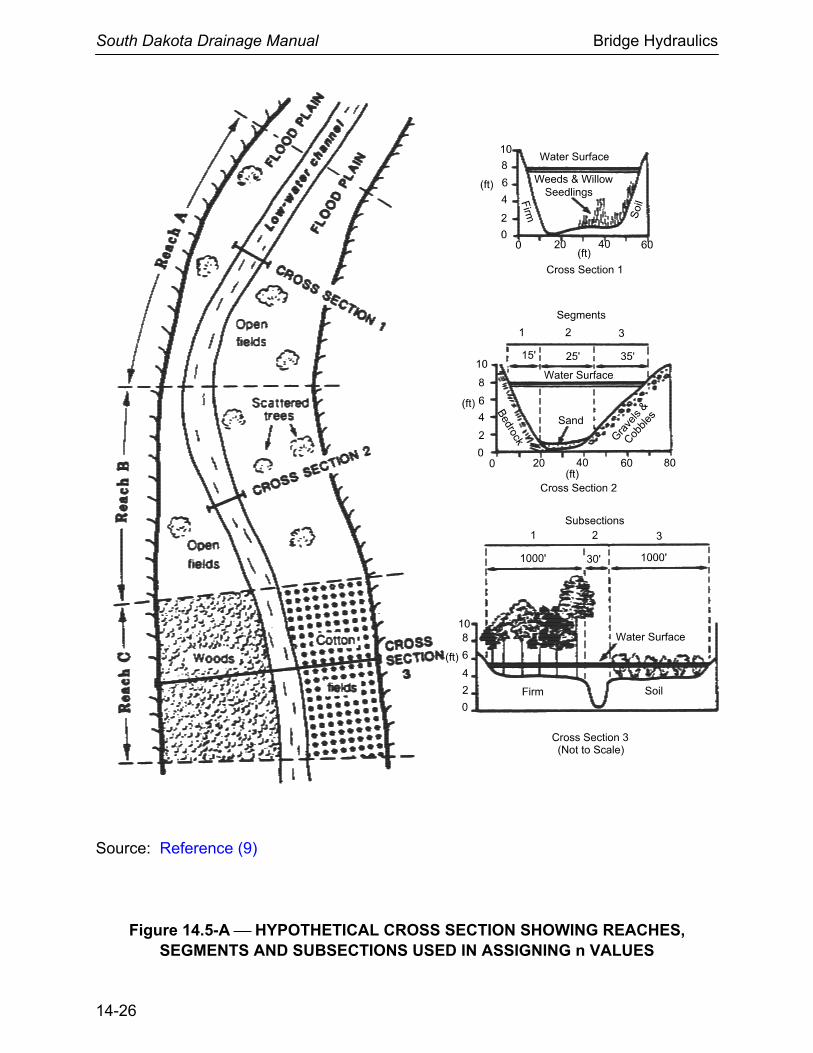
The geometry of streams is defined by cross-sectional coordinates of lateral distance and ground elevation that locate individual ground points. The cross section is taken normal to the flow direction along a single, straight line where possible but, in wide floodplains or bends, it may be necessary to use a section along intersecting straight lines; i.e., a “dog-leg” section. A plot of each cross section is essential to reveal any inconsistencies or errors.
South Dakota Drainage Manual Bridge Hydraulics
14-25
Locate cross sections to be representative of the subreaches between them. The following stream locations will require cross sections taken at shorter intervals to better model the change in conveyance:
• major breaks in bed profile; • abrupt changes in roughness or shape; • control sections such as free overfalls, bends and contractions; or • other abrupt changes in channel slope or conveyance. Subdivide cross sections at vertical boundaries where there are abrupt lateral changes in geometry and/or roughness as for overbank flows. The conveyances of each subsection are computed separately to determine the flow distribution and are then added to determine the total flow conveyance. The subsection divisions must be chosen carefully so that the distribution of flow or conveyance is nearly uniform in each subsection (see Reference (8)). Figure 14.5-A illustrates the selection of cross sections and the vertical subdivision of a cross section.
14.5.2.3 Manning’s n Value Selection
Manning’s n is affected by many factors, and its selection in natural channels depends heavily on engineering experience. Photographs of channels and floodplains for which the discharge has been measured and Manning’s n has been calculated are very useful (see References (9) and (10)). For situations lying outside the engineer’s experience, a more regimented approach is presented in Reference (9). Once the Manning’s n values have been selected, they should be verified or calibrated with historical high-water marks and/or gaged streamflow data.
14.5.2.4 Calibration
Calibrate the water surface profile model with historical high-water marks and/or gaged streamflow data to ensure that they accurately represent local channel conditions. Use the following parameters, in order of preference, for calibrations:
• Manning’s n, • slope, • discharge, and • cross section. Proper calibration is essential if accurate results will be obtained.
In stream channels, the transverse variation of velocity in any cross section is a function of subsection geometry and roughness and may vary considerably from one stage and discharge to another. It is important to know this variation for designing erosion control
South Dakota Drainage Manual Bridge Hydraulics
14-26
Source: Reference (9)
Figure 14.5-A ⎯ HYPOTHETICAL CROSS SECTION SHOWING REACHES, SEGMENTS AND SUBSECTIONS USED IN ASSIGNING n VALUES

South Dakota Drainage Manual Bridge Hydraulics
14-27
measures and locating relief openings in highway fills. The best method of establishing transverse velocity variations is by current meter measurements. If this is not possible, the single-section method can be used by dividing the cross section into subsections of relatively uniform roughness and geometry. It is assumed that the energy grade line slope is the same across the cross section so that the total conveyance (Kt) of the cross section is the sum of the subsection conveyances. The total discharge is then KtS
1/2 and the discharge in each subsection is proportional to its conveyance. The velocity in each subsection is obtained from the continuity equation, V = Q/A.
There may be locations where a stage-discharge relationship has already been measured in a channel. These usually exist at gaging stations on streams monitored by USGS. Measured stage-discharge curves will generally yield more accurate estimates of water surface elevation and should take precedence over the analytical methods described above. Contact USGS for stage-discharge information; see Section 18.2.1.1.
14.5.3 Bridge Waterway Opening Analysis
14.5.3.1 General
The hydraulic design for a bridge waterway opening requires a comprehensive engineering approach that includes the consideration of alternatives, data collection, analysis and selection of the most cost-effective alternative according to established criteria and documentation of the final design. This hydraulic analysis will be based on the hydraulic performance criteria presented in Section 14.2.
Manual calculations for the hydraulic analysis of a bridge waterway opening are impractical due to the flow complexities being simulated and the interactive, complex nature of the calculations involved. These analyses should be conducted using the hydraulic software approved by SDDOT; see Section 18.2.7.
14.5.3.2 Computational Methodologies
14.5.3.2.1 General
Flow through bridges may be computed using a one-dimensional or a two-dimensional model. A one-dimensional approach determines the flow rate through the bridge based on the water surface elevations at the upstream and downstream sides of the structure assuming steady, gradually varied flow conditions. In practice, most analyses are performed using one-dimensional methods. Although one-dimensional methods are adequate for most applications, these methods cannot always provide the most accurate determination across the floodplain of water surface elevations, flow velocities or flow distribution. Where conditions at the site depart significantly from steady, gradually varied flow conditions, a two-dimensional model should be considered. Candidate sites for a two-dimensional analysis include:
South Dakota Drainage Manual Bridge Hydraulics
14-28
• wide floodplains with multiple openings, particularly on skewed embankments;
• floodplains with significant variations in roughness or complex geometry (e.g., ineffective flow areas, flow around islands, multiple channels);
• sites where more accurate flow patterns and velocities are needed to design more cost-effective countermeasures (e.g., riprap along embankments, abutments); and
• high-risk or sensitive locations where losses and liability costs are high.
No single method is ideally suited for all situations. If a satisfactory computation cannot be achieved with a given method, an alternative method should be attempted. However, with careful attention to the setup requirements of each method, essentially duplicative results can usually be achieved. See Section 18.2.7 for one-dimensional and two-dimensional software approved by SDDOT for the hydraulic analysis of a bridge waterway opening.
14.5.3.2.2 One-Dimensional Modeling
A one-dimensional model uses floodplain cross sections to reflect the terrain, obstructions placed in the waterway and how these affect the flow. In these models, one of the underlying assumptions is that the flow is perpendicular to the cross section. Depending on the terrain and the obstructions, these cross sections may or may not be straight, parallel or perpendicular to the stream. The cross sections should be drawn to reflect what the water will “see” as it travels downstream. Care should be taken to reflect the effective and ineffective flow areas. Water surface profiles are computed using traditional energy equation methods, with the hydraulic designer selecting the appropriate loss calculation procedure.
14.5.3.2.3 Two-Dimensional Modeling
A two-dimensional model is more complex, is generally more costly, and requires more data collection and time to set up and calibrate. Although they require essentially the same basic data as a one-dimensional model, two-dimensional models require more than a few widely spaced cross sections. Sufficient data to generate a three-dimensional surface of the area should be collected to accurately reflect all potential features that may impact the flow.
14.5.3.2.4 Physical Modeling
Complex flow patterns may defy accurate or practical mathematical modeling. Physical models should be considered when hydraulic data is needed that cannot be reliably
South Dakota Drainage Manual Bridge Hydraulics
14-29
obtained from mathematical modeling; the risk of failure or excessive over-design is unacceptable; or additional research is needed.
The constraints on physical modeling are considerable. There are a limited number of facilities that are available to build and evaluate the large-scale models necessary. The added costs for construction and evaluation of the model plus the time needed may be prohibitive.
14.5.3.3 Waterway Enlargement
There are situations where roadway and structural constraints dictate the vertical positioning of a bridge and result in a small vertical clearance between the low chord and the ground. In these cases, significant increases in span length provide only small increases in effective waterway opening.
Although it is possible to increase the effective area by excavating a flood channel through the reach affecting the hydraulic performance of the bridge, this approach should be used with caution. Appropriate measures are necessary to assure that the modified opening is stable and will not be subject to the accumulation of sediment that will reduce the effectiveness of the opening. The following factors should be considered before this action is taken (see Reference (2)), including:
• The stream power (lb/ft-sec) in the new channel should be approximately the same as in the old channel.
• The modified floodplain and channel modifications must extend far enough upstream and downstream of the bridge to establish the desired flow regime through the affected reach.
• The cost of mitigating any potential environmental impacts must be considered.
South Dakota Drainage Manual Bridge Hydraulics
14-30
14.6 BRIDGE SCOUR
14.6.1 Introduction
FHWA Technical Advisory (TA 5140.23), October 1991 (Reference (11)) requires a scour evaluation for existing and proposed bridges over waterways. Refer to HEC 18 (Reference (12)) for a thorough discussion on scour and scour prediction methodology. Refer to HEC 23 (Reference (13)) for a discussion on designs for scour countermeasures.
After the bridge waterway opening has been established, the hydraulic designer must evaluate the estimated scour that will occur at each of the bridge elements. This Section discusses this evaluation in detail. For most bridges, pier scour will be accommodated by adjusting the pier design in cooperation with the geotechnical and structural engineers, and abutment scour will be mitigated with countermeasures. However, the most cost-effective design may be to modify the opening to reduce the amount of scour or the cost of the scour countermeasures. Considerable judgment will be necessary to make this determination.
The evaluation and design of a highway stream crossing or encroachment should begin with a qualitative assessment of stream stability (see Section 14.4).
Less hazardous to the bridge structure, but still a consideration, are problems associated with aggradation. Where aggradation is expected, it will be necessary to evaluate the impacts. Where freeboard is limited, problems associated with increased flood hazards to upstream property or to the traveling public due to more frequent overtopping may occur.
A determination of historical scour at existing structures may be accomplished from bridge inspection reports or by a geotechnical evaluation that may identify a difference between local materials and the materials that were deposited in the scour hole after a flood event.
Designers are cautioned that HEC-RAS scour computations should be used only as a check of manual calculations.
14.6.2 General Considerations
The hydraulic designer must perform the following:
• Degradation or aggradation of the river and contraction and local scour should be estimated, and appropriate positioning of the foundation, below the total scour depth if practical, should be included as part of the final design.
• Pier spacing and orientation and abutment alignment and shape should be designed to minimize flow disruption and potential scour.
South Dakota Drainage Manual Bridge Hydraulics
14-31
• Pier foundations should be designed to avoid failure by scour without the aid of countermeasures.
• Abutment foundations should be designed to avoid failure due to scour but may employ countermeasures such as described in HEC 23 (Reference (13)) where extending the foundations is either cost prohibitive or not practical.
14.6.3 Flood Magnitudes
First, evaluate the proposed bridge and road geometry for scour using the 100-year flood or flood that provides the greatest discharge through the bridge opening prior to overtopping. The foundation will be designed using the conventional foundation safety factors and eliminating consideration of any streambed and bank material displaced by scour for foundation support.
Second, impose the 500-year flood on the proposed bridge and road geometry. This event should be used to evaluate the proposed bridge opening to ensure that the resulting potential scour will produce no unexpected scour hazards. The foundation design based on the base flood or flood that would create the maximum scour depth will then be reviewed by the geotechnical and structural engineers using a safety factor of 1.0 and considering any streambed and bank material displaced by scour from the 500-year flood.
14.6.4 Scour Types
HEC 18 (Reference (12)) recommends that bridge scour be evaluated as interrelated components:
• long-term profile changes (aggradation/degradation), • contraction scour, and • local scour (pier and abutment).
14.6.4.1 Long-Term Profile Changes
Long-term profile changes can occur from aggradation and/or degradation. Aggradation is the deposition of bed load due to a decrease in stream sediment transport capacity that results from a reduction in the energy gradient or an increase in the sediment load. Aggradation also frequently occurs in reservoir situations (see Section 13.11.2). Degradation is the scouring of bed material due to increased stream sediment transport capacity that results from an increase in the energy gradient or a decrease in the sediment load. When and where they can be identified, degradation or aggradation should be considered as imposing a permanent future change for the stream bed
South Dakota Drainage Manual Bridge Hydraulics
14-32
elevation at a bridge site (see Reference (6)). For most bridges, this determination will be made as a part of the stream stability assessment (see Section 14.4.2).
14.6.4.2 Contraction
Contraction scour results from a constriction of the flow area caused by approach fills in the floodplain or, to a lesser extent, by bridge piers in the waterway. Highways, bridges and natural channel contractions are the most commonly encountered cause of contraction scour.
14.6.4.3 Local Scour
All abutments and piers located within the flood-flow prism increase the potential scour hazard at a bridge site. The amount of potential scour caused by these features is termed local scour. Local scour is a function of the geometry of these features as they relate to the flow geometry. However, the importance of these geometric variables will vary. As an example, increasing the pier or cofferdam width either through design or debris accumulation will increase the amount of local scour, but only up to a point in subcritical flow streams. After reaching this point, pier scour should not be expected to measurably increase with increased stream velocity or depth. This threshold has not been defined in the rarer, supercritical flowing streams.
14.6.5 Natural Armoring
Armoring occurs because a stream or river is unable, during a particular flood, to move the more coarse material comprising either the bed or, if some bed scour occurs, the underlying material. Scour may occur initially but later become arrested by armoring before the full scour potential is reached for a given flood magnitude. When armoring does occur, the coarser bed material will tend to remain in place or quickly redeposit to form a layer of riprap-like armor on the streambed or in the scour holes and thus limit further scour for a particular discharge. This armoring effect can decrease scour hole depths that were predicted based on formulae developed for sand or other fine-material channels for a particular flood magnitude. When a larger flood occurs than used to define the probable scour hole depths, scour will probably penetrate deeper until armoring again occurs at some lower threshold.
If armoring of the streambed occurs, there may be a tendency for the stream to widen its banks to maintain continuity of sediment transport. This could result in an unstable, braided regime. Such instabilities may pose serious problems for bridges because they encourage further, difficult-to-assess plan-form changes. Also, the effect of bank widening is to spread the approach flow distribution that, in turn, results in a more severe bridge opening contraction.
South Dakota Drainage Manual Bridge Hydraulics
14-33
Typically, SDDOT does not consider natural armoring; however, if armoring will be considered in the scour evaluation, obtain bed material samples for all channel cross sections in the vicinity of the crossing to be evaluated.
14.6.6 Scour-Resistant Materials
Use caution when determining the scour resistance of bed materials and the underlying strata. With sand size material, the passage of a single flood may result in the predicted scour depths. Conversely, in scour-resistant material including bedrock, the maximum predicted depth of scour may not be realized during the passage of a particular flood; however, some scour-resistant material may be lost. Commonly, this material is replaced with more easily scoured material. Thus, at some later date, another flood may reach the predicted scour depth. Serious scour has been observed to occur in materials commonly perceived to be scour resistant such as consolidated soils and glacial till, so-called bedrock streams and streams with gravel and boulder beds. The designer in consultation with the geotechnical engineer must assess if the bed material will scour during the life of the structure or will be scour-resistant (i.e., rock like). FHWA guidance on the “Scourability of Rock Formations” is found in a FHWA 1991 memorandum (see Reference (14)). NCHRP 24-29 Scour at Bridge Foundations on Rock may provide additional guidance.
14.6.7 Cumulative Scour Analysis
Before the various scour forecasting methods for contraction and local scour can be applied:
• First, determine the fixed-bed channel hydraulics. • Second, estimate the profile and plan-form scour or aggradation or degradation. • Third, adjust the fixed-bed hydraulics to reflect these changes. • Fourth, compute the bridge hydraulics. To obtain total scour, the potential local scour is added to the contraction scour without considering the effects of contraction scour on the channel and bridge hydraulics. This is considered a conservative practice, because it assumes that the scour components develop independently.
14.6.8 Pressure Flow Scour
Pressure flow, which is also known as orifice flow, occurs when the water surface elevation at the upstream face of the bridge is greater than or equal to the low chord of the bridge superstructure. Pressure flow under the bridge results from a buildup of water on the upstream bridge face and a plunging of the flow downward and under the bridge. At higher approach flow depths, the bridge can be entirely submerged with the
South Dakota Drainage Manual Bridge Hydraulics
14-34
resulting flow being a complex combination of the plunging flow under the bridge and the flow over the bridge.
With pressure flow, the local scour depths at a pier or abutment are larger than for free surface flow with similar depths and approach velocities. The increase in local scour at a pier that is subject to pressure flow results from the flow being directed downwards, toward the bed, by the superstructure and by increasing the intensity of the horseshoe vortex. The vertical contraction of the flow is a more significant cause of the increase in scour depth. However, in many cases, when a bridge becomes submerged, the average velocity under it is reduced due to a reduction of discharge that must pass under the bridge as a result of weir flow over the bridge and approach embankments. As a consequence, increases in local scour attributed to pressure flow scour at a particular site may be offset to a degree. The effects of this type of condition should be reflected in the design process. Refer to HEC 18 (Reference (12)) or Reference (15) for more information pertaining to pressure flow scour.
14.6.9 Scour Countermeasures
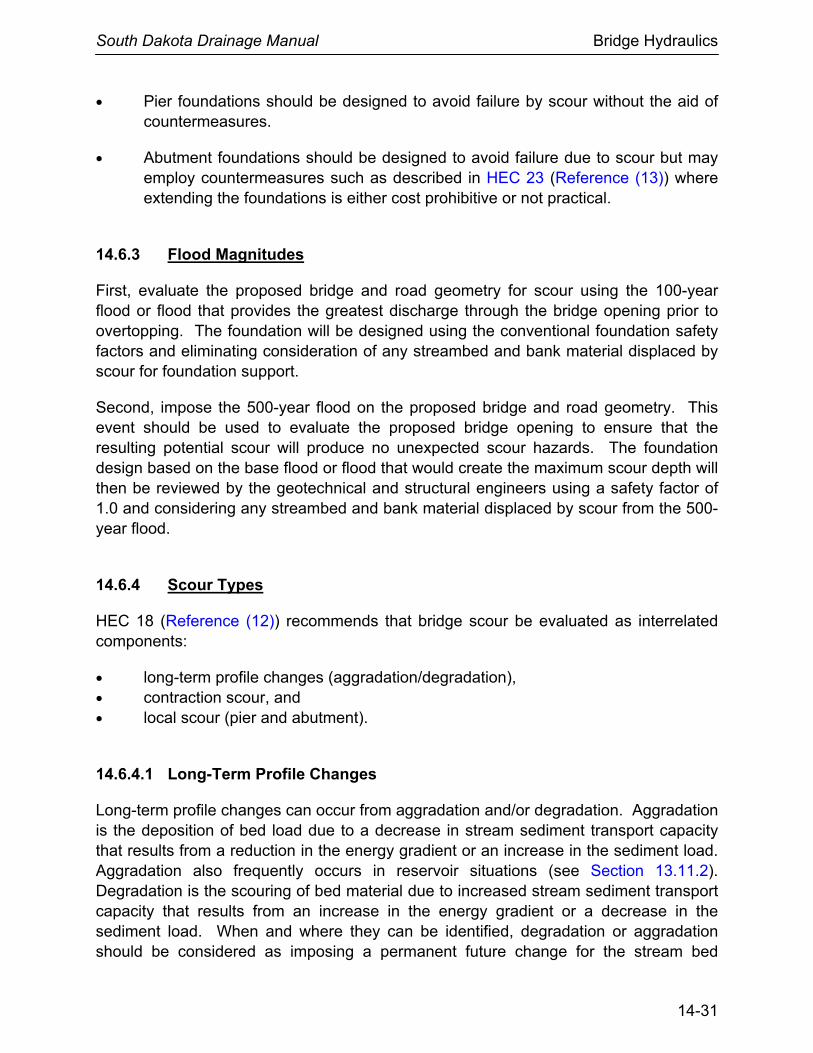
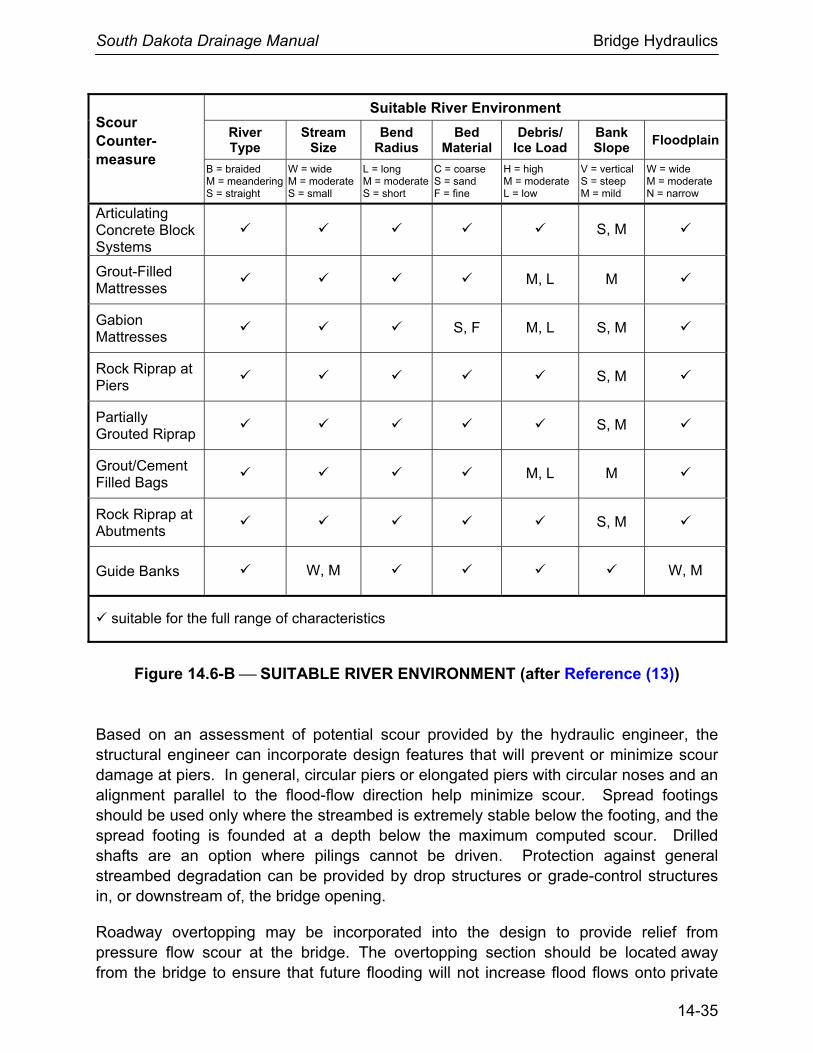
HEC 23 Bridge Scour and Stream Instability Countermeasures (Reference (13)) provides documentation on countermeasures that have been used in highway applications. Figure 14.6-A lists potential scour countermeasures from HEC 23. Figure 14.6-B provides the HEC 23 assessment of the suitability of these methods for various river environments. Countermeasures for channel instability are discussed in Section 15.9.
Scour Countermeasure HEC 23
Design Guideline
Articulating Concrete Block Systems at Bridge Piers DG 8 (p. 8.21)
Grout-Filled Mattresses at Bridge Piers DG 9 (p. 9.11)
Gabion Mattresses at Bridge Piers DG 10 (p. 10.13)
Rock Riprap at Bridge Piers DG 11
Partially Grouted Riprap at Bridge Piers DG 12
Grout/Cement Filled Bags (primarily abutments) DG 13
Rock Riprap at Bridge Abutments (see Appendix 14.C) DG 14
Guide Banks (abutments/embankments) DG 15
Figure 14.6-A ⎯ SCOUR PROTECTION METHODS (after Reference (13))
South Dakota Drainage Manual Bridge Hydraulics
14-35
Scour Counter-measure
Suitable River Environment
River Type
Stream Size
Bend Radius
Bed Material
Debris/ Ice Load
Bank Slope
Floodplain
B = braided M = meandering S = straight
W = wide M = moderate S = small
L = long M = moderateS = short
C = coarse S = sand F = fine
H = high M = moderate L = low
V = vertical S = steep M = mild
W = wide M = moderate N = narrow
Articulating Concrete Block Systems
S, M
Grout-Filled Mattresses
M, L M
Gabion Mattresses
S, F M, L S, M
Rock Riprap at Piers
S, M
Partially Grouted Riprap
S, M
Grout/Cement Filled Bags
M, L M
Rock Riprap at Abutments
S, M
Guide Banks W, M W, M
suitable for the full range of characteristics
Figure 14.6-B ⎯ SUITABLE RIVER ENVIRONMENT (after Reference (13))
Based on an assessment of potential scour provided by the hydraulic engineer, the structural engineer can incorporate design features that will prevent or minimize scour damage at piers. In general, circular piers or elongated piers with circular noses and an alignment parallel to the flood-flow direction help minimize scour. Spread footings should be used only where the streambed is extremely stable below the footing, and the spread footing is founded at a depth below the maximum computed scour. Drilled shafts are an option where pilings cannot be driven. Protection against general streambed degradation can be provided by drop structures or grade-control structures in, or downstream of, the bridge opening.
Roadway overtopping may be incorporated into the design to provide relief from pressure flow scour at the bridge. The overtopping section should be located away from the bridge to ensure that future flooding will not increase flood flows onto private
South Dakota Drainage Manual Bridge Hydraulics
14-36
property that were not previously impacted. Streams with wide floodplains are often good candidates for incorporating roadway overtopping adjustments into the design because flow is less likely to be diverted into another drainage.
For large drainages with adverse channel skew angles and/or encroachments into wide floodplains, guide banks are recommended to align the approach flow with the bridge opening and to prevent scour around the abutments. Guide banks are usually elliptical in shape with a major to minor axis ratio of 2.5 to 1. A length of approximately 150 ft provides a satisfactory standard design. Their length can be determined using information in HEC 23 (Reference (13)). Guide banks, embankments and abutments should be protected by rock riprap with a filter blanket or other revetments approved by SDDOT.
Where stone of sufficient size is available, rock riprap is often used to armor abutment fill slopes and the area around the base of existing piers. Riprap design information is presented in HEC 23 (Reference (13)). Rock riprap and gabions for channel applications is covered in Chapter 15. The HEC 23 Design Guideline 14 “Rock Riprap at Bridge Abutments” is included as Appendix 14.D.
Where possible, clearing of vegetation upstream and downstream of the toe of the embankment slope should be avoided. Riprap placement techniques can be specified in construction plan notes to diminish disturbance to natural vegetation and to provide well-graded material.
For existing scour-critical bridges, monitoring and closing a bridge during high flows and subsequent inspections after the flood may be an effective countermeasure to reduce the risk to the traveling public. However, this does not reduce the risk of collapse of the bridge due to scour. The monitoring approach should be carefully considered based on traffic volumes, emergency vehicle routes and available alternative routes. If monitoring is selected as the countermeasure option, a location-specific Plan of Action (POA) should be developed to ensure that the appropriate actions are taken when the target flood elevations are reached (see Reference (11)). If scour monitoring instrumentation is proposed, consult HEC 23, Chapter 9 (Reference (13)).
14.6.10 Case Studies
Appendices provide the following case studies for estimating bridge scour:
• Appendix 14.A – Comprehensive example from the FHWA NHI Course 135046 - Stream Stability and Scour at Highway Bridges (Reference (16)).
• Appendix 14.B – Single-span example for a South Dakota specific site.
The case studies illustrate the application of the recommended equations from HEC 18 (Reference (12)), which is the edition that is referenced in HEC-RAS (Reference (17)).
South Dakota Drainage Manual Bridge Hydraulics
14-37
14.7 DECK DRAINAGE
This Section provides guidelines and procedures for designing bridge deck drainage systems. SDDOT design practices for the system components are discussed. The Section references the governing criteria that determine the hydraulic design of the system (e.g., design flood frequency, allowable water spread). For additional guidance, see HEC 21 Design of Bridge Deck Drainage (Reference (18)).
14.7.1 Importance of Bridge Deck Drainage
The bridge deck drainage system includes the bridge deck, sidewalks, railings, gutters and inlets (or scuppers). The primary objective of the drainage system is to remove runoff from the bridge deck before it collects in the gutter to a point that exceeds the allowable design spread. Proper bridge deck drainage provides many other benefits, including:
• Efficiently removing water from the bridge deck enhances public safety by decreasing the risk of hydroplaning.
• Long-term maintenance of the bridge is enhanced.
• The structural integrity of the bridge is preserved.
• Aesthetics are enhanced (e.g., the avoidance of staining substructure and superstructure members).
• Erosion on bridge end slopes is reduced.
14.7.2 SDDOT Responsibilities
The following Sections outline the responsibilities of SDDOT engineers with respect to bridge deck drainage.
14.7.2.1 Design of Deck Drainage System
The hydraulic engineer:
• calculates the flow of water on the deck based on the design frequency,
• selects the type of deck drain, and
• determines the hydraulic inlet spacing on the bridge deck to intercept the calculated flow to meet the allowable water spread criteria.
South Dakota Drainage Manual Bridge Hydraulics
14-38
The bridge designer incorporates the drainage design information into the structural design of the bridge plans.
14.7.2.2 Bridge End Drainage
The Road Design Office is responsible for the drainage design for any runoff approaching or leaving the bridge deck.
14.7.3 Design Considerations (Open Drainage)
14.7.3.1 Type of Drainage System
SDDOT generally uses an open drainage system for its bridge decks. Normally, 4-in diameter scuppers are used; however, larger drains may be used as required.
14.7.3.2 Deck Slope
To provide proper bridge deck drainage, the absolute minimum longitudinal gradient is 0.2%; preferably, the longitudinal gradient will not be less than 0.5%. The transverse drainage of the bridge deck must be accommodated by providing a suitable roadway cross slope, typically 2%.
14.7.3.3 Sag Vertical Curves
If practical, no portion of a bridge should be located in a sag vertical curve. If the bridge is located in a sag, the low point of the sag should not be located on the bridge or the approach slab. The low point should be located a minimum of 10 ft from the end of the approach slab or, if approach slabs are not used, a minimum of 10 ft from the end of the bridge.
14.7.3.4 Downspouts
Downspouts, where used, should be of a rigid, corrosion-resistant material not less than a 4-in inside diameter pipe. The bridge designer should consider the following when locating downspouts:
1. Location With Respect To Structural Elements. Downspouts typically extend below structural elements. Downspouts should not be located within 5 ft of the end of any substructure units or where water could easily blow over and run down a substructure element. Downspouts should not be located such that a 45° cone of splash beneath the downspout will touch any structural component.
South Dakota Drainage Manual Bridge Hydraulics
14-39
Downspouts should not encroach upon the required vertical or horizontal clearances.
2. Location With Respect To Ground. A free fall exceeding 25 ft will sufficiently disperse the falling water so that minimal erosion damage will occur beneath the bridge. Where less than 25 ft of free fall is available, erosion protection on natural ground beneath the outlet may be needed. Where the water free falls onto riprap or flowing water, free falls less than 25 ft are acceptable.
3. Railroads. Downspouts are not allowed over Railroad right-of-way unless otherwise agreed to by the Railroad.
4. Other Exclusions. Avoid locating downspouts over the traveled way portion of an underpassing highway, sidewalk or unpaved embankment.
14.7.3.5 Maximum Length of Bridge Without Inlets
On a continuous grade, the maximum bridge length that requires no bridge deck drainage inlets can be determined. In other words, the drainage basin area (i.e., the bridge deck) will not generate a sufficient runoff to produce a gutter flow that, at any point, exceeds the allowable water spread on the bridge deck.
The designer should use the following equation and the known site conditions to determine if drainage inlets are needed or if the bridge length is short enough to design the bridge without drainage inlets:
CniW
)T)(S)(S(6.393,24L
67.25.067.1x= (Equation 14.1)
where: L = maximum allowable bridge length without drainage inlets, ft S = longitudinal slope, ft/ft Sx = cross slope, ft/ft W = width of drained deck*, ft C = runoff coefficient** i = rainfall intensity, in/hour n = Manning’s n** T = maximum allowable spread, ft * For normal crown cross sections, this distance is typically measured from the centerline of bridge to
the outside edge of deck or barrier, whichever controls. For a fully superelevated cross section, this distance is measured between the outside edges of deck or barrier.
** For typical decks, C = 0.9 and n = 0.016.
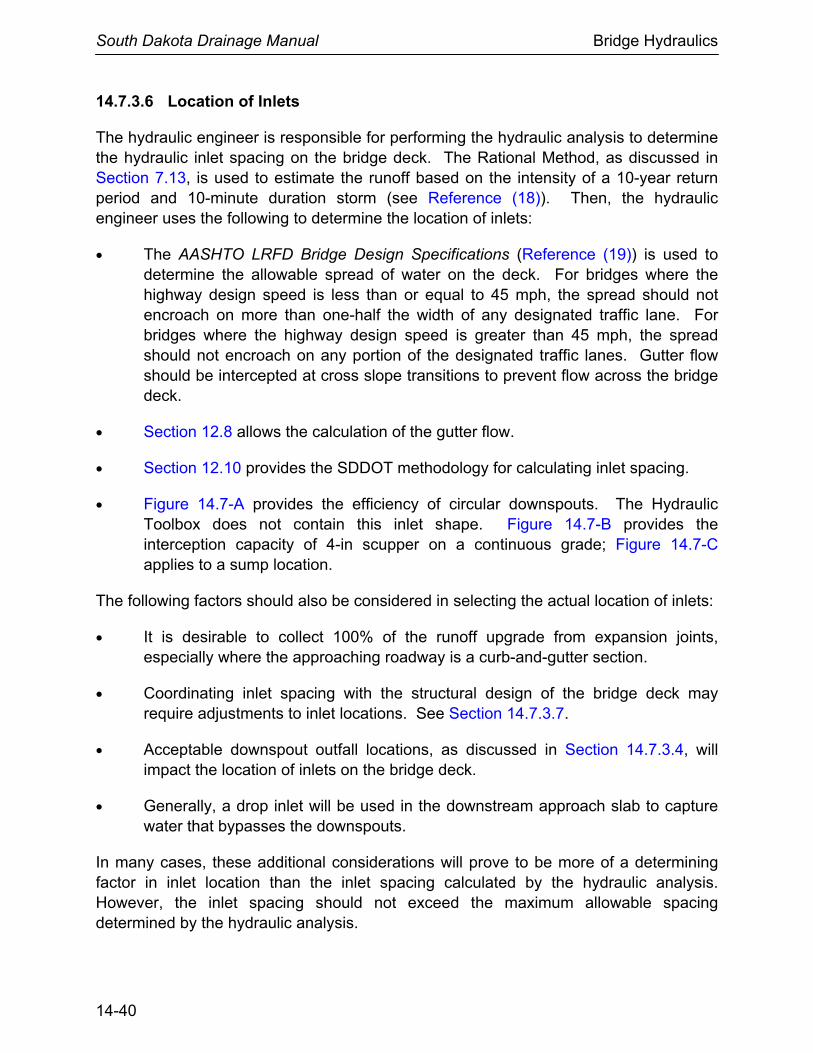
South Dakota Drainage Manual Bridge Hydraulics
14-40
14.7.3.6 Location of Inlets
The hydraulic engineer is responsible for performing the hydraulic analysis to determine the hydraulic inlet spacing on the bridge deck. The Rational Method, as discussed in Section 7.13, is used to estimate the runoff based on the intensity of a 10-year return period and 10-minute duration storm (see Reference (18)). Then, the hydraulic engineer uses the following to determine the location of inlets:
• The AASHTO LRFD Bridge Design Specifications (Reference (19)) is used to determine the allowable spread of water on the deck. For bridges where the highway design speed is less than or equal to 45 mph, the spread should not encroach on more than one-half the width of any designated traffic lane. For bridges where the highway design speed is greater than 45 mph, the spread should not encroach on any portion of the designated traffic lanes. Gutter flow should be intercepted at cross slope transitions to prevent flow across the bridge deck.
• Section 12.8 allows the calculation of the gutter flow.
• Section 12.10 provides the SDDOT methodology for calculating inlet spacing.
• Figure 14.7-A provides the efficiency of circular downspouts. The Hydraulic Toolbox does not contain this inlet shape. Figure 14.7-B provides the interception capacity of 4-in scupper on a continuous grade; Figure 14.7-C applies to a sump location.
The following factors should also be considered in selecting the actual location of inlets:
• It is desirable to collect 100% of the runoff upgrade from expansion joints, especially where the approaching roadway is a curb-and-gutter section.
• Coordinating inlet spacing with the structural design of the bridge deck may require adjustments to inlet locations. See Section 14.7.3.7.
• Acceptable downspout outfall locations, as discussed in Section 14.7.3.4, will impact the location of inlets on the bridge deck.
• Generally, a drop inlet will be used in the downstream approach slab to capture water that bypasses the downspouts.
In many cases, these additional considerations will prove to be more of a determining factor in inlet location than the inlet spacing calculated by the hydraulic analysis. However, the inlet spacing should not exceed the maximum allowable spacing determined by the hydraulic analysis.
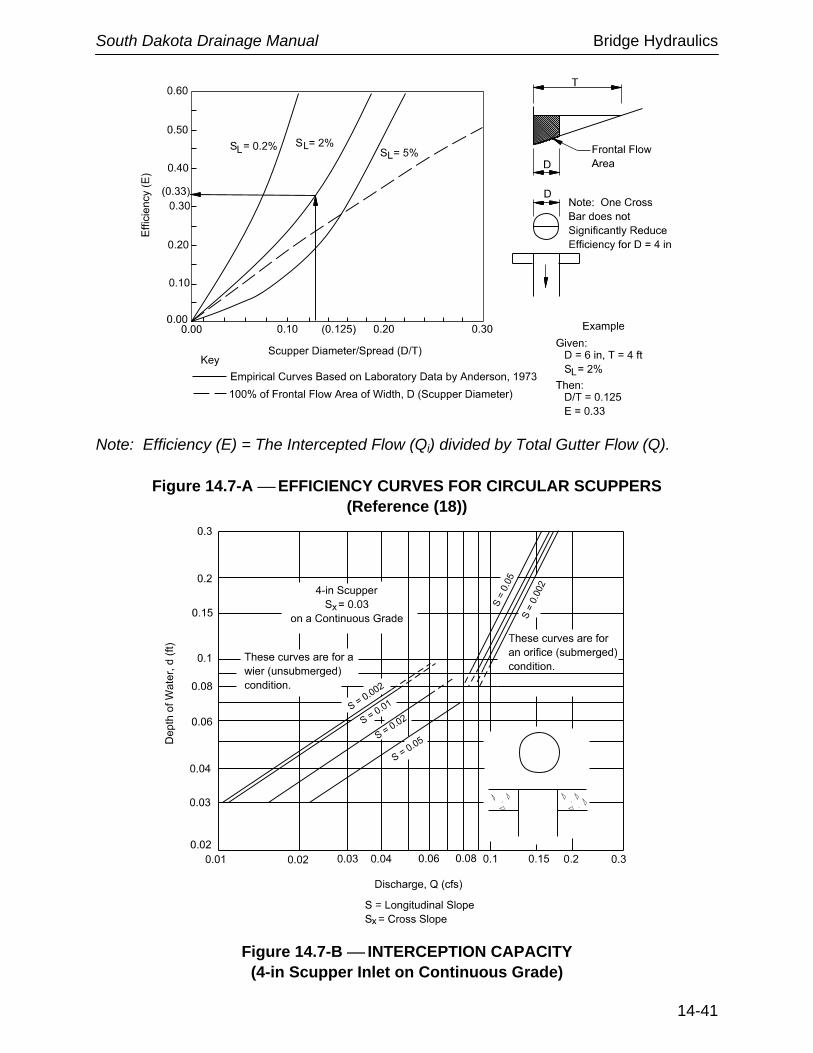
South Dakota Drainage Manual Bridge Hydraulics
14-41
Note: Efficiency (E) = The Intercepted Flow (Qi) divided by Total Gutter Flow (Q).
Figure 14.7-A EFFICIENCY CURVES FOR CIRCULAR SCUPPERS (Reference (18))
Figure 14.7-B INTERCEPTION CAPACITY (4-in Scupper Inlet on Continuous Grade)
South Dakota Drainage Manual Bridge Hydraulics
14-42
Figure 14.7-C ⎯ INTERCEPTION CAPACITY (4-in Scupper Inlet in Sump Locations)
14.7.3.7 Structural Considerations
The primary structural considerations in drainage system design are:
1. Coordination with Reinforcement. Inlet sizing and placement must be compatible with the structural reinforcement and other components of a bridge.
2. Corrosion and Erosion. The drainage system should be designed to deter runoff (and the associated corrosives) from contacting vulnerable structural members and to minimize the potential for eroding embankments. To avoid corrosion and erosion, the design must include the proper placement of outfalls. In addition, water should be prevented from running down the joint between the approach roadway and bridge and thereby undermining an abutment or wing wall.
14.7.3.8 Maintenance Considerations
The drainage system will not function properly if it becomes clogged with debris. Therefore, maintenance requirements should be considered in the design. The bridge designer should avoid drainage designs that provide inadequate room for maintenance
South Dakota Drainage Manual Bridge Hydraulics
14-43
personnel on the bridge deck or access beneath the bridge or that provide unsafe working areas for maintenance personnel.
14.7.3.9 Bridge End Drainage
Good drainage design at the ends of bridges is essential for proper drainage. At bridge ends where the approach roadway does not have curb and gutter, the typical Department practice is to use an asphalt flume. If the asphalt flume is not appropriate, an alternative design must be used to accommodate the runoff. In addition to an asphalt flume, bridge end drainage may be designed with grate inlets, curb opening inlets or combination inlets.
The hydraulic characteristics of the inlets should be considered in selecting the type. Inlets on the bridge should be spaced to minimize runoff entering and exiting the bridge approaches. Collectors at the downslope end of the bridge should be designed to collect all of the flow not intercepted by the bridge deck inlets. If there are no bridge deck inlets, downslope inlets should be provided to intercept all of the bridge drainage. Pipe should be used to transport the water down the surface of the embankment.
At bridge ends where the approach roadway has curb and gutter, catch basins should be detailed as close as possible to the approach slabs.
South Dakota Drainage Manual Bridge Hydraulics
14-44
14.8 REFERENCES
(1) AASHTO, Drainage Manual, Chapter 10, “Bridges,” AASHTO Technical Committee on Hydrology and Hydraulics, 2009 (draft).
(2) AASHTO, Highway Drainage Guidelines, Chapter 7, Hydraulic Analysis for the Location and Design of Bridges, AASHTO Technical Committee on Hydrology and Hydraulics, 4th Edition, 2005.
(3) Clarkin, Kim; Keller, Gordon; Warhol, Terry; Hixson, Suzan, Low-Water Crossings: Geomorphic, Biological, and Engineering Design Considerations, 0625 1808P, San Dimas, CA: US Department of Agriculture, US Forest Service, San Dimas Technology and Development Center, 366 p., 2006.
(4) Corry, M.L., Jones, J.S. and Thompson, P.L., Design of Encroachments on Floodplains Using Risk Analysis, Hydraulic Engineering Circular No. 17, Federal Highway Administration, Washington DC, 1981.
(5) Federal Highway Administration, River Engineering for Highway Encroachments — Highways in the River Environment, Hydraulic Design Series No. 6, FHWA-NHI-01-004, December 2001.
(6) Federal Highway Administration, Stream Stability at Highway Structures, Hydraulic Engineering Circular No. 20, Third Edition, FHWA-NHI-01-002, 2001.
(7) National Cooperative Highway Research Program, Handbook for Predicting Stream Meander Migration and Supporting Software, NCHRP Report 533, 2004.
(8) Davidian, J., Computation of Water Surface Profiles in Open Channels, Techniques of Water Resources Investigation, Book 3, Chapter A15, US Geological Survey, Washington DC, 1984.
(9) Arcement, G. J., Jr., and V. R. Schneider, Guide for Selecting Manning’s Roughness Coefficients for Natural Channels and Flood Plains, Water Supply Paper 2339, 1984 (also published as FHWA-TS-84-204), 1984.
(10) Barnes, H. H., Jr., Roughness Characteristics of Natural Channels, US Geological Survey Water Supply Paper 1849, Washington DC, 1978.
(11) Federal Highway Administration, Technical Advisory (TA 5140.23), “Evaluating Scour at Bridges,” October 28, 1993.
(12) Federal Highway Administration, Evaluating Scour at Bridges, Hydraulic Engineering Circular No. 18, FHWA-NHI-01-001, 2001.
(13) Federal Highway Administration, Bridge Scour and Stream Instability Countermeasures: Experience, Selection and Design Guidance - Third Edition,
South Dakota Drainage Manual Bridge Hydraulics
14-45
Hydraulic Engineering Circular No. 23, FHWA-NHI-09-011 (Volume 1), FHWA-NHI-09-012 (Volume 2 “Design Guidelines”), 2009.
(14) Federal Highway Administration, Scourability of Rock Formations, July 19, 1991.
(15) Arneson, L.A. and S.R. Abt, Vertical Contraction Scour at Bridges with Water Flowing Under Pressure Conditions, ASCE Compendium, Stream Stability and Scour at Highway Bridges, Richardson and Lagasse (eds.), Reston, VA, 1999.
(16) Federal Highway Administration, National Highway Institute, Course 135046, Stream Stability and Scour at Highway Bridges - Participant's Workbook, January 2005.
(17) US Army Corps of Engineers, HEC-RAS River Analysis System, User’s Manual, The Hydrologic Engineering Center, Davis, CA, Version 4.1, 2010.
(18) Federal Highway Administration, Bridge Deck Drainage System, Hydraulic Engineering Circular No. 21, FHWA-SA-92-010, 1993.
(19) AASHTO, LRFD Bridge Design Specifications, Fifth Edition, Section 2: General Design and Location Features, 2010.
South Dakota Drainage Manual Bridge Hydraulics
14-46
Appendix 14.A
CASE STUDY FOR ESTIMATING BRIDGE SCOUR
The following case study is taken from the FHWA NHI course 135046 Stream Stability and Scour at Highway Bridges. The case study illustrates the application of the recommended equations from HEC 18 (2001), which is the edition that is used in the course and that is referenced in HEC-RAS. When FHWA updates HEC 18 and the NHI workshop, a new or revised case study can easily be substituted for this Appendix. Chapter 8 of HEC 18 (2001) contains a different comprehensive case study that was computed with WSPRO in SI units. Appendix H includes a solution in US Customary Units.
This comprehensive example demonstrates how the various components of scour are interrelated. The example provides a road map that a new designer can follow to ensure that scour is correctly evaluated.
14.A.1 THE SITE
The location is a typical floodplain that is rural in nature that is crossed by an existing bridge. Part of the floodplain is in agricultural use and part in its natural condition. Figure 14.A-A shows the location of the bridge and surveyed cross sections. Figure 14.A-B is a photograph of the existing bridge. Figure 14.A-C shows the approach and bridge cross sections. Figure 14.A-D provides the details of the bridge.
14.A.2 SITE RECONNAISSANCE
14.A.2.1 Data Collection In addition to the cross sections noted above, the following data was collected prior to the field visit:
• Channel shifting identified • Reach slope ≅ 0.00045 ft/ft • Bed Material D84 = 4.5 mm • Bed Material D50 = 2.0 mm • Bed Material D16 = 0.62 mm • Bank Material D50 = 0.35 mm
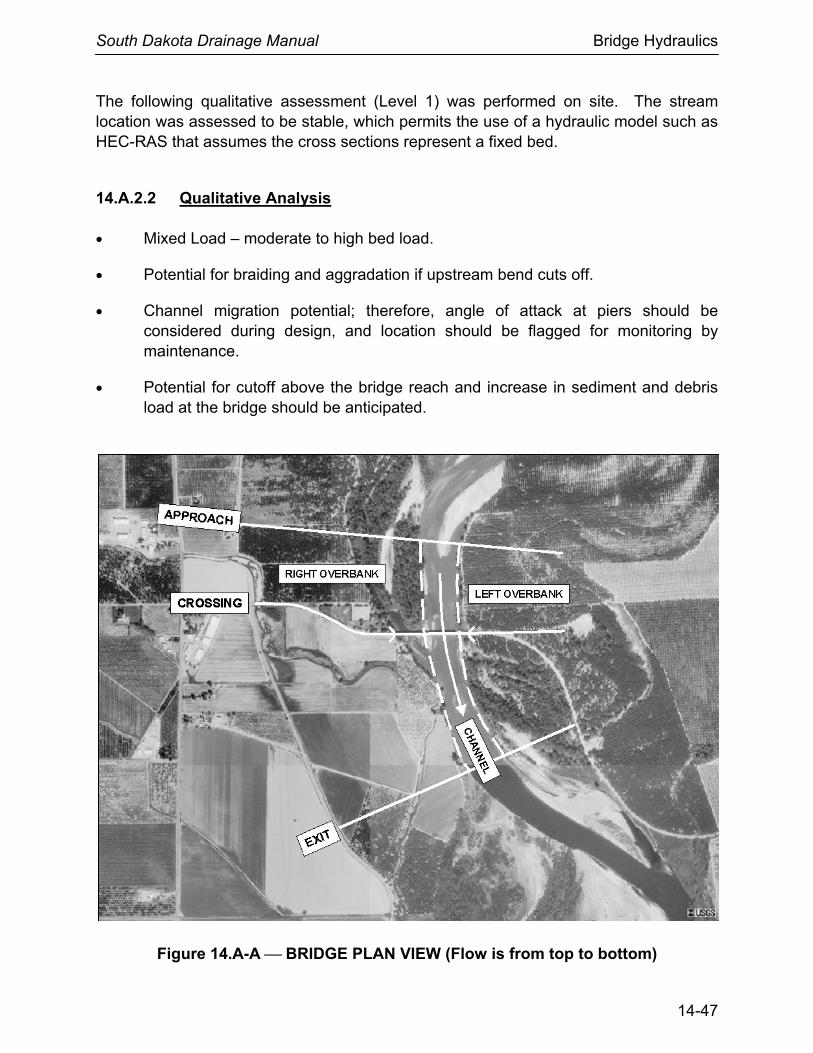
South Dakota Drainage Manual Bridge Hydraulics
14-47
The following qualitative assessment (Level 1) was performed on site. The stream location was assessed to be stable, which permits the use of a hydraulic model such as HEC-RAS that assumes the cross sections represent a fixed bed.
14.A.2.2 Qualitative Analysis • Mixed Load – moderate to high bed load.
• Potential for braiding and aggradation if upstream bend cuts off.
• Channel migration potential; therefore, angle of attack at piers should be considered during design, and location should be flagged for monitoring by maintenance.
• Potential for cutoff above the bridge reach and increase in sediment and debris load at the bridge should be anticipated.
Figure 14.A-A ⎯ BRIDGE PLAN VIEW (Flow is from top to bottom)
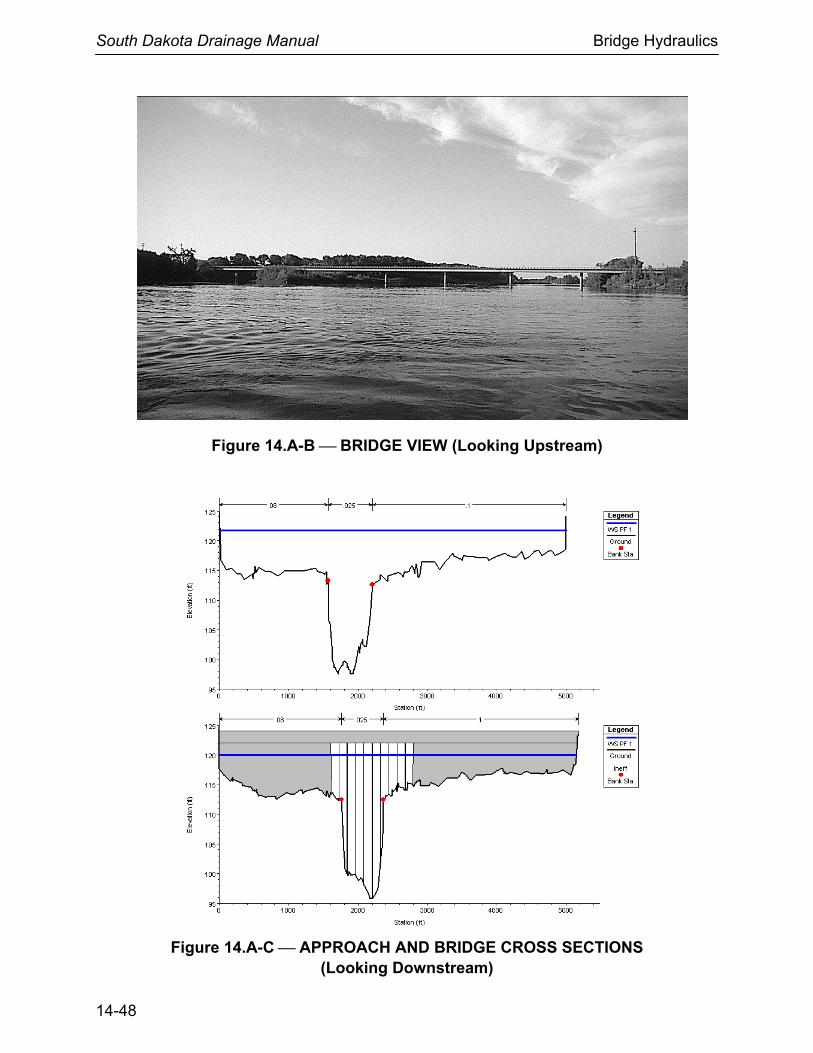
South Dakota Drainage Manual Bridge Hydraulics
14-48
Figure 14.A-B ⎯ BRIDGE VIEW (Looking Upstream)
Figure 14.A-C ⎯ APPROACH AND BRIDGE CROSS SECTIONS (Looking Downstream)
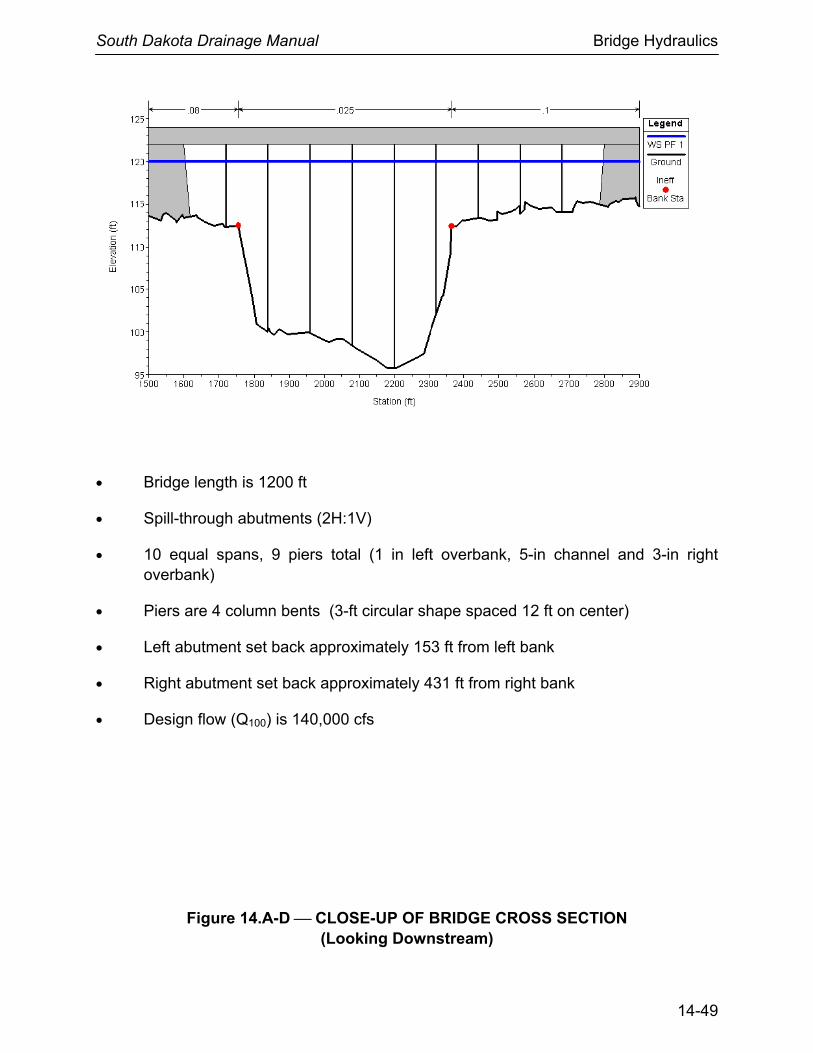
South Dakota Drainage Manual Bridge Hydraulics
14-49
• Bridge length is 1200 ft
• Spill-through abutments (2H:1V)
• 10 equal spans, 9 piers total (1 in left overbank, 5-in channel and 3-in right overbank)
• Piers are 4 column bents (3-ft circular shape spaced 12 ft on center)
• Left abutment set back approximately 153 ft from left bank
• Right abutment set back approximately 431 ft from right bank
• Design flow (Q100) is 140,000 cfs
Figure 14.A-D ⎯ CLOSE-UP OF BRIDGE CROSS SECTION (Looking Downstream)
South Dakota Drainage Manual Bridge Hydraulics
14-50
14.A.3 PROBLEM STATEMENT
Perform the scour computations for the Mainstream River Crossing near Ordbend, USA. Consider vertical and lateral instability based on the reconnaissance, classification and qualitative analyses.
Required Computations:
• Main channel contraction scour • Left overbank contraction scour • Right overbank contraction scour • Pier scour using maximum channel velocity (for zero and 15° angle of attack) • Left abutment scour using HIRE equation • Right abutment scour using HIRE equation • Plot total scour • Right abutment scour using Froehlich equation • Useful constants:
+ g = 32.2 ft/sec2 + ρ = 1.94 slugs/cu ft + γ = 62.4 lb/cu ft + 1 ft = 304.8 mm
Description of Data Tables: • There are three tables each for the “Approach” and “Bridge” sections.
• The first table is cross section total/average properties.
• The second table is subarea results (left overbank, channel and right overbank).
• The third table is flow (velocity and depth) distributions.
• The tables include information that is not needed, but the users should be able to find the required data easily in the tables.
• The flow distributions are also shown graphically.

South Dakota Drainage Manual Bridge Hydraulics
14-51
14.A.4 HYDRAULIC RESULTS
Approach Cross Section Average
Q Total (cfs) 140,000 E.G. Elev (ft) 122.66 W.S. Elev (ft) 121.74 Velocity Head (ft) 0.92 E.G. Slope (ft/ft) 0.000366 Top Width (ft) 4988 Velocity Total (fps) 3.62 Conveyance Total (cfs) 7,319,393
Bridge Cross Section Average Q Total (cfs) 140,000 E.G. Elev (ft) 121.84 W.S. Elev (ft) 119.96 Velocity Head (ft) 1.87 E.G. Slope (ft/ft) 0.000965 Top Width (ft) 1192 Velocity Total (fps) 9.05 Conveyance Total (cfs) 4,506,631
Approach Cross Section Subarea Results
Subarea Element Left
Overbank Channel
Right Overbank
Manning n 0.08 0.025 0.1 Flow (cfs) 13,898 112,989 13,113 Flow Area (sq ft) 10,735 13,228 14,661 Top Width (ft) 1555 637 2796 Average Velocity (fps) 1.29 8.54 0.89 Hydraulic Depth (ft) 6.90 20.77 5.24 Conveyance (cfs) 726,620 5,907,201 685,572 Wetted Perimeter (ft) 1557 642 2797 Shear (lb/sq ft) 0.16 0.47 0.12
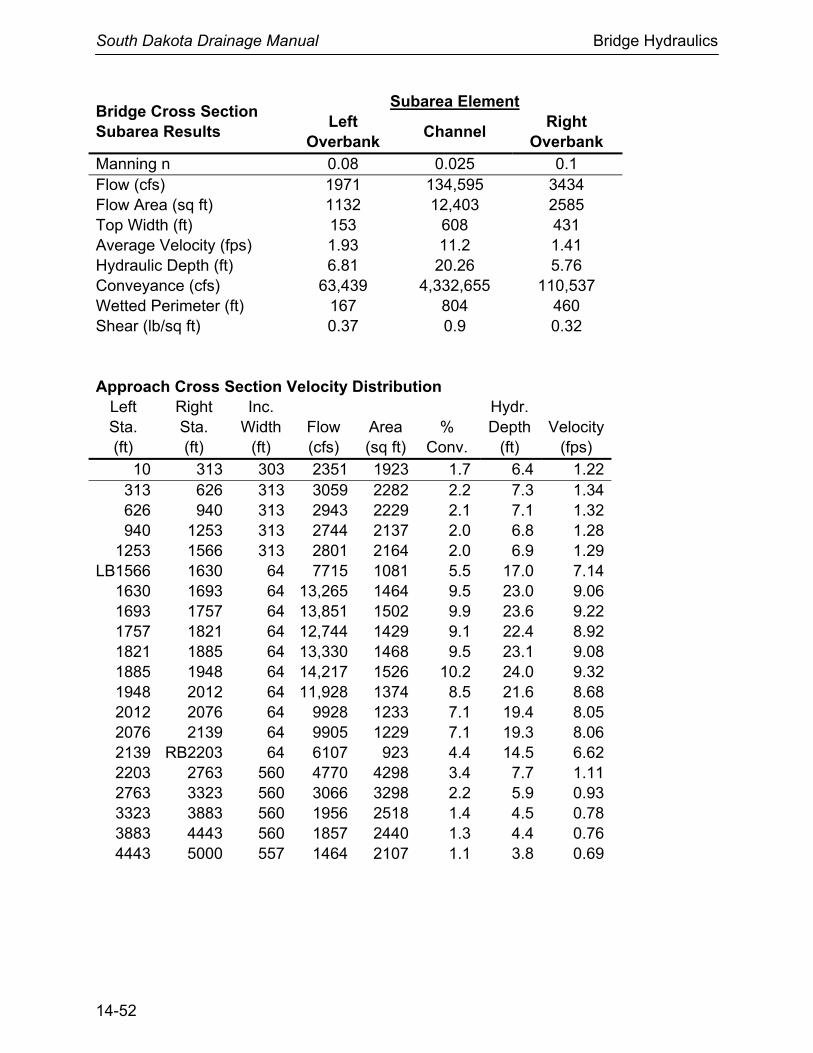
South Dakota Drainage Manual Bridge Hydraulics
14-52
Bridge Cross Section Subarea Results
Subarea Element Left
Overbank Channel
Right Overbank
Manning n 0.08 0.025 0.1 Flow (cfs) 1971 134,595 3434 Flow Area (sq ft) 1132 12,403 2585 Top Width (ft) 153 608 431 Average Velocity (fps) 1.93 11.2 1.41 Hydraulic Depth (ft) 6.81 20.26 5.76 Conveyance (cfs) 63,439 4,332,655 110,537 Wetted Perimeter (ft) 167 804 460 Shear (lb/sq ft) 0.37 0.9 0.32 Approach Cross Section Velocity Distribution
Left Sta. (ft)
Right Sta. (ft)
Inc. Width
(ft) Flow (cfs)
Area (sq ft)
% Conv.
Hydr. Depth
(ft) Velocity
(fps) 10 313 303 2351 1923 1.7 6.4 1.22
313 626 313 3059 2282 2.2 7.3 1.34 626 940 313 2943 2229 2.1 7.1 1.32 940 1253 313 2744 2137 2.0 6.8 1.28
1253 1566 313 2801 2164 2.0 6.9 1.29 LB1566 1630 64 7715 1081 5.5 17.0 7.14
1630 1693 64 13,265 1464 9.5 23.0 9.06 1693 1757 64 13,851 1502 9.9 23.6 9.22 1757 1821 64 12,744 1429 9.1 22.4 8.92 1821 1885 64 13,330 1468 9.5 23.1 9.08 1885 1948 64 14,217 1526 10.2 24.0 9.32 1948 2012 64 11,928 1374 8.5 21.6 8.68 2012 2076 64 9928 1233 7.1 19.4 8.05 2076 2139 64 9905 1229 7.1 19.3 8.06 2139 RB2203 64 6107 923 4.4 14.5 6.62 2203 2763 560 4770 4298 3.4 7.7 1.11 2763 3323 560 3066 3298 2.2 5.9 0.93 3323 3883 560 1956 2518 1.4 4.5 0.78 3883 4443 560 1857 2440 1.3 4.4 0.76 4443 5000 557 1464 2107 1.1 3.8 0.69
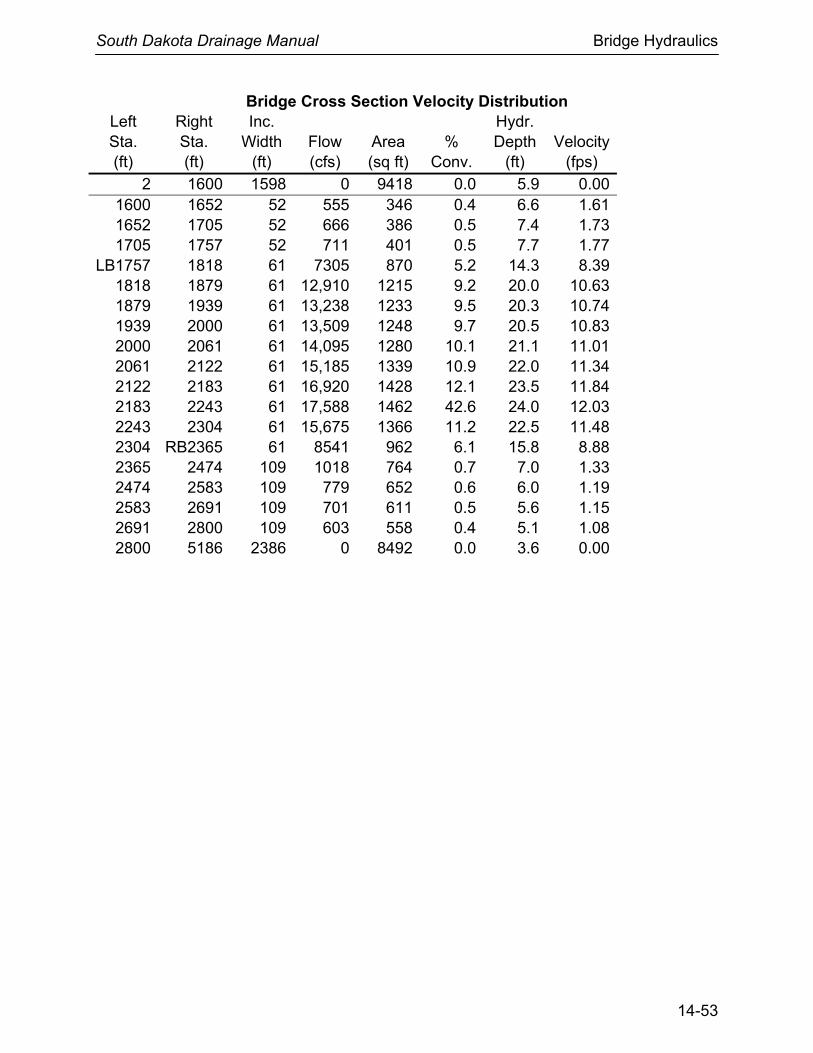
South Dakota Drainage Manual Bridge Hydraulics
14-53
Bridge Cross Section Velocity Distribution Left Sta. (ft)
Right Sta. (ft)
Inc. Width
(ft) Flow (cfs)
Area (sq ft)
% Conv.
Hydr. Depth
(ft) Velocity
(fps) 2 1600 1598 0 9418 0.0 5.9 0.00
1600 1652 52 555 346 0.4 6.6 1.61 1652 1705 52 666 386 0.5 7.4 1.73 1705 1757 52 711 401 0.5 7.7 1.77
LB1757 1818 61 7305 870 5.2 14.3 8.39 1818 1879 61 12,910 1215 9.2 20.0 10.63 1879 1939 61 13,238 1233 9.5 20.3 10.74 1939 2000 61 13,509 1248 9.7 20.5 10.83 2000 2061 61 14,095 1280 10.1 21.1 11.01 2061 2122 61 15,185 1339 10.9 22.0 11.34 2122 2183 61 16,920 1428 12.1 23.5 11.84 2183 2243 61 17,588 1462 42.6 24.0 12.03 2243 2304 61 15,675 1366 11.2 22.5 11.48 2304 RB2365 61 8541 962 6.1 15.8 8.88 2365 2474 109 1018 764 0.7 7.0 1.33 2474 2583 109 779 652 0.6 6.0 1.19 2583 2691 109 701 611 0.5 5.6 1.15 2691 2800 109 603 558 0.4 5.1 1.08 2800 5186 2386 0 8492 0.0 3.6 0.00
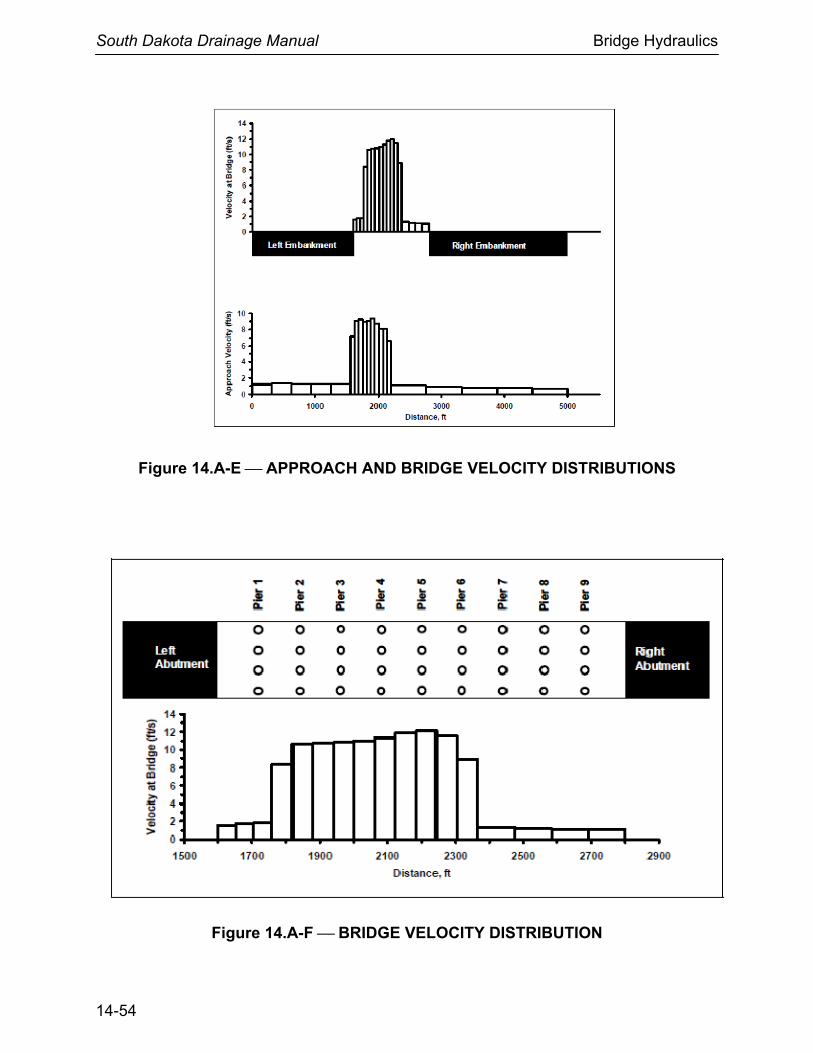
South Dakota Drainage Manual Bridge Hydraulics
14-54
Figure 14.A-E ⎯ APPROACH AND BRIDGE VELOCITY DISTRIBUTIONS
Figure 14.A-F ⎯ BRIDGE VELOCITY DISTRIBUTION
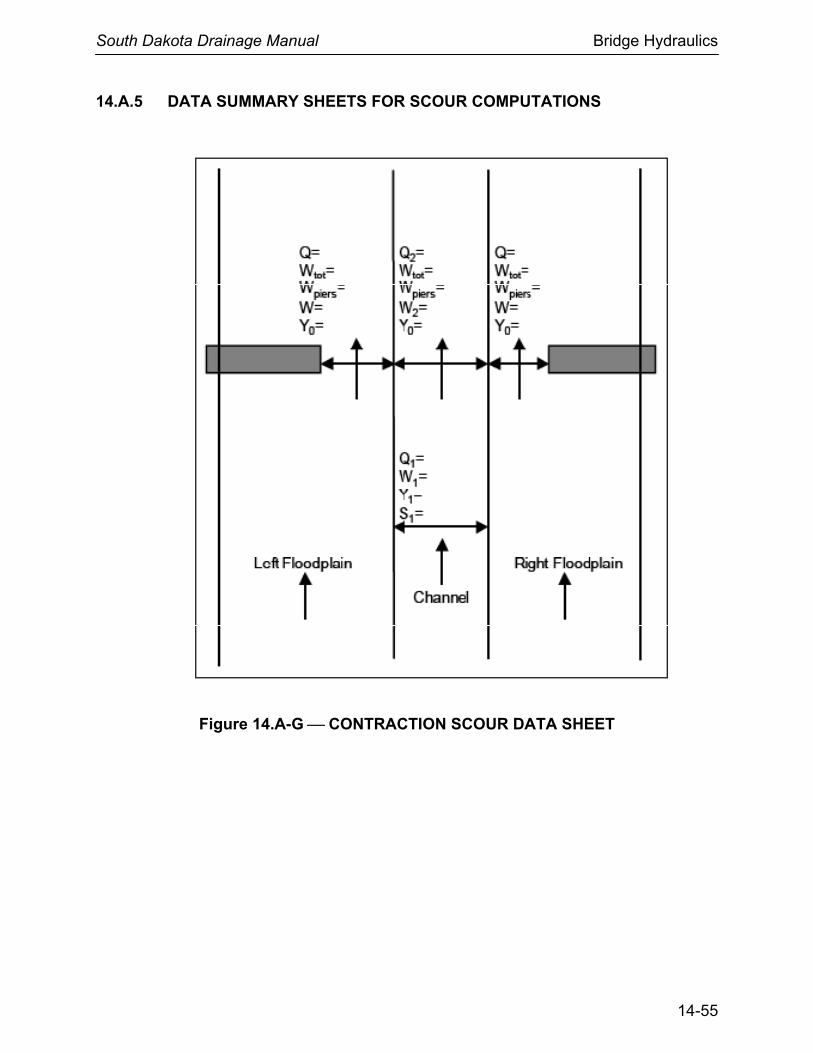
South Dakota Drainage Manual Bridge Hydraulics
14-55
14.A.5 DATA SUMMARY SHEETS FOR SCOUR COMPUTATIONS
Figure 14.A-G ⎯ CONTRACTION SCOUR DATA SHEET
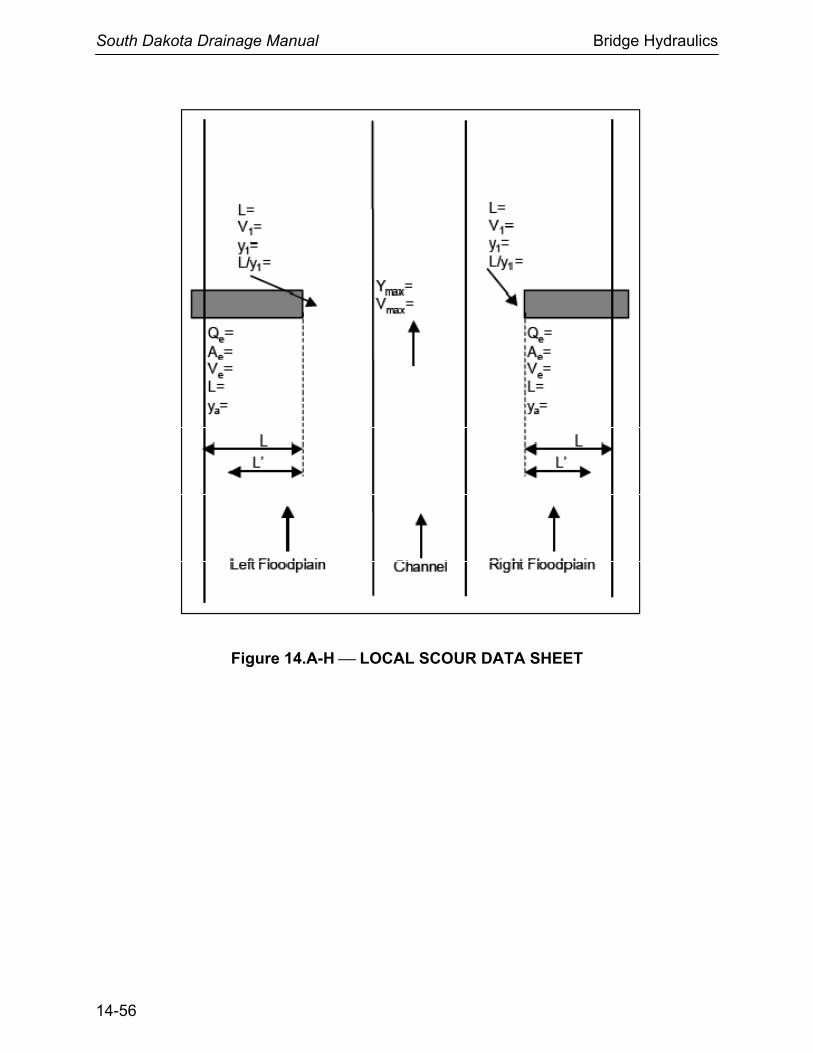
South Dakota Drainage Manual Bridge Hydraulics
14-56
Figure 14.A-H ⎯ LOCAL SCOUR DATA SHEET
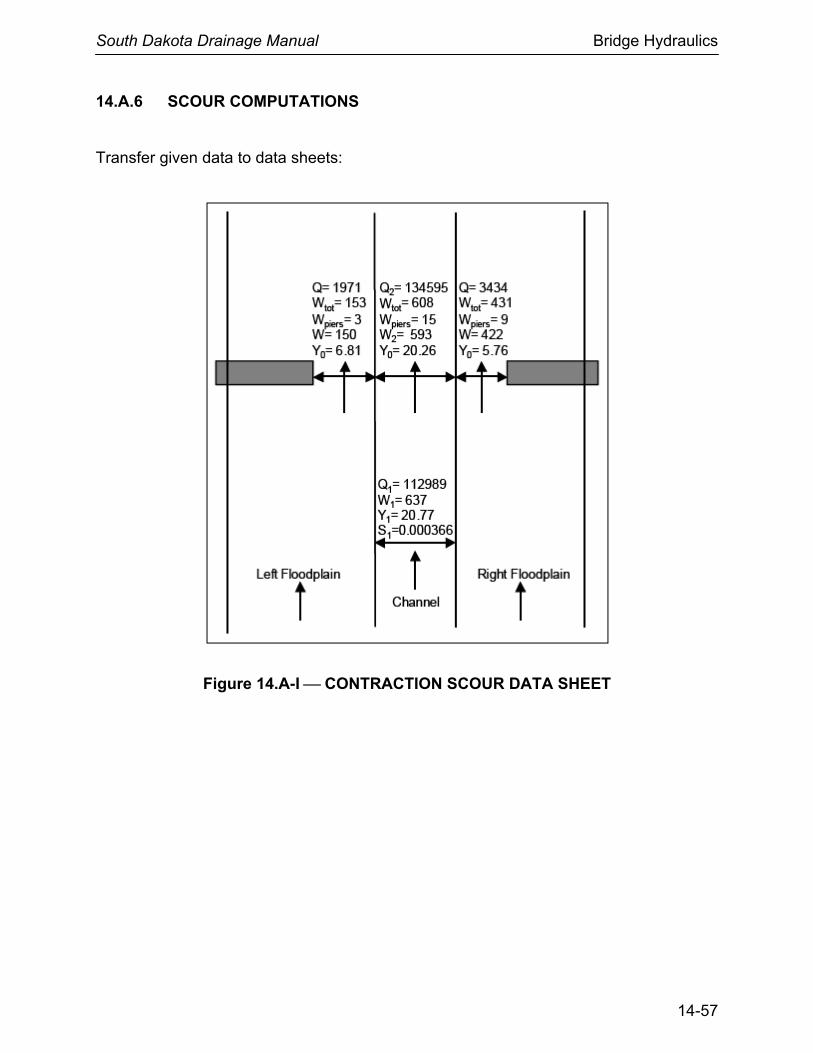
South Dakota Drainage Manual Bridge Hydraulics
14-57
14.A.6 SCOUR COMPUTATIONS
Transfer given data to data sheets:
Figure 14.A-I ⎯ CONTRACTION SCOUR DATA SHEET
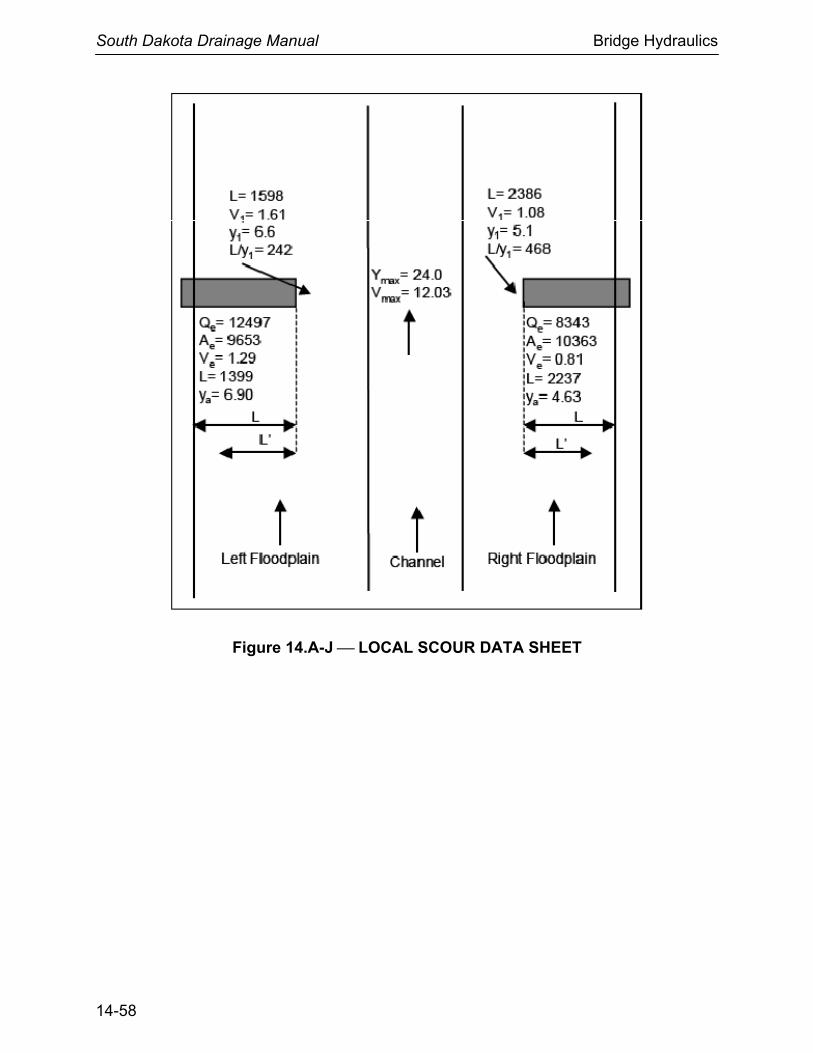
South Dakota Drainage Manual Bridge Hydraulics
14-58
Figure 14.A-J ⎯ LOCAL SCOUR DATA SHEET
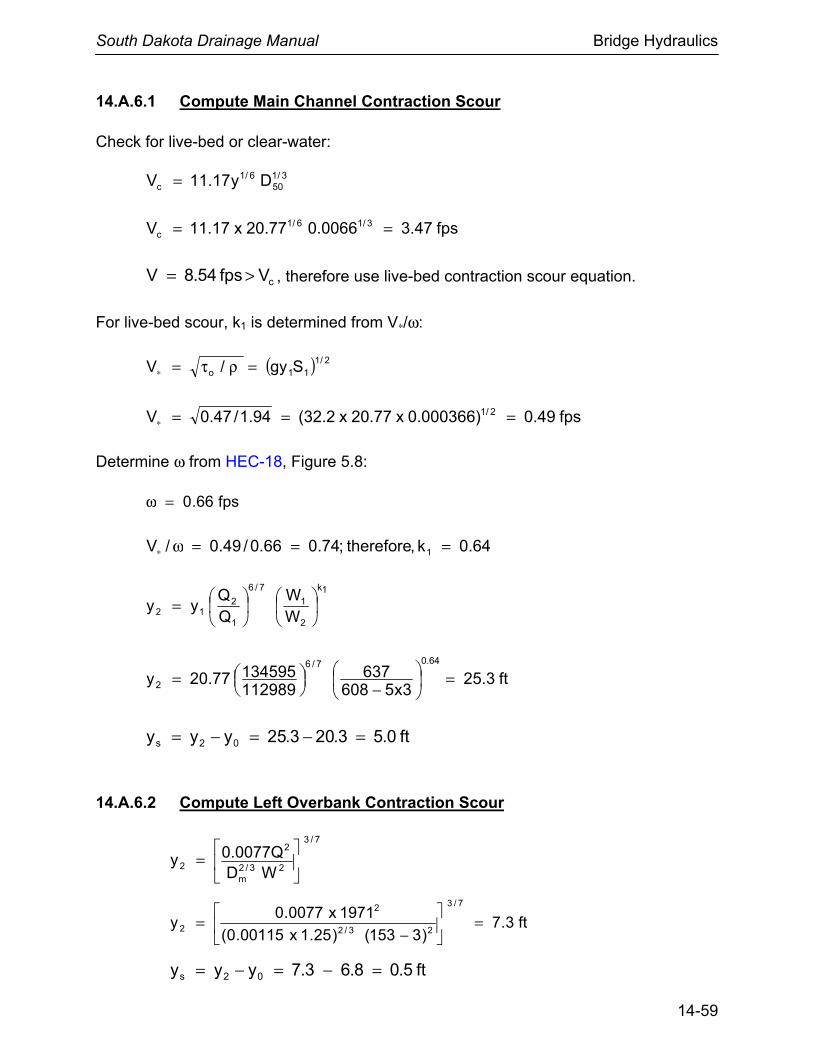
South Dakota Drainage Manual Bridge Hydraulics
14-59
14.A.6.1 Compute Main Channel Contraction Scour Check for live-bed or clear-water:
3/150
6/1c Dy17.11V =
fps47.30066.077.20x17.11V 3/16/1c ==
cVfps54.8V >= , therefore use live-bed contraction scour equation.
For live-bed scour, k1 is determined from V∗/ω:
( ) 2/111o Sgy/V =ρτ=∗
fps49.0)000366.0x77.20x2.32(94.1/47.0V 2/1 ===∗
Determine ω from HEC-18, Figure 5.8: fps66.0=ω
64.0k,therefore;74.066.0/49.0/V 1 ===ω∗
1k
2
1
7/6
1
212 W
WQQ
yy
=
ft3.253x5608
63711298913459577.20y
64.07/6
2 =
−
=
ft0.53.203.25yyy 02s =−=−=
14.A.6.2 Compute Left Overbank Contraction Scour
7/3
23/2m
2
2 WDQ0077.0y
=
ft3.7)3153()25.1x00115.0(
1971x0077.0y
7/3
23/2
2
2 =
−
=
ft5.08.63.7yyy 02s =−=−=
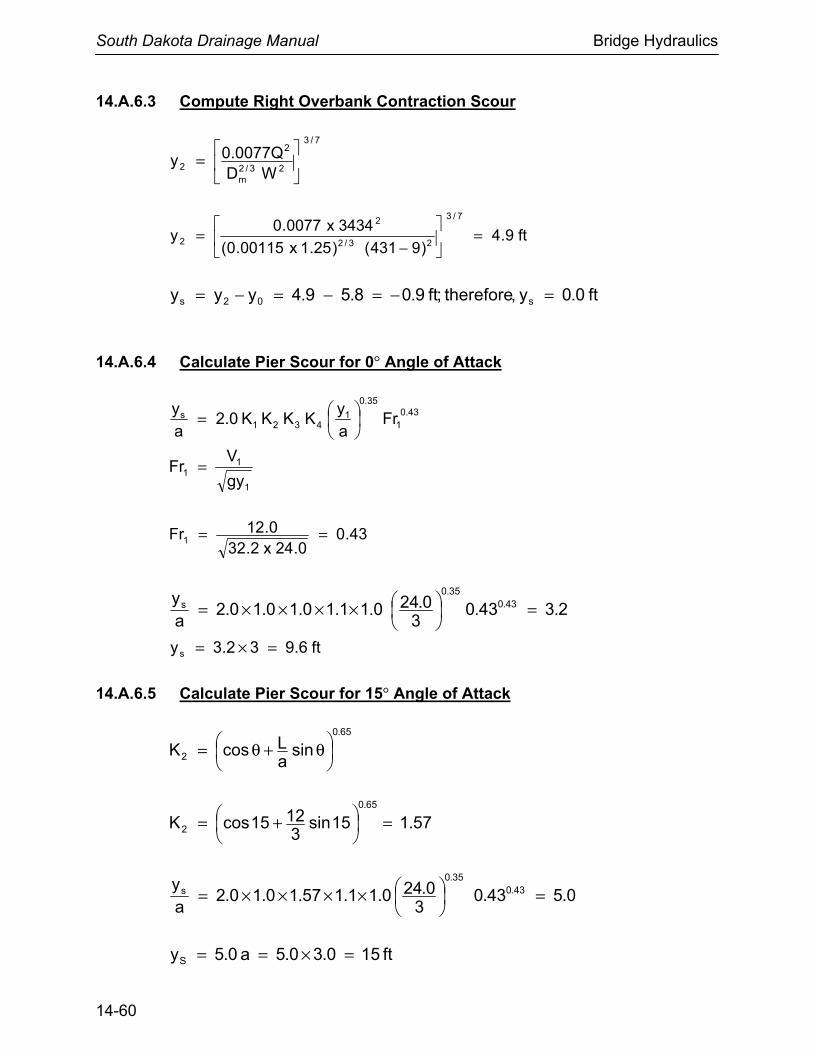
South Dakota Drainage Manual Bridge Hydraulics
14-60
14.A.6.3 Compute Right Overbank Contraction Scour
7/3
23/2m
2
2 WDQ0077.0y
=
ft9.4)9431()25.1x00115.0(
3434x0077.0y
7/3
23/2
2
2 =
−
=
ft0.0y,therefore;ft9.08.59.4yyy s02s =−=−=−=
14.A.6.4 Calculate Pier Scour for 0° Angle of Attack
43.01
35.0
14321
s Fray
KKKK0.2ay
=
1
11
gy
VFr =
43.00.24x2.32
0.12Fr1 ==
2.343.03
0.240.11.10.10.10.2ay 43.0
35.0s =
××××=
ft6.932.3ys =×=
14.A.6.5 Calculate Pier Scour for 15° Angle of Attack
65.0
2 sinaLcosK
θ+θ=
57.115sin3
1215cosK65.0
2 =
+=
0.543.03
0.240.11.157.10.10.2ay 43.0
35.0s =
××××=
ft150.30.5a0.5yS =×==

South Dakota Drainage Manual Bridge Hydraulics
14-61
14.A.6.6 Calculate Left Abutment Scour Using HIRE Scour Equation
ft1598L =
ft6.6y1 =
;25242y/L 1 >= therefore, HIRE equation is applicable.
2133.0
1s K55.0
KFry0.4y =
11.06.62.32
61.1gy
VFr
1
1 =×
==
ft7.120.155.055.011.06.60.4y 33.0
s =××××=
14.A.6.7 Calculate Right Abutment Scour Using HIRE Scour Equation
ft2386L =
ft1.5y1 =
;25468y/L 1 >= therefore, HIRE equation is applicable.
2133.0
1s K55.0
KFry0.4y =
084.01.52.32
08.1gy
VFr
1
1 =×
==
ft0.90.155.055.0084.01.50.4y 33.0
s =××××=
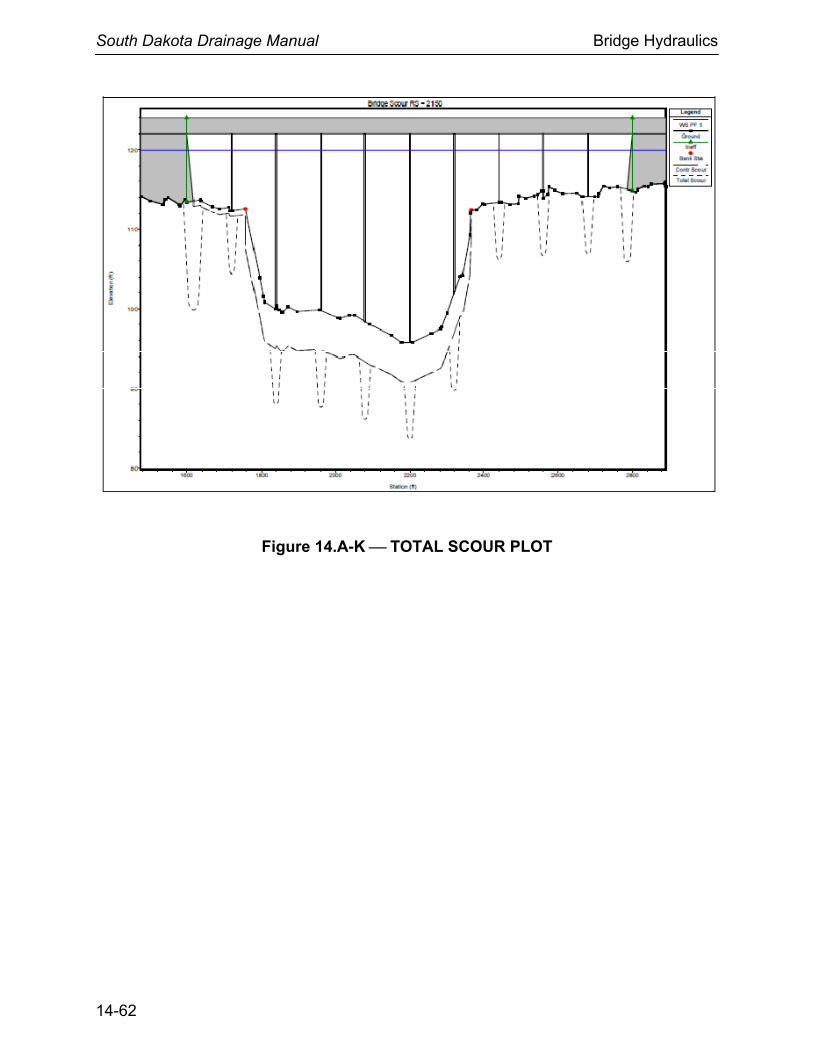
South Dakota Drainage Manual Bridge Hydraulics
14-62
Figure 14.A-K ⎯ TOTAL SCOUR PLOT
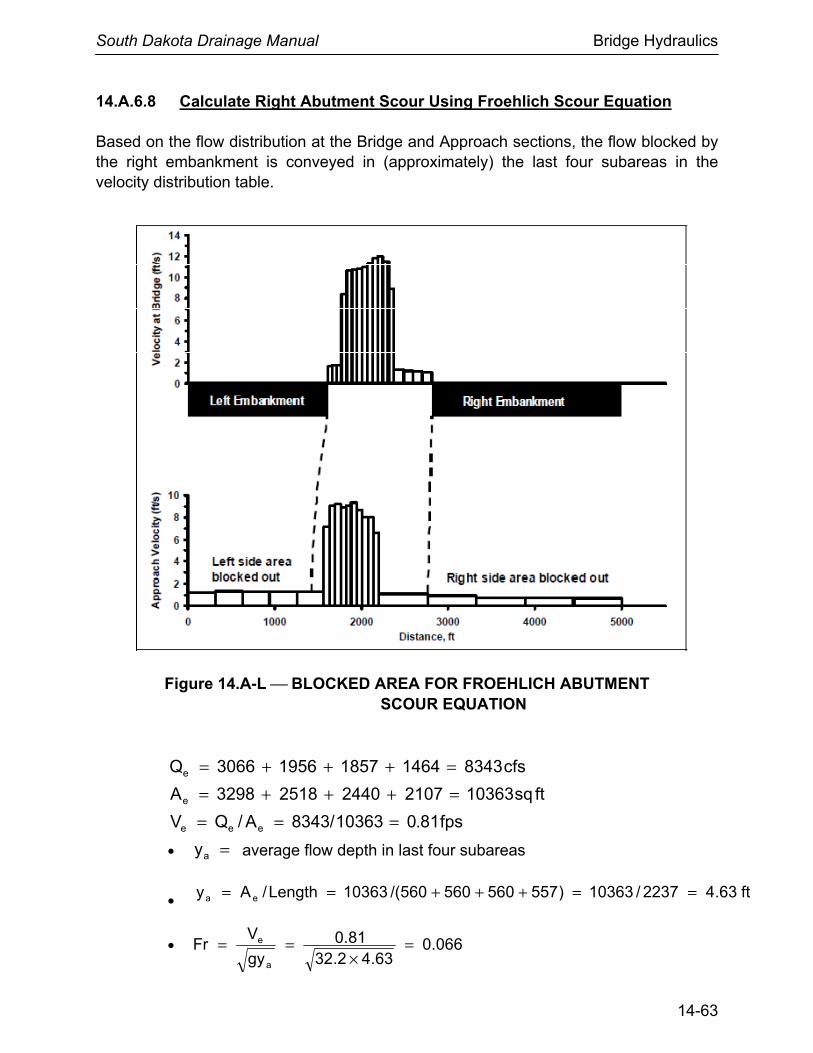
South Dakota Drainage Manual Bridge Hydraulics
14-63
14.A.6.8 Calculate Right Abutment Scour Using Froehlich Scour Equation Based on the flow distribution at the Bridge and Approach sections, the flow blocked by the right embankment is conveyed in (approximately) the last four subareas in the velocity distribution table.
Figure 14.A-L ⎯ BLOCKED AREA FOR FROEHLICH ABUTMENT SCOUR EQUATION
cfs83431464185719563066Qe =+++=
ftsq103632107244025183298Ae =+++=
fps81.010363/8343A/QV eee ===
• =ay average flow depth in last four subareas
•
• 066.063.42.32
81.0gy
VFr
a
e =×
==
ft63.42237/10363)557560560560/(10363Length/Ay ea ==+++==
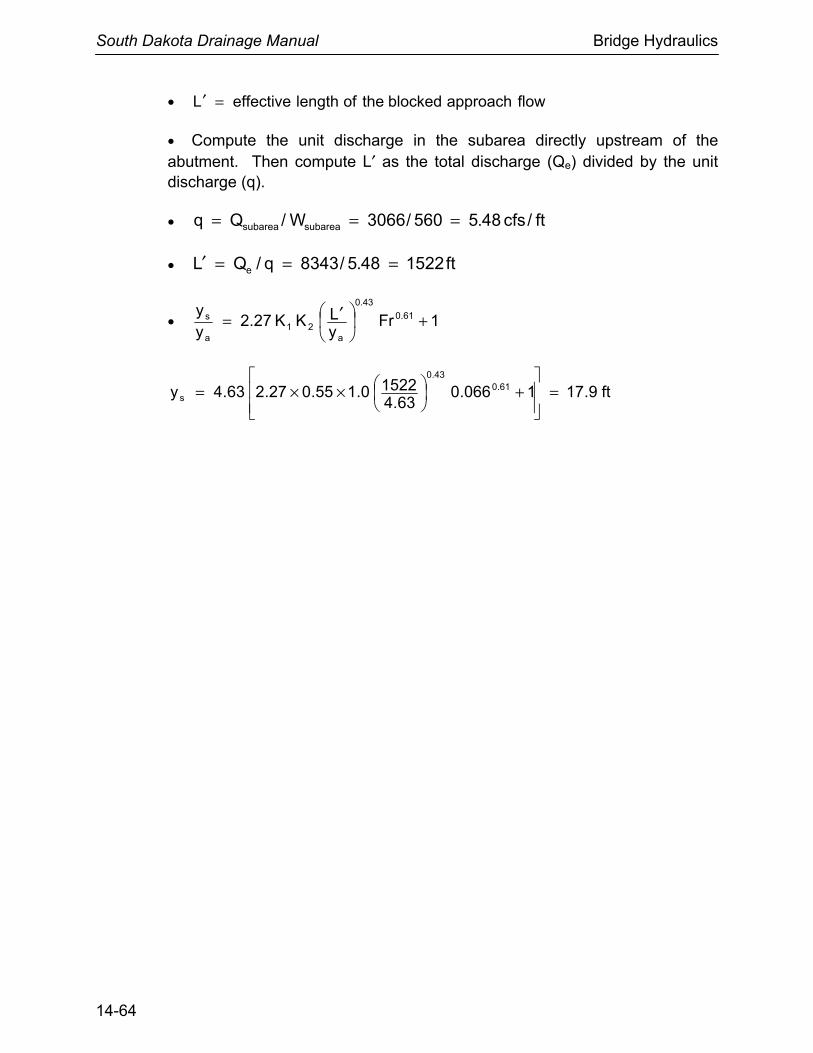
South Dakota Drainage Manual Bridge Hydraulics
14-64
• flowapproachblockedtheoflengtheffectiveL =′
• Compute the unit discharge in the subarea directly upstream of the abutment. Then compute L′ as the total discharge (Qe) divided by the unit discharge (q).
• ft/cfs48.5560/3066W/Qq subareasubarea ===
• ft152248.5/8343q/QL e ===′
• 1FryLKK27.2
yy 61.0
43.0
a21
a
s +
′=
ft9.171066.063.4
15220.155.027.263.4y 61.043.0
s =
+
××=
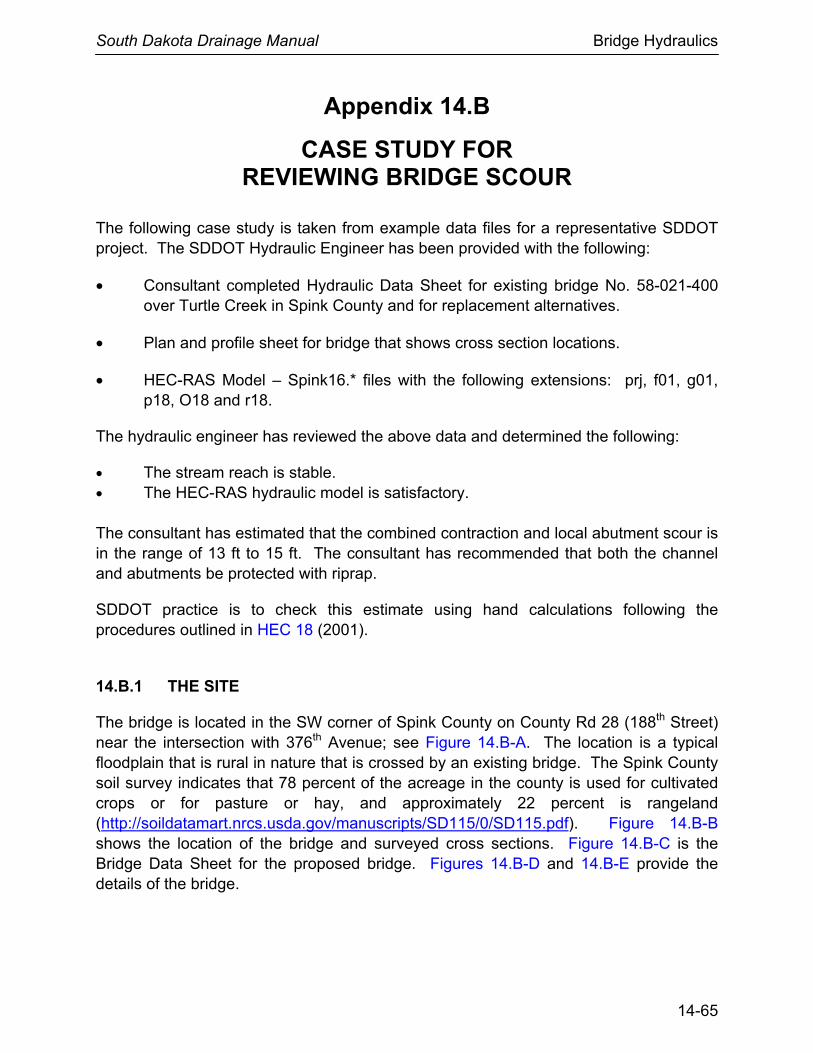
South Dakota Drainage Manual Bridge Hydraulics
14-65
Appendix 14.B
CASE STUDY FOR REVIEWING BRIDGE SCOUR
The following case study is taken from example data files for a representative SDDOT project. The SDDOT Hydraulic Engineer has been provided with the following:
• Consultant completed Hydraulic Data Sheet for existing bridge No. 58-021-400 over Turtle Creek in Spink County and for replacement alternatives.
• Plan and profile sheet for bridge that shows cross section locations.
• HEC-RAS Model – Spink16.* files with the following extensions: prj, f01, g01, p18, O18 and r18.
The hydraulic engineer has reviewed the above data and determined the following:
• The stream reach is stable. • The HEC-RAS hydraulic model is satisfactory. The consultant has estimated that the combined contraction and local abutment scour is in the range of 13 ft to 15 ft. The consultant has recommended that both the channel and abutments be protected with riprap.
SDDOT practice is to check this estimate using hand calculations following the procedures outlined in HEC 18 (2001).
14.B.1 THE SITE
The bridge is located in the SW corner of Spink County on County Rd 28 (188th Street) near the intersection with 376th Avenue; see Figure 14.B-A. The location is a typical floodplain that is rural in nature that is crossed by an existing bridge. The Spink County soil survey indicates that 78 percent of the acreage in the county is used for cultivated crops or for pasture or hay, and approximately 22 percent is rangeland (http://soildatamart.nrcs.usda.gov/manuscripts/SD115/0/SD115.pdf). Figure 14.B-B shows the location of the bridge and surveyed cross sections. Figure 14.B-C is the Bridge Data Sheet for the proposed bridge. Figures 14.B-D and 14.B-E provide the details of the bridge.
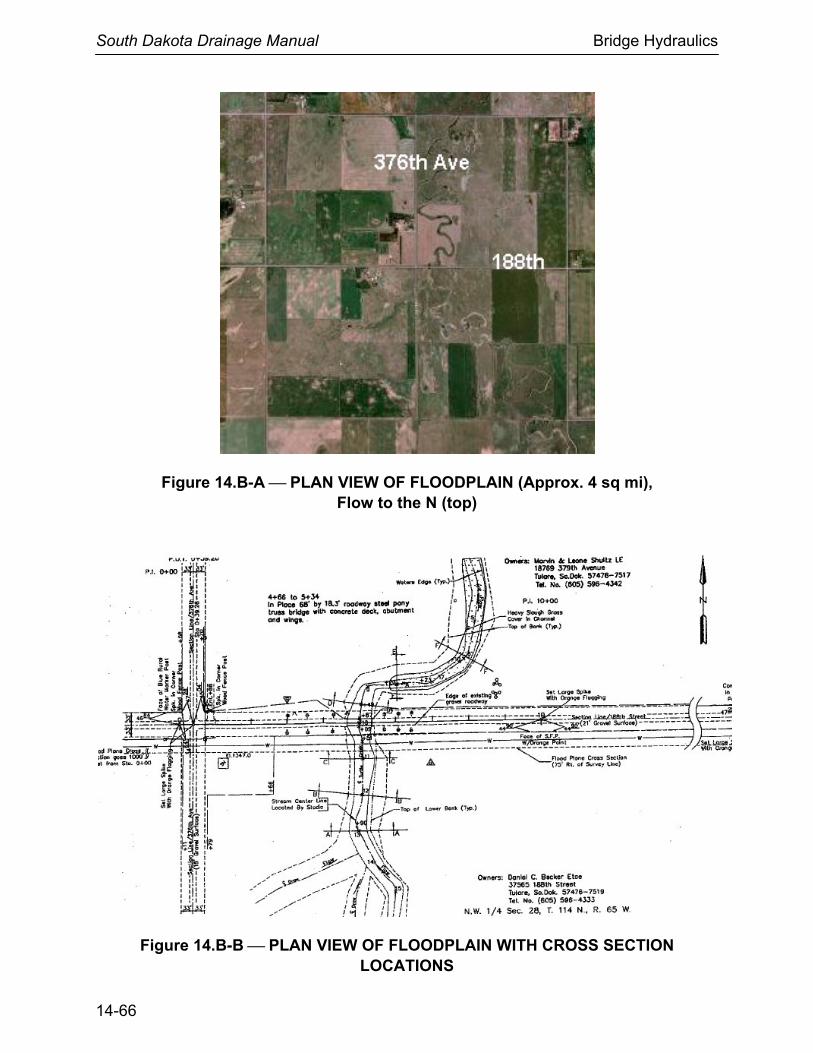
South Dakota Drainage Manual Bridge Hydraulics
14-66
Figure 14.B-A ⎯ PLAN VIEW OF FLOODPLAIN (Approx. 4 sq mi), Flow to the N (top)
Figure 14.B-B ⎯ PLAN VIEW OF FLOODPLAIN WITH CROSS SECTION LOCATIONS
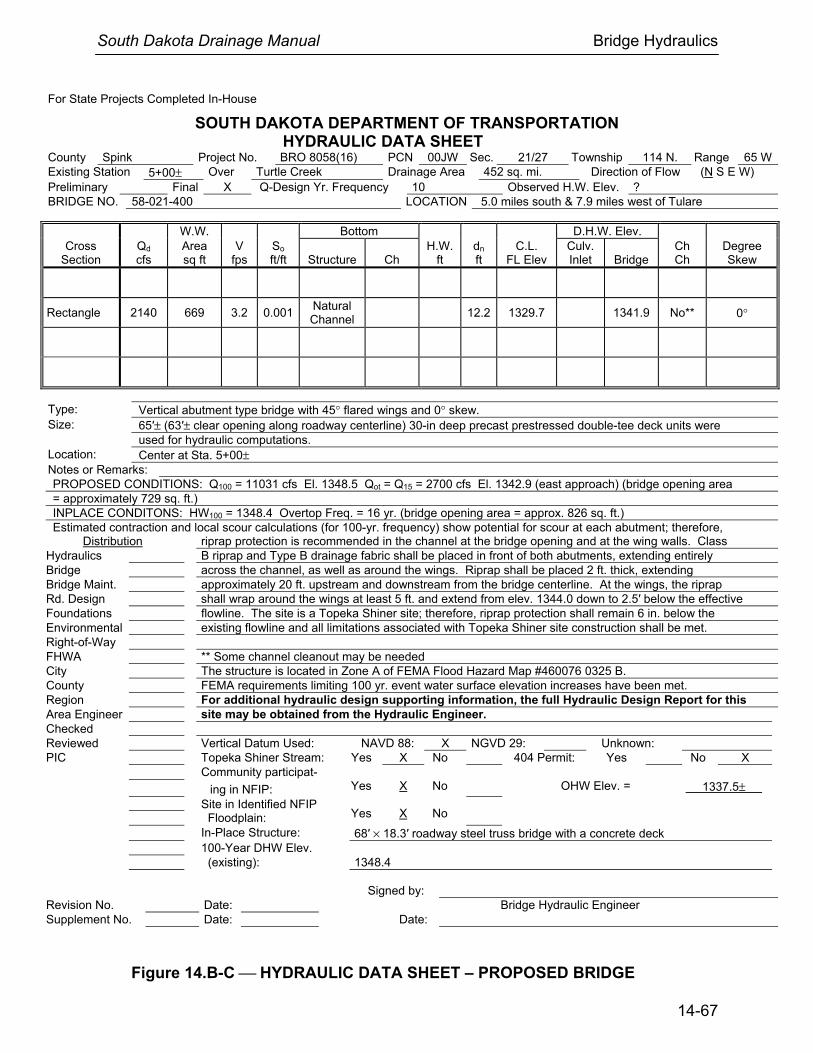
South Dakota Drainage Manual Bridge Hydraulics
14-67
For State Projects Completed In-House
SOUTH DAKOTA DEPARTMENT OF TRANSPORTATION HYDRAULIC DATA SHEET
County Spink Project No. BRO 8058(16) PCN 00JW Sec. 21/27 Township 114 N. Range 65 WExisting Station 5+00± Over Turtle Creek Drainage Area 452 sq. mi. Direction of Flow (N S E W) Preliminary Final X Q-Design Yr. Frequency 10 Observed H.W. Elev. ? BRIDGE NO. 58-021-400 LOCATION 5.0 miles south & 7.9 miles west of Tulare
W.W. Bottom D.H.W. Elev. Cross
Section Qd cfs
Area sq ft
V fps
So ft/ft
Structure
Ch
H.W. ft
dn ft
C.L. FL Elev
Culv. Inlet
Bridge
Ch Ch
Degree Skew
Rectangle 2140 669 3.2 0.001 Natural Channel
12.2 1329.7 1341.9 No** 0°
Type: Vertical abutment type bridge with 45° flared wings and 0° skew. Size: 65′± (63′± clear opening along roadway centerline) 30-in deep precast prestressed double-tee deck units were used for hydraulic computations. Location: Center at Sta. 5+00± Notes or Remarks: PROPOSED CONDITIONS: Q100 = 11031 cfs El. 1348.5 Qot = Q15 = 2700 cfs El. 1342.9 (east approach) (bridge opening area = approximately 729 sq. ft.) INPLACE CONDITONS: HW100 = 1348.4 Overtop Freq. = 16 yr. (bridge opening area = approx. 826 sq. ft.) Estimated contraction and local scour calculations (for 100-yr. frequency) show potential for scour at each abutment; therefore,
Distribution riprap protection is recommended in the channel at the bridge opening and at the wing walls. Class Hydraulics B riprap and Type B drainage fabric shall be placed in front of both abutments, extending entirely Bridge across the channel, as well as around the wings. Riprap shall be placed 2 ft. thick, extending Bridge Maint. approximately 20 ft. upstream and downstream from the bridge centerline. At the wings, the riprap Rd. Design shall wrap around the wings at least 5 ft. and extend from elev. 1344.0 down to 2.5′ below the effective Foundations flowline. The site is a Topeka Shiner site; therefore, riprap protection shall remain 6 in. below the Environmental existing flowline and all limitations associated with Topeka Shiner site construction shall be met. Right-of-Way FHWA ** Some channel cleanout may be needed City The structure is located in Zone A of FEMA Flood Hazard Map #460076 0325 B. County FEMA requirements limiting 100 yr. event water surface elevation increases have been met. Region For additional hydraulic design supporting information, the full Hydraulic Design Report for thisArea Engineer site may be obtained from the Hydraulic Engineer.Checked Reviewed Vertical Datum Used: NAVD 88: X NGVD 29: Unknown: PIC Topeka Shiner Stream: Yes X No 404 Permit: Yes No X Community participat-
ing in NFIP: Site in Identified NFIP Floodplain:
Yes Yes
X
X
No No
OHW Elev. =
1337.5±
In-Place Structure: 68′ × 18.3′ roadway steel truss bridge with a concrete deck 100-Year DHW Elev. (existing): 1348.4 Signed by: Revision No. Date: Bridge Hydraulic Engineer Supplement No. Date: Date:
Figure 14.B-C ⎯ HYDRAULIC DATA SHEET – PROPOSED BRIDGE
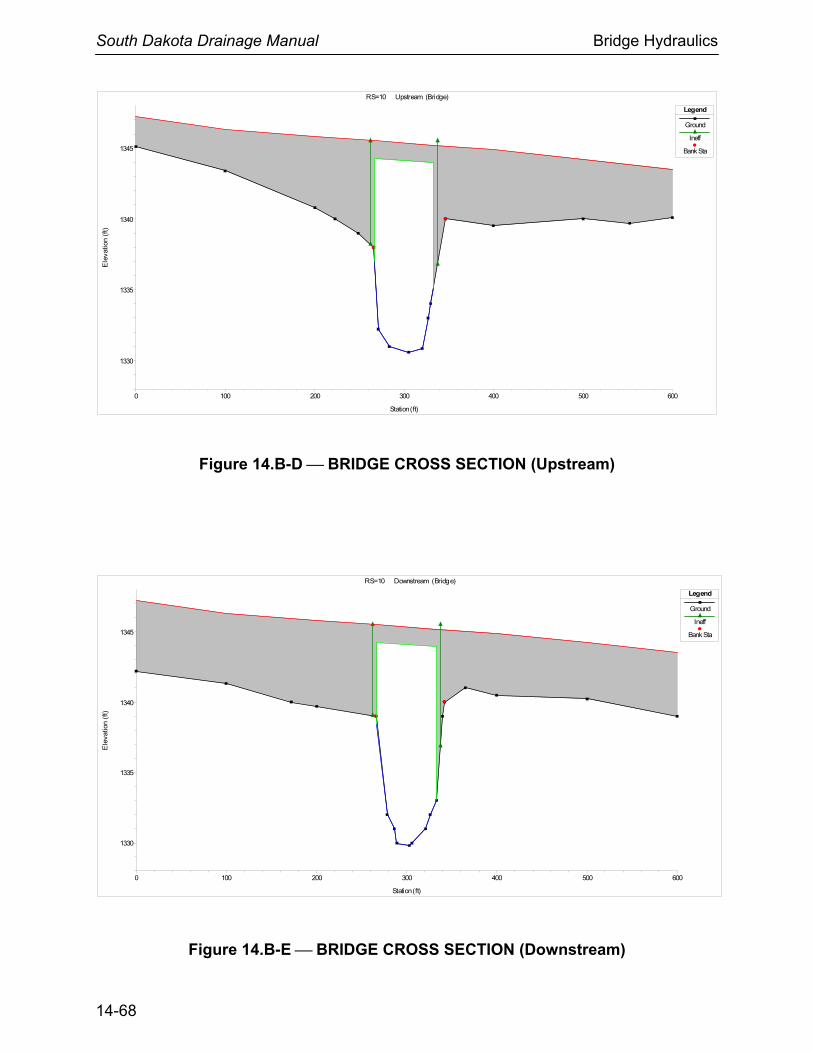
South Dakota Drainage Manual Bridge Hydraulics
14-68
Figure 14.B-D ⎯ BRIDGE CROSS SECTION (Upstream)
Figure 14.B-E ⎯ BRIDGE CROSS SECTION (Downstream)
0 100 200 300 400 500 600
1330
1335
1340
1345
RS=10 Upstream (Bridge)
Station (ft)
Ele
vatio
n (f
t)Legend
Ground
Ineff
Bank Sta
0 100 200 300 400 500 600
1330
1335
1340
1345
RS=10 Downstream (Bridge)
Station (ft)
Ele
vatio
n (f
t)
Legend
Ground
Ineff
Bank Sta
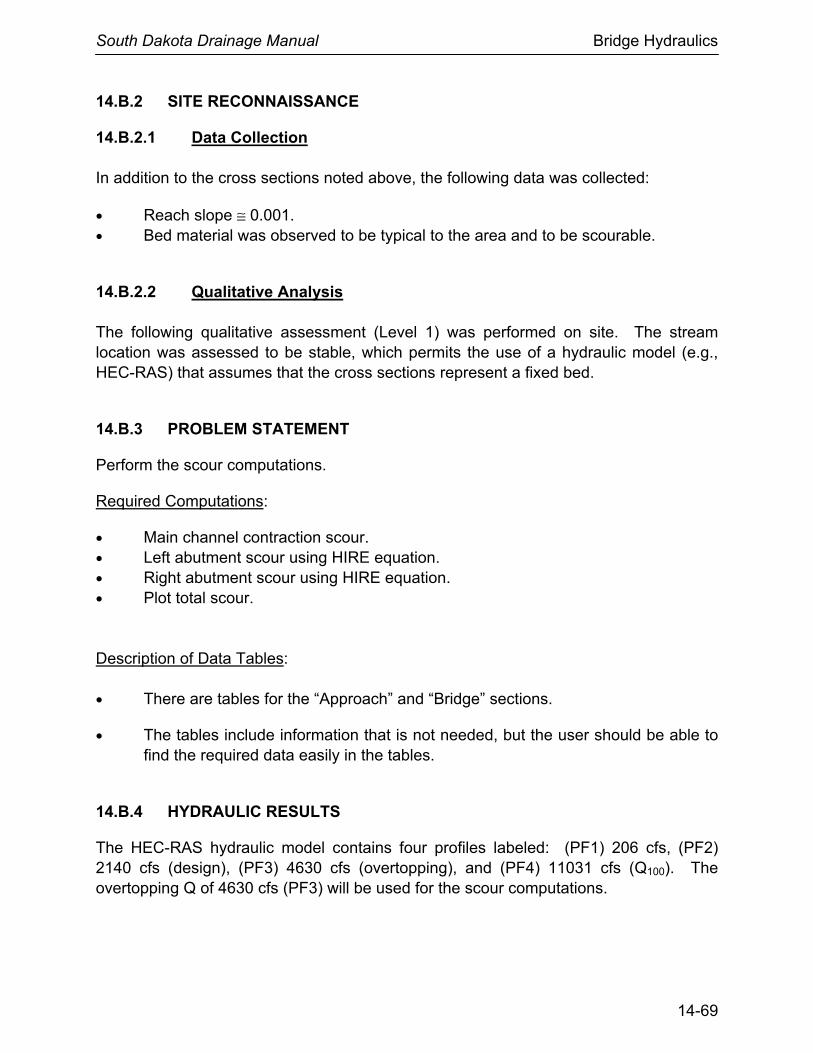
South Dakota Drainage Manual Bridge Hydraulics
14-69
14.B.2 SITE RECONNAISSANCE
14.B.2.1 Data Collection In addition to the cross sections noted above, the following data was collected:
• Reach slope ≅ 0.001. • Bed material was observed to be typical to the area and to be scourable.
14.B.2.2 Qualitative Analysis The following qualitative assessment (Level 1) was performed on site. The stream location was assessed to be stable, which permits the use of a hydraulic model (e.g., HEC-RAS) that assumes that the cross sections represent a fixed bed.
14.B.3 PROBLEM STATEMENT
Perform the scour computations.
Required Computations:
• Main channel contraction scour. • Left abutment scour using HIRE equation. • Right abutment scour using HIRE equation. • Plot total scour. Description of Data Tables: • There are tables for the “Approach” and “Bridge” sections.
• The tables include information that is not needed, but the user should be able to find the required data easily in the tables.
14.B.4 HYDRAULIC RESULTS
The HEC-RAS hydraulic model contains four profiles labeled: (PF1) 206 cfs, (PF2) 2140 cfs (design), (PF3) 4630 cfs (overtopping), and (PF4) 11031 cfs (Q100). The overtopping Q of 4630 cfs (PF3) will be used for the scour computations.
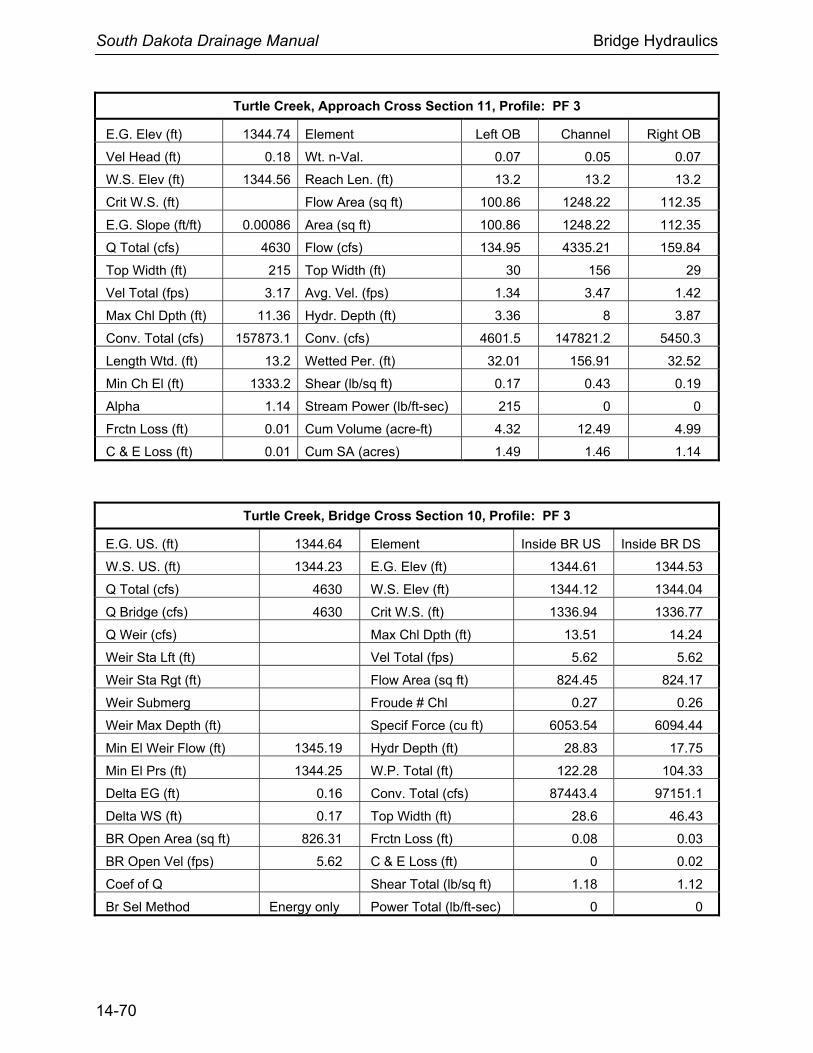
South Dakota Drainage Manual Bridge Hydraulics
14-70
Turtle Creek, Approach Cross Section 11, Profile: PF 3
E.G. Elev (ft) 1344.74 Element Left OB Channel Right OB
Vel Head (ft) 0.18 Wt. n-Val. 0.07 0.05 0.07
W.S. Elev (ft) 1344.56 Reach Len. (ft) 13.2 13.2 13.2
Crit W.S. (ft) Flow Area (sq ft) 100.86 1248.22 112.35
E.G. Slope (ft/ft) 0.00086 Area (sq ft) 100.86 1248.22 112.35
Q Total (cfs) 4630 Flow (cfs) 134.95 4335.21 159.84
Top Width (ft) 215 Top Width (ft) 30 156 29
Vel Total (fps) 3.17 Avg. Vel. (fps) 1.34 3.47 1.42
Max Chl Dpth (ft) 11.36 Hydr. Depth (ft) 3.36 8 3.87
Conv. Total (cfs) 157873.1 Conv. (cfs) 4601.5 147821.2 5450.3
Length Wtd. (ft) 13.2 Wetted Per. (ft) 32.01 156.91 32.52
Min Ch El (ft) 1333.2 Shear (lb/sq ft) 0.17 0.43 0.19
Alpha 1.14 Stream Power (lb/ft-sec) 215 0 0
Frctn Loss (ft) 0.01 Cum Volume (acre-ft) 4.32 12.49 4.99
C & E Loss (ft) 0.01 Cum SA (acres) 1.49 1.46 1.14
Turtle Creek, Bridge Cross Section 10, Profile: PF 3
E.G. US. (ft) 1344.64 Element Inside BR US Inside BR DS
W.S. US. (ft) 1344.23 E.G. Elev (ft) 1344.61 1344.53
Q Total (cfs) 4630 W.S. Elev (ft) 1344.12 1344.04
Q Bridge (cfs) 4630 Crit W.S. (ft) 1336.94 1336.77
Q Weir (cfs) Max Chl Dpth (ft) 13.51 14.24
Weir Sta Lft (ft) Vel Total (fps) 5.62 5.62
Weir Sta Rgt (ft) Flow Area (sq ft) 824.45 824.17
Weir Submerg Froude # Chl 0.27 0.26
Weir Max Depth (ft) Specif Force (cu ft) 6053.54 6094.44
Min El Weir Flow (ft) 1345.19 Hydr Depth (ft) 28.83 17.75
Min El Prs (ft) 1344.25 W.P. Total (ft) 122.28 104.33
Delta EG (ft) 0.16 Conv. Total (cfs) 87443.4 97151.1
Delta WS (ft) 0.17 Top Width (ft) 28.6 46.43
BR Open Area (sq ft) 826.31 Frctn Loss (ft) 0.08 0.03
BR Open Vel (fps) 5.62 C & E Loss (ft) 0 0.02
Coef of Q Shear Total (lb/sq ft) 1.18 1.12
Br Sel Method Energy only Power Total (lb/ft-sec) 0 0
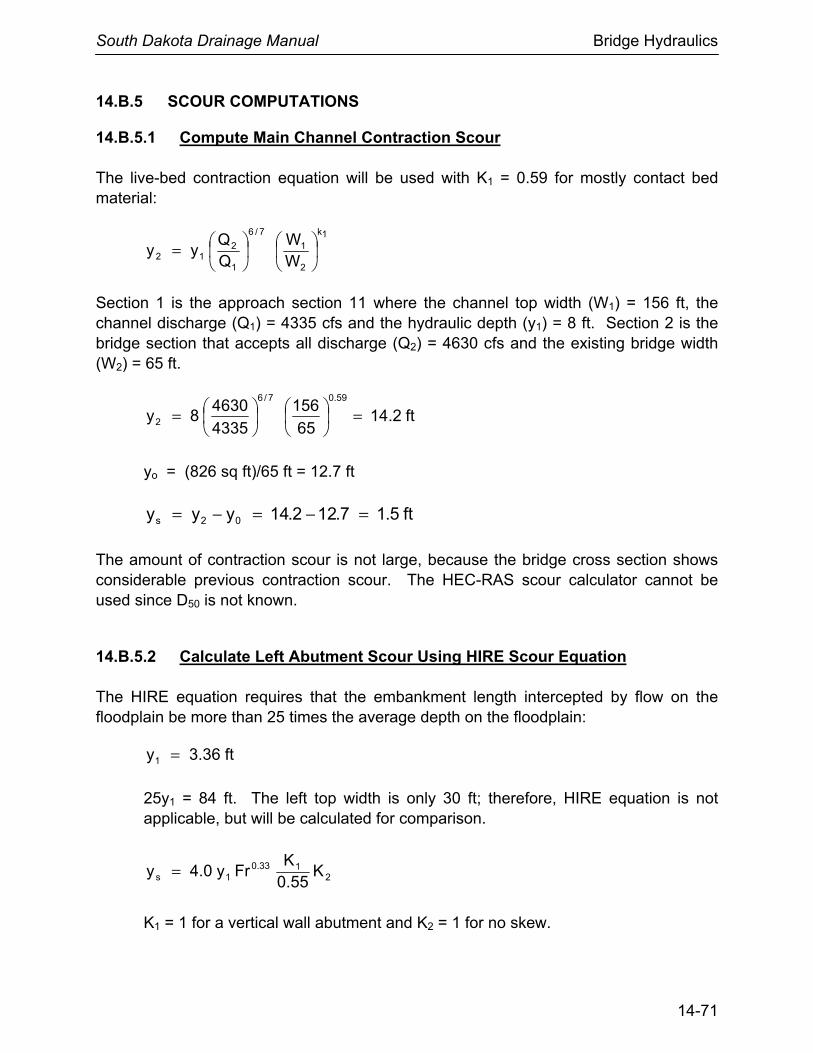
South Dakota Drainage Manual Bridge Hydraulics
14-71
14.B.5 SCOUR COMPUTATIONS
14.B.5.1 Compute Main Channel Contraction Scour The live-bed contraction equation will be used with K1 = 0.59 for mostly contact bed material:
1k
2
1
7/6
1
212 W
WQQ
yy
=
Section 1 is the approach section 11 where the channel top width (W1) = 156 ft, the channel discharge (Q1) = 4335 cfs and the hydraulic depth (y1) = 8 ft. Section 2 is the bridge section that accepts all discharge (Q2) = 4630 cfs and the existing bridge width (W2) = 65 ft.
ft2.1465
156
4335
46308y
59.07/6
2 =
=
yo = (826 sq ft)/65 ft = 12.7 ft
ft5.17.122.14yyy 02s =−=−=
The amount of contraction scour is not large, because the bridge cross section shows considerable previous contraction scour. The HEC-RAS scour calculator cannot be used since D50 is not known.
14.B.5.2 Calculate Left Abutment Scour Using HIRE Scour Equation The HIRE equation requires that the embankment length intercepted by flow on the floodplain be more than 25 times the average depth on the floodplain:
ft36.3y1 =
25y1 = 84 ft. The left top width is only 30 ft; therefore, HIRE equation is not applicable, but will be calculated for comparison.
2133.0
1s K55.0
KFry0.4y =
K1 = 1 for a vertical wall abutment and K2 = 1 for no skew.
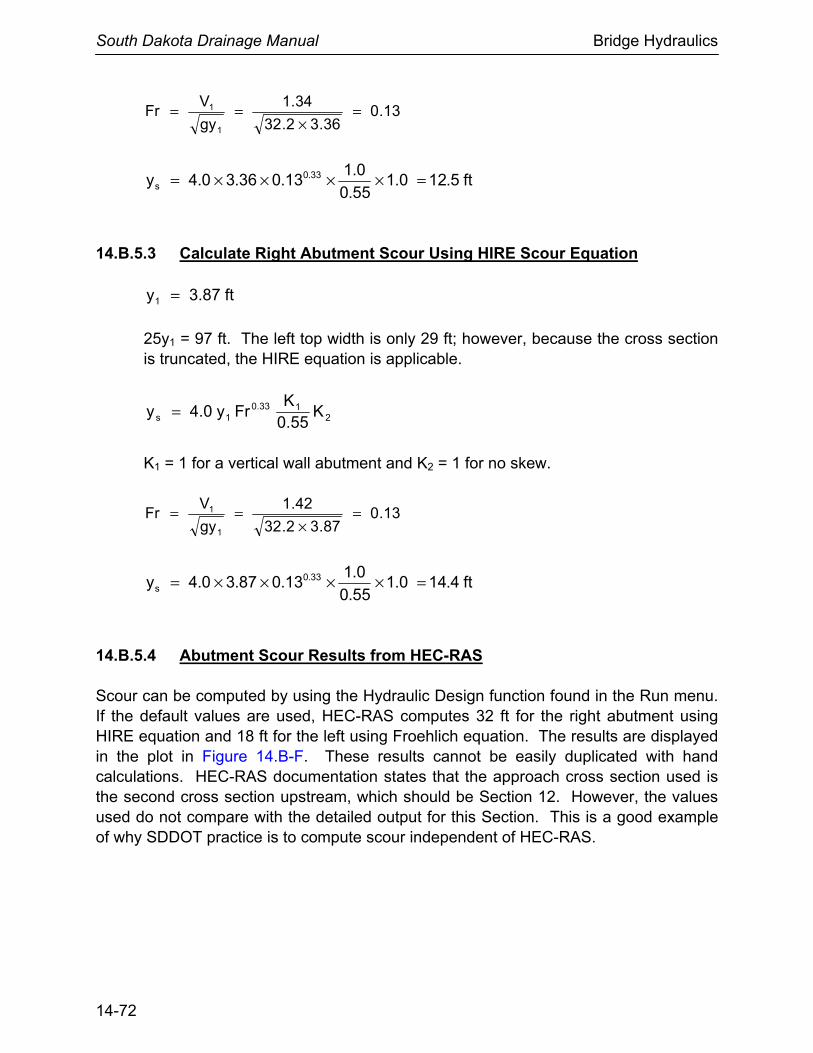
South Dakota Drainage Manual Bridge Hydraulics
14-72
13.036.32.32
34.1
gy
VFr
1
1 =×
==
ft5.120.155.0
0.113.036.30.4y 33.0
s =××××=
14.B.5.3 Calculate Right Abutment Scour Using HIRE Scour Equation
ft87.3y1 =
25y1 = 97 ft. The left top width is only 29 ft; however, because the cross section is truncated, the HIRE equation is applicable.
2133.0
1s K55.0
KFry0.4y =
K1 = 1 for a vertical wall abutment and K2 = 1 for no skew.
13.087.32.32
42.1
gy
VFr
1
1 =×
==
ft4.140.155.0
0.113.087.30.4y 33.0
s =××××=
14.B.5.4 Abutment Scour Results from HEC-RAS Scour can be computed by using the Hydraulic Design function found in the Run menu. If the default values are used, HEC-RAS computes 32 ft for the right abutment using HIRE equation and 18 ft for the left using Froehlich equation. The results are displayed in the plot in Figure 14.B-F. These results cannot be easily duplicated with hand calculations. HEC-RAS documentation states that the approach cross section used is the second cross section upstream, which should be Section 12. However, the values used do not compare with the detailed output for this Section. This is a good example of why SDDOT practice is to compute scour independent of HEC-RAS.
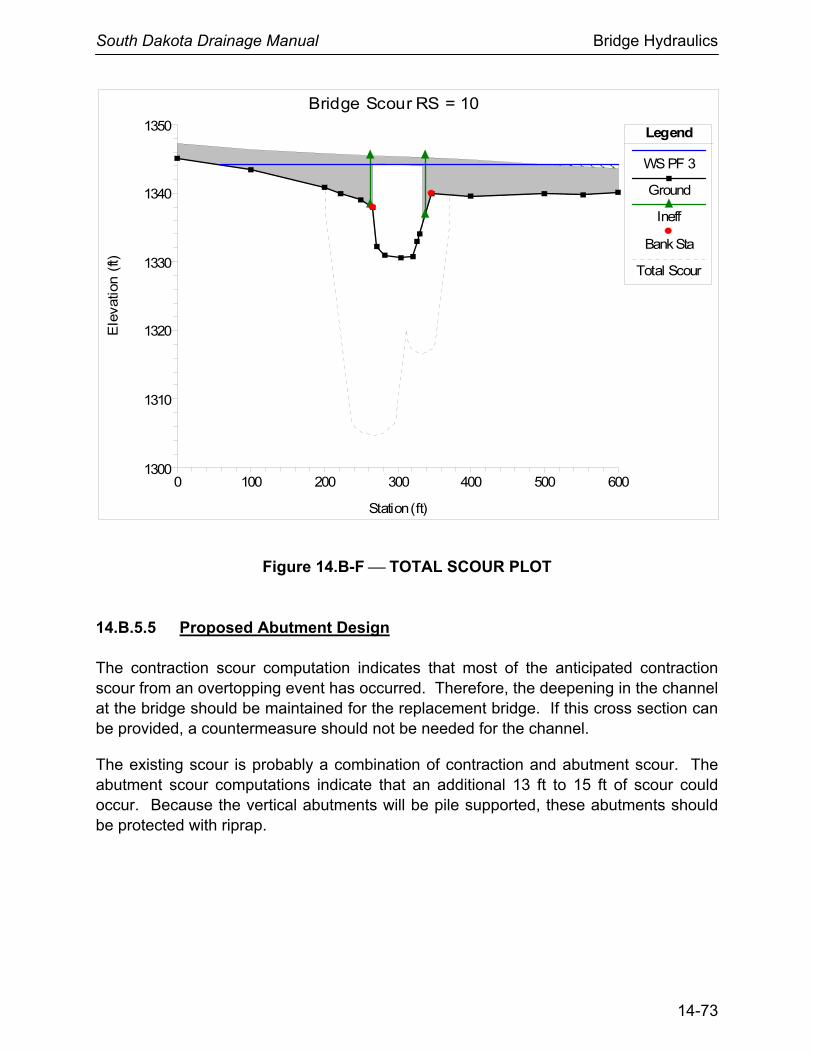
South Dakota Drainage Manual Bridge Hydraulics
14-73
0 100 200 300 400 500 6001300
1310
1320
1330
1340
1350
Bridge Scour RS = 10
Station (ft)
Ele
vatio
n (
ft)
Legend
WS PF 3
Ground
Ineff
Bank Sta
Total Scour
Figure 14.B-F ⎯ TOTAL SCOUR PLOT 14.B.5.5 Proposed Abutment Design The contraction scour computation indicates that most of the anticipated contraction scour from an overtopping event has occurred. Therefore, the deepening in the channel at the bridge should be maintained for the replacement bridge. If this cross section can be provided, a countermeasure should not be needed for the channel.
The existing scour is probably a combination of contraction and abutment scour. The abutment scour computations indicate that an additional 13 ft to 15 ft of scour could occur. Because the vertical abutments will be pile supported, these abutments should be protected with riprap.
South Dakota Drainage Manual Bridge Hydraulics
14-74
Appendix 14.C
HYDRAULICS FOR TEMPORARY FACILITIES
14.C.1 INTRODUCTION
Temporary hydraulic facilities include all channels, culverts or bridges that are required for haul roads, channel relocations, culvert installations, bridge construction, temporary roads or detours. These designs will be included in the contract plans for the project. Typically, the design flood frequency recommended for temporary hydraulic facilities is much lower than that used for permanent hydraulic facilities. This Appendix presents the procedures used in determining the frequency for temporary hydraulic facilities.
As is the case for highway stream crossings, temporary hydraulic facilities should accommodate floods larger than the “design” event to:
• avoid undue liability for damages from excessive backwater, and
• reduce the probability of losing the temporary hydraulic facility during a larger flood.
This can be achieved by:
• providing a low roadway profile that allows the temporary roadway to be overtopped without creating excessive velocities or backwaters;
• posting warnings that the road is expected to be submerged during certain rainfall events for undetermined lengths of time; and
• anchoring the temporary hydraulic facility, if needed.
14.C.2 DESIGN PROCEDURES
The selection of a design flood frequency for temporary hydraulic facilities involves consideration of several factors as discussed in Section 14.C.3. These selection factors are captured and weighted individually (see Figure 14.C-A) within an Impact Rating Value (IRV). The Total Impact Rating Value, which represents the sum total of all pertinent factors at a given crossing (see Figure 14.C-B), is used in Figure 14.C-C to determine Percent Design Risk. The selection of design flood frequency for temporary hydraulic facilities (see Figure 14.C-D) is then based upon the Percent Design Risk and on the anticipated time of use in months. When the design point falls between curves, this figure can be used conservatively by sliding to the right and using the higher frequency event.
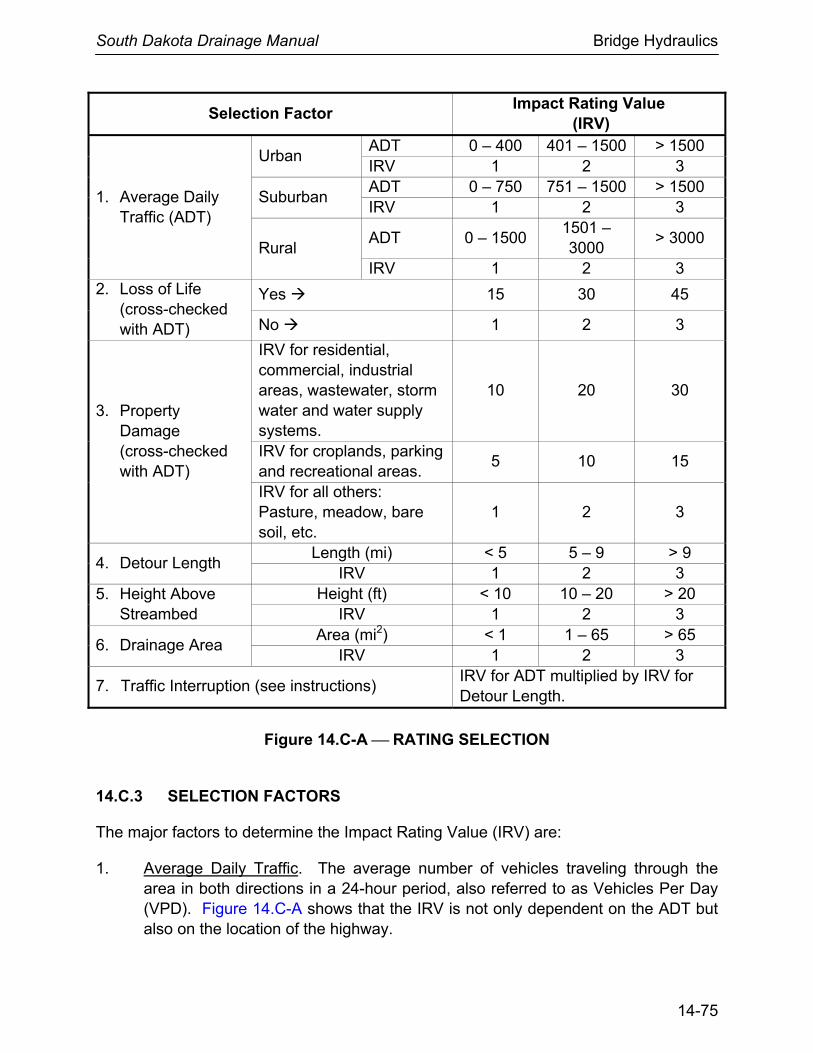
South Dakota Drainage Manual Bridge Hydraulics
14-75
Selection Factor Impact Rating Value
(IRV)
1. Average Daily
Traffic (ADT)
Urban ADT 0 – 400 401 – 1500 > 1500 IRV 1 2 3
Suburban ADT 0 – 750 751 – 1500 > 1500 IRV 1 2 3
Rural ADT 0 – 1500
1501 –3000
> 3000
IRV 1 2 3 2. Loss of Life (cross-checked
with ADT)
Yes 15 30 45
No 1 2 3
3. Property Damage
(cross-checked with ADT)
IRV for residential, commercial, industrial areas, wastewater, storm water and water supply systems.
10 20 30
IRV for croplands, parking and recreational areas.
5 10 15
IRV for all others: Pasture, meadow, bare soil, etc.
1 2 3
4. Detour Length Length (mi) < 5 5 – 9 > 9
IRV 1 2 3 5. Height Above
Streambed Height (ft) < 10 10 – 20 > 20
IRV 1 2 3
6. Drainage Area Area (mi2) < 1 1 – 65 > 65
IRV 1 2 3
7. Traffic Interruption (see instructions) IRV for ADT multiplied by IRV for Detour Length.
Figure 14.C-A ⎯ RATING SELECTION
14.C.3 SELECTION FACTORS
The major factors to determine the Impact Rating Value (IRV) are:
1. Average Daily Traffic. The average number of vehicles traveling through the area in both directions in a 24-hour period, also referred to as Vehicles Per Day (VPD). Figure 14.C-A shows that the IRV is not only dependent on the ADT but also on the location of the highway.
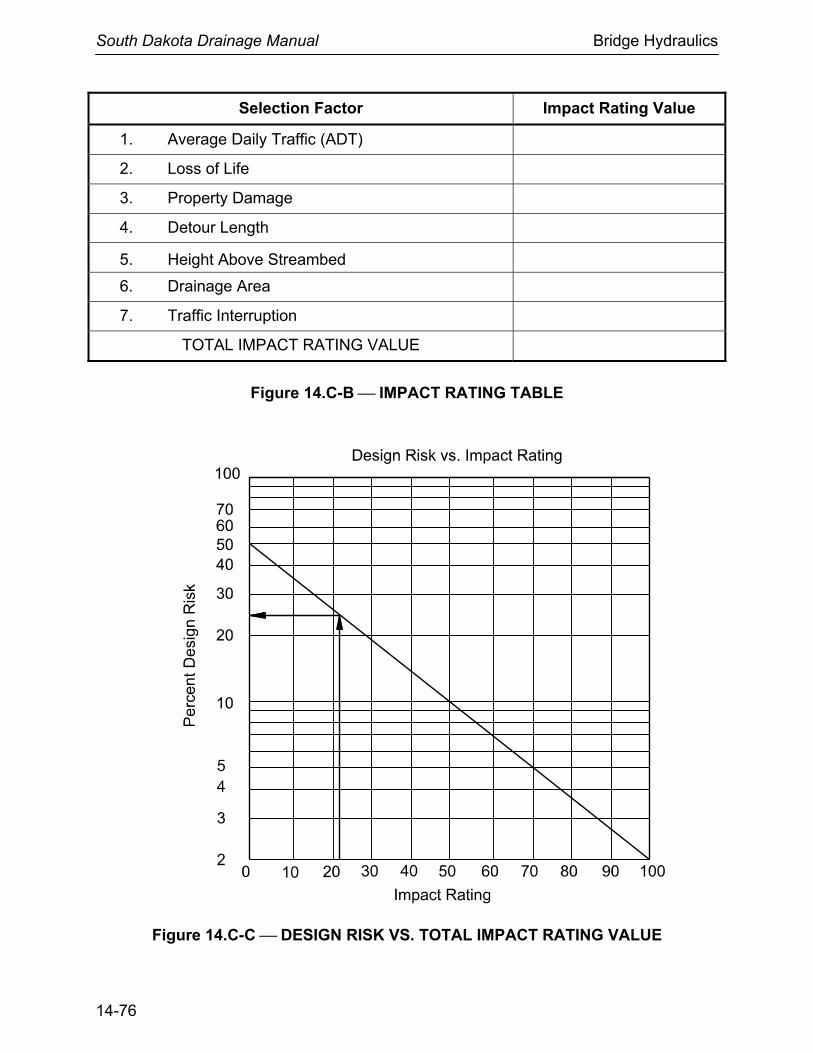
South Dakota Drainage Manual Bridge Hydraulics
14-76
Selection Factor Impact Rating Value
1. Average Daily Traffic (ADT)
2. Loss of Life
3. Property Damage
4. Detour Length
5. Height Above Streambed
6. Drainage Area
7. Traffic Interruption
TOTAL IMPACT RATING VALUE
Figure 14.C-B ⎯ IMPACT RATING TABLE
Figure 14.C-C ⎯ DESIGN RISK VS. TOTAL IMPACT RATING VALUE
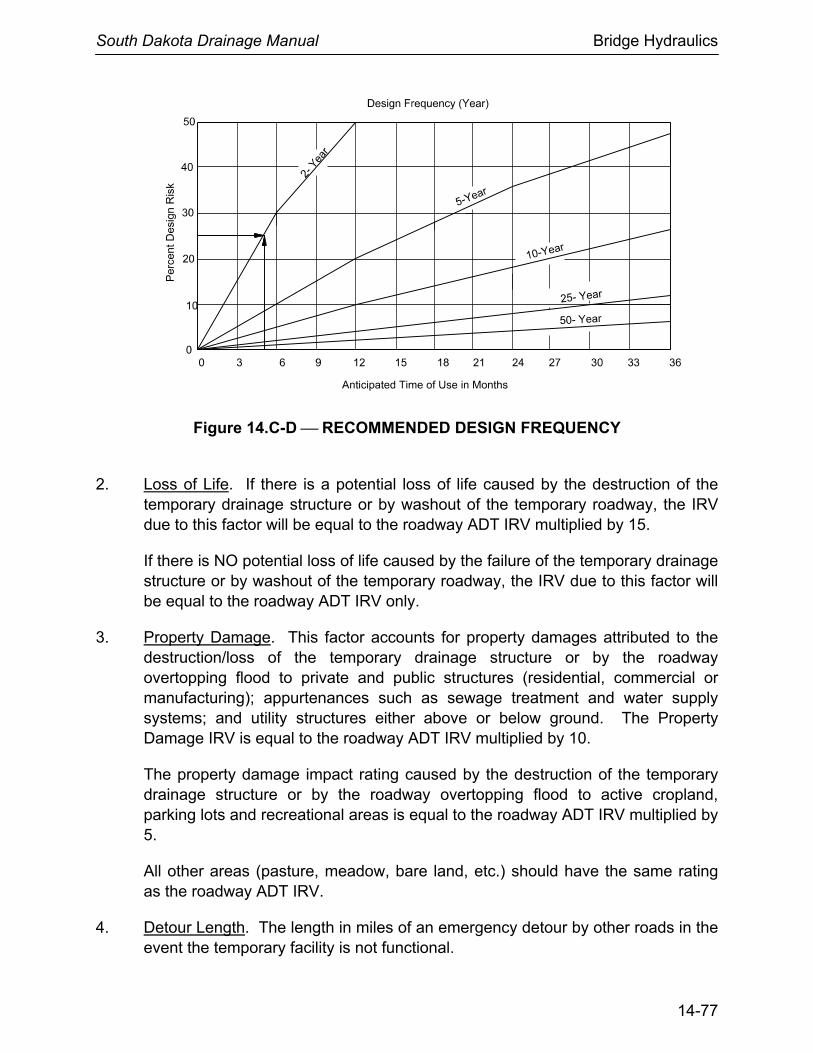
South Dakota Drainage Manual Bridge Hydraulics
14-77
Figure 14.C-D ⎯ RECOMMENDED DESIGN FREQUENCY
2. Loss of Life. If there is a potential loss of life caused by the destruction of the
temporary drainage structure or by washout of the temporary roadway, the IRV due to this factor will be equal to the roadway ADT IRV multiplied by 15.
If there is NO potential loss of life caused by the failure of the temporary drainage structure or by washout of the temporary roadway, the IRV due to this factor will be equal to the roadway ADT IRV only.
3. Property Damage. This factor accounts for property damages attributed to the destruction/loss of the temporary drainage structure or by the roadway overtopping flood to private and public structures (residential, commercial or manufacturing); appurtenances such as sewage treatment and water supply systems; and utility structures either above or below ground. The Property Damage IRV is equal to the roadway ADT IRV multiplied by 10.
The property damage impact rating caused by the destruction of the temporary drainage structure or by the roadway overtopping flood to active cropland, parking lots and recreational areas is equal to the roadway ADT IRV multiplied by 5.
All other areas (pasture, meadow, bare land, etc.) should have the same rating as the roadway ADT IRV.
4. Detour Length. The length in miles of an emergency detour by other roads in the event the temporary facility is not functional.
South Dakota Drainage Manual Bridge Hydraulics
14-78
5. Height Above Streambed. The difference in elevation in feet between the traveled way and the bed of the waterway.
6. Drainage Area. The total drainage area contributing runoff to the temporary hydraulic facility, in sq mi.
7. Traffic Interruption. Includes consideration for emergency supplies and rescue, delays, alternative routes, busses, etc. Short-duration flooding of a low-volume roadway might be acceptable. If the duration of flooding is long (more than one day) and there is a quality alternative route nearby, then the flooding of a higher volume highway might also be acceptable. The Traffic Interruption IRV is determined by the Detour Length IRV multiplied by the Roadway ADT IRV.
Considering the broad breadth and width of temporary hydraulic structures and their construction surroundings, this procedure and the list of seven selection factors presented here cannot possibly capture all potential scenarios and all pertinent design considerations. The procedure addresses the standard, base set of design considerations and constraints that impact the recommended design event for a typical temporary crossing.
These seven factors should not be considered all inclusive. There may be site-specific considerations that are not captured by this procedure. An example would be an upstream flood control structure, such as a US Army Corps reservoir, that releases a known discharge on an annual or semi-annual basis. In that case, user judgment is required to adjust the procedure results or possibly replace it entirely by adopting the Corps’ discharge. Similarly, the design parameters or breakpoints in Figure 14.C-A used to generate IRVs should not be considered unchangeable. For example, some detours may be sufficiently long in the judgment of the user to justify increasing the Detour Length IRV. The increase would subsequently increase the Traffic Interruption IRV and, ultimately, size the temporary structure to a larger design event.
The user is encouraged to apply judgment to each crossing, to add selection factors as required, and to integrate site-specific considerations as needed to tailor or modify the IRV weighting process. This procedure should be used cautiously and in conjunction with risk analysis that compares temporary roadway and waterway opening alternatives across a reasonable and supportable range of design discharges.
South Dakota Drainage Manual Bridge Hydraulics
14-79
14.C.4 EXAMPLE
The following example illustrates the procedure to determine the design frequency recommended for a temporary hydraulic facility.
Given:
A section of a rural roadway will be widened. There is an existing 8 × 4 ft × 40 ft box culvert with a drainage area of 320 acres that must be replaced. A temporary structure and roadway will be provided on the downstream side of the existing roadway. The Average Daily Traffic (ADT) of the highway is 2000 vehicles per day (VPD). The top of the temporary roadway is approximately 8 ft above the streambed. The land use on the upstream side of the proposed temporary hydraulic facility is predominantly croplands. If the temporary roadway becomes non-functional, the detour length is approximately 6 mi. The danger of loss of life due to the destruction of the temporary hydraulic facility is minimal. The anticipated use of the temporary runaround facility is five months.
Problem: Find the design frequency for the temporary hydraulic facility.
Solution:
A. Compute the Impact Rating Value (IRV) based on Figure 14.C-A:
• For a rural roadway with ADT of 2000 vpd, the IRV is 2. • The IRV for no loss of life with this type of highway is 2. • The Property Damage IRV is 10 (croplands). • For Detour Length equal to 6 mi, the IRV is 2. • For height above streambed of 8 ft, the IRV is 1. • For Drainage Area = 320 acres, the IRV is 1. • The IRV for traffic interruption is the product of the ADT IRV (2) times the
Detour Length IRV (2). The product is 4. B. Total Impact Rating Value (IRV) The Total Impact Rating Value = 22, as shown in Figure 14.C-E. C. Compute the Percent Design Risk Value:
From Figure 14.C-C, for a Total Impact Rating Value = 22, the value of the Percent Design Risk is 25 percent.
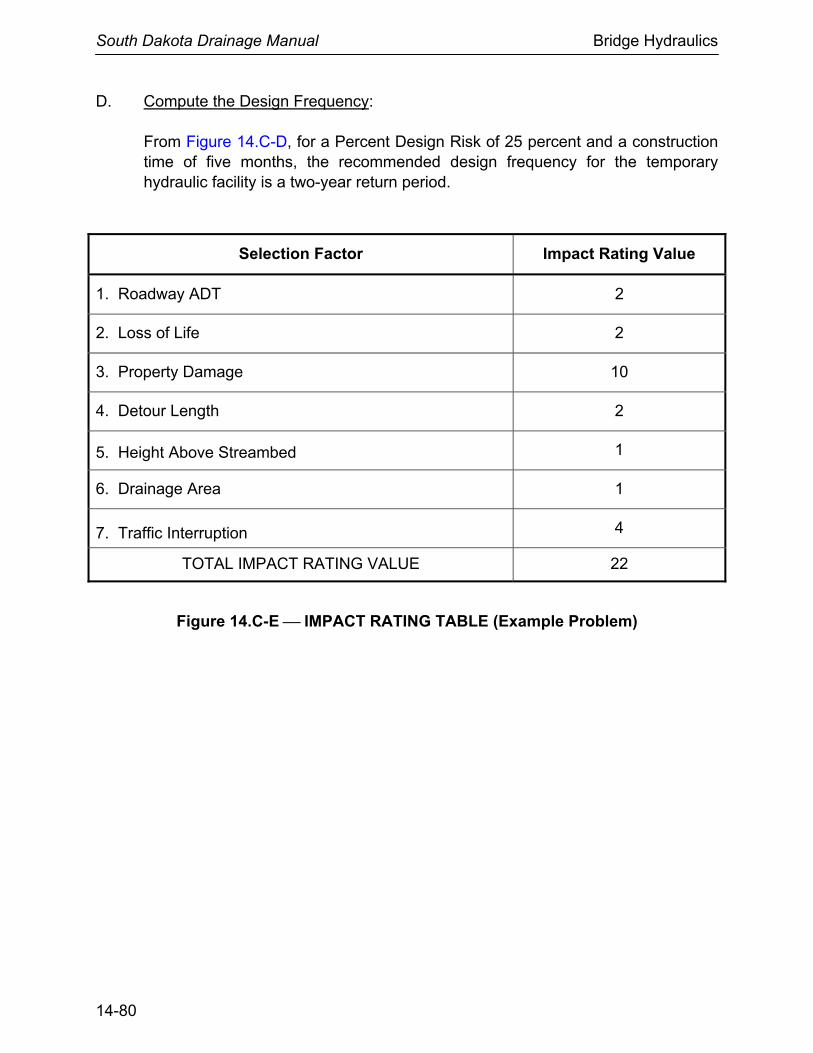
South Dakota Drainage Manual Bridge Hydraulics
14-80
D. Compute the Design Frequency: From Figure 14.C-D, for a Percent Design Risk of 25 percent and a construction
time of five months, the recommended design frequency for the temporary hydraulic facility is a two-year return period.
Selection Factor Impact Rating Value
1. Roadway ADT 2
2. Loss of Life 2
3. Property Damage 10
4. Detour Length 2
5. Height Above Streambed 1
6. Drainage Area 1
7. Traffic Interruption 4
TOTAL IMPACT RATING VALUE 22
Figure 14.C-E ⎯ IMPACT RATING TABLE (Example Problem)
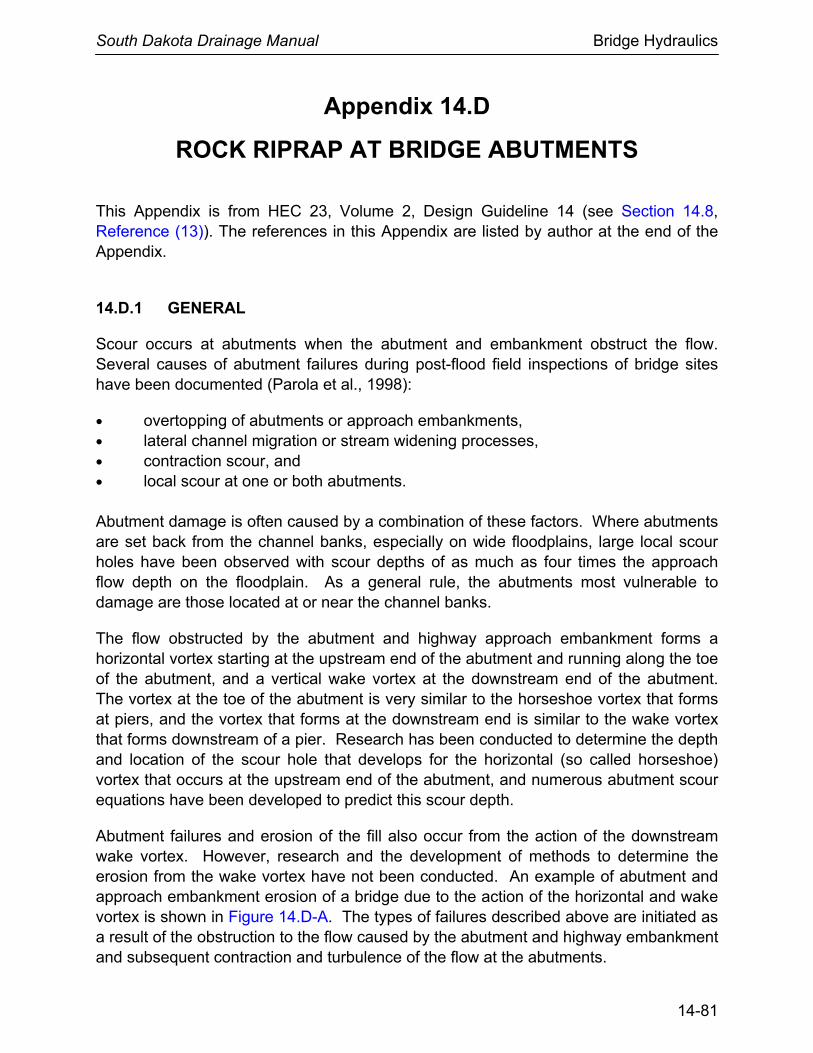
South Dakota Drainage Manual Bridge Hydraulics
14-81
Appendix 14.D
ROCK RIPRAP AT BRIDGE ABUTMENTS
This Appendix is from HEC 23, Volume 2, Design Guideline 14 (see Section 14.8, Reference (13)). The references in this Appendix are listed by author at the end of the Appendix.
14.D.1 GENERAL
Scour occurs at abutments when the abutment and embankment obstruct the flow. Several causes of abutment failures during post-flood field inspections of bridge sites have been documented (Parola et al., 1998):
• overtopping of abutments or approach embankments, • lateral channel migration or stream widening processes, • contraction scour, and • local scour at one or both abutments. Abutment damage is often caused by a combination of these factors. Where abutments are set back from the channel banks, especially on wide floodplains, large local scour holes have been observed with scour depths of as much as four times the approach flow depth on the floodplain. As a general rule, the abutments most vulnerable to damage are those located at or near the channel banks.
The flow obstructed by the abutment and highway approach embankment forms a horizontal vortex starting at the upstream end of the abutment and running along the toe of the abutment, and a vertical wake vortex at the downstream end of the abutment. The vortex at the toe of the abutment is very similar to the horseshoe vortex that forms at piers, and the vortex that forms at the downstream end is similar to the wake vortex that forms downstream of a pier. Research has been conducted to determine the depth and location of the scour hole that develops for the horizontal (so called horseshoe) vortex that occurs at the upstream end of the abutment, and numerous abutment scour equations have been developed to predict this scour depth.
Abutment failures and erosion of the fill also occur from the action of the downstream wake vortex. However, research and the development of methods to determine the erosion from the wake vortex have not been conducted. An example of abutment and approach embankment erosion of a bridge due to the action of the horizontal and wake vortex is shown in Figure 14.D-A. The types of failures described above are initiated as a result of the obstruction to the flow caused by the abutment and highway embankment and subsequent contraction and turbulence of the flow at the abutments.
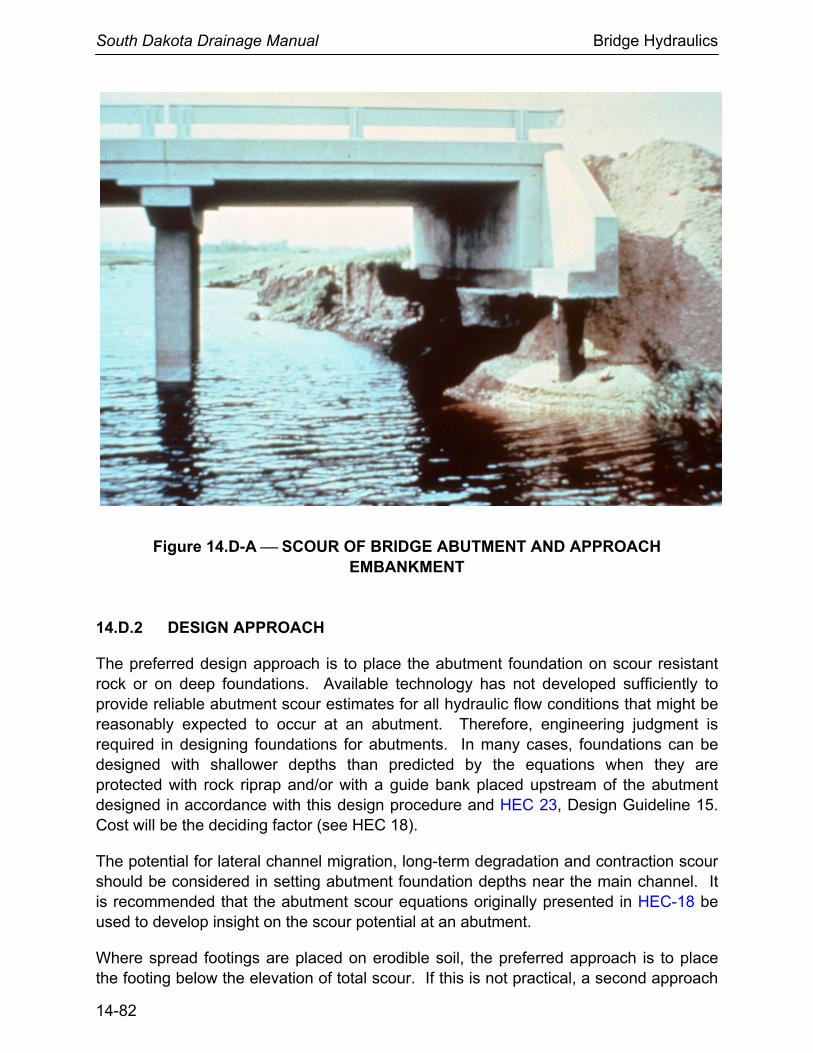
South Dakota Drainage Manual Bridge Hydraulics
14-82
Figure 14.D-A ⎯ SCOUR OF BRIDGE ABUTMENT AND APPROACH EMBANKMENT
14.D.2 DESIGN APPROACH
The preferred design approach is to place the abutment foundation on scour resistant rock or on deep foundations. Available technology has not developed sufficiently to provide reliable abutment scour estimates for all hydraulic flow conditions that might be reasonably expected to occur at an abutment. Therefore, engineering judgment is required in designing foundations for abutments. In many cases, foundations can be designed with shallower depths than predicted by the equations when they are protected with rock riprap and/or with a guide bank placed upstream of the abutment designed in accordance with this design procedure and HEC 23, Design Guideline 15. Cost will be the deciding factor (see HEC 18).
The potential for lateral channel migration, long-term degradation and contraction scour should be considered in setting abutment foundation depths near the main channel. It is recommended that the abutment scour equations originally presented in HEC-18 be used to develop insight on the scour potential at an abutment.
Where spread footings are placed on erodible soil, the preferred approach is to place the footing below the elevation of total scour. If this is not practical, a second approach
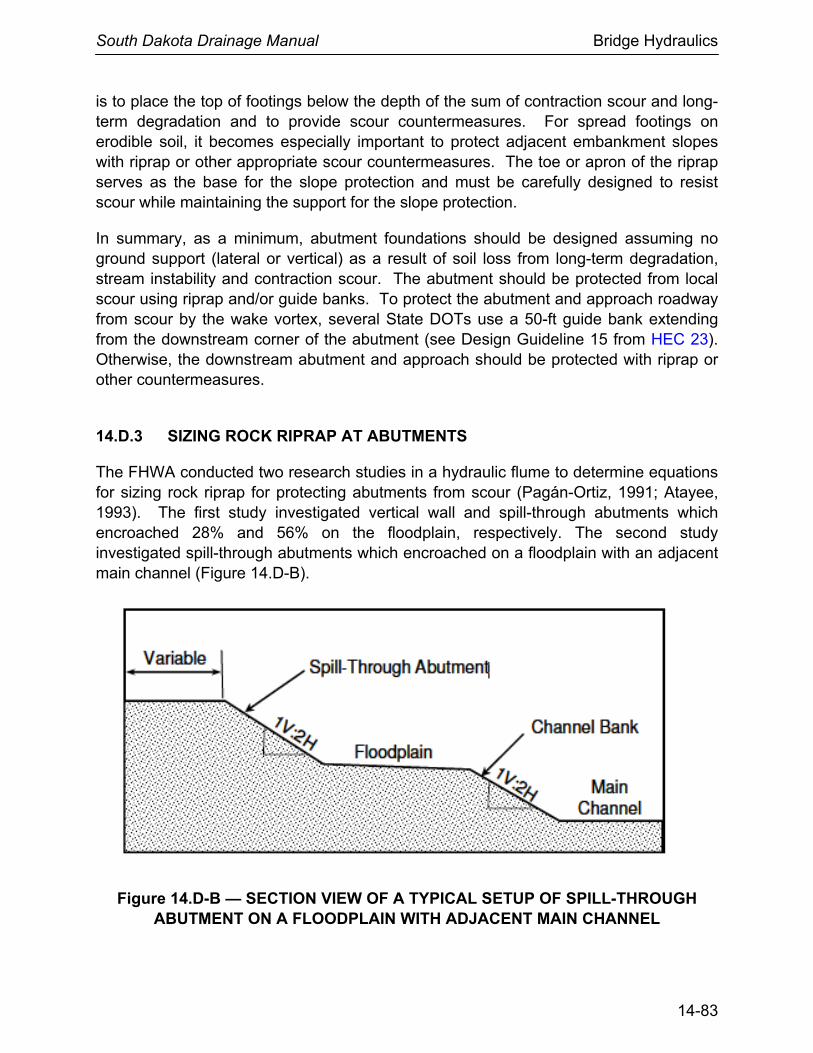
South Dakota Drainage Manual Bridge Hydraulics
14-83
is to place the top of footings below the depth of the sum of contraction scour and long-term degradation and to provide scour countermeasures. For spread footings on erodible soil, it becomes especially important to protect adjacent embankment slopes with riprap or other appropriate scour countermeasures. The toe or apron of the riprap serves as the base for the slope protection and must be carefully designed to resist scour while maintaining the support for the slope protection.
In summary, as a minimum, abutment foundations should be designed assuming no ground support (lateral or vertical) as a result of soil loss from long-term degradation, stream instability and contraction scour. The abutment should be protected from local scour using riprap and/or guide banks. To protect the abutment and approach roadway from scour by the wake vortex, several State DOTs use a 50-ft guide bank extending from the downstream corner of the abutment (see Design Guideline 15 from HEC 23). Otherwise, the downstream abutment and approach should be protected with riprap or other countermeasures.
14.D.3 SIZING ROCK RIPRAP AT ABUTMENTS
The FHWA conducted two research studies in a hydraulic flume to determine equations for sizing rock riprap for protecting abutments from scour (Pagán-Ortiz, 1991; Atayee, 1993). The first study investigated vertical wall and spill-through abutments which encroached 28% and 56% on the floodplain, respectively. The second study investigated spill-through abutments which encroached on a floodplain with an adjacent main channel (Figure 14.D-B).
Figure 14.D-B — SECTION VIEW OF A TYPICAL SETUP OF SPILL-THROUGH ABUTMENT ON A FLOODPLAIN WITH ADJACENT MAIN CHANNEL
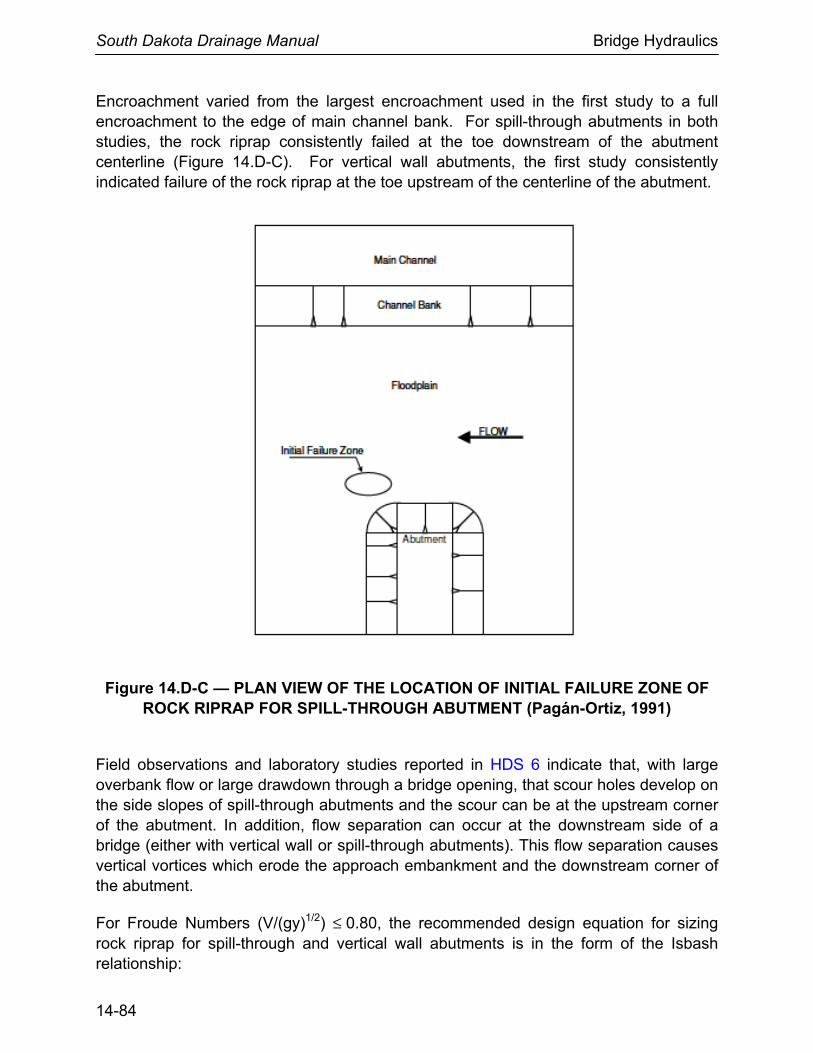
South Dakota Drainage Manual Bridge Hydraulics
14-84
Encroachment varied from the largest encroachment used in the first study to a full encroachment to the edge of main channel bank. For spill-through abutments in both studies, the rock riprap consistently failed at the toe downstream of the abutment centerline (Figure 14.D-C). For vertical wall abutments, the first study consistently indicated failure of the rock riprap at the toe upstream of the centerline of the abutment.
Figure 14.D-C — PLAN VIEW OF THE LOCATION OF INITIAL FAILURE ZONE OF ROCK RIPRAP FOR SPILL-THROUGH ABUTMENT (Pagán-Ortiz, 1991)
Field observations and laboratory studies reported in HDS 6 indicate that, with large overbank flow or large drawdown through a bridge opening, that scour holes develop on the side slopes of spill-through abutments and the scour can be at the upstream corner of the abutment. In addition, flow separation can occur at the downstream side of a bridge (either with vertical wall or spill-through abutments). This flow separation causes vertical vortices which erode the approach embankment and the downstream corner of the abutment.
For Froude Numbers (V/(gy)1/2) ≤ 0.80, the recommended design equation for sizing rock riprap for spill-through and vertical wall abutments is in the form of the Isbash relationship:
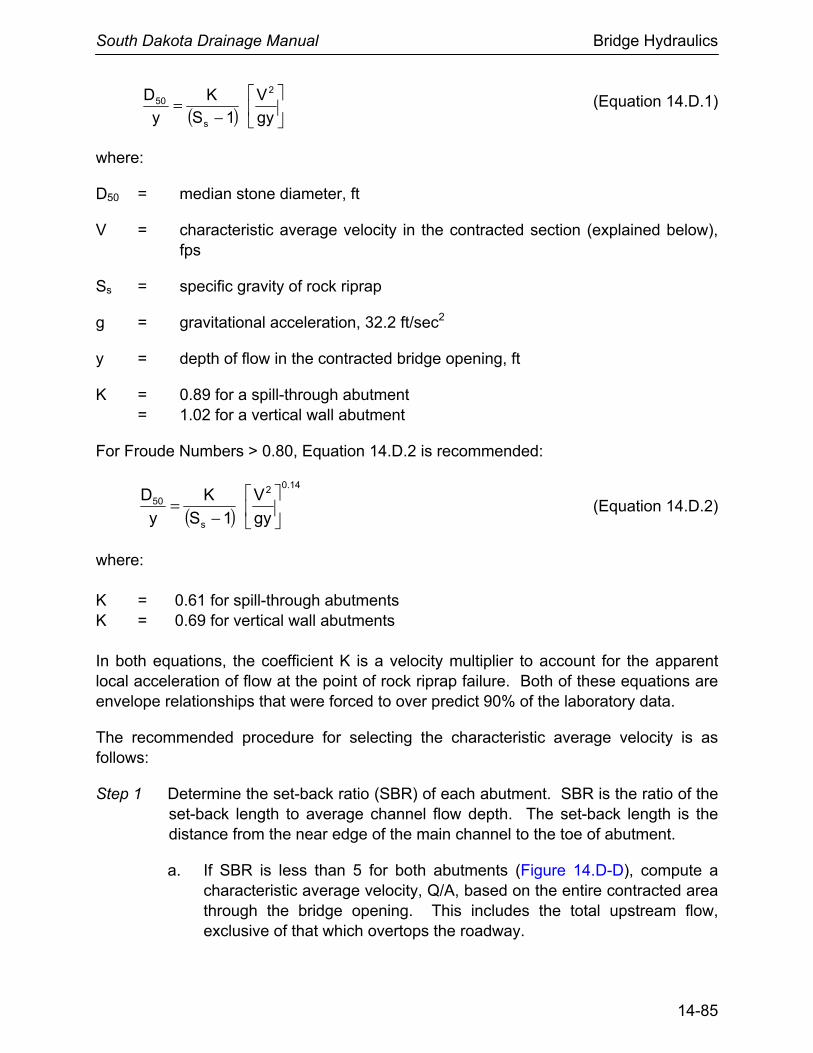
South Dakota Drainage Manual Bridge Hydraulics
14-85
( )
−
=gy
V
1S
K
y
D 2
s
50 (Equation 14.D.1)
where:
D50 = median stone diameter, ft
V = characteristic average velocity in the contracted section (explained below), fps
Ss = specific gravity of rock riprap
g = gravitational acceleration, 32.2 ft/sec2
y = depth of flow in the contracted bridge opening, ft
K = 0.89 for a spill-through abutment = 1.02 for a vertical wall abutment
For Froude Numbers > 0.80, Equation 14.D.2 is recommended:
( )14.02
s
50
gy
V
1S
K
y
D
−
= (Equation 14.D.2)
where: K = 0.61 for spill-through abutments K = 0.69 for vertical wall abutments In both equations, the coefficient K is a velocity multiplier to account for the apparent local acceleration of flow at the point of rock riprap failure. Both of these equations are envelope relationships that were forced to over predict 90% of the laboratory data.
The recommended procedure for selecting the characteristic average velocity is as follows:
Step 1 Determine the set-back ratio (SBR) of each abutment. SBR is the ratio of the set-back length to average channel flow depth. The set-back length is the distance from the near edge of the main channel to the toe of abutment.
a. If SBR is less than 5 for both abutments (Figure 14.D-D), compute a characteristic average velocity, Q/A, based on the entire contracted area through the bridge opening. This includes the total upstream flow, exclusive of that which overtops the roadway.
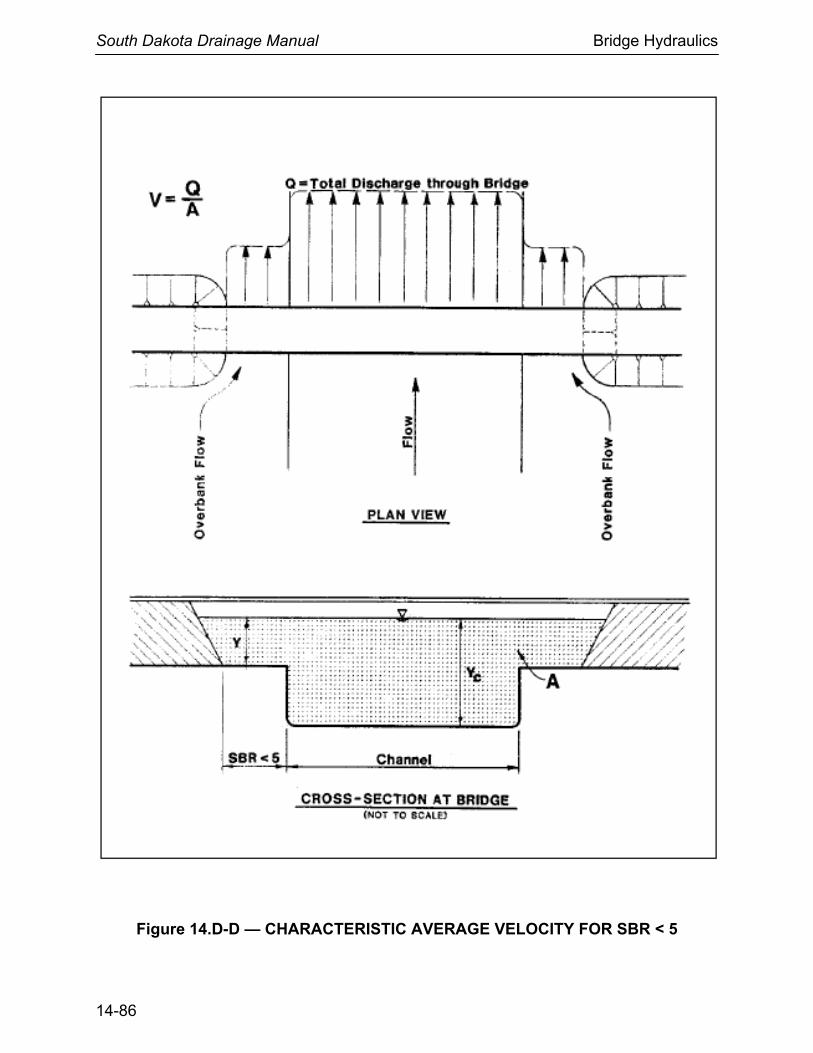
South Dakota Drainage Manual Bridge Hydraulics
14-86
Figure 14.D-D — CHARACTERISTIC AVERAGE VELOCITY FOR SBR < 5
South Dakota Drainage Manual Bridge Hydraulics
14-87
b. If SBR is greater than 5 for an abutment (Figure 14.D-E), compute a characteristic average velocity, Q/A, for the respective overbank flow only. Assume that the entire respective overbank flow stays in the overbank section through the bridge opening.
c. If SBR for an abutment is less than 5 and SBR for the other abutment at the same site is more than 5 (Figure 14.D-F), a characteristic average velocity determined from Step 1a for the abutment with SBR less than 5 may be unrealistically low. This would, of course, depend upon the opposite overbank discharge as well as how far the other abutment is set back. For this case, the characteristic average velocity for the abutment with SBR less than 5 should be based on the flow area limited by the boundary of that abutment and an imaginary wall located on the opposite channel bank. The appropriate discharge is bounded by this imaginary wall and the outer edge of the floodplain associated with that abutment.
Step 2 Recent research results published by the Transportation Research Board as NCHRP Report 587, “Countermeasures to Protect Bridge Abutments from Scour,” endorse the use of the SBR approach for sizing riprap at spill-through abutments (Barkdoll et al., 2007). NCHRP Report 568, “Riprap Design Criteria, Recommended Specifications, and Quality Control,” recommends an additional criteria for selecting a characteristic average velocity when applying the SBR method (Lagasse et al., 2006). Based on the results of 2- dimensional computer modeling of a typical abutment configuration, NCHRP Report 568 concludes:
a. Whenever the SBR is less than 5, the average velocity in the bridge opening provides a good estimate for the velocity at the abutment.
b. When the SBR is greater than 5, the recommended adjustment is to compare the velocity from the SBR method to the maximum velocity in the channel within the bridge opening and select the lower velocity.
c. The SBR method is well suited for estimating velocity at an abutment if the estimated velocity does not exceed the maximum velocity in the channel.
Step 3 Compute rock riprap size from Equations 14.D.2 or 14.D.3, based on the Froude Number limitation for these equations. A recent study of riprap size selection for wing wall abutments (Melville et al., 2007) verified that these equations give stable stone size for riprap layers at wing wall abutments under subcritical mobile-bed conditions. Based on experimental results, this study concluded that, with the SBR approach, riprap size selection is appropriately based on stability against shear and edge failure. It is noted that stability against winnowing or bed-form undermining (see HEC-23,
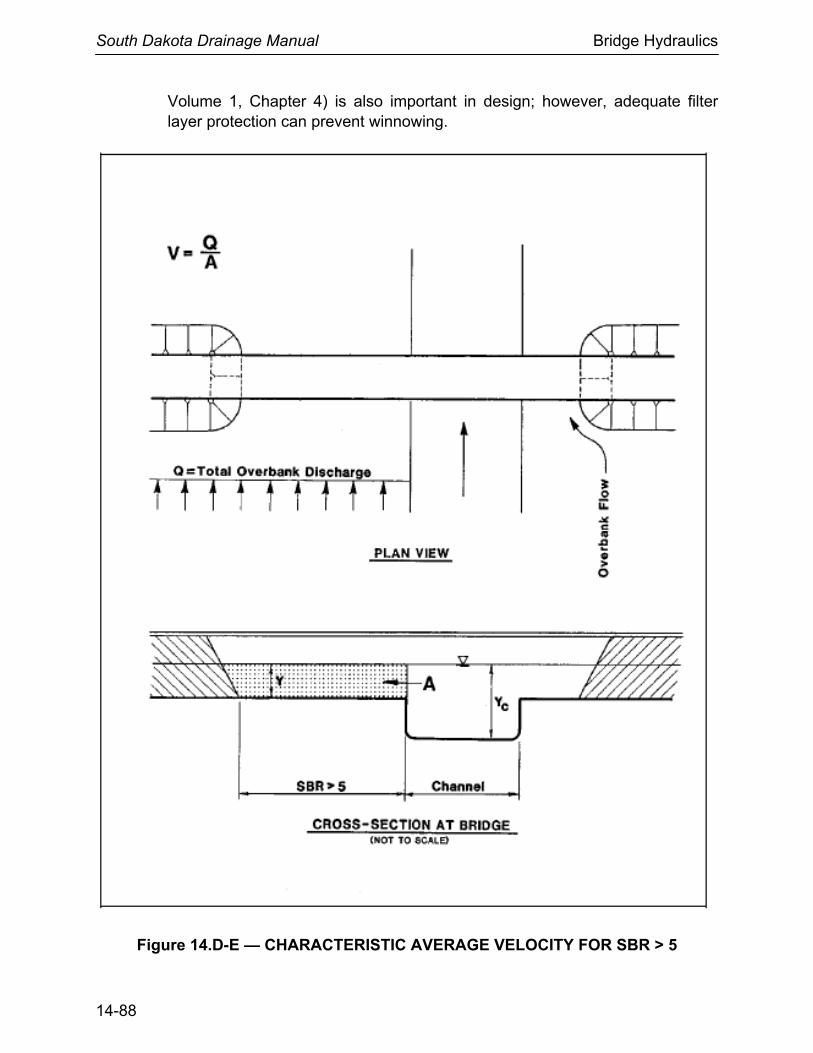
South Dakota Drainage Manual Bridge Hydraulics
14-88
Volume 1, Chapter 4) is also important in design; however, adequate filter layer protection can prevent winnowing.
Figure 14.D-E — CHARACTERISTIC AVERAGE VELOCITY FOR SBR > 5
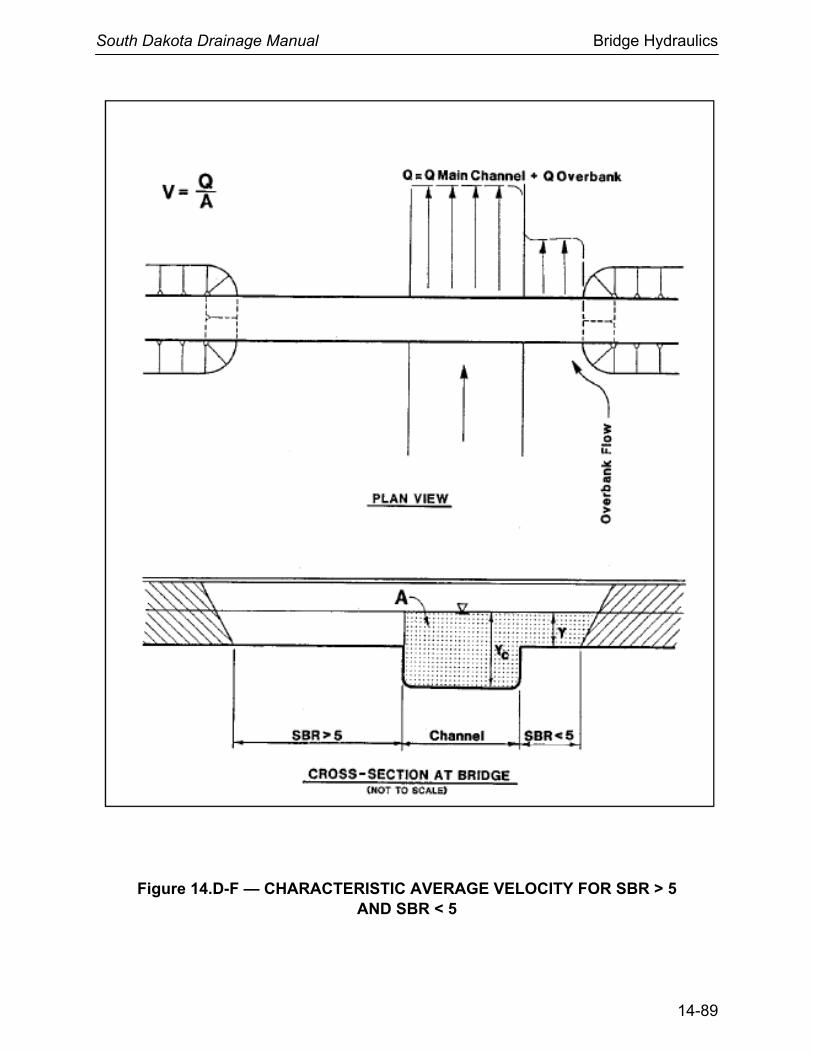
South Dakota Drainage Manual Bridge Hydraulics
14-89
Figure 14.D-F — CHARACTERISTIC AVERAGE VELOCITY FOR SBR > 5 AND SBR < 5
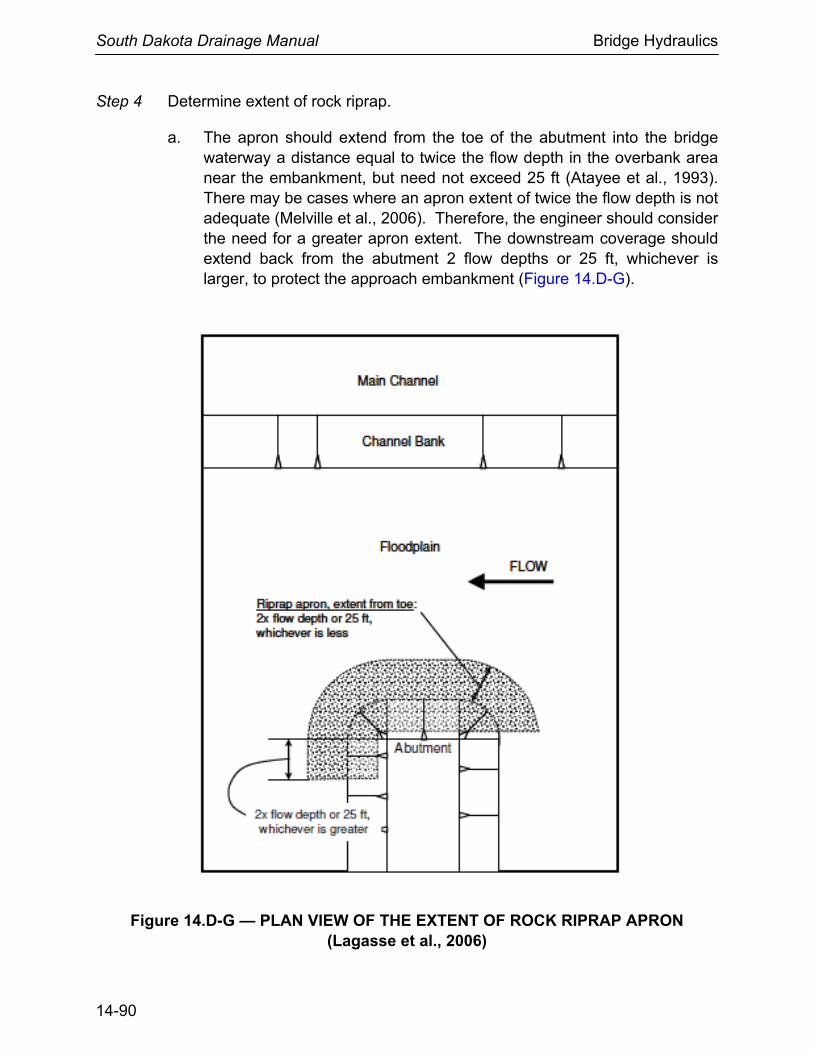
South Dakota Drainage Manual Bridge Hydraulics
14-90
Step 4 Determine extent of rock riprap.
a. The apron should extend from the toe of the abutment into the bridge waterway a distance equal to twice the flow depth in the overbank area near the embankment, but need not exceed 25 ft (Atayee et al., 1993). There may be cases where an apron extent of twice the flow depth is not adequate (Melville et al., 2006). Therefore, the engineer should consider the need for a greater apron extent. The downstream coverage should extend back from the abutment 2 flow depths or 25 ft, whichever is larger, to protect the approach embankment (Figure 14.D-G).
Figure 14.D-G — PLAN VIEW OF THE EXTENT OF ROCK RIPRAP APRON (Lagasse et al., 2006)
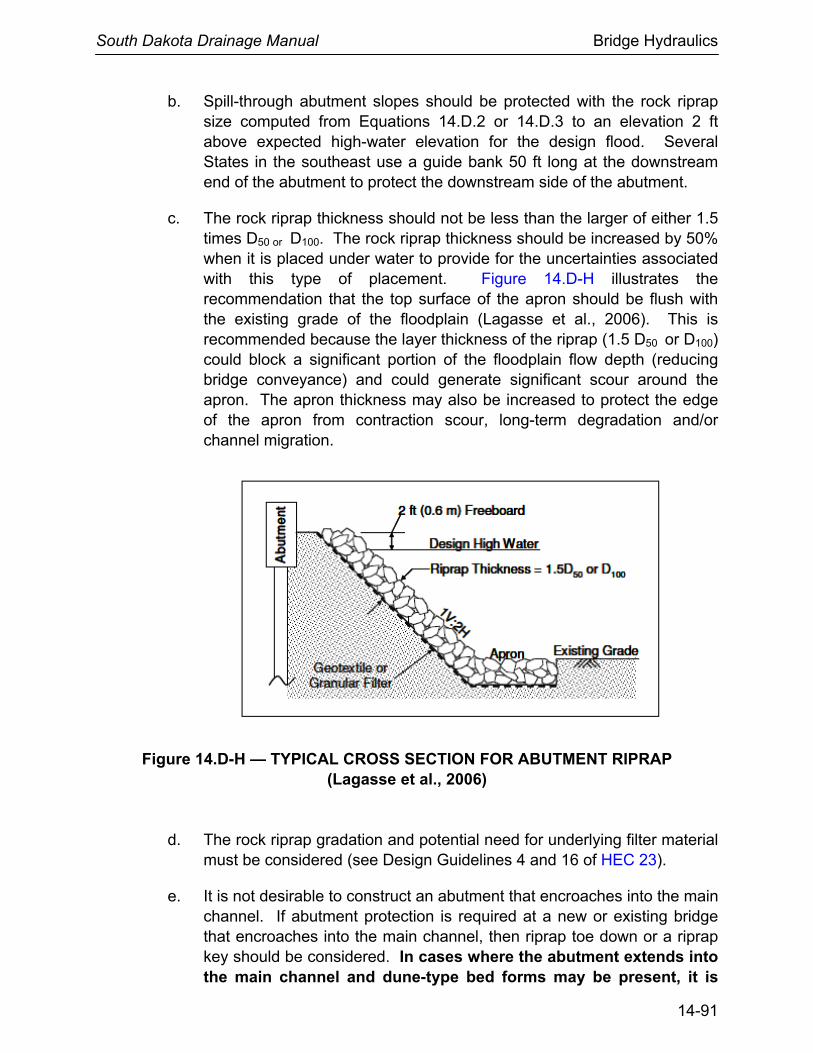
South Dakota Drainage Manual Bridge Hydraulics
14-91
b. Spill-through abutment slopes should be protected with the rock riprap size computed from Equations 14.D.2 or 14.D.3 to an elevation 2 ft above expected high-water elevation for the design flood. Several States in the southeast use a guide bank 50 ft long at the downstream end of the abutment to protect the downstream side of the abutment.
c. The rock riprap thickness should not be less than the larger of either 1.5 times D50 or D100. The rock riprap thickness should be increased by 50% when it is placed under water to provide for the uncertainties associated with this type of placement. Figure 14.D-H illustrates the recommendation that the top surface of the apron should be flush with the existing grade of the floodplain (Lagasse et al., 2006). This is recommended because the layer thickness of the riprap (1.5 D50 or D100) could block a significant portion of the floodplain flow depth (reducing bridge conveyance) and could generate significant scour around the apron. The apron thickness may also be increased to protect the edge of the apron from contraction scour, long-term degradation and/or channel migration.
Figure 14.D-H — TYPICAL CROSS SECTION FOR ABUTMENT RIPRAP (Lagasse et al., 2006)
d. The rock riprap gradation and potential need for underlying filter material must be considered (see Design Guidelines 4 and 16 of HEC 23).
e. It is not desirable to construct an abutment that encroaches into the main channel. If abutment protection is required at a new or existing bridge that encroaches into the main channel, then riprap toe down or a riprap key should be considered. In cases where the abutment extends into the main channel and dune-type bed forms may be present, it is
South Dakota Drainage Manual Bridge Hydraulics
14-92
strongly recommended that only a geotextile filter be considered for the riprap protection.
14.D.4 DESIGN EXAMPLE FOR RIPRAP AT BRIDGE ABUTMENTS
Riprap is to be sized for an abutment located on the floodplain at an existing bridge. The bridge is 650 ft long, has spill-through abutments on a 2H:1V side slope and seven equally spaced spans. The left abutment is set back from the main channel 225 ft. Given the following tables of hydraulic characteristics for the left abutment, size the riprap.
Overbank Property
Value Remarks
y 2.7 ft Flow depth adjacent to abutment
Q 7720 cfs Discharge in left overbank
A 613.5 sq ft Flow area of left overbank
Channel Property
Value Remarks
y 9.7 ft Flow depth in main channel
Q 25,500 cfs Discharge in main channel
A 1977 sq ft Flow area in main channel
Step 1 Determine the SBR (set-back distance divided by the average channel flow depth):
2.237.9
225SBR ==
Step 2 Determine characteristic average velocity, V. SBR is greater than 5; therefore, overbank discharge and areas are used to determine V:
V = Q/A = 7720/613.5 = 12.6 fps
Step 3 Check SBR velocity against main channel velocity:
fps98.121977
500,25
A
QV
c
cc ===
Velocity in channel is greater than SBR velocity; therefore, use SBR velocity.
Step 4 Determine the Froude Number of the flow:
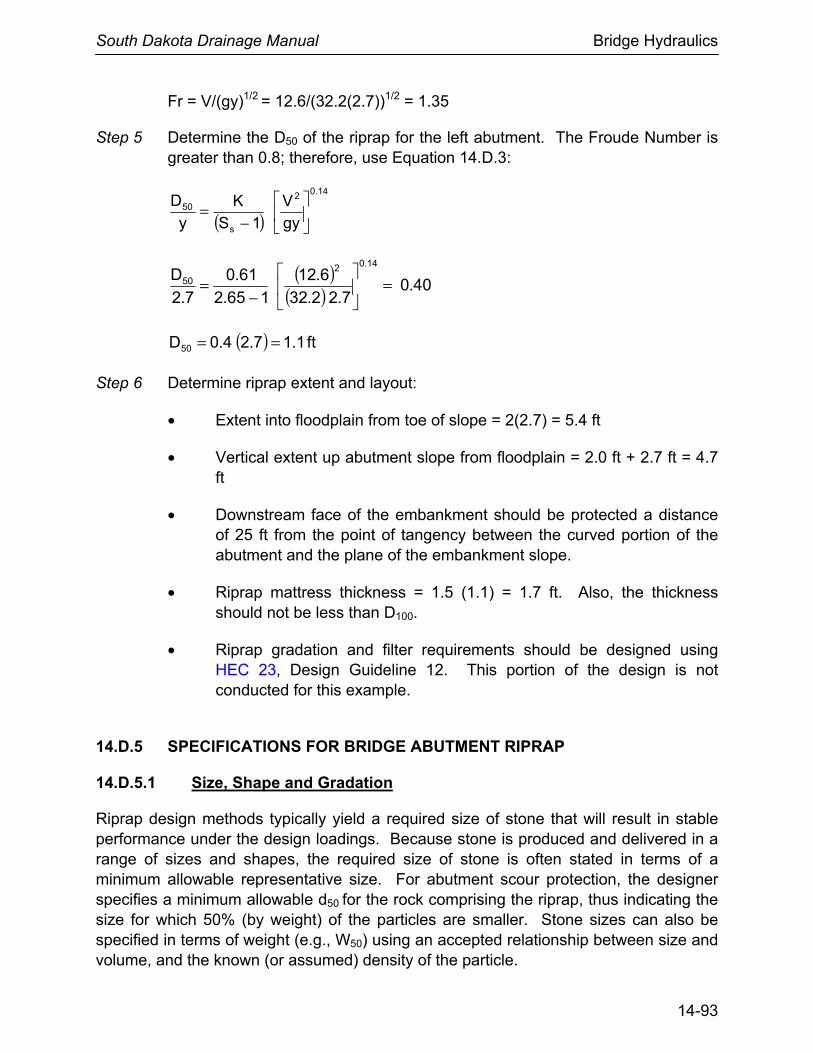
South Dakota Drainage Manual Bridge Hydraulics
14-93
Fr = V/(gy)1/2 = 12.6/(32.2(2.7))1/2 = 1.35
Step 5 Determine the D50 of the riprap for the left abutment. The Froude Number is greater than 0.8; therefore, use Equation 14.D.3:
( )14.02
s
50
gy
V
1S
K
y
D
−
=
( )
( ) 40.07.22.32
6.12
165.2
61.0
7.2
D14.02
50 =
−=
( ) ft1.17.24.0D50 ==
Step 6 Determine riprap extent and layout:
• Extent into floodplain from toe of slope = 2(2.7) = 5.4 ft
• Vertical extent up abutment slope from floodplain = 2.0 ft + 2.7 ft = 4.7 ft
• Downstream face of the embankment should be protected a distance of 25 ft from the point of tangency between the curved portion of the abutment and the plane of the embankment slope.
• Riprap mattress thickness = 1.5 (1.1) = 1.7 ft. Also, the thickness should not be less than D100.
• Riprap gradation and filter requirements should be designed using HEC 23, Design Guideline 12. This portion of the design is not conducted for this example.
14.D.5 SPECIFICATIONS FOR BRIDGE ABUTMENT RIPRAP
14.D.5.1 Size, Shape and Gradation
Riprap design methods typically yield a required size of stone that will result in stable performance under the design loadings. Because stone is produced and delivered in a range of sizes and shapes, the required size of stone is often stated in terms of a minimum allowable representative size. For abutment scour protection, the designer specifies a minimum allowable d50 for the rock comprising the riprap, thus indicating the size for which 50% (by weight) of the particles are smaller. Stone sizes can also be specified in terms of weight (e.g., W50) using an accepted relationship between size and volume, and the known (or assumed) density of the particle.
South Dakota Drainage Manual Bridge Hydraulics
14-94
For the shape, weight, density and gradation of bridge abutment riprap, specifications developed for revetment riprap are applicable (Lagasse et al., 2006). These specifications are provided in Design Guideline 4, HEC 23 (see Section 4.2.4).
Design Guideline 4 recommends gradations for ten standard classes of riprap based on the median particle diameter d50 as determined by the dimension of the intermediate (“B”) axis. These gradations were developed under NCHRP Project 24-23, “Riprap Design Criteria, Recommended Specifications, and Quality Control.” The proposed gradation criteria are based on a nominal or “target” D50 and a uniformity ratio D85/D15
that results in riprap that is well graded. The target uniformity ratio is 2.0 and the allowable range is from 1.5 to 2.5 (Lagasse et al., 2006).
14.D.5.2 Recommended Tests for Rock Quality
Standard test methods relating to material type, characteristics, and testing of rock and aggregates recommended for revetment riprap are applicable to bridge abutment riprap (see Design Guideline 4). In general, the test methods recommended are intended to ensure that the stone is dense and durable, and will not degrade significantly over time.
Rocks used for riprap should only break with difficulty, have no earthy odor, no closely spaced discontinuities (joints or bedding planes) and should not absorb water easily. Rocks comprised of appreciable amounts of clay, such as shales, mudstones and claystones, are never acceptable for use as riprap. The recommended tests and allowable values for rock and aggregate are summarized in Table 4.3 of Design Guideline 4, HEC 23.
14.D.6 REFERENCES
(1) Atayee, A. Tamin, “Study of Riprap as Scour Protection for Spill Through Abutment,” presented at the 72nd Annual TRB meeting in Washington DC, January, 1993.
(2) Atayee, A. Tamin, Pagán-Ortiz, Jorge E., Jones, J.S., and Kilgore, R.T., 1993, “A Study of Riprap as a Scour Protection for Spill Through Abutments,” ASCE Hydraulic Conference, San Francisco, CA.
(3) Barkdoll, B. D., Ettema, R., and Melville, B. W., 2007, “Countermeasures to Protect Bridge Abutments from Scour,” NCHRP Report 587, Transportation Research Board, National Academies of Science, Washington DC.
(4) Lagasse, P. F., Clopper, P. E., Zevenbergen, L. W., and Ruff, J. F., 2006, “Riprap Design Criteria, Recommended Specifications and Quality Control,” NCHRP Report 568, Transportation Research Board, Academies of Science, Washington DC.
South Dakota Drainage Manual Bridge Hydraulics
14-95
(5) Melville, B. W., van Ballegooy, S., Coleman, S., and Barkdoll, B., 2007, “Riprap Size Selection at Wing-Wall Abutments,” Technical Note, ASCE, Journal of Hydraulic Engineering, Vol. 133, No. 11, November.
(6) Melville, B. W., van Ballegooy, S., Coleman, S., and Barkdoll, B., 2006, “Countermeasure Toe Protection at Spill Through Abutments,” ASCE Journal of Hydraulic Engineering, Vol. 132, No. 3.
(7) Pagán-Ortiz, Jorge E., 1991, “Stability of Rock Riprap for Protection at the Toe of Abutments Located at the Floodplain,” FHWA Research Report No. FHWA-RD-91-057, US Department of Transportation, Washington DC.
(8) Parola, A. C., Hagerty, D. J., and Kamojjala, S., 1998, NCHRP Report 417, “Highway Infrastructure Damage Caused by the 1993 Upper Mississippi River Basin Flooding,” Transportation Research Board.
(9) Richardson, E. V. and Davis, S. R., 2001, “Evaluating Scour at Bridges,” Hydraulic Engineering Circular 18, Fourth Edition, FHWA NHI 01-001, Federal Highway Administration, US Department of Transportation, Washington DC.
(10) Richardson, E. V., Simons, D. B., and Lagasse, P. F., 2001, “River Engineering for Highway Encroachments - Highways in the River Environment,” Report FHWA NHI 01-004, Federal Highway Administration, Hydraulic Design Series No. 6, Washington DC.

South Dakota Drainage Manual Bridge Hydraulics
14-96