
CHAPTER 13 MONITORING - Landcare Research...Recce, survey, aerial photos, photo points, permanent...
20
BEVERLEY CLARKSON CONTENTS INTRODUCTION 1 THE NATIONAL WETLAND MONITORING SYSTEM 1.1 The NWMS approach 1.2 The Wetland Condition Index 1.2.1 Using the WCI: Ecological change at the Cockayne Reserve 1.3 Setting realistic goals 1.4 Analysis and evaluation 2 REFERENCES AND FURTHER READING 2.1 Useful websites MONITORING CHAPTER 13
Transcript of CHAPTER 13 MONITORING - Landcare Research...Recce, survey, aerial photos, photo points, permanent...

BEVERLEY CLARKSON
CONTENTS
INTRODUCTION
1 THE NATIONAL WETLAND MONITORING SYSTEM1.1 The NWMS approach1.2 The Wetland Condition Index1.2.1 Using the WCI: Ecological change at the Cockayne Reserve1.3 Setting realistic goals1.4 Analysis and evaluation
2 REFERENCES AND FURTHER READING2.1 Useful websites
MONITORINGCHAPTER 13

CHAPTER 13 MONITORINGSECTION THREE: MEASURING THE RESULTS & WETLAND PROTECTION PROTECTING 243
MO
NIT
ORI
NG

WETLAND RESTORATION: A HANDBOOK FOR NZ FRESHWATER SYSTEMS
MONITORINGBEVERLEY CLARKSON
Previous page: Vegetation and hydrological monitoring at Lake Rotopouka, Northland. Photo: Danny Thornburrow, Landcare Research
Monitoring is more than just collecting data. It is about gaining an insight into how the wetland functions (reflected as ecological condition) and how these functions change over the course of the restoration. Developing a robust monitoring system is essential for measuring the direction of change over time and assessing the effectiveness of restoration efforts. Changes can be either positive, reflecting improvement, or negative, thus triggering the need for remedial action.
Data alone, for example, from bird monitoring or native plant establishment though valuable, only represent one aspect of how successful the restoration has been. To determine the overall success of the restoration a wide range of data is required, from small plot or sampling station scale, to broad whole-wetland or catchment scale. It involves regular field reconnaissance (recce) and survey, ground-truthing and collection of data. This
chapter brings together the methods outlined in previous chapters (Chapters 7–12) for monitoring key components of wetland ecological condition, namely hydrology, nutrients, weeds, native flora, pest species and native fauna. Key indicators linked to these components form the basis of the New Zealand National Wetland Monitoring System, which will enable you to answer the ultimate question: “How has the condition of the wetland changed due to restoration efforts?”
Although developing a monitoring programme and collecting data may seem complex to non-scientists, the two case studies in this chapter show how strong partnerships were used to provide the expertise for designing the restoration programme as well as measuring overall restoration success. The methods used in the case studies are also included in the monitoring sections of previous chapters.

CHAPTER 13 MONITORINGSECTION THREE: MEASURING THE RESULTS & WETLAND PROTECTION PROTECTING 245
Long-term vegetation monitoring will determine whether on-going willow and weed control have resulted in returning Waimarino swamp to a system dominated by native species. Lake Taupo. Digitally enhanced. Photo: Department of Conservation and Tongariro Natural History Society
Waimarino Before. Photo: Department of Conservation and Tongariro Natural History Society
Carrying out a recce by kayak at Waimarino, Lake Taupo.Photo: Department of Conservation and Tongariro Natural History Society
WETLAND RESTORATION: A HANDBOOK FOR NZ FRESHWATER SYSTEMS
1 The National Wetland Monitoring System
The National Wetland Monitoring System (NWMS) was developed specifically for New Zealand wetlands (Clarkson et al. 2003). It provides a useful framework for restoration projects to assess changes in the ecological condition or health of your wetland. The system includes assessment before restoration, setting realistic short-term and long-term goals, scoring restoration components, and evaluating overall restoration success.
The first stage of the NWMS is to undertake a detailed inventory of your wetland. This includes maps and descriptions of the main vegetation types and habitats, flora and fauna species lists, and other features of interest, e.g., presence and abundance of threatened species (see Chapter 2 – Restoration planning). Establishing permanent vegetation plots, and fauna and hydrological monitoring stations is recommended as these provide quantitative data to set baselines and to track changes over time. These data are very important in scoring the condition of the wetland as accurately as possible.
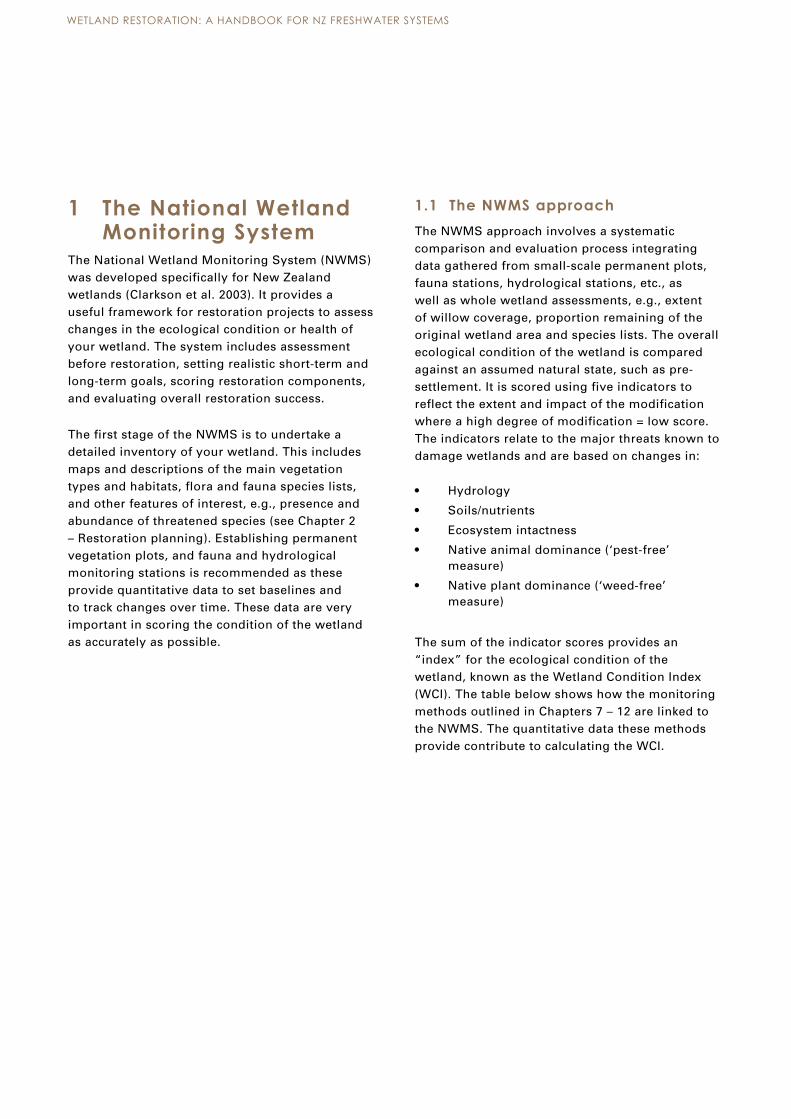
1.1 The NWMS approachThe NWMS approach involves a systematic comparison and evaluation process integrating data gathered from small-scale permanent plots, fauna stations, hydrological stations, etc., as well as whole wetland assessments, e.g., extent of willow coverage, proportion remaining of the original wetland area and species lists. The overall ecological condition of the wetland is compared against an assumed natural state, such as pre-settlement. It is scored using five indicators to reflect the extent and impact of the modification where a high degree of modification = low score. The indicators relate to the major threats known to damage wetlands and are based on changes in:
• Hydrology
• Soils/nutrients
• Ecosystem intactness
• Native animal dominance (‘pest-free’ measure)
• Native plant dominance (‘weed-free’ measure)
The sum of the indicator scores provides an “index” for the ecological condition of the wetland, known as the Wetland Condition Index (WCI). The table below shows how the monitoring methods outlined in Chapters 7 – 12 are linked to the NWMS. The quantitative data these methods provide contribute to calculating the WCI.

CHAPTER 13 MONITORINGSECTION THREE: MEASURING THE RESULTS & WETLAND PROTECTION PROTECTING 247
WHAT SKILLS ARE NEEDED?Depending on the type of monitoring carried out, the main skills needed generally include basic data analysis; good data management (making sure information is recorded and data not lost); and specialist identification (flora, fauna) skills. While data can be presented in hand-written reports with diagrams on graph paper, it is quicker and easier to use computer programmes such as Word and Excel to draw graphs and write up results. The monitoring report can be a concise one page summary for circulation among key restoration stakeholders.
– Adapted from the Fensham Wetland Monitoring Guidelines 2004
Some tools of the trade for carrying out bird counts: map, (waterproof) notebook, pencil and bird identification guide. Photo: Nelson Mail

WETLAND RESTORATION: A HANDBOOK FOR NZ FRESHWATER SYSTEMS
Indicator Indicator components
What to look for Monitoring method
Relevant Handbook chapters
Change in hydrological integrity
Impact of man-made structures
Number/size/depth/effectiveness/ coverage of man-made structures (drains, stopbanks, tide gates, etc.) within wetland and in catchment. Extent of wetland affected by structures. Includes permanent flooding changes.
Dipwells and piezometers
7 – Hydrology
Water table depth
Water table decline (need long-term data), loss/decline of species requiring high water table, e.g., aquatic and semiaquatic species such as bladderwort.
Dipwells and piezometers, permanent plots
7 – Hydrology
Dryland plant invasion
As above, but presence/increase of dryland species/vegetation.
Permanent plots, transects, recce, survey
9 – Weeds 10 – Revegetation
Change in physico-chemical parameters
Fire damage Recent fires evident from loss of late successional vegetation, (e.g., wirerushland replaced by sedgeland), sparse vegetation cover, charred trunks of woody species, visible ash deposits. Fires >2 years ago discernible from ash/charcoal layers in soil cores, absence/rarity of fire-sensitive species (e.g., Carex secta in swamps, Sporadanthus in bogs).
Recce, survey, aerial photos, photo points, permanent plots
4 – Site interpretation 1 8 – Nutrients
Degree of sedimentation/ erosion
Recent earthworks or freshly dug drains in the catchment. Abrupt change in soil colour. Plants partially buried by sediment. Suspended sediments.
Recce, survey, sampling stations, soil/water analyses, sediment cores
4 – Site interpretation 1 5 – Site interpretation 2
Nutrient levels Changes (mainly increases) in soil/water N, P & pH, foliage N:P ratio (from plot data), loss/decline of species adapted to oligotrophic conditions (especially slow-growing stress tolerant plants, e.g., Empodsima, Sporadanthus), change in phytoplankton composition, e.g., from diatoms to large filamentous Cyanobacteria.
Recce, survey, sampling stations, soil/water analyses
4 – Site interpretation 1 8 – Nutrients
von Post Index Squeeze technique – decomposition low if only water escapes through fingers, high if peat escapes. Loss of peat forming species, e.g., Empodisma, Sphagnum.
von Post Index, permanent plots
7 – Hydrology 9 – Weeds 10 – Revegetation
Table 1. Integrating Handbook monitoring methods with the National Wetland Monitoring System

CHAPTER 13 MONITORINGSECTION THREE: MEASURING THE RESULTS & WETLAND PROTECTION PROTECTING 249
Indicator Indicator components
What to look for Monitoring method Relevant Handbook chapters
Change in ecosystem intactness
Loss in area of original wetland
Usually monitored over time in databases by mapping exercises, often from aerial photography or historical information. Visual evidence at individual wetlands in the absence of any existing information can be observed in soil cores, presence of remnants of wetland vegetation in old wetland areas, topography or obvious reclamation.
Range of methods including comparison of extent with historical maps, historical records, topo maps (look for drains), aerial photos, catchment recce and survey
4 – Site interpretation 1
Connectivity barriers
Presence of tide gates, stop banks, weirs isolating system from riverine connections to other wetlands. Ring drains and box culverts around margin isolate wetland from catchment groundwater. Loss of riparian vegetation and buffer vegetation connecting wetlands to native forests, lakes and rivers.
Recce, survey, aerial photos, maps
4 – Site interpretation 1
Change in browsing, predation and harvesting regimes
Damage by domestic or feral animals
Browse damage to foliage, branchlets; soft, herbaceous, palatable plant species absent or greatly reduced in number and stature. Animal tracks visible in wetland. Damage to bark, e.g., biting and scratching. Disturbance to substrate, e.g., deer wallows, pig rooting, pugging of soil. Adequacy and extent of fencing.
Foliar Browse Index, plot data, recce, survey
4 – Site interpretation 1 11 – Pests
Introduced predator impacts on wildlife
Direct evidence from bird, fish, pest animal datasets. Indirect evidence from predator tracks, scat counts. Presence of sensitive species such as fernbird, bittern and banded rail would indicate low predator impacts.
5-minute bird counts, native fauna and pest trapping (aquatic and terrestrial), tracking tunnels, recce, survey, species lists
4 – Site interpretation 1 11 – Pests 12 – Native Fauna
Harvesting levels
Recent vegetation harvesting readily observed; longer term effects may be evident in absence of key species from communities where they typically occur.
Foliar Browse Index, recce, survey
4 – Site interpretation 1 11 – Pests
Change in dominance of native plants
Introduced plant canopy cover
Cover of introduced plants in permanent plots and, especially, increase of introduced plants over time. Changes in extent of exotic plant coverage. Changes in number of exotic species recorded.
Permanent plots (e.g., along invasion gradients), transects, aerial photos, high vantage points, recce, survey, ground truthing, species lists
4 – Site interpretation 1 9 – Weeds 10 – Revegetation
Introduced plant understorey cover
Canopy composition and historical information will give clues to understorey composition, e.g., long-established willow forest will likely have low native understorey.
Permanent plots, transects, recce, survey, species lists
4 – Site interpretation 1 9 – Weeds 10 – Revegetation

WETLAND RESTORATION: A HANDBOOK FOR NZ FRESHWATER SYSTEMS
The invasive yellow flag iris, one of the many weeds found in the Cockayne Reserve.Photo: Rohan Wells, NIWA Paul Champion (NIWA) assessing the condition of the highly
modified Cockayne Reserve, Christchurch.Photo: Kerry Bodmin, NIWA (with permission from DOC)
Yellow flag iris, detail of flower. Photo: John Clayton, NIWA

CHAPTER 13 MONITORINGSECTION THREE: MEASURING THE RESULTS & WETLAND PROTECTION PROTECTING 251
1.2 The Wetland Condition IndexThe Wetland Condition Index (WCI) can be used for goal setting and evaluation by assessing the wetland before restoration, and identifying where improvements can be made. The WCI can provide a useful framework for restoration projects when applying for funds as goals can be clearly defined and evaluated for each phase. Hence, incorporating a national system of project reporting and evaluation in a Wetland Restoration Plan should add value to any funding application. Future plans include a website where WCI data can be entered to enable, e.g., comparisons between different projects or across regions.
Each of the five indicators (hydrology, soils/ nutrients, ecosystem intactness, native animal dominance and native plant dominance) has several components, which are compared against an assumed natural state (e.g., pre-European) and scored out of 5 (5 =‘natural’ condition). Indicator component scores are averaged to produce a score out of 5 for the indicator, and summed to provide an overall WCI score out of a maximum of 25. Follow the guidelines provided in the Handbook for Monitoring Wetland Condition (Clarkson et al.,
1.2.1 Using the WCI: Ecological change at the Cockayne Reserve
In pre-European time the Cockayne Reserve and surrounding land comprised a mosaic of swamp and estuarine vegetation. The area was fed by the extensive freshwater dune swales upstream and the brackish Avon River and Avon-Heathcote Estuary downstream. The Reserve is now highly modified by surrounding residential development, and has a history of fire, eutrophication, and altered hydrology. It is artificially divided into a freshwater area (approximately two-thirds of total area) and an estuarine area by a stopbank.
2003) for assessing and assigning the scores. The system is flexible enough to add any monitoring component to the basic model (as Table 1 shows). Alternatively, the system can be adapted to suit your own restoration project – the case studies included in this chapter are good examples of this.
The tables below show how the indicators were used to show changes in the wetland condition at the 3 ha Cockayne Reserve, an isolated wetland fragment within Christchurch City.

WETLAND RESTORATION: A HANDBOOK FOR NZ FRESHWATER SYSTEMS
Indicator Indicator components Specify and Comment Score 0– 51
Mean score
Change in hydrological integrity
Impact of man-made structures
Extreme: Stopbanks, roads, housing have completely modified original hydrology. One small connection to estuary remains
1
0.67Water table depth No water supply 0
Dryland plant invasion Dry soils have allowed extensive invasion. 1
Change in physico-chemical parameters
Fire damage Entire area repeatedly burnt due to vandalism 0
0.5
Degree of sedimentation/erosion
Little wetland character now remains in soils 1
Nutrient levels No data available –
von Post index N/A –
Change in ecosystem intactness
Loss in area of original wetland
Extreme – almost all natural character lost 0
0.5Connectivity barriers Extreme – no connections upstream, many
barriers downstream1
Change in browsing, predation and harvesting regimes
Damage by domestic or feral animals
No stock access. Potential access by small feral animals but no evidence of impacts
5
3.67Introduced predator impacts on wildlife
Little habitat remains for wildlife, and drying of wetland allows full access to predators
1
Harvesting levels None 5
Change in dominance of native plants
Introduced plant canopy cover
Tall fescue and yellow flag iris have almost replaced all native species
1
1Introduced plant understorey cover
Tall fescue and yellow flag iris have almost replaced all native species
1
Total wetland condition index /25 6.34
Table 2. Using the WCI to determine pre-restoration wetland condition: Cockayne Reserve 1982
Compare the condition of the Reserve in 1982, (after being degraded by repeated recent fires and the spread of weeds such as tall fescue and yellow flag iris) with the condition of the Reserve in 2000 once restoration had begun.
1 Assign degree of modification as follows: 0=extreme, 1=v high, 2=high, 3=medium, 4=low, 5=v low/none

CHAPTER 13 MONITORINGSECTION THREE: MEASURING THE RESULTS & WETLAND PROTECTION PROTECTING 253
Table 3. Using the WCI to determine current wetland condition: Cockayne Reserve 2000
Indicator Indicator components Specify and Comment Score 0– 51
Mean score
Change in hydrological integrity
Impact of man-made structures
Very high: Stopbanks, roads, housing have completely modified original hydrology. Artificial bore supplies freshwater area, one artificial channel links estuarine area to river
1
2Water table depth Highly modified: dry in some areas and stagnant in
others2
Dryland plant invasion Dryland plants now a minor component 3
Change in physico-chemical parameters
Fire damage Entire area burned in the past but fire-sensitive species recovering over most of area
3
2
Degree of sedimentation/erosion
Very high: excessive Typha growth has been allowed to accumulate a deep layer of anaerobic sediment
1
Nutrient levels Both N and P highly elevated in soils and vegetation
2
von Post index Not applicable –
Change in ecosystem intactness
Loss in area of original wetland
Extreme – all natural original vegetation destroyed in the past and current system is artefact of management interventions
0
0.5
Connectivity barriers Very high – freshwater section isolated entirely from other waterways, estuarine connection limited
1
Change in browsing, predation and harvesting regimes
Damage by domestic or feral animals
No stock access. Potential access by small feral animals but no evidence of impacts
5
4Introduced predator impacts on wildlife
Evidence of predator trails (stoats) in and around wetland, but some native birdlife remains
2
Harvesting levels None 5
Change in dominance of native plants
Introduced plant canopy cover
Low in estuarine area but tall fescue is co-dominant in freshwater area
4
3Introduced plant understorey cover
High in both areas, particularly freshwater where many adventive species are present. Purple loosestrife and yellow flag iris both common
2
Total wetland condition index /25 11.5
By 2000, considerable recovery had occurred due to management interventions. Planting of native species and restoration of a water supply had restored some natural character, although weeds were still widespread. However, poor water exchange had allowed the raupo biomass to increase dramatically, leading to excessive sedimentation and in-filling. The score therefore reflects an overall improvement but identifies those issues still causing problems.
1 Assign degree of modification as follows: 0=extreme, 1=v high, 2=high, 3=medium, 4=low, 5=v low/none

WETLAND RESTORATION: A HANDBOOK FOR NZ FRESHWATER SYSTEMSCASE STUDY
Fensham Wetland (west of Carterton) contains one of the best lowland forest remnants on the Wairarapa Plains, as well as a small wetland that supports the nationally endangered brown mudfish (Neochanna apoda). The 3 ha wetland is being restored, the goal being to “Restore the wetland to sustainable natural state” (Fensham Wetland Restoration Plan 2001). The Fensham Group has received technical support and assistance from Greater Wellington under the ‘Take Care – Environmental Programme’.
The comprehensive Fensham Wetland Monitoring Guidelines (2004) details methods on how to monitor wetland hydrology, water quality, the mudfish population, natural plant regeneration and survival. Additional information includes updating the plant species list, carrying out surveillance for pest species, and using photo points. Monitoring forms to record data are also included. Several examples from the Guidelines are highlighted below.
Mudfish population trends
Monitoring will show long-term trends in population numbers.
METHOD: Unbaited traps are set overnight at 6 sites (marked by posts). The following morning, the number of fish in the traps are counted and measured. Frequency: Check traps monthly July–Dec.
DATA MANAGEMENT: Present data in Annual Report and forward data to DOC Wairarapa Office. Contact DOC mudfish experts if mudfish numbers decline.
Plant survival
Monitoring how many plants survive in areas with weed problems (e.g., sweet grass) will help determine which species work best and where, and will save on planting effort and numbers of plants used.
METHOD: Record number of plants planted, species, size (e.g., PB 2) and location. Record general comments (e.g., plant health and environmental conditions when planted including water depth, etc., who planted them). Record weed control method and frequency. Frequency: All plantings should be monitored when they are put in the ground; and in January for at least 3 years.
DATA MANAGEMENT: Summarise numbers of plants, species and size, where planted and how many survived annually. Make revised recommendations on species to use etc. for next year’s planting programme if necessary.
Water quality
Fertility has a major influence on wetland plant communities. High nutrient conditions favour highly competitive, fast growing, wetland plants – often exotics. Nutrients enter the wetland from the catchment. Monitoring will pick up any changes to management of the catchment that signals changes in nutrient levels. Nitrate nitrogen and Dissolved Reactive Phosphorus are the key indicators measured.
METHOD: There are two water quality monitoring points. Either arrange with the water quality scientist based in Greater Wellington’s Masterton Office to process the samples or contact a commercial laboratory at c.$40 per site. Frequency: Take samples twice per year (first week of Dec and last week of June).
DATA MANAGEMENT: Compare data with previous years, and between monitoring points.
REF: www.gw.govt.nz/assets/council-publications/Fensham_monitoring_guidelines.pdf
WORKING IN PARTNERSHIP: MONITORING FENSHAM WETLAND
Brown mudfish. Photo: Stephen Moore, Landcare Research

CHAPTER 13 MONITORINGSECTION THREE: MEASURING THE RESULTS & WETLAND PROTECTION PROTECTING 255
Young sedges are protected in order to become established amongst the rank grasses. Photo: Beverley Clarkson, Landcare Research
Sedges once established and with the plastic sleeves removed, easily overtop pasture grasses. Photo: Beverley Clarkson, Landcare Research
WETLAND RESTORATION: A HANDBOOK FOR NZ FRESHWATER SYSTEMS
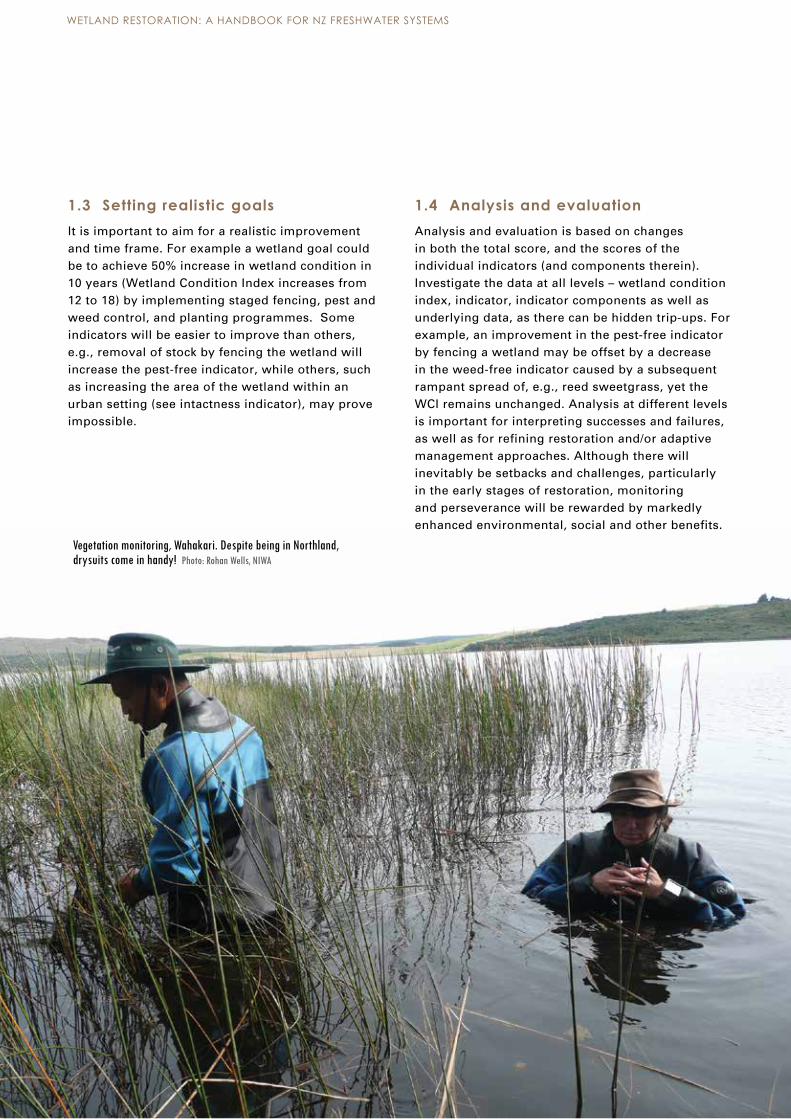
1.3 Setting realistic goalsIt is important to aim for a realistic improvement and time frame. For example a wetland goal could be to achieve 50% increase in wetland condition in 10 years (Wetland Condition Index increases from 12 to 18) by implementing staged fencing, pest and weed control, and planting programmes. Some indicators will be easier to improve than others, e.g., removal of stock by fencing the wetland will increase the pest-free indicator, while others, such as increasing the area of the wetland within an urban setting (see intactness indicator), may prove impossible.
Vegetation monitoring, Wahakari. Despite being in Northland, drysuits come in handy! Photo: Rohan Wells, NIWA
1.4 Analysis and evaluationAnalysis and evaluation is based on changes in both the total score, and the scores of the individual indicators (and components therein). Investigate the data at all levels – wetland condition index, indicator, indicator components as well as underlying data, as there can be hidden trip-ups. For example, an improvement in the pest-free indicator by fencing a wetland may be offset by a decrease in the weed-free indicator caused by a subsequent rampant spread of, e.g., reed sweetgrass, yet the WCI remains unchanged. Analysis at different levels is important for interpreting successes and failures, as well as for refining restoration and/or adaptive management approaches. Although there will inevitably be setbacks and challenges, particularly in the early stages of restoration, monitoring and perseverance will be rewarded by markedly enhanced environmental, social and other benefits.

CHAPTER 13 MONITORINGSECTION THREE: MEASURING THE RESULTS & WETLAND PROTECTION PROTECTING 257
Drilling willow in Waimarino, Lake Taupo. Photo: Tongariro Natural History Society
Reed sweetgrass is an aggressive invader that displaces native plants. Mapara Reserve, Te Kuiti. Photo: Monica Peters, NZ Landcare Trust
Table 4: Wetland condition index: pre-restoration condition, and 5 & 10 year restoration goals
Indicator 2006 (pre-restoration) 2011 (year 5) 2016 (year 10)
Changes in: Hydrology 3.5 3.5 3.5
Soils/nutrients 2.8 2.9 3.0
Intactness 2.5 2.5 2.5
Native animal dominance 2.2 4.1 4.5
Native plant dominance 1 2 4.5
Total wetland condition index /25 12.0 15.0 18.0
In the above example, the goal is a 50% improvement in wetland condition from pre-restoration (2006) to 10 years after the project was started. In this case, site hydrology and overall intactness will be unchanged, demonstrating that these factors were beyond the scope of the 10-year restoration. However, progress in other areas will be achieved by increases in both native plant and animal dominance over introduced species and an overall improvement in soils and nutrient levels.

WETLAND RESTORATION: A HANDBOOK FOR NZ FRESHWATER SYSTEMS
The 60 ha Waiwhakareke Natural Heritage Park (www.waiwhakareke.co.nz) lies on the outskirts of Hamilton. The Park comprises a peat lake with remnant wetland vegetation within a largely pastoral catchment. The overall restoration goal is to reconstruct native lowland and wetland ecosystems once widespread in the Waikato Region. The project is led by the Hamilton City Council in partnership with The University of Waikato, Wintec, Nga Mana Toopu o Kirikiriroa Limited Resource Management and Cultural Consultants and Tui 2000. Replanting with natives began in September 2004. Monitoring is undertaken by the staff of the Centre for Biodiversity and Ecology Research at the University of Waikato.
Monitoring
Baseline monitoring plots were established during the early stages of restoration plantings to assess:
• Canopy cover/closure in plantings
• Plant health and survivorship rates
• Animal browsing impacts on plants
• Reproductive output of plants
• Groundcover composition
Methods
In Nov 2005 – Jan 2006, five monitoring plots ranging from 90 to 290 m2 were established in each of four plantings of varied ages. Plot size varied according to planting size. Plots were permanently marked with wooden stakes spray-painted orange. White metal labels indicate the plot number and corner. Photopoints were also established for each plot.
Measures for all plantings within plots: height, width (longest and shortest axis perpendicular to ground surface), health (dead/poor/good), browse
(presence/absence), weeds at base (live/dead) and flowers and fruits (presence/absence). Canopy % cover was calculated for each plot using measures of width to calculate the surface area covered by each plant.
Ground cover was assessed in each plot using a point-height intercept method. At 25 cm intervals along transects the ground cover species was identified and height recorded, an assessment was also made of whether the ground had been recently sprayed (dead/dying plants) at each intercept. Data were gathered for at least 125 points within each plot.
Recommendations
• Carry out plot monitoring including photopoints, annually (in the same season) for the first five years, then at 5-yearly intervals
• Establish further monitoring plots in new plantings to gain adequate coverage of site variability and variation in planting or maintenance techniques
• Fully exclude stock from planted areas
• Reduce rabbit and hare damage to small leaved shrubs (e.g., Coprosma tenuicaulis) by using older plants, plant protection sleeves or by pest animal control
• Mulching around plantings instead of spraying to control weeds may be more effective for herbicide-sensitive species such as Carex sedges
• Consider staking young woody trees in exposed situations
REF: www.waiwhakareke.co.nz/file/citygreen_hamilton-ecosystems-2-.pdf
WAIWHAKAREKE: MONITORING REVEGETATION SUCCESS
CASE STUDY
CHAPTER 13 MONITORINGSECTION THREE: MEASURING THE RESULTS & WETLAND PROTECTION PROTECTING 259
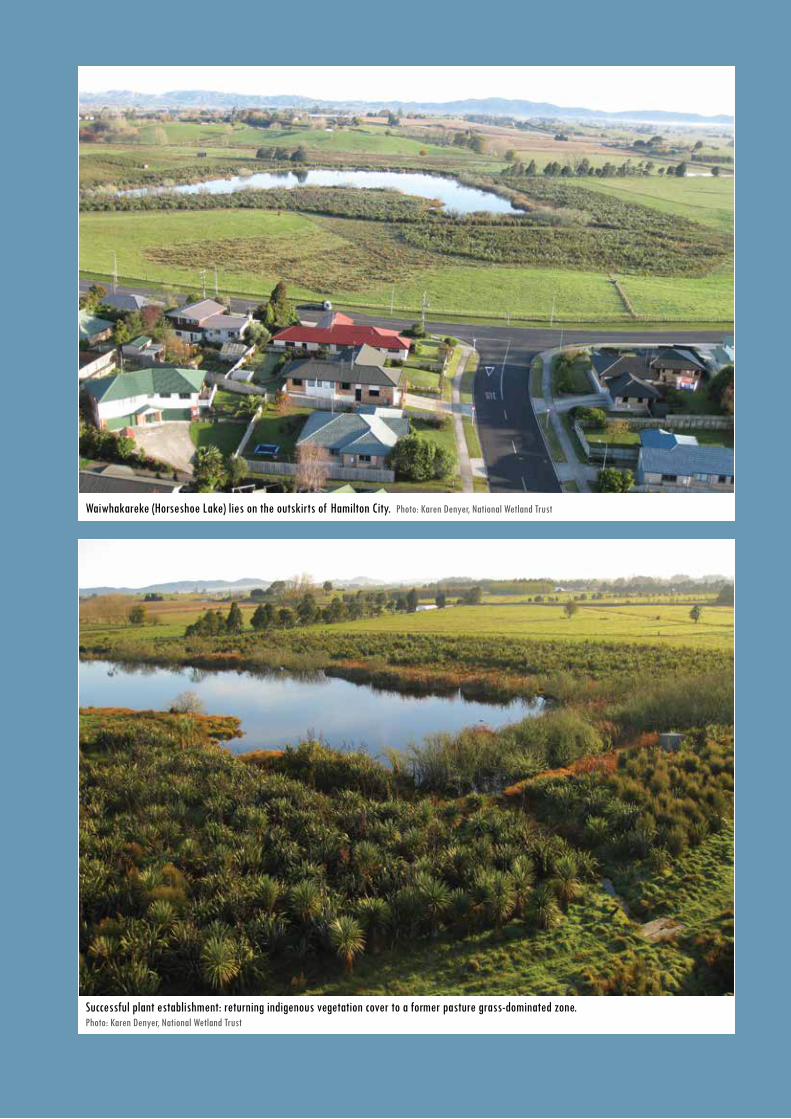
Successful plant establishment: returning indigenous vegetation cover to a former pasture grass-dominated zone. Photo: Karen Denyer, National Wetland Trust
Waiwhakareke (Horseshoe Lake) lies on the outskirts of Hamilton City. Photo: Karen Denyer, National Wetland Trust

WETLAND RESTORATION: A HANDBOOK FOR NZ FRESHWATER SYSTEMS
2 References and further reading
Clarkson, B.R., Sorrell, B.K., Reeves, P.N., Champion, P.D., Partridge, T.R, and Clarkson, B.D. 2003 (rev. 2004) Handbook for Monitoring Wetland Condition. www.landcareresearch.co.nz/publications/researchpubs/handbook_wetland_condition.pdf

CHAPTER 13 MONITORINGSECTION THREE: MEASURING THE RESULTS & WETLAND PROTECTION PROTECTING 261
2.1 Useful websites
Monitoring native and introduced fauna
5 minute bird count methods, field sheets and digital data entry sheet
www.doc.govt.nz/conservation/native-animals/birds/five-minute-bird-counts/
www.wildaboutnz.co.nz/index.php?option=com_content&view=article&id=54:5minbird&catid=52:landmethods&Itemid=74
Footprint Identification Guide for tracking tunnels
www.rimutakatrust.org.nz/downloads/download.htm
www.gotchatraps.co.nz/html/photo_gallery.html
Protocols for using wax tags
www.pestcontrolresearch.co.nz/docs-monitoring/waxtagprotocol.pdf
Bird counts, setting up photopoints, pest animal transects
www.formak.co.nz
Foliar browse index
nvs.landcareresearch.co.nz/html/FOLIAR_BROWSE_INDEX.pdf
Freshwater Fish
www.wildaboutnz.co.nz/index.php?option=com_content&view=article&id=53:fish-surveying&catid=51:watermethods&Itemid=75
Lizards and frogs
www.wildaboutnz.co.nz/index.php?option=com_content&view=article&id=90:tracking&catid=52:landmethods&Itemid=74
www.gotchatraps.co.nz/html/photo_gallery.html
Invertebrates (terrestrial and aquatic)
www.wildaboutnz.co.nz/index.php?option=com_content&view=article&id=55:inverts&catid=52:landmethods&Itemid=74
Note that many of the resources above are available as hard copy from the respective organisations. There is also a CD containing all above hyperlinks at the back of this Handbook. If you are using the online version of the Handbook and having problems with the hyperlinks above, try copying and pasting the web address into your browser search bar.


![Recce [recovered]](https://static.fdocuments.in/doc/165x107/55ce895abb61ebaa188b45b0/recce-recovered.jpg)


