CHAPTER 13 FILINGS IN MAINE CALENDAR YEARS 1999 – 2009
52
303 313 314 381 411 428 404 263 464 533 562 0 100 200 300 400 500 600 1999 2000 2001 2002 2003 2004 2005 2006 2007 2008 2009 CHAPTER 13 FILINGS IN MAINE CALENDAR YEARS 1999 – 2009 CALENDAR YEAR CHAPTER 13 FILINGS This chart shows chapter 13 filings in Maine for calendar years 1999 – 2009. Chapter 13 filings averaged 398 per year during this period.
-
Upload
donnelly-davis -
Category
Documents
-
view
19 -
download
3
description
CHAPTER 13 FILINGS IN MAINE CALENDAR YEARS 1999 – 2009. This chart shows chapter 13 filings in Maine for calendar years 1999 – 2009. Chapter 13 filings averaged 398 per year during this period. CHAPTER 13 FILINGS. CALENDAR YEAR. CHAPTER 13 FILINGS IN MASSACHUSETTS - PowerPoint PPT Presentation
Transcript of CHAPTER 13 FILINGS IN MAINE CALENDAR YEARS 1999 – 2009

303 313 314
381
411428
404
263
464
533
562
0
100
200
300
400
500
600
1999 2000 2001 2002 2003 2004 2005 2006 2007 2008 2009
CHAPTER 13 FILINGS IN MAINE CALENDAR YEARS 1999 – 2009
CALENDAR YEAR
CH
AP
TE
R 1
3 F
ILIN
GS
This chart shows chapter 13 filings in Maine for calendar years 1999 – 2009. Chapter 13 filings averaged 398 per year during this period.

2,431
2,1932,330
2,553 2,471 2,434
2,826 2,789
4,496
3,839 3,753
0
1,000
2,000
3,000
4,000
5,000
1999 2000 2001 2002 2003 2004 2005 2006 2007 2008 2009
CHAPTER 13 FILINGS IN MASSACHUSETTS CALENDAR YEARS 1999 – 2009
CALENDAR YEAR
CH
AP
TE
R 1
3 F
ILIN
GS
This chart shows chapter 13 filings in Massachusetts for calendar years 1999 – 2009. Chapter 13 filings averaged 2,920 per year during this period.

287 303 317
381
466439
531 521
860 863
910
0
200
400
600
800
1,000
1999 2000 2001 2002 2003 2004 2005 2006 2007 2008 2009
CHAPTER 13 FILINGS IN NEW HAMPSHIRE CALENDAR YEARS 1999 – 2009
CALENDAR YEAR
CH
AP
TE
R 1
3 F
ILIN
GS
This chart shows chapter 13 filings in New Hampshire for calendar years 1999 – 2009. Chapter 13 filings averaged 534 per year during this period.

315 301
389 397
344
263
302329
624
715 714
0
200
400
600
800
1999 2000 2001 2002 2003 2004 2005 2006 2007 2008 2009
CHAPTER 13 FILINGS IN RHODE ISLAND CALENDAR YEARS 1999 – 2009
CALENDAR YEAR
CH
AP
TE
R 1
3 F
ILIN
GS
This chart shows chapter 13 filings in Rhode Island for calendar years 1999 – 2009. Chapter 13 filings averaged 427 per year during this period.

12,543
10,5339,941
9,5639,897
8,883 8,979
4,073
5,911
6,609
7,991
0
3,000
6,000
9,000
12,000
15,000
1999 2000 2001 2002 2003 2004 2005 2006 2007 2008 2009
CHAPTER 13 FILINGS IN PUERTO RICO CALENDAR YEARS 1999 – 2009
CALENDAR YEAR
CH
AP
TE
R 1
3 F
ILIN
GS
This chart shows chapter 13 filings in Puerto Rico for calendar years 1999 – 2009. Chapter 13 filings averaged 8,629 per year during this period.

1,467 1,4341,530
1,879
2,088
1,957
1,673
1,263
1,626 1,668
1,179
0
500
1,000
1,500
2,000
2,500
1999 2000 2001 2002 2003 2004 2005 2006 2007 2008 2009
CHAPTER 13 FILINGS IN CONNECTICUT CALENDAR YEARS 1999 – 2009
CALENDAR YEAR
CH
AP
TE
R 1
3 F
ILIN
GS
This chart shows chapter 13 filings in Connecticut for calendar years 1999 – 2009. Chapter 13 filings averaged 1,615 per year during this period.

12,04711,387
12,660
14,34414,837 14,736
13,840
8,660
11,61411,165
10,823
0
4,000
8,000
12,000
16,000
1999 2000 2001 2002 2003 2004 2005 2006 2007 2008 2009
CHAPTER 13 FILINGS IN NEW YORK CALENDAR YEARS 1999 – 2009
CALENDAR YEAR
CH
AP
TE
R 1
3 F
ILIN
GS
This chart shows chapter 13 filings in New York for calendar years 1999 – 2009. Chapter 13 filings averaged 12,374 per year during this period.

139147
177
212
255242
304
174
244
318
358
0
100
200
300
400
1999 2000 2001 2002 2003 2004 2005 2006 2007 2008 2009
CHAPTER 13 FILINGS IN VERMONT CALENDAR YEARS 1999 – 2009
CALENDAR YEAR
CH
AP
TE
R 1
3 F
ILIN
GS
This chart shows chapter 13 filings in Vermont for calendar years 1999 – 2009. Chapter 13 filings averaged 234 per year during this period.

752
842
1,012
1,201
1,4451,376
1,211
619
763
839 824
0
400
800
1,200
1,600
1999 2000 2001 2002 2003 2004 2005 2006 2007 2008 2009
CHAPTER 13 FILINGS IN DELAWARE CALENDAR YEARS 1999 – 2009
CALENDAR YEAR
CH
AP
TE
R 1
3 F
ILIN
GS
This chart shows chapter 13 filings in Delaware for calendar years 1999 – 2009. Chapter 13 filings averaged 989 per year during this period.

13,328 13,377
14,33314,726 14,764
13,370
11,903
5,704
7,160
8,170 8,329
0
4,000
8,000
12,000
16,000
1999 2000 2001 2002 2003 2004 2005 2006 2007 2008 2009
CHAPTER 13 FILINGS IN NEW JERSEY CALENDAR YEARS 1999 – 2009
CALENDAR YEAR
CH
AP
TE
R 1
3 F
ILIN
GS
This chart shows chapter 13 filings in New Jersey for calendar years 1999 – 2009. Chapter 13 filings averaged 11,379 per year during this period.

12,215
13,293
14,597
16,781
18,319 18,03117,223
10,149
11,39210,691
9,793
0
5,000
10,000
15,000
20,000
1999 2000 2001 2002 2003 2004 2005 2006 2007 2008 2009
CHAPTER 13 FILINGS IN PENNSYLVANIA CALENDAR YEARS 1999 – 2009
CALENDAR YEAR
CH
AP
TE
R 1
3 F
ILIN
GS
This chart shows chapter 13 filings in Pennsylvania for calendar years 1999 – 2009. Chapter 13 filings averaged 13,862 per year during this period.

9,709 9,597
10,858
11,71111,182
8,971
7,319
4,591
6,4635,944
6,390
0
3,000
6,000
9,000
12,000
1999 2000 2001 2002 2003 2004 2005 2006 2007 2008 2009
CHAPTER 13 FILINGS IN MARYLAND CALENDAR YEARS 1999 – 2009
CALENDAR YEAR
CH
AP
TE
R 1
3 F
ILIN
GS
This chart shows chapter 13 filings in Maryland for calendar years 1999 – 2009. Chapter 13 filings averaged 8,430 per year during this period.

14,97215,698
17,97818,764
19,589
17,796
16,138
9,355
10,79911,610
12,610
0
5,000
10,000
15,000
20,000
25,000
1999 2000 2001 2002 2003 2004 2005 2006 2007 2008 2009
CHAPTER 13 FILINGS IN NORTH CAROLINA CALENDAR YEARS 1999 – 2009
CALENDAR YEAR
CH
AP
TE
R 1
3 F
ILIN
GS
This chart shows chapter 13 filings in North Carolina for calendar years 1999 – 2009. Chapter 13 filings averaged 15,028 per year during this period.

5,700
6,219
7,559
8,8399,088
8,856
7,935
4,4204,821
5,1724,853
0
2,000
4,000
6,000
8,000
10,000
1999 2000 2001 2002 2003 2004 2005 2006 2007 2008 2009
CHAPTER 13 FILINGS IN SOUTH CAROLINA CALENDAR YEARS 1999 – 2009
CALENDAR YEAR
CH
AP
TE
R 1
3 F
ILIN
GS
This chart shows chapter 13 filings in South Carolina for calendar years 1999 – 2009. Chapter 13 filings averaged 6,678 per year during this period.

9,6859,128
10,002
10,775
11,61711,298
10,626
5,850
7,788
9,973
11,279
0
3,000
6,000
9,000
12,000
15,000
1999 2000 2001 2002 2003 2004 2005 2006 2007 2008 2009
CHAPTER 13 FILINGS IN VIRGINIA CALENDAR YEARS 1999 – 2009
CALENDAR YEAR
CH
AP
TE
R 1
3 F
ILIN
GS
This chart shows chapter 13 filings in Virginia for calendar years 1999 – 2009. Chapter 13 filings averaged 9,820 per year during this period.

453 448
531555
597561
639
377
500517
600
0
200
400
600
800
1999 2000 2001 2002 2003 2004 2005 2006 2007 2008 2009
CHAPTER 13 FILINGS IN WEST VIRGINIA CALENDAR YEARS 1999 – 2009
CALENDAR YEAR
CH
AP
TE
R 1
3 F
ILIN
GS
This chart shows chapter 13 filings in West Virginia for calendar years 1999 – 2009. Chapter 13 filings averaged 525 per year during this period.

9,9799,669
10,264 10,411
11,365 11,457 11,203
6,799
9,3309,859
11,823
0
3,000
6,000
9,000
12,000
15,000
1999 2000 2001 2002 2003 2004 2005 2006 2007 2008 2009
CHAPTER 13 FILINGS IN LOUISIANA CALENDAR YEARS 1999 – 2009
CALENDAR YEAR
CH
AP
TE
R 1
3 F
ILIN
GS
This chart shows chapter 13 filings in Louisiana for calendar years 1999 – 2009. Chapter 13 filings averaged 10,196 per year during this period.

7,1387,418
7,718 7,572
6,9997,211
6,130
4,582
6,269 6,2826,602
0
2,000
4,000
6,000
8,000
10,000
1999 2000 2001 2002 2003 2004 2005 2006 2007 2008 2009
CHAPTER 13 FILINGS IN MISSISSIPPI CALENDAR YEARS 1999 – 2009
CALENDAR YEAR
CH
AP
TE
R 1
3 F
ILIN
GS
This chart shows chapter 13 filings in Mississippi for calendar years 1999 – 2009. Chapter 13 filings averaged 6,720 per year during this period.

28,850 29,068
34,54336,546
42,74343,985
37,358
20,660
23,42222,121
26,037
0
10,000
20,000
30,000
40,000
50,000
1999 2000 2001 2002 2003 2004 2005 2006 2007 2008 2009
CHAPTER 13 FILINGS IN TEXAS CALENDAR YEARS 1999 – 2009
CALENDAR YEAR
CH
AP
TE
R 1
3 F
ILIN
GS
This chart shows chapter 13 filings in Texas for calendar years 1999 – 2009. Chapter 13 filings averaged 31,394 per year during this period.

3,479 3,517
4,095
4,582
5,2835,565
5,853
3,925
5,021
5,456
5,996
0
1,500
3,000
4,500
6,000
7,500
1999 2000 2001 2002 2003 2004 2005 2006 2007 2008 2009
CHAPTER 13 FILINGS IN KENTUCKY CALENDAR YEARS 1999 – 2009
CALENDAR YEAR
CH
AP
TE
R 1
3 F
ILIN
GS
This chart shows chapter 13 filings in Kentucky for calendar years 1999 – 2009. Chapter 13 filings averaged 4,797 per year during this period.

10,124 10,029
12,701
16,297
18,46218,084
15,457
11,885
13,016
11,56110,725
0
5,000
10,000
15,000
20,000
1999 2000 2001 2002 2003 2004 2005 2006 2007 2008 2009
CHAPTER 13 FILINGS IN MICHIGAN CALENDAR YEARS 1999 – 2009
CALENDAR YEAR
CH
AP
TE
R 1
3 F
ILIN
GS
This chart shows chapter 13 filings in Michigan for calendar years 1999 – 2009. Chapter 13 filings averaged 13,486 per year during this period.

11,234 11,510
13,361
16,069
18,47219,151
20,988
12,689
16,86516,101 15,853
0
5,000
10,000
15,000
20,000
25,000
1999 2000 2001 2002 2003 2004 2005 2006 2007 2008 2009
CHAPTER 13 FILINGS IN OHIO CALENDAR YEARS 1999 – 2009
CALENDAR YEAR
CH
AP
TE
R 1
3 F
ILIN
GS
This chart shows chapter 13 filings in Ohio for calendar years 1999 – 2009. Chapter 13 filings averaged 15,663 per year during this period.

25,82127,391
31,78432,798 33,106
31,288
27,929
20,681
24,513
26,410 26,737
0
10,000
20,000
30,000
40,000
1999 2000 2001 2002 2003 2004 2005 2006 2007 2008 2009
CHAPTER 13 FILINGS IN TENNESSEE CALENDAR YEARS 1999 – 2009
CALENDAR YEAR
CH
AP
TE
R 1
3 F
ILIN
GS
This chart shows chapter 13 filings in Tennessee for calendar years 1999 – 2009. Chapter 13 filings averaged 28,042 per year during this period.

17,656 17,818
19,693
21,176 21,017
19,665
18,010
11,332
14,764
16,91917,762
0
5,000
10,000
15,000
20,000
25,000
1999 2000 2001 2002 2003 2004 2005 2006 2007 2008 2009
CHAPTER 13 FILINGS IN ILLINOIS CALENDAR YEARS 1999 – 2009
CALENDAR YEAR
CH
AP
TE
R 1
3 F
ILIN
GS
This chart shows chapter 13 filings in Illinois for calendar years 1999 – 2009. Chapter 13 filings averaged 17,801 per year during this period.

6,799
7,548
9,189
10,30710,914
11,590
12,781
7,747
9,581
11,328
12,526
0
3,000
6,000
9,000
12,000
15,000
1999 2000 2001 2002 2003 2004 2005 2006 2007 2008 2009
CHAPTER 13 FILINGS IN INDIANA CALENDAR YEARS 1999 – 2009
CALENDAR YEAR
CH
AP
TE
R 1
3 F
ILIN
GS
This chart shows chapter 13 filings in Indiana for calendar years 1999 – 2009. Chapter 13 filings averaged 10,028 per year during this period.

2,5232,796
3,515
4,139
4,557 4,5704,433
2,919
3,890
4,648
5,117
0
1,500
3,000
4,500
6,000
1999 2000 2001 2002 2003 2004 2005 2006 2007 2008 2009
CHAPTER 13 FILINGS IN WISCONSIN CALENDAR YEARS 1999 – 2009
CALENDAR YEAR
CH
AP
TE
R 1
3 F
ILIN
GS
This chart shows chapter 13 filings in Wisconsin for calendar years 1999 – 2009. Chapter 13 filings averaged 3,919 per year during this period.

6,408
7,331
8,801
9,806 9,77110,043
10,289
5,092
5,840
6,632
7,336
0
3,000
6,000
9,000
12,000
1999 2000 2001 2002 2003 2004 2005 2006 2007 2008 2009
CHAPTER 13 FILINGS IN ARKANSAS CALENDAR YEARS 1999 – 2009
CALENDAR YEAR
CH
AP
TE
R 1
3 F
ILIN
GS
This chart shows chapter 13 filings in Arkansas for calendar years 1999 – 2009. Chapter 13 filings averaged 7,941 per year during this period.

511
583 582 587
647628
914
561
744 726
789
0
200
400
600
800
1,000
1999 2000 2001 2002 2003 2004 2005 2006 2007 2008 2009
CHAPTER 13 FILINGS IN IOWA CALENDAR YEARS 1999 – 2009
CALENDAR YEAR
CH
AP
TE
R 1
3 F
ILIN
GS
This chart shows chapter 13 filings in Iowa for calendar years 1999 – 2009. Chapter 13 filings averaged 661 per year during this period.

3,326
3,0673,177 3,202
3,392
3,770
3,497
1,949
2,3992,570
2,848
0
1,000
2,000
3,000
4,000
5,000
1999 2000 2001 2002 2003 2004 2005 2006 2007 2008 2009
CHAPTER 13 FILINGS IN MINNESOTA CALENDAR YEARS 1999 – 2009
CALENDAR YEAR
CH
AP
TE
R 1
3 F
ILIN
GS
This chart shows chapter 13 filings in Minnesota for calendar years 1999 – 2009. Chapter 13 filings averaged 3,018 per year during this period.

7,629 7,559
8,266
9,051
10,183
9,4118,973
5,680
7,066
7,626 7,813
0
3,000
6,000
9,000
12,000
1999 2000 2001 2002 2003 2004 2005 2006 2007 2008 2009
CHAPTER 13 FILINGS IN MISSOURI CALENDAR YEARS 1999 – 2009
CALENDAR YEAR
CH
AP
TE
R 1
3 F
ILIN
GS
This chart shows chapter 13 filings in Missouri for calendar years 1999 – 2009. Chapter 13 filings averaged 8,114 per year during this period.

787858
1,114
1,653
1,901 1,898
2,070
1,307
1,561
1,952 1,996
0
500
1,000
1,500
2,000
2,500
1999 2000 2001 2002 2003 2004 2005 2006 2007 2008 2009
CHAPTER 13 FILINGS IN NEBRASKA CALENDAR YEARS 1999 – 2009
CALENDAR YEAR
CH
AP
TE
R 1
3 F
ILIN
GS
This chart shows chapter 13 filings in Nebraska for calendar years 1999 – 2009. Chapter 13 filings averaged 1,554 per year during this period.
90
6657
82
98
124
171
95
142 144
167
0
50
100
150
200
1999 2000 2001 2002 2003 2004 2005 2006 2007 2008 2009
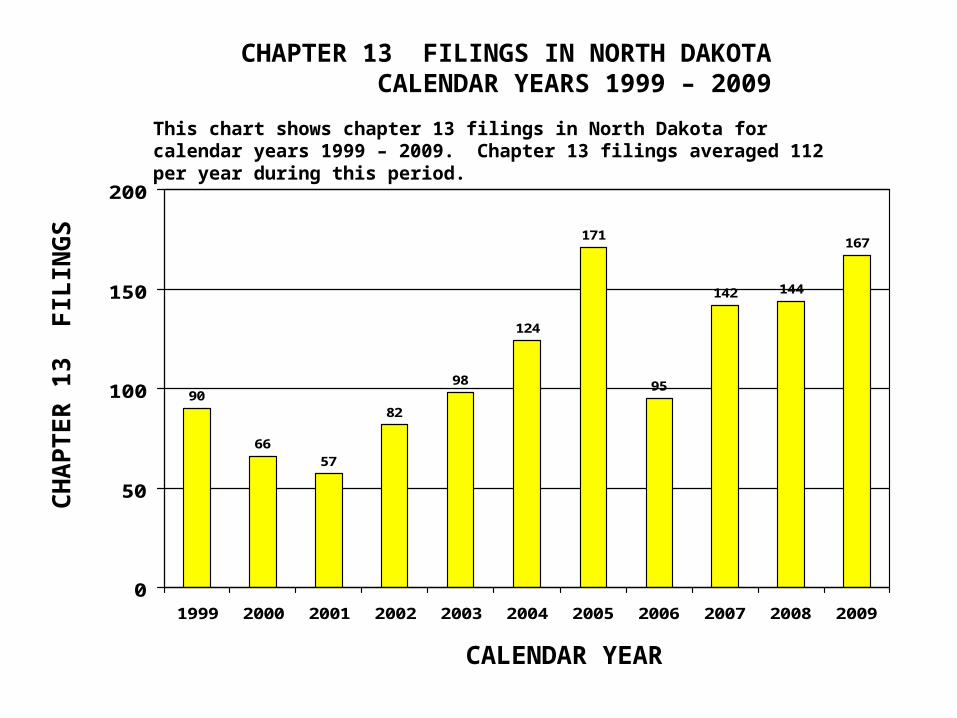
CHAPTER 13 FILINGS IN NORTH DAKOTA CALENDAR YEARS 1999 – 2009
CALENDAR YEAR
CH
AP
TE
R 1
3 F
ILIN
GS
This chart shows chapter 13 filings in North Dakota for calendar years 1999 – 2009. Chapter 13 filings averaged 112 per year during this period.

78 84
104
137
174
219
316
151
204 198 192
0
100
200
300
400
1999 2000 2001 2002 2003 2004 2005 2006 2007 2008 2009
CHAPTER 13 FILINGS IN SOUTH DAKOTA CALENDAR YEARS 1999 – 2009
CALENDAR YEAR
CH
AP
TE
R 1
3 F
ILIN
GS
This chart shows chapter 13 filings in South Dakota for calendar years 1999 – 2009. Chapter 13 filings averaged 169 per year during this period.

119
137 138
124130
146
156
94
118
131
151
0
50
100
150
200
1999 2000 2001 2002 2003 2004 2005 2006 2007 2008 2009
CHAPTER 13 FILINGS IN ALASKA CALENDAR YEARS 1999 – 2009
CALENDAR YEAR
CH
AP
TE
R 1
3 F
ILIN
GS
This chart shows chapter 13 filings in Alaska for calendar years 1999 – 2009. Chapter 13 filings averaged 131 per year during this period.

4,129
3,792
4,741
5,8706,079
5,395
4,137
1,362
2,348
3,586
5,627
0
1,500
3,000
4,500
6,000
7,500
1999 2000 2001 2002 2003 2004 2005 2006 2007 2008 2009
CHAPTER 13 FILINGS IN ARIZONA CALENDAR YEARS 1999 – 2009
CALENDAR YEAR
CH
AP
TE
R 1
3 F
ILIN
GS
This chart shows chapter 13 filings in Arizona for calendar years 1999 – 2009. Chapter 13 filings averaged 4,279 per year during this period.

34,751
29,18327,259 26,769
23,303
17,11714,975
9,816
19,348
23,653
45,813
0
10,000
20,000
30,000
40,000
50,000
1999 2000 2001 2002 2003 2004 2005 2006 2007 2008 2009
CHAPTER 13 FILINGS IN CALIFORNIA CALENDAR YEARS 1999 – 2009
CALENDAR YEAR
CH
AP
TE
R 1
3 F
ILIN
GS
This chart shows chapter 13 filings in California for calendar years 1999 – 2009. Chapter 13 filings averaged 25,344 per year during this period.

500480
507
461 462
356341
153
259
436
600
0
250
500
750
1999 2000 2001 2002 2003 2004 2005 2006 2007 2008 2009
CHAPTER 13 FILINGS IN HAWAII CALENDAR YEARS 1999 – 2009
CALENDAR YEAR
CH
AP
TE
R 1
3 F
ILIN
GS
This chart shows chapter 13 filings in Hawaii for calendar years 1999 – 2009. Chapter 13 filings averaged 414 per year during this period.

1,444
1,327
1,1631,214 1,225 1,251
1,298
570
739815
854
0
500
1,000
1,500
2,000
1999 2000 2001 2002 2003 2004 2005 2006 2007 2008 2009
CHAPTER 13 FILINGS IN IDAHO CALENDAR YEARS 1999 – 2009
CALENDAR YEAR
CH
AP
TE
R 1
3 F
ILIN
GS
This chart shows chapter 13 filings in Idaho for calendar years 1999 – 2009. Chapter 13 filings averaged 1,082 per year during this period.

462
390
449
477 486
418
468
229
332313
405
0
200
400
600
1999 2000 2001 2002 2003 2004 2005 2006 2007 2008 2009
CHAPTER 13 FILINGS IN MONTANA CALENDAR YEARS 1999 – 2009
CALENDAR YEAR
CH
AP
TE
R 1
3 F
ILIN
GS
This chart shows chapter 13 filings in Montana for calendar years 1999 – 2009. Chapter 13 filings averaged 403 per year during this period.

3,8573,652
4,442
4,8035,052
3,547 3,610
1,872
4,106
5,489
7,844
0
2,000
4,000
6,000
8,000
1999 2000 2001 2002 2003 2004 2005 2006 2007 2008 2009
CHAPTER 13 FILINGS IN NEVADA CALENDAR YEARS 1999 – 2009
CALENDAR YEAR
CH
AP
TE
R 1
3 F
ILIN
GS
This chart shows chapter 13 filings in Nevada for calendar years 1999 – 2009. Chapter 13 filings averaged 4,389 per year during this period.

3,069 3,0483,209
3,489
3,7743,952
4,188
1,860
2,522
3,184
3,981
0
1,000
2,000
3,000
4,000
5,000
1999 2000 2001 2002 2003 2004 2005 2006 2007 2008 2009
CHAPTER 13 FILINGS IN OREGON CALENDAR YEARS 1999 – 2009
CALENDAR YEAR
CH
AP
TE
R 1
3 F
ILIN
GS
This chart shows chapter 13 filings in Oregon for calendar years 1999 – 2009. Chapter 13 filings averaged 3,298 per year during this period.

6,467
6,9567,350
7,825 7,886
7,426
6,830
3,423
4,537
5,920
6,911
0
2,000
4,000
6,000
8,000
10,000
1999 2000 2001 2002 2003 2004 2005 2006 2007 2008 2009
CHAPTER 13 FILINGS IN WASHINGTON CALENDAR YEARS 1999 – 2009
CALENDAR YEAR
CH
AP
TE
R 1
3 F
ILIN
GS
This chart shows chapter 13 filings in Washington for calendar years 1999 – 2009. Chapter 13 filings averaged 6,503 per year during this period.

2,4462,344 2,389
2,607 2,638
2,902 2,851
1,712
2,461
2,976
4,152
0
1,000
2,000
3,000
4,000
5,000
1999 2000 2001 2002 2003 2004 2005 2006 2007 2008 2009
CHAPTER 13 FILINGS IN COLORADO CALENDAR YEARS 1999 – 2009
CALENDAR YEAR
CH
AP
TE
R 1
3 F
ILIN
GS
This chart shows chapter 13 filings in Colorado for calendar years 1999 – 2009. Chapter 13 filings averaged 2,680 per year during this period.

2,271
2,067
2,389
2,814
3,122 3,085
3,432
2,086
2,6472,736
3,226
0
1,000
2,000
3,000
4,000
1999 2000 2001 2002 2003 2004 2005 2006 2007 2008 2009
CHAPTER 13 FILINGS IN KANSAS CALENDAR YEARS 1999 – 2009
CALENDAR YEAR
CH
AP
TE
R 1
3 F
ILIN
GS
This chart shows chapter 13 filings in Kansas for calendar years 1999 – 2009. Chapter 13 filings averaged 2,716 per year during this period.

1,045 1,034 1,054
835885
833
674
302
380424
460
0
500
1,000
1,500
1999 2000 2001 2002 2003 2004 2005 2006 2007 2008 2009
CHAPTER 13 FILINGS IN NEW MEXICO CALENDAR YEARS 1999 – 2009
CALENDAR YEAR
CH
AP
TE
R 1
3 F
ILIN
GS
This chart shows chapter 13 filings in New Mexico for calendar years 1999 – 2009. Chapter 13 filings averaged 721 per year during this period.

2,940
2,6992,858
2,694
2,873
3,080 3,087
1,716
2,012
2,2252,325
0
1,000
2,000
3,000
4,000
1999 2000 2001 2002 2003 2004 2005 2006 2007 2008 2009
CHAPTER 13 FILINGS IN OKLAHOMA CALENDAR YEARS 1999 – 2009
CALENDAR YEAR
CH
AP
TE
R 1
3 F
ILIN
GS
This chart shows chapter 13 filings in Oklahoma for calendar years 1999 – 2009. Chapter 13 filings averaged 2,592 per year during this period.

5,354
6,073
6,797
7,426
6,889
6,368
5,086
1,897
2,708
3,772
5,122
0
2,000
4,000
6,000
8,000
1999 2000 2001 2002 2003 2004 2005 2006 2007 2008 2009
CHAPTER 13 FILINGS IN UTAH CALENDAR YEARS 1999 – 2009
CALENDAR YEAR
CH
AP
TE
R 1
3 F
ILIN
GS
This chart shows chapter 13 filings in Utah for calendar years 1999 – 2009. Chapter 13 filings averaged 5,227 per year during this period.

132
122
149145
193
178
155
108
130123
176
0
50
100
150
200
1999 2000 2001 2002 2003 2004 2005 2006 2007 2008 2009
CHAPTER 13 FILINGS IN WYOMING CALENDAR YEARS 1999 – 2009
CALENDAR YEAR
CH
AP
TE
R 1
3 F
ILIN
GS
This chart shows chapter 13 filings in Wyoming for calendar years 1999 – 2009. Chapter 13 filings averaged 146 per year during this period.

18,232
19,645
21,26921,726 21,643 21,443
19,258
12,903
15,480
18,349
20,091
0
5,000
10,000
15,000
20,000
25,000
1999 2000 2001 2002 2003 2004 2005 2006 2007 2008 2009
CHAPTER 13 FILINGS IN ALABAMA CALENDAR YEARS 1999 – 2009
CALENDAR YEAR
CH
AP
TE
R 1
3 F
ILIN
GS
This chart shows chapter 13 filings in Alabama for calendar years 1999 – 2009. Chapter 13 filings averaged 19,094 per year during this period.

19,368
20,900
23,158
25,14625,681
21,407
18,048
8,903
14,680
19,126
23,524
0
6,000
12,000
18,000
24,000
30,000
1999 2000 2001 2002 2003 2004 2005 2006 2007 2008 2009
CHAPTER 13 FILINGS IN FLORIDA CALENDAR YEARS 1999 – 2009
CALENDAR YEAR
CH
AP
TE
R 1
3 F
ILIN
GS
This chart shows chapter 13 filings in Florida for calendar years 1999 – 2009. Chapter 13 filings averaged 19,995 per year during this period.

35,94937,664
41,67643,189 43,677
41,400
34,977
24,727
29,460
33,153 34,047
0
10,000
20,000
30,000
40,000
50,000
1999 2000 2001 2002 2003 2004 2005 2006 2007 2008 2009
CHAPTER 13 FILINGS IN GEORGIA CALENDAR YEARS 1999 – 2009
CALENDAR YEAR
CH
AP
TE
R 1
3 F
ILIN
GS
This chart shows chapter 13 filings in Georgia for calendar years 1999 – 2009. Chapter 13 filings averaged 36,356 per year during this period.
871
815
736 724
617
471
285
240
336373
349
0
200
400
600
800
1,000
1999 2000 2001 2002 2003 2004 2005 2006 2007 2008 2009
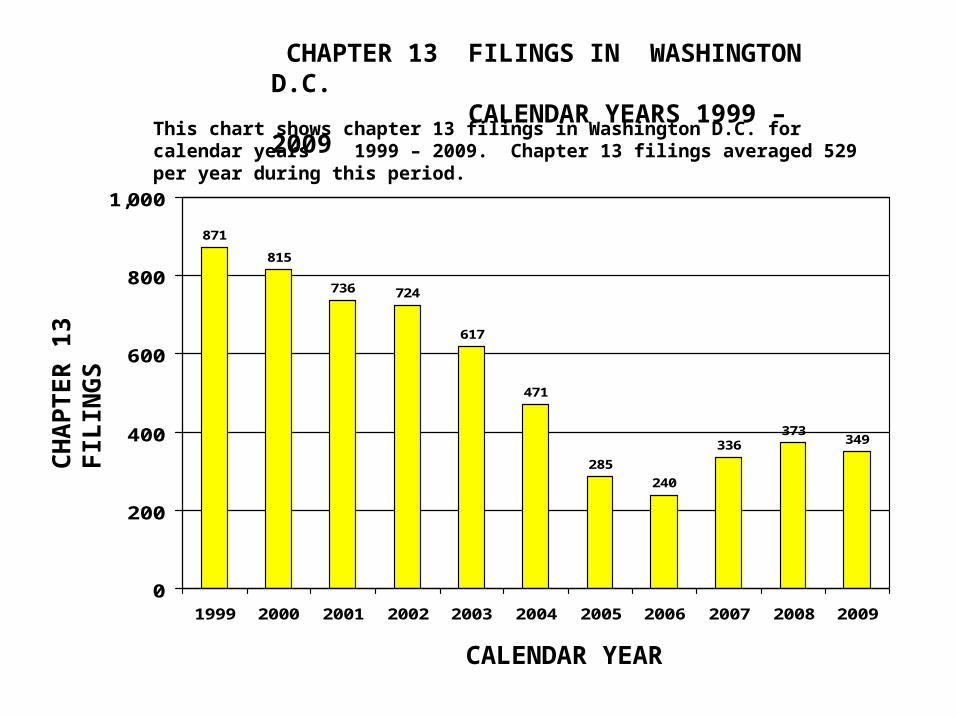
CHAPTER 13 FILINGS IN WASHINGTON D.C. CALENDAR YEARS 1999 – 2009
CALENDAR YEAR
CH
AP
TE
R 1
3 F
ILIN
GS
This chart shows chapter 13 filings in Washington D.C. for calendar years 1999 – 2009. Chapter 13 filings averaged 529 per year during this period.