
Chapter 12 The Properties of Solutions A medical research scientist inspects sheets of collagen that...
50
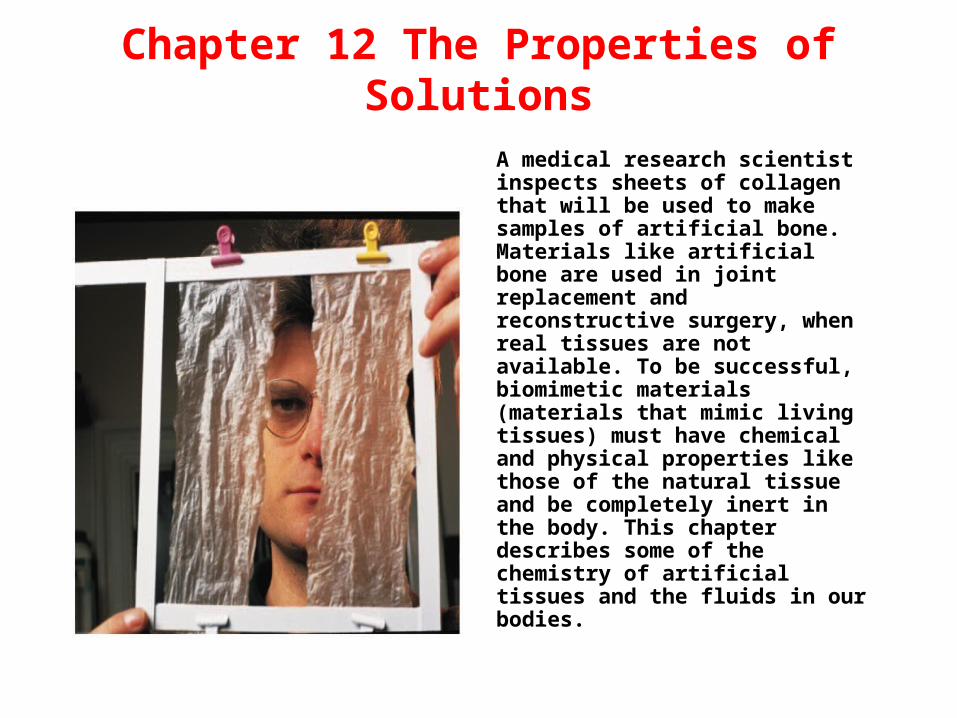
Chapter 12 The Properties of Solutions A medical research scientist inspects sheets of collagen that will be used to make samples of artificial bone. Materials like artificial bone are used in joint replacement and reconstructive surgery, when real tissues are not available. To be successful, biomimetic materials (materials that mimic living tissues) must have chemical and physical properties like those of the natural tissue and be completely inert in the body. This chapter describes some of the chemistry of artificial tissues and the fluids in our bodies.
-
Upload
patience-price -
Category
Documents
-
view
222 -
download
3
Transcript of Chapter 12 The Properties of Solutions A medical research scientist inspects sheets of collagen that...
Chapter 12 The Properties of Solutions
A medical research scientist inspects sheets of collagen that will be used to make samples of artificial bone. Materials like artificial bone are used in joint replacement and reconstructive surgery, when real tissues are not available. To be successful, biomimetic materials (materials that mimic living tissues) must have chemical and physical properties like those of the natural tissue and be completely inert in the body. This chapter describes some of the chemistry of artificial tissues and the fluids in our bodies.
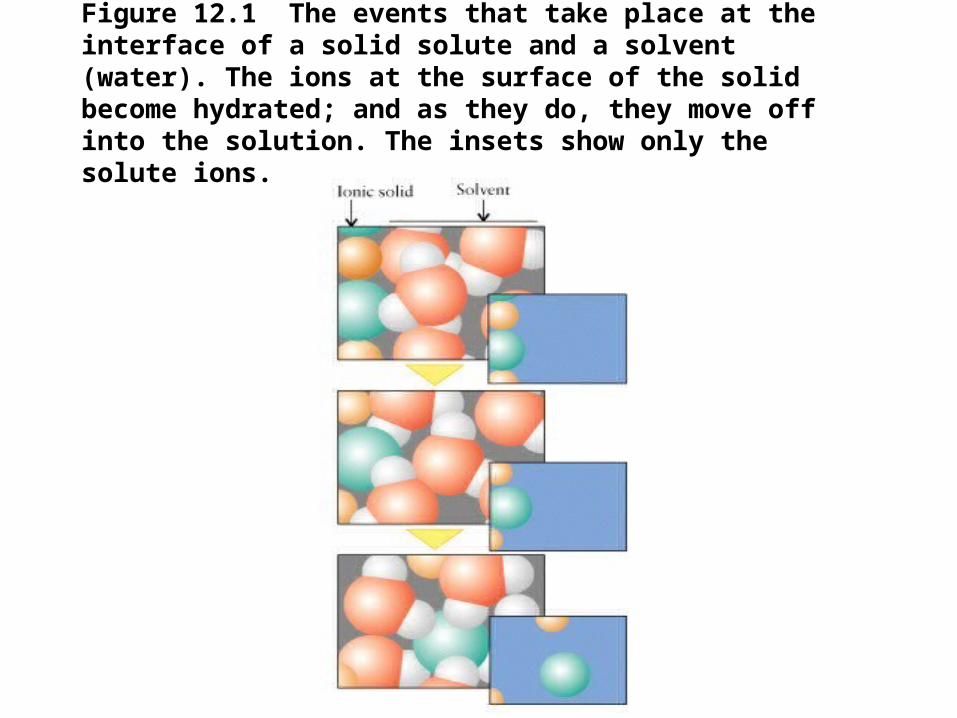
Figure 12.1 The events that take place at the interface of a solid solute and a solvent (water). The ions at the surface of the solid become hydrated; and as they do, they move off into the solution. The insets show only the solute ions.
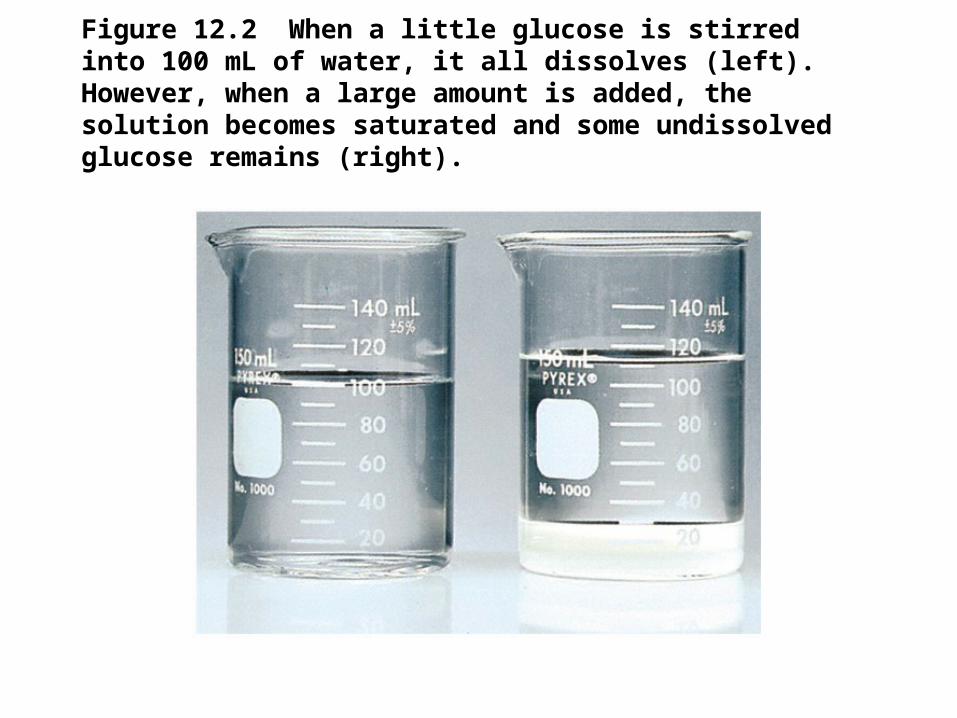
Figure 12.2 When a little glucose is stirred into 100 mL of water, it all dissolves (left). However, when a large amount is added, the solution becomes saturated and some undissolved glucose remains (right).
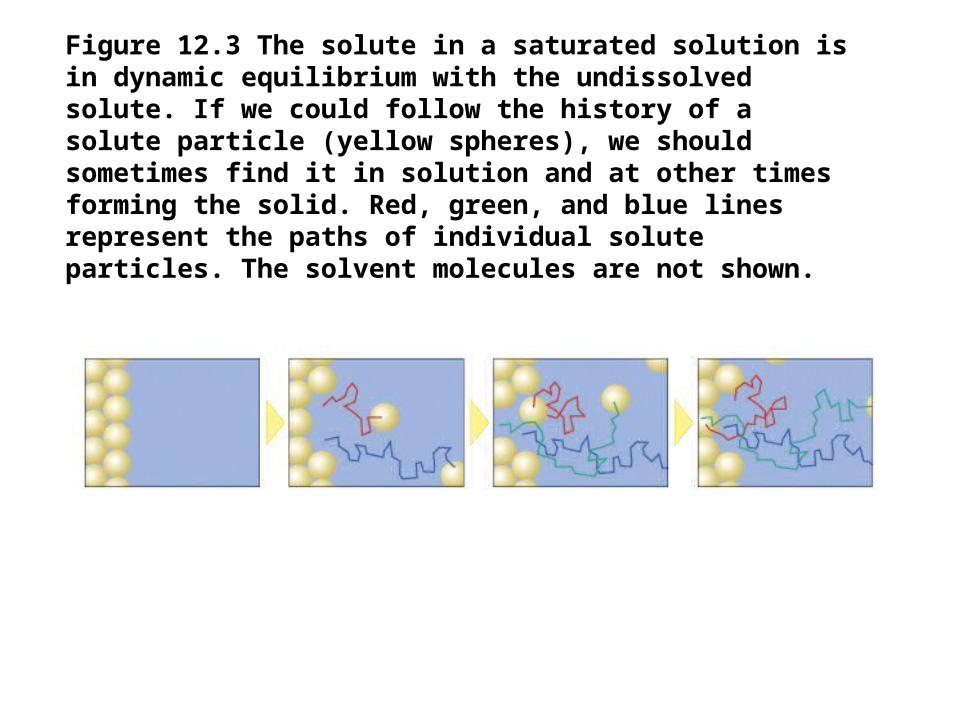
Figure 12.3 The solute in a saturated solution is in dynamic equilibrium with the undissolved solute. If we could follow the history of a solute particle (yellow spheres), we should sometimes find it in solution and at other times forming the solid. Red, green, and blue lines represent the paths of individual solute particles. The solvent molecules are not shown.
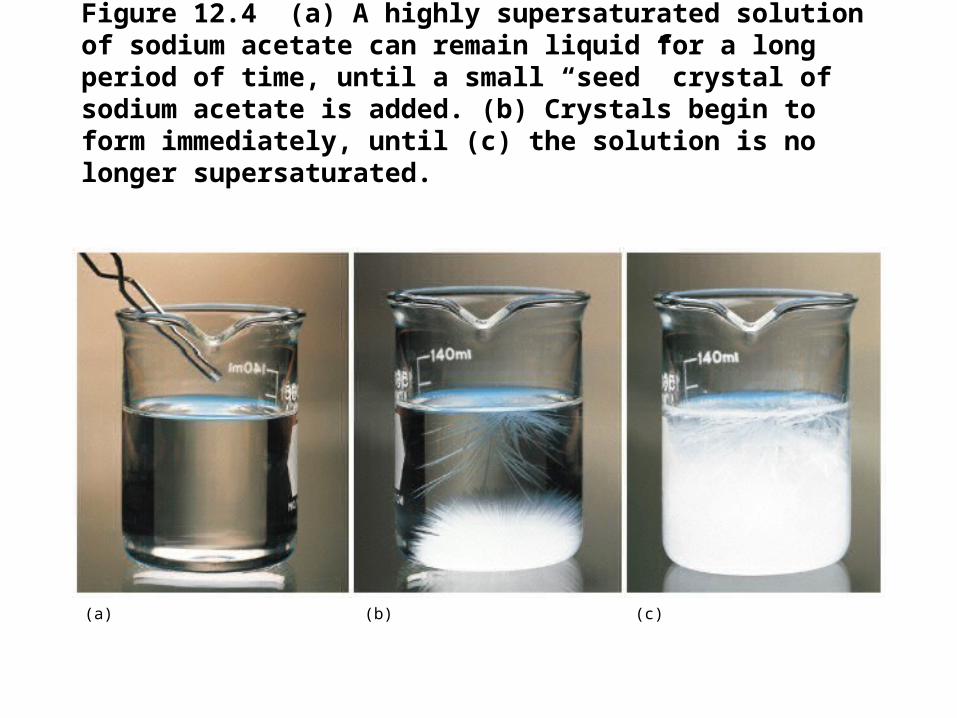
Figure 12.4 (a) A highly supersaturated solution of sodium acetate can remain liquid for a long period of time, until a small “seed” crystal of sodium acetate is added. (b) Crystals begin to form immediately, until (c) the solution is no longer supersaturated.
(b)(a) (c)
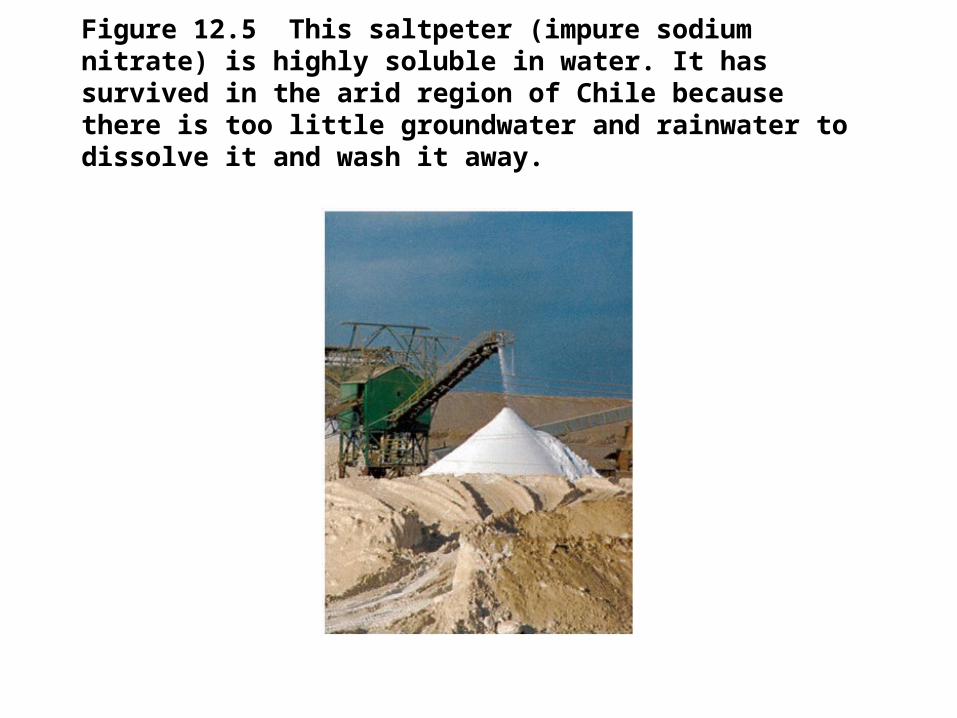
Figure 12.5 This saltpeter (impure sodium nitrate) is highly soluble in water. It has survived in the arid region of Chile because there is too little groundwater and rainwater to dissolve it and wash it away.

Figure 12.6 A molecular representation of the energy changes associated with the formation of a dilute solution. First, solute molecules are separated from one another. Then some of the solvent molecules move apart and leave cavities in the solvent. Finally, the solute molecules occupy the cavities in the solvent, and release energy. The overall energy change for the process is shown by the dark red arrow. In the actual solution process, these steps do not occur independently.
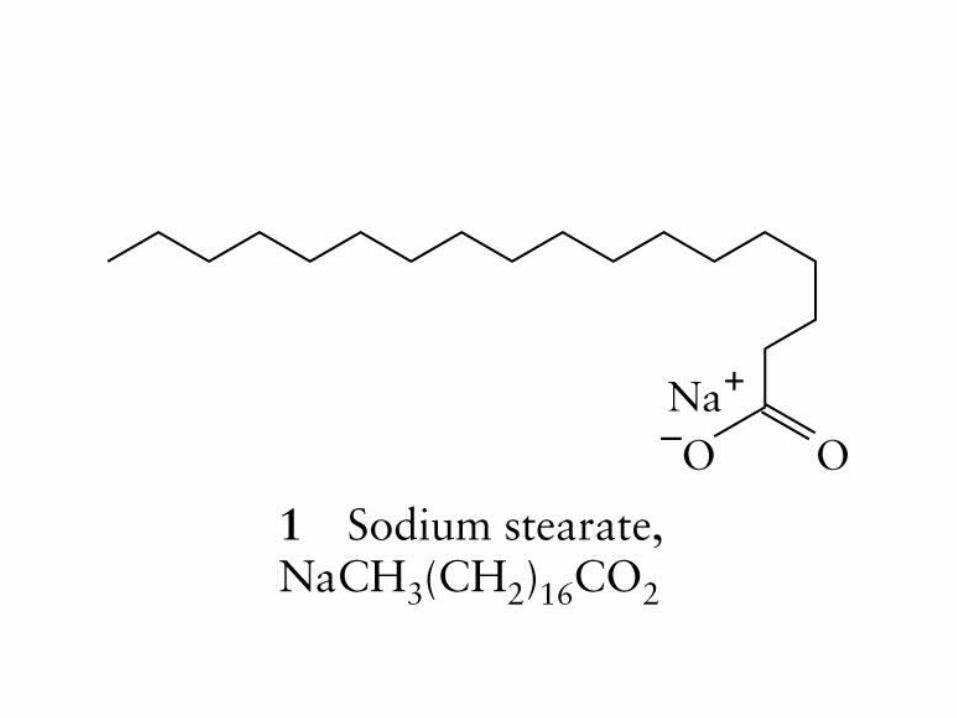
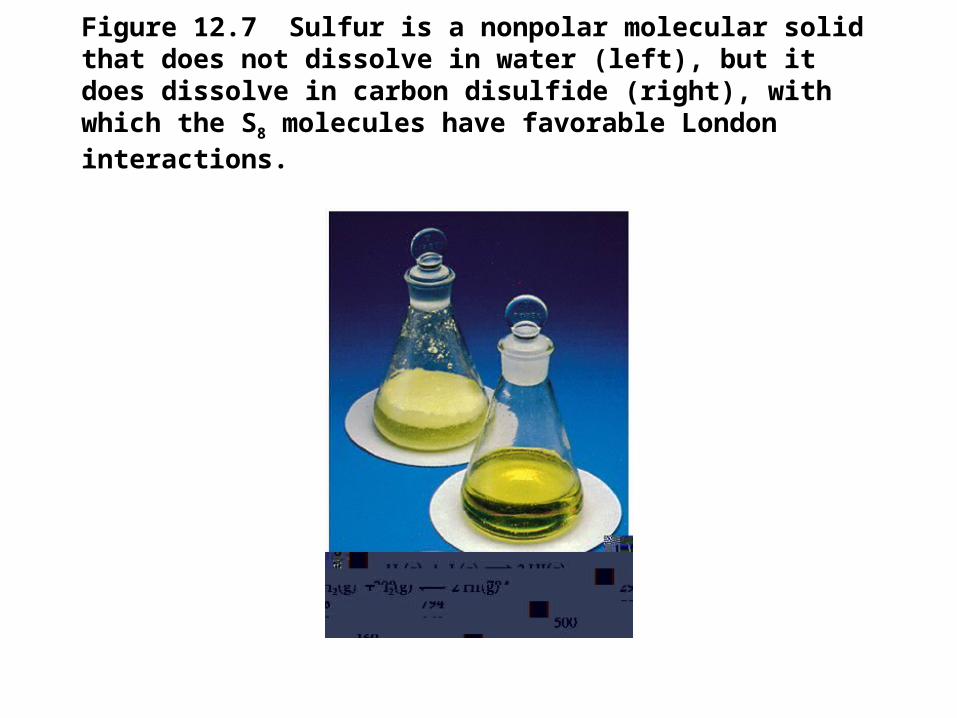
Figure 12.7 Sulfur is a nonpolar molecular solid that does not dissolve in water (left), but it does dissolve in carbon disulfide (right), with which the S8 molecules have favorable London interactions.
Figure 12.8 The hydrocarbon tails of soap or surfactant molecules dissolve in grease, but the water-attracting head groups remain on the surface, where they can interact favorably with water. As a result, the whole blob can dissolve in water and be washed away.
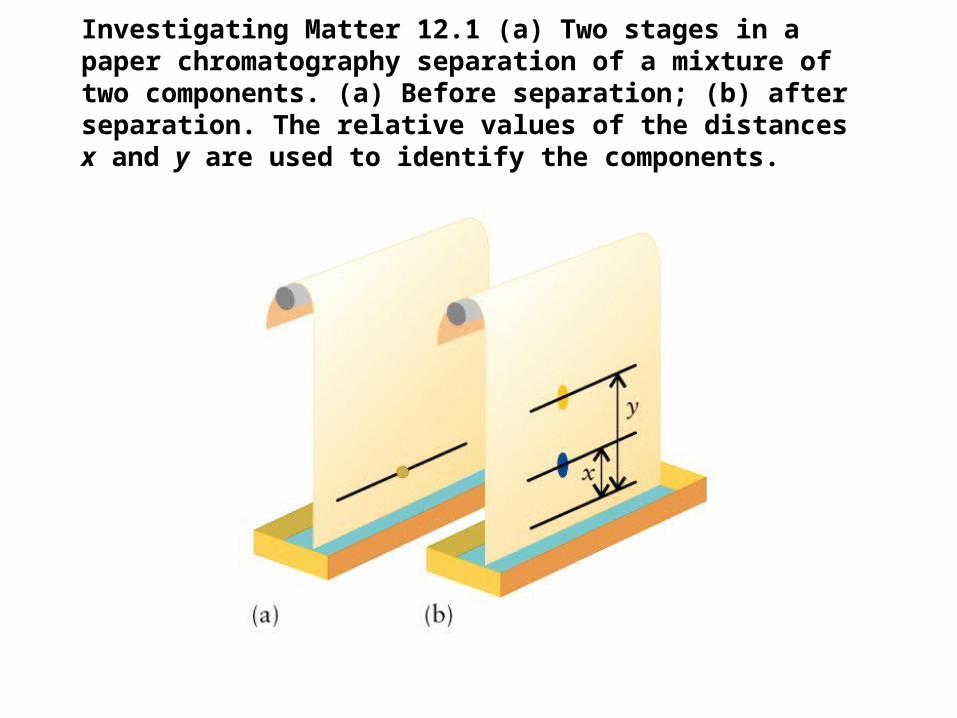
Investigating Matter 12.1 (a) Two stages in a paper chromatography separation of a mixture of two components. (a) Before separation; (b) after separation. The relative values of the distances x and y are used to identify the components.
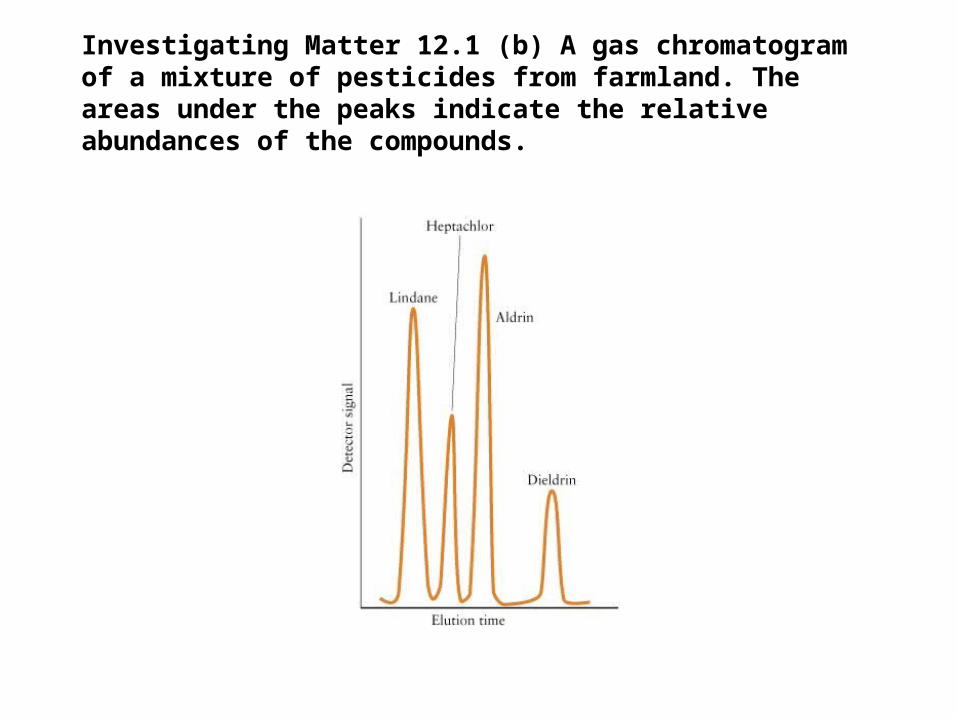
Investigating Matter 12.1 (b) A gas chromatogram of a mixture of pesticides from farmland. The areas under the peaks indicate the relative abundances of the compounds.
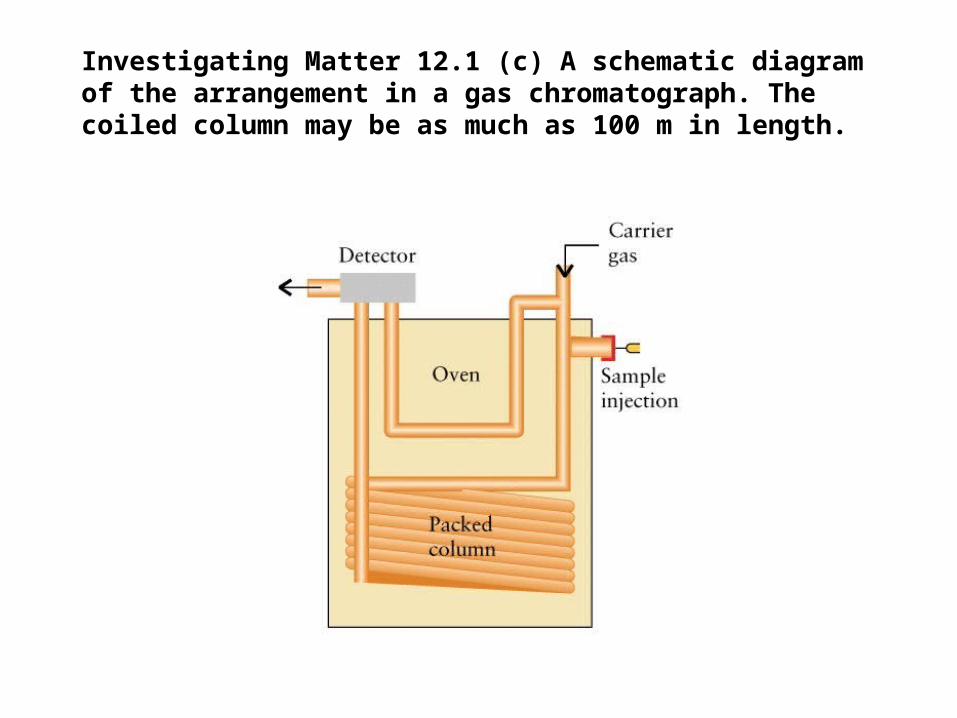
Investigating Matter 12.1 (c) A schematic diagram of the arrangement in a gas chromatograph. The coiled column may be as much as 100 m in length.
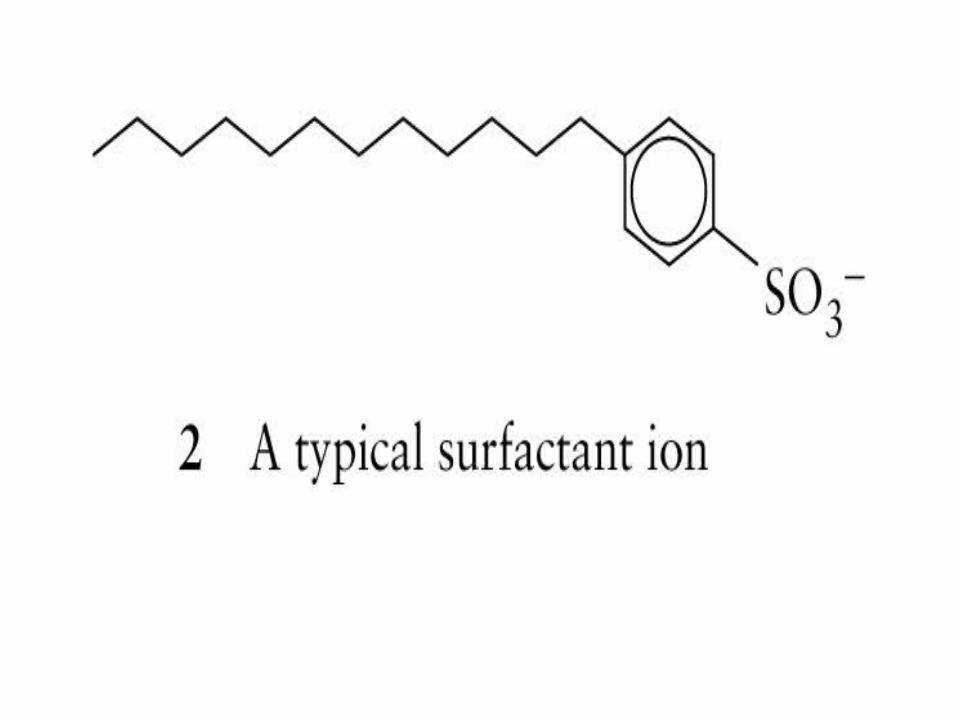
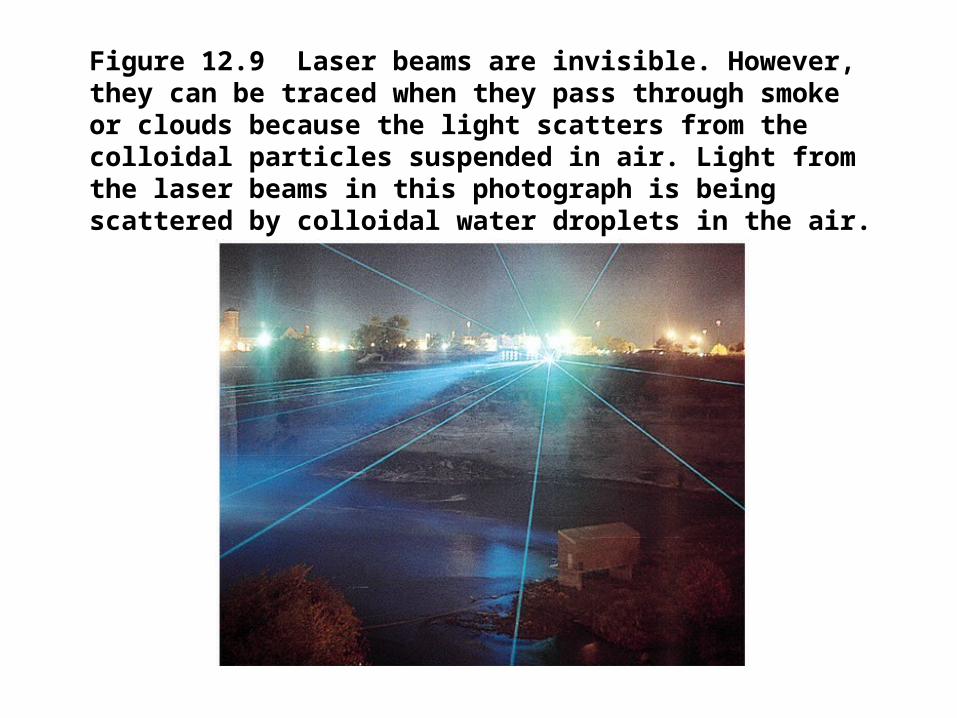
Figure 12.9 Laser beams are invisible. However, they can be traced when they pass through smoke or clouds because the light scatters from the colloidal particles suspended in air. Light from the laser beams in this photograph is being scattered by colloidal water droplets in the air.
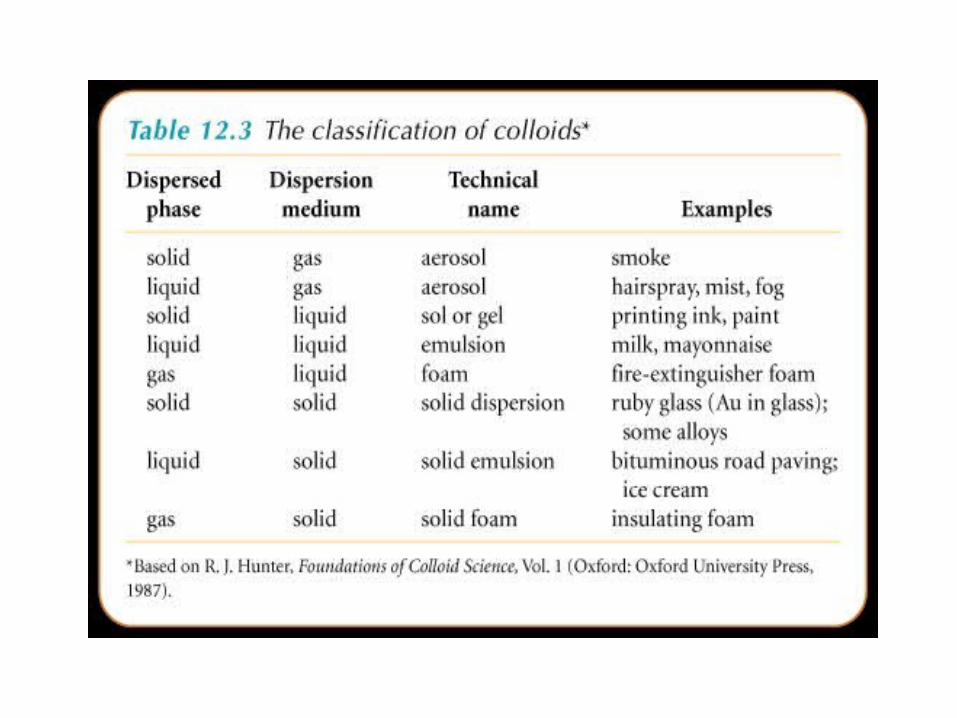
Case Study 12 (a) This sample of a smart gel expands in response to an increase in temperature.
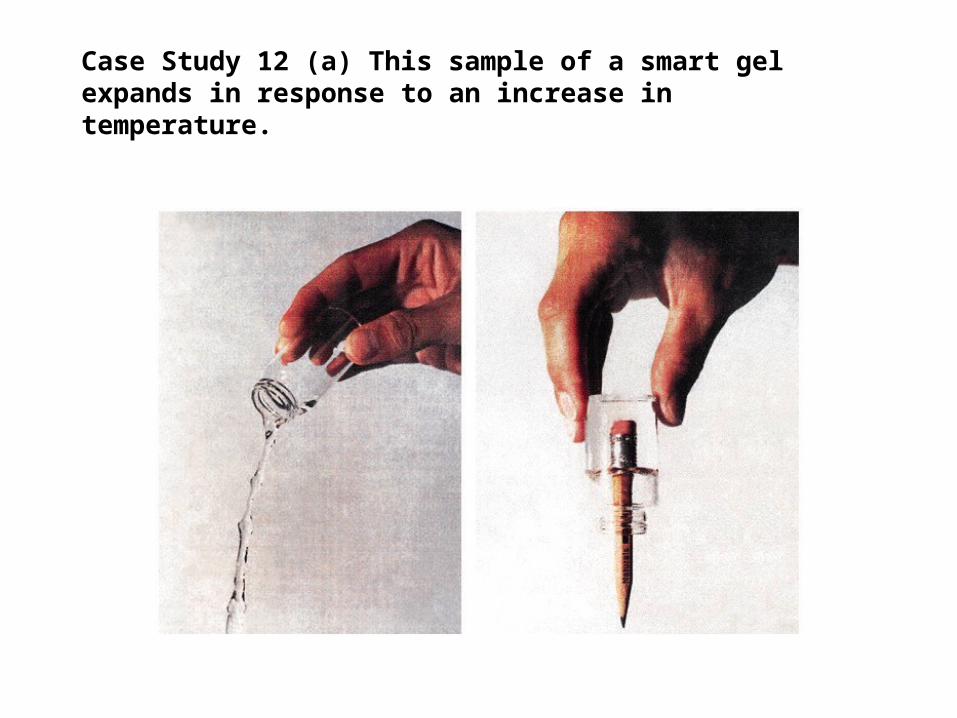
Case Study 12 (b) Four types of forces responsible for the adaptive behavior of smart gels. The different forces become active when the network of polymer chains composing the gel is disturbed. (a) Charged ionic regions can attract or repel one another. (b) Nonpolar regions can exclude water. (c) Hydrogen bonds may form from one chain to another. (d) Dipole-dipole interactions can attract or repel chains.
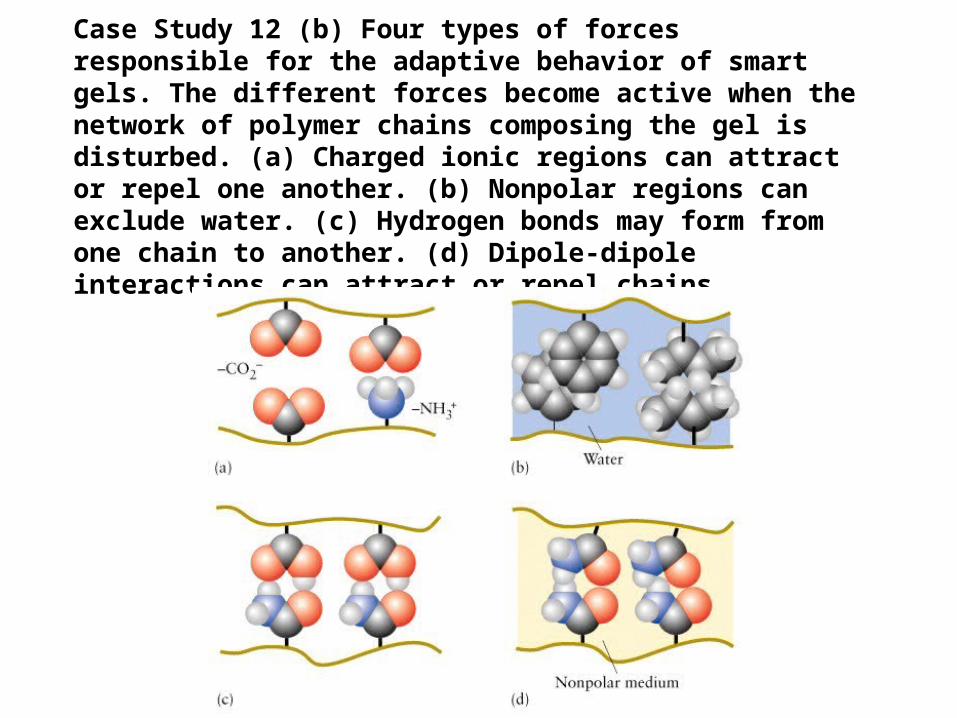
Case Study 12 (c) The structure of a liposome, in which a bilayer membrane is formed from liquid crystalline lipid molecules.

Figure 12.10 The variation of the molar solubilities of oxygen, nitrogen, and helium with partial pressure. Note that the solubility of each gas is doubled when its partial pressure is doubled.
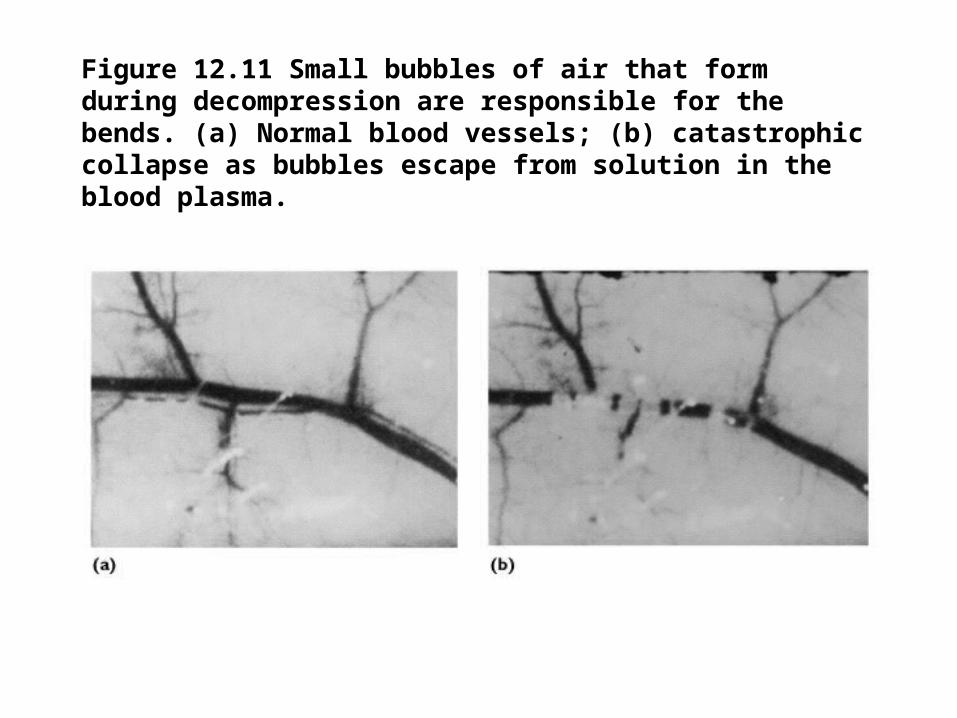
Figure 12.11 Small bubbles of air that form during decompression are responsible for the bends. (a) Normal blood vessels; (b) catastrophic collapse as bubbles escape from solution in the blood plasma.
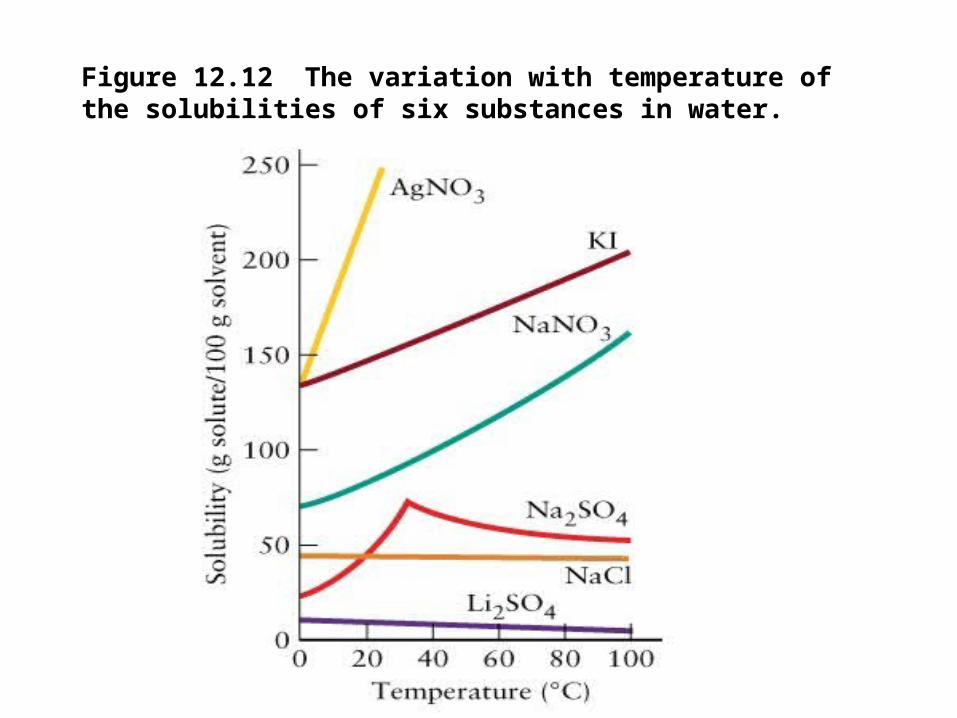
Figure 12.12 The variation with temperature of the solubilities of six substances in water.
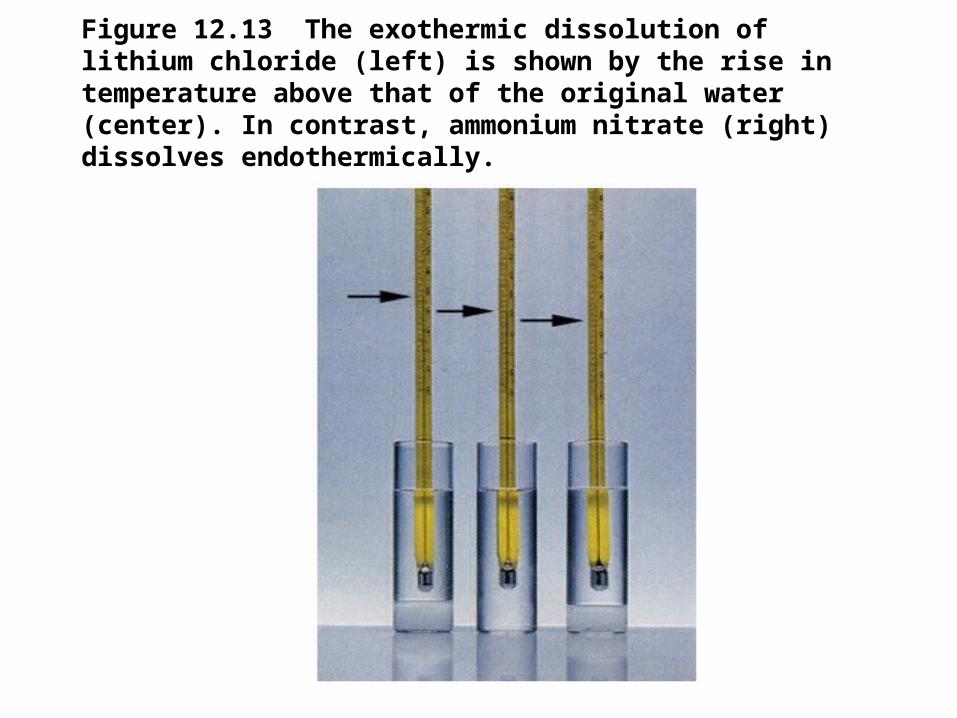
Figure 12.13 The exothermic dissolution of lithium chloride (left) is shown by the rise in temperature above that of the original water (center). In contrast, ammonium nitrate (right) dissolves endothermically.
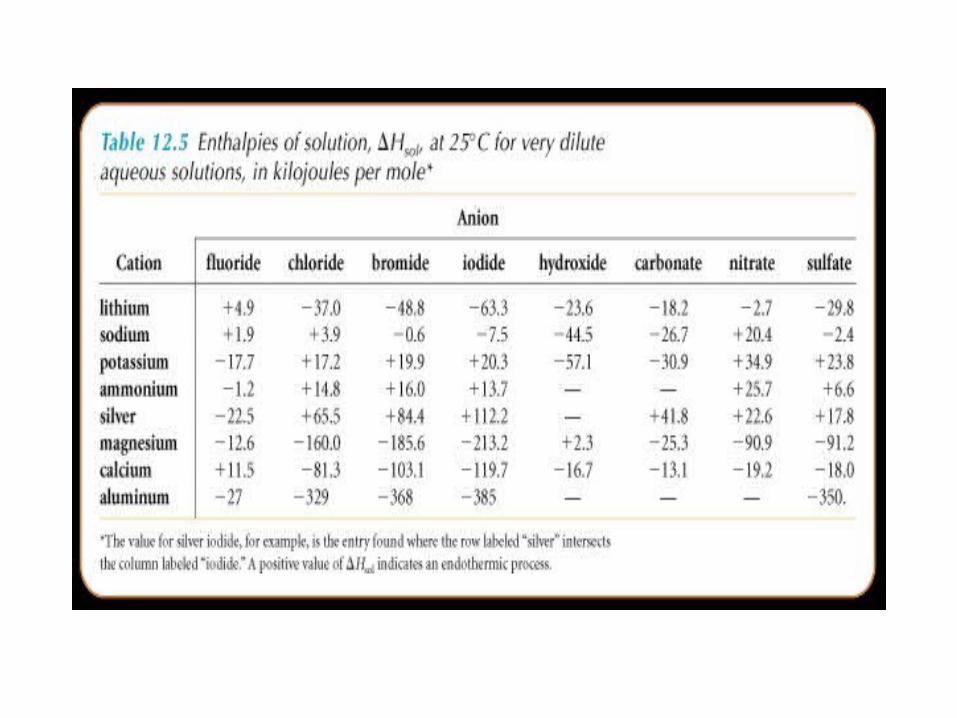
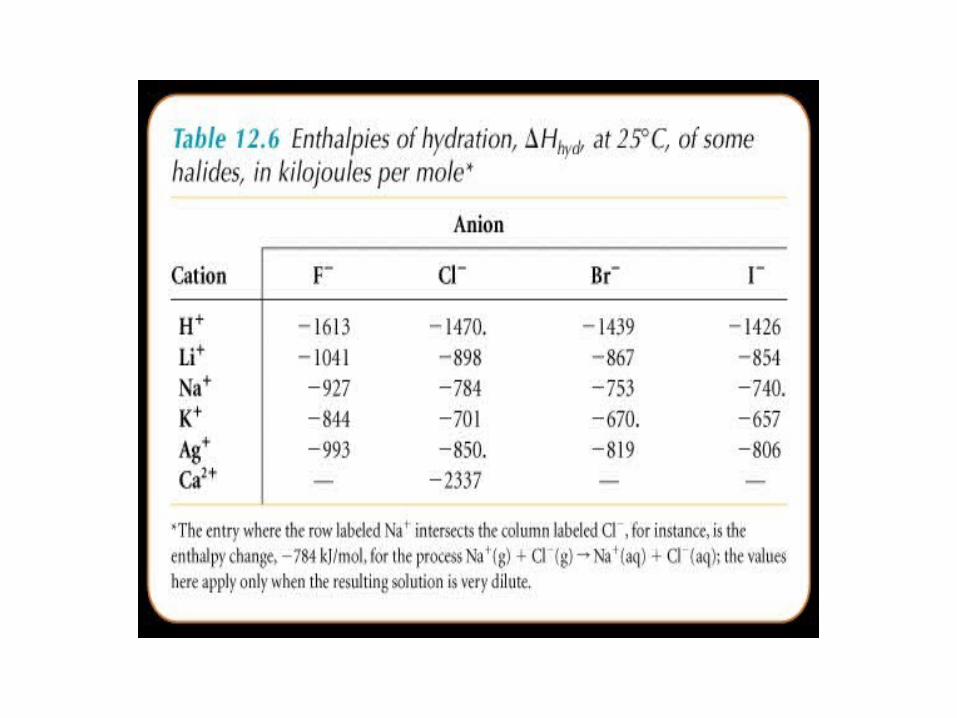
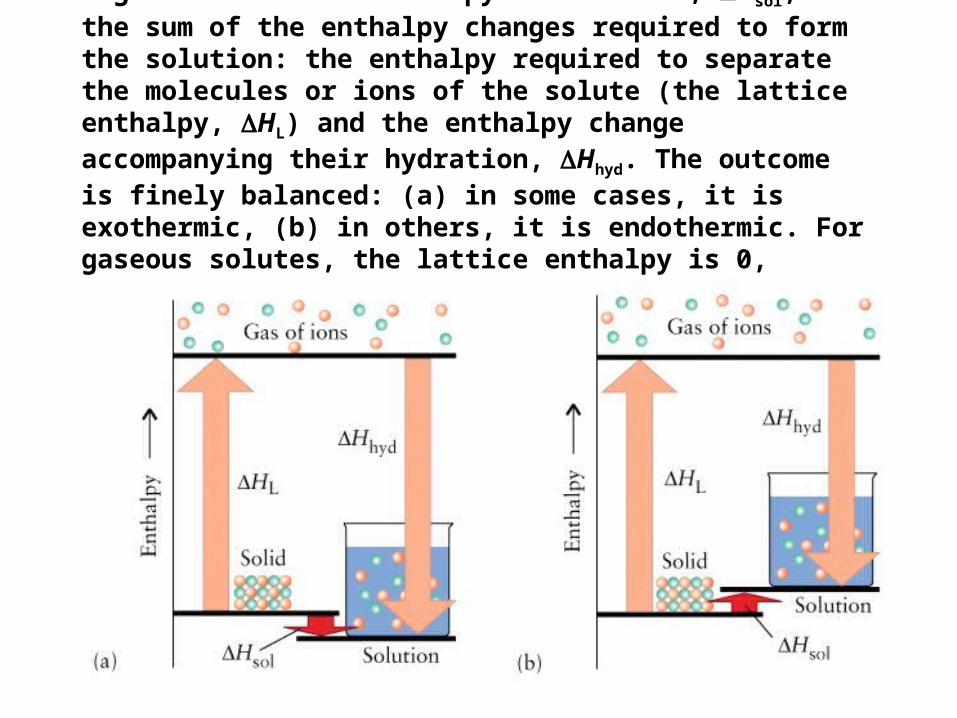
Figure 12.14 The enthalpy of solution, Hsol, is the sum of the enthalpy changes required to form the solution: the enthalpy required to separate the molecules or ions of the solute (the lattice enthalpy, HL) and the enthalpy change accompanying their hydration, Hhyd. The outcome is finely balanced: (a) in some cases, it is exothermic, (b) in others, it is endothermic. For gaseous solutes, the lattice enthalpy is 0, because the molecules are already widely separated.
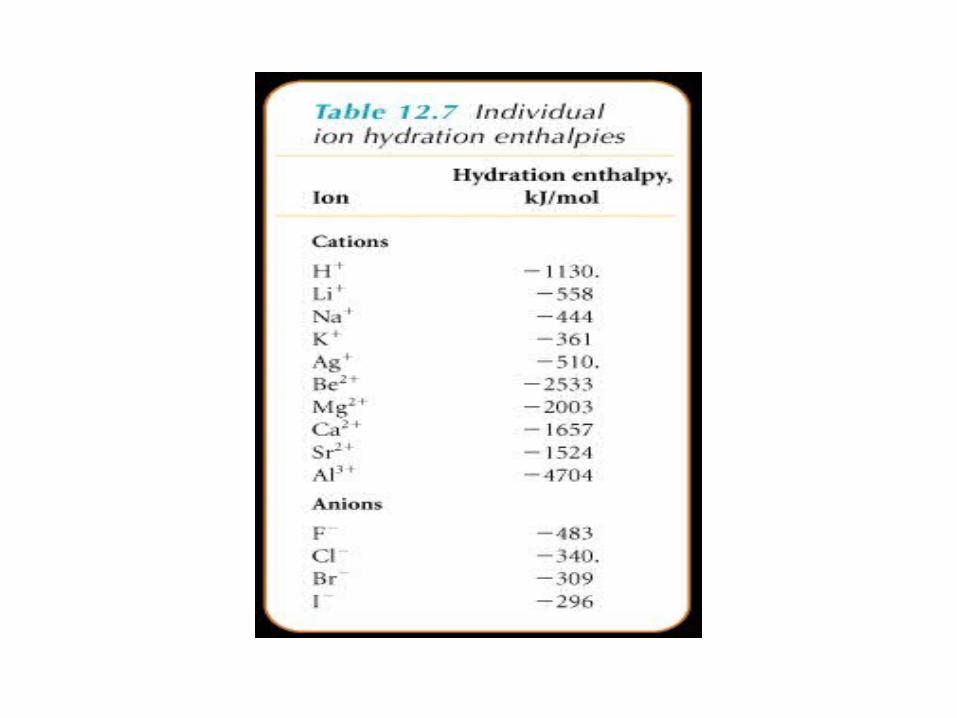

Figure 12.15 Matter has a natural tendency to disperse in a disorderly way. The reverse process is unnatural and has no tendency to occur. The dispersal of matter accounts for the expansion of gases and the spreading of matter through the environment, and contributes to the tendency of solids to dissolve. We shall see later that it also contributes to the tendency of chemical reactions to occur. The insets show the solute particles alone.
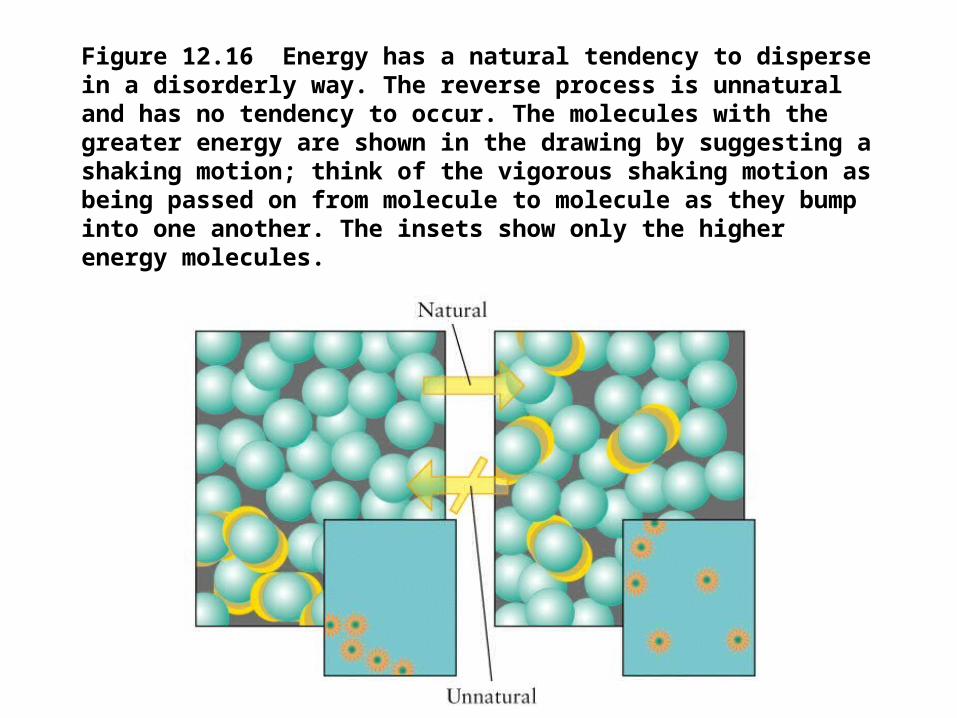
Figure 12.16 Energy has a natural tendency to disperse in a disorderly way. The reverse process is unnatural and has no tendency to occur. The molecules with the greater energy are shown in the drawing by suggesting a shaking motion; think of the vigorous shaking motion as being passed on from molecule to molecule as they bump into one another. The insets show only the higher energy molecules.
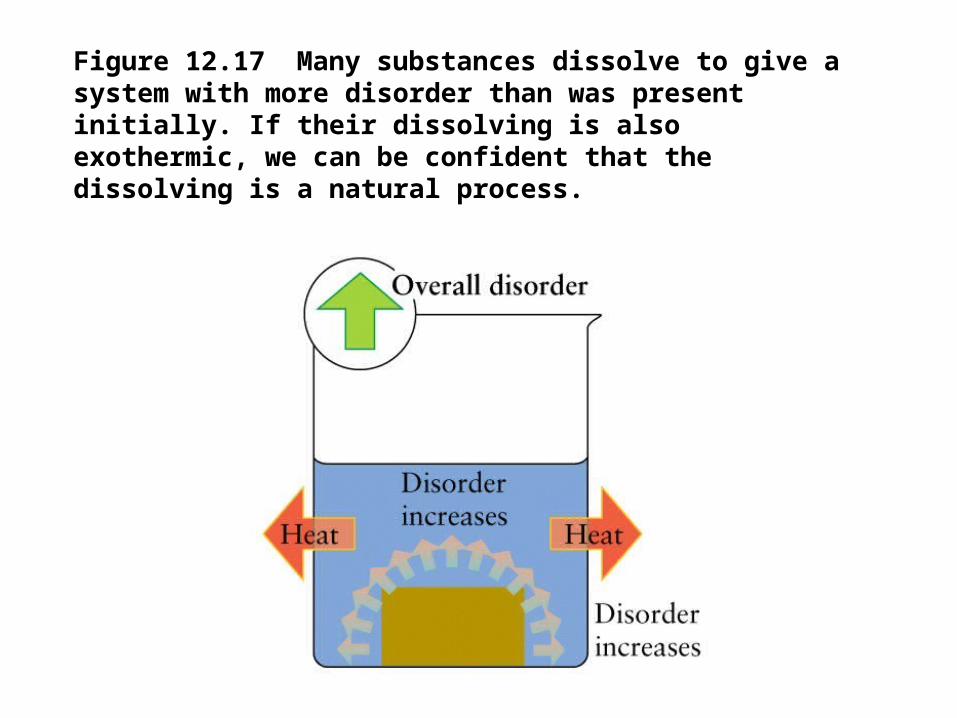
Figure 12.17 Many substances dissolve to give a system with more disorder than was present initially. If their dissolving is also exothermic, we can be confident that the dissolving is a natural process.

Figure 12.18 If dissolution is endothermic, it will occur only if the disorder caused by the solute dispersing is great enough to produce an overall increase in disorder.
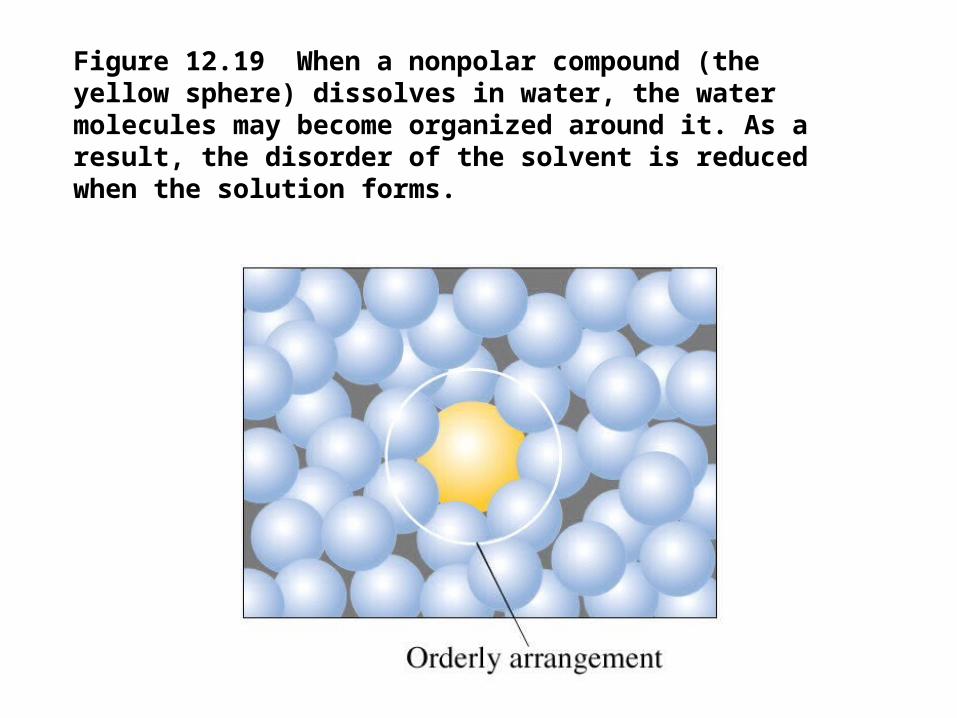
Figure 12.19 When a nonpolar compound (the yellow sphere) dissolves in water, the water molecules may become organized around it. As a result, the disorder of the solvent is reduced when the solution forms.
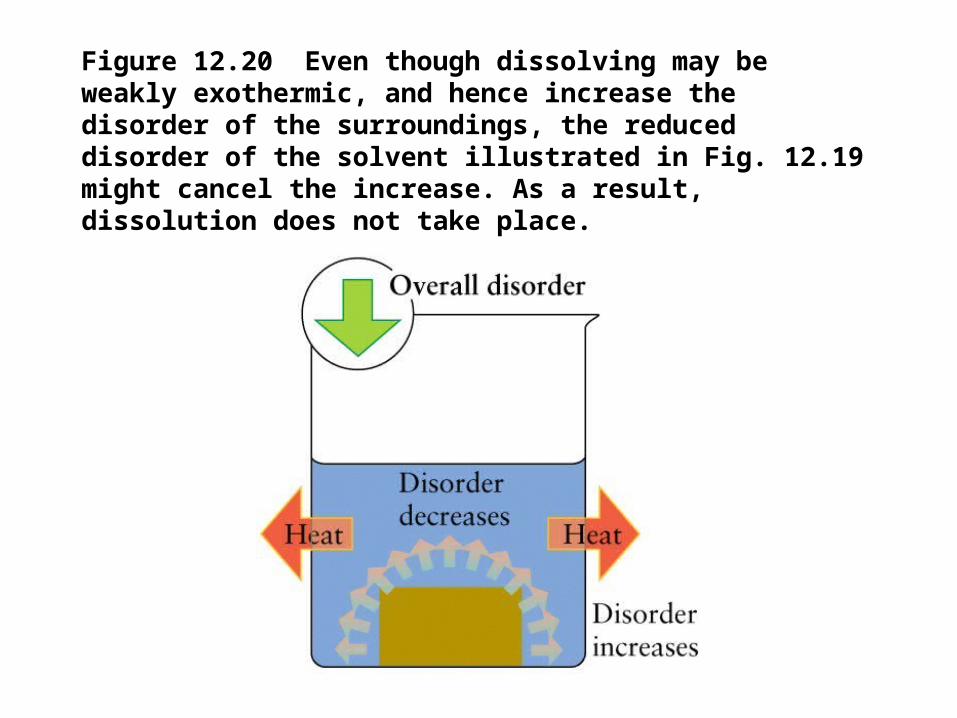
Figure 12.20 Even though dissolving may be weakly exothermic, and hence increase the disorder of the surroundings, the reduced disorder of the solvent illustrated in Fig. 12.19 might cancel the increase. As a result, dissolution does not take place.
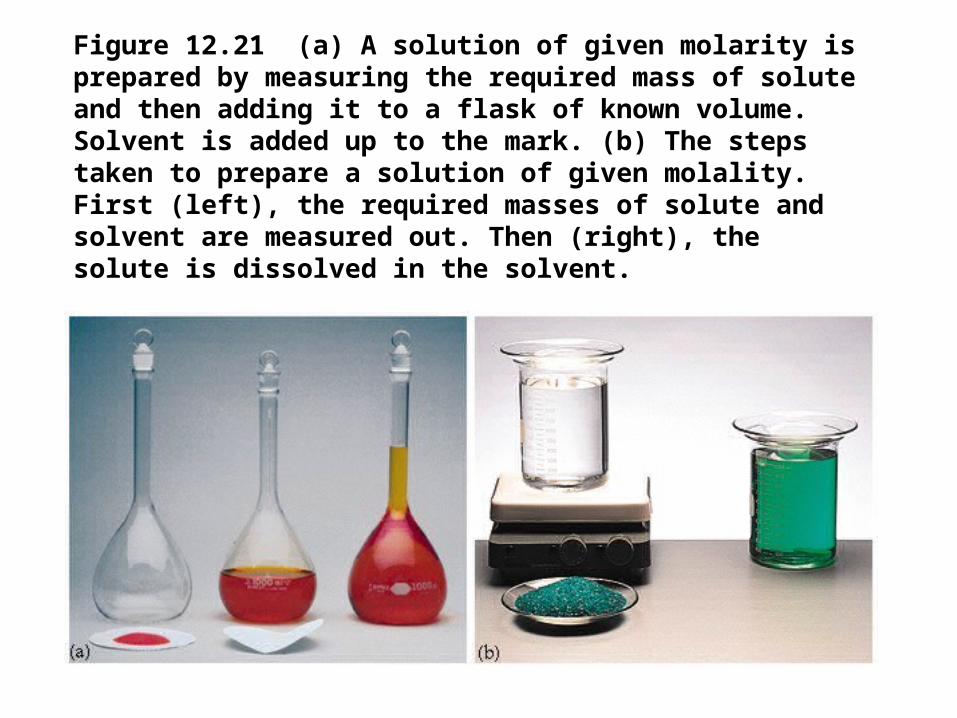
Figure 12.21 (a) A solution of given molarity is prepared by measuring the required mass of solute and then adding it to a flask of known volume. Solvent is added up to the mark. (b) The steps taken to prepare a solution of given molality. First (left), the required masses of solute and solvent are measured out. Then (right), the solute is dissolved in the solvent.
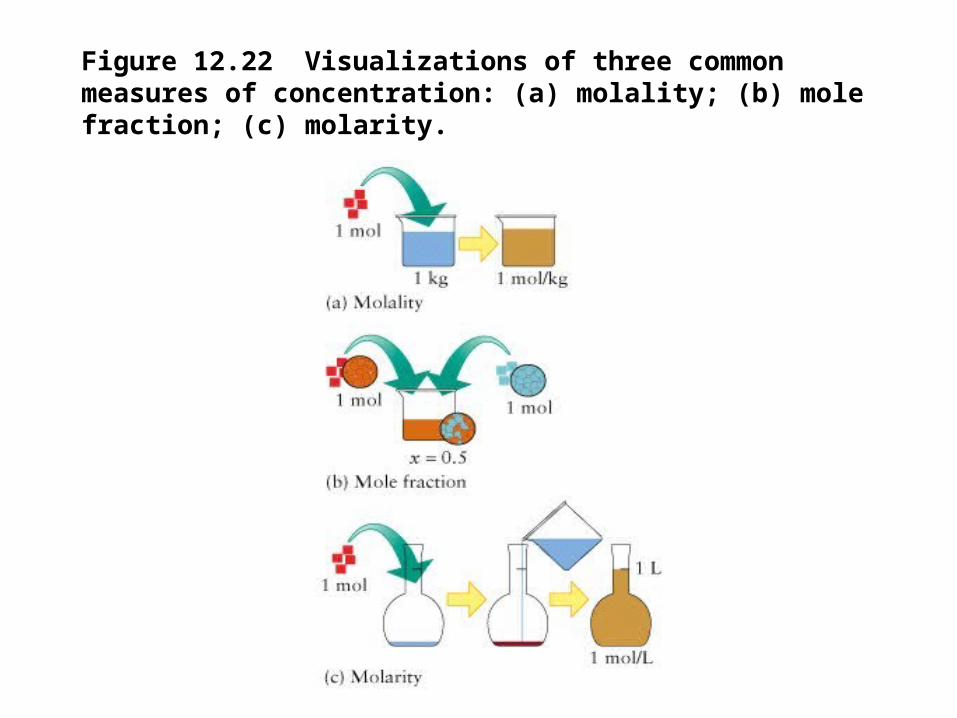
Figure 12.22 Visualizations of three common measures of concentration: (a) molality; (b) mole fraction; (c) molarity.
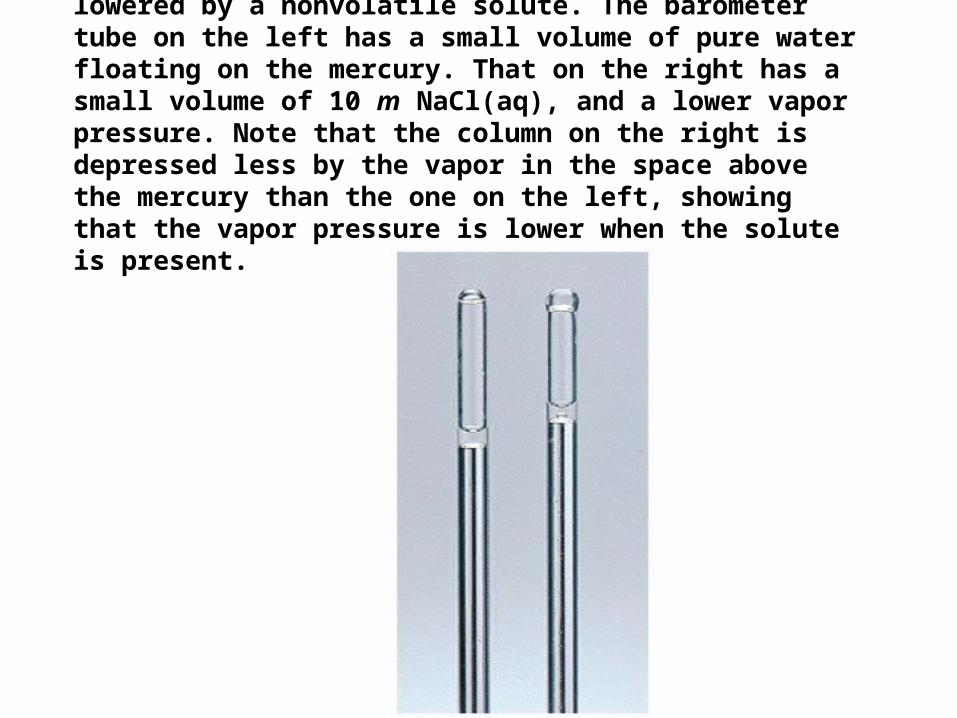
Figure 12.23 The vapor pressure of a solvent is lowered by a nonvolatile solute. The barometer tube on the left has a small volume of pure water floating on the mercury. That on the right has a small volume of 10 m NaCl(aq), and a lower vapor pressure. Note that the column on the right is depressed less by the vapor in the space above the mercury than the one on the left, showing that the vapor pressure is lower when the solute is present.
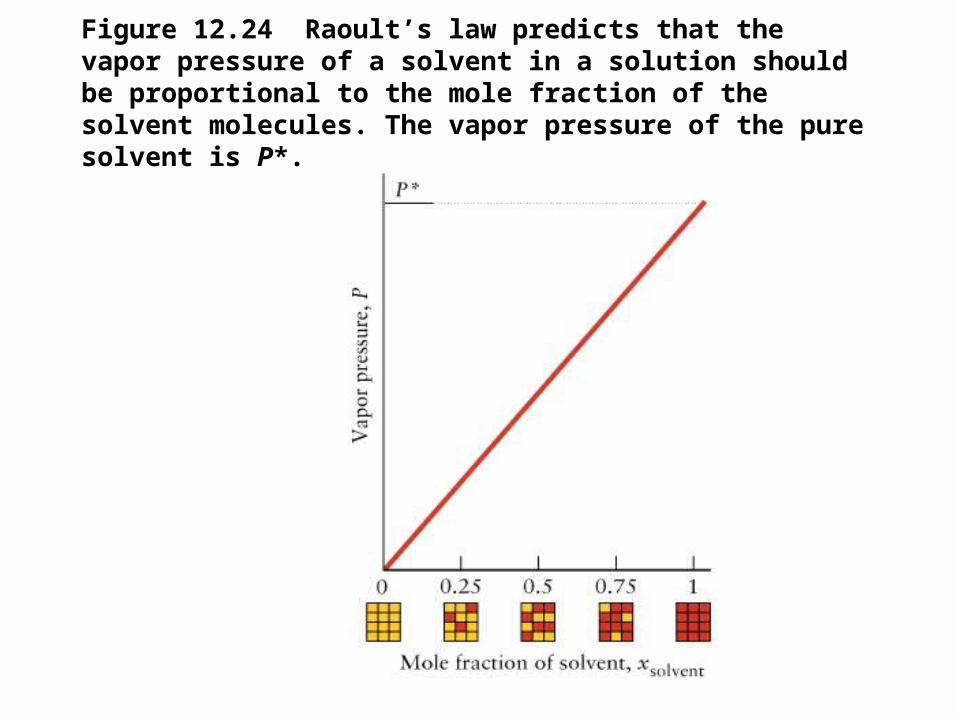
Figure 12.24 Raoult’s law predicts that the vapor pressure of a solvent in a solution should be proportional to the mole fraction of the solvent molecules. The vapor pressure of the pure solvent is P*.
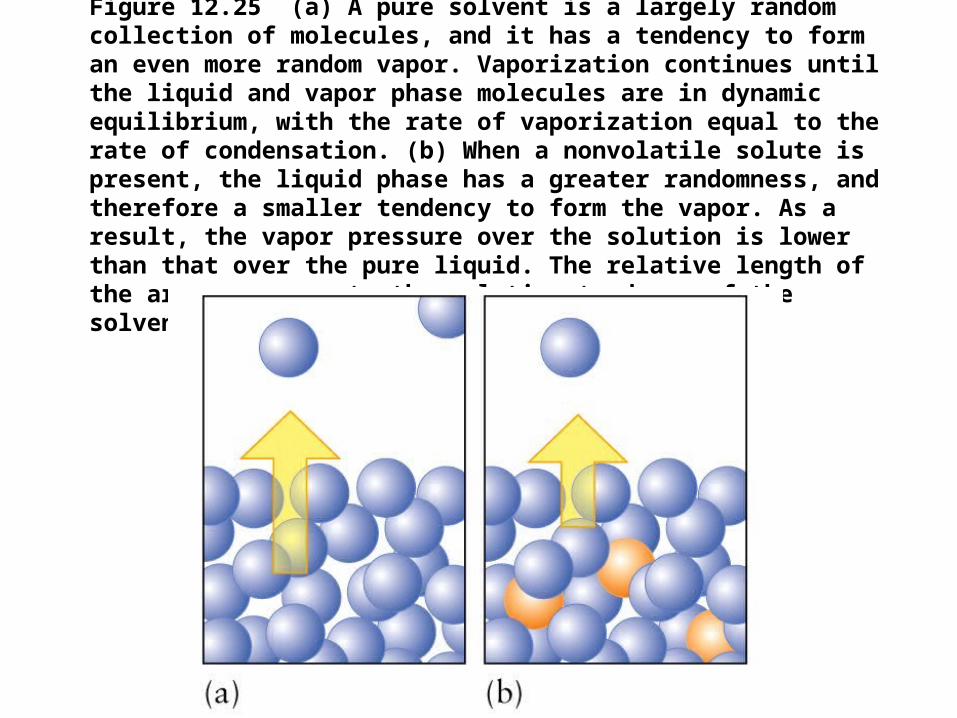
Figure 12.25 (a) A pure solvent is a largely random collection of molecules, and it has a tendency to form an even more random vapor. Vaporization continues until the liquid and vapor phase molecules are in dynamic equilibrium, with the rate of vaporization equal to the rate of condensation. (b) When a nonvolatile solute is present, the liquid phase has a greater randomness, and therefore a smaller tendency to form the vapor. As a result, the vapor pressure over the solution is lower than that over the pure liquid. The relative length of the arrow represents the relative tendency of the solvent to vaporize.
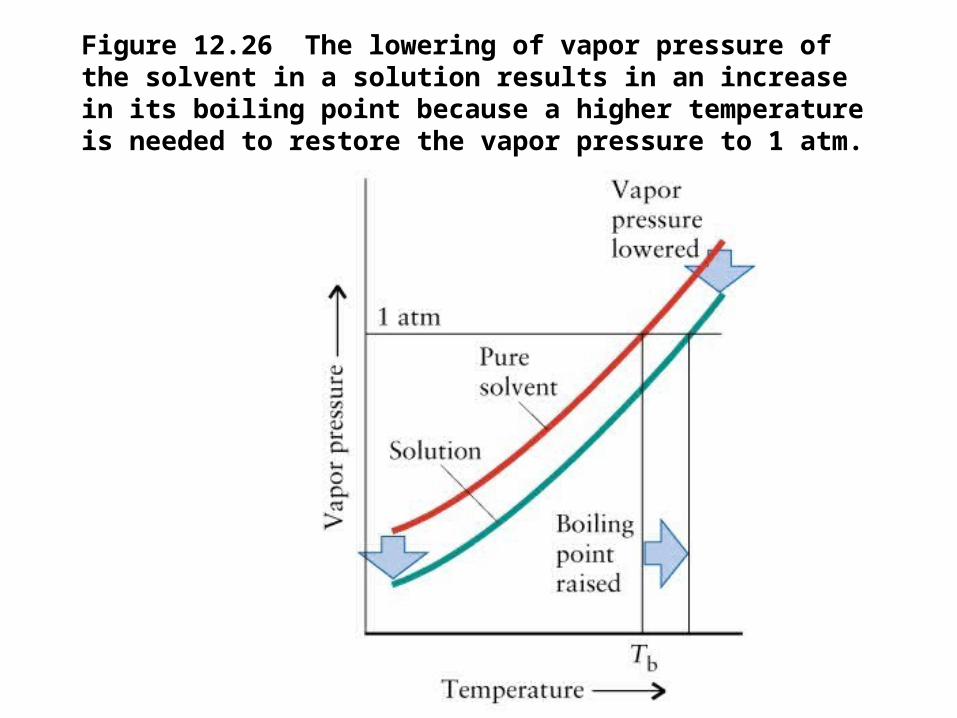
Figure 12.26 The lowering of vapor pressure of the solvent in a solution results in an increase in its boiling point because a higher temperature is needed to restore the vapor pressure to 1 atm.
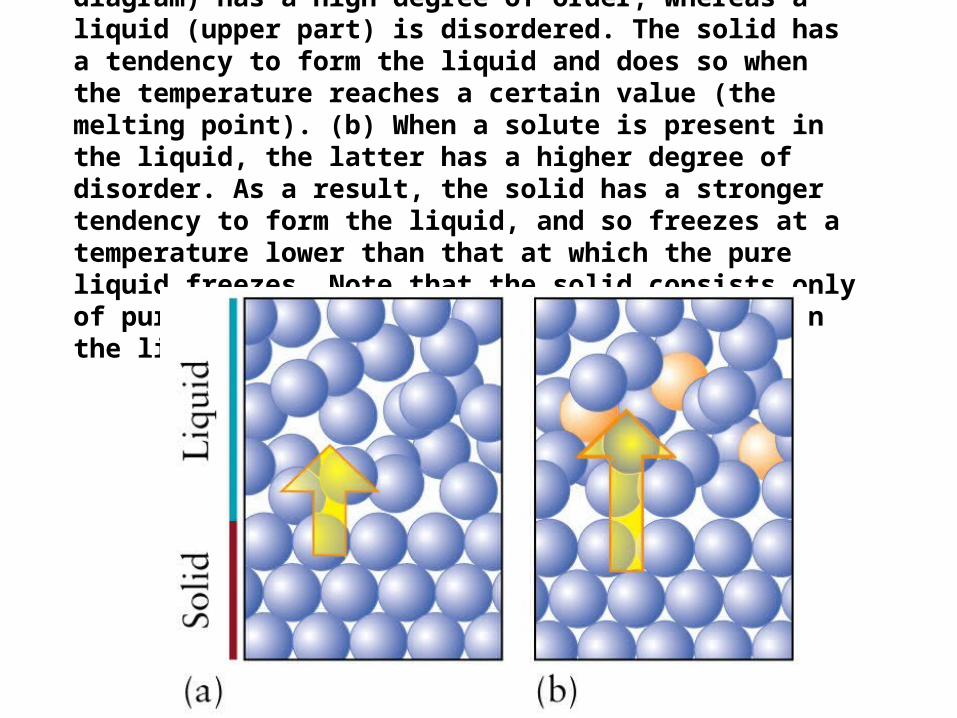
Figure 12.27 (a) A pure solid (lower part of diagram) has a high degree of order, whereas a liquid (upper part) is disordered. The solid has a tendency to form the liquid and does so when the temperature reaches a certain value (the melting point). (b) When a solute is present in the liquid, the latter has a higher degree of disorder. As a result, the solid has a stronger tendency to form the liquid, and so freezes at a temperature lower than that at which the pure liquid freezes. Note that the solid consists only of pure solvent, even if a solute is present in the liquid phase.
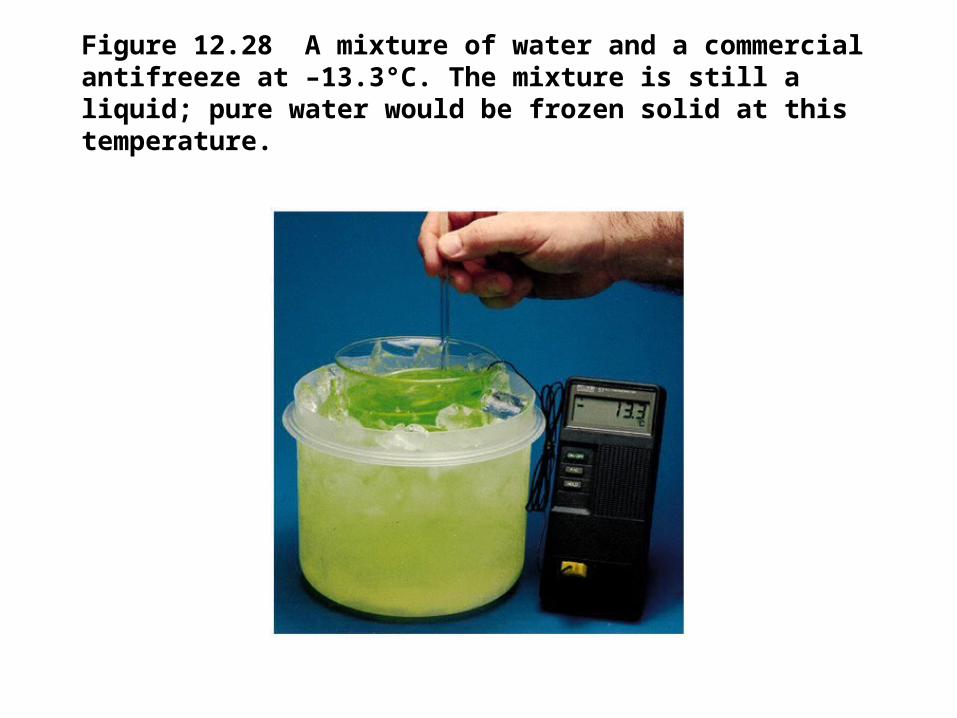
Figure 12.28 A mixture of water and a commercial antifreeze at –13.3°C. The mixture is still a liquid; pure water would be frozen solid at this temperature.

Figure 12.29 An experiment to illustrate osmosis. The tube contains a sucrose solution and the beaker contains pure water. The initial heights of the two liquids were the same. At the stage shown here, water has passed into the solution through the membrane by osmosis and its level has risen above that of the pure water. The large inset shows the solvent molecules (below the membrane) tending to join those in the solution (above the membrane) because there the disorder of the molecules is greater (on account of the presence of the solute molecules). The small inset shows just the solute molecules; the arrow shows the direction of flow of solvent molecules.
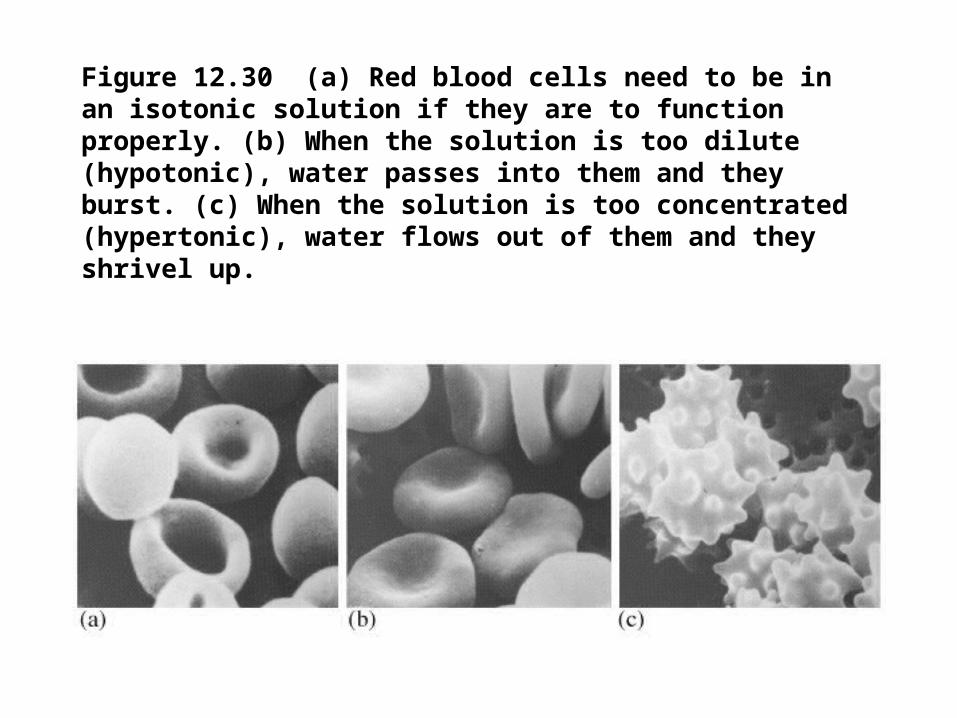
Figure 12.30 (a) Red blood cells need to be in an isotonic solution if they are to function properly. (b) When the solution is too dilute (hypotonic), water passes into them and they burst. (c) When the solution is too concentrated (hypertonic), water flows out of them and they shrivel up.
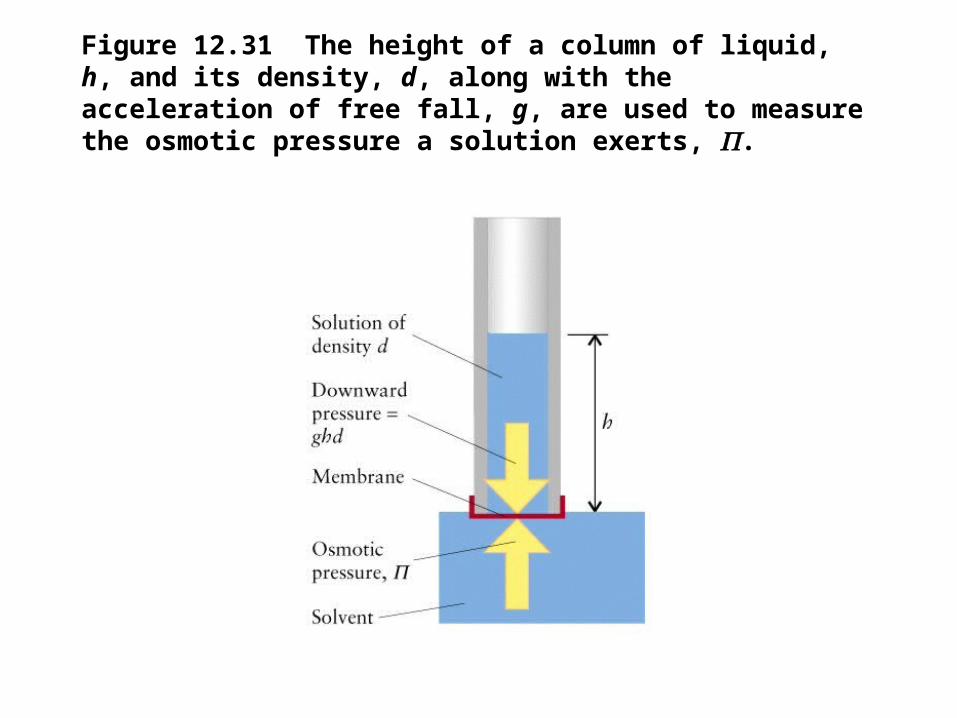
Figure 12.31 The height of a column of liquid, h, and its density, d, along with the acceleration of free fall, g, are used to measure the osmotic pressure a solution exerts, .
Assignment for Chapter 12