CHAPTER 12 STUDY OF TIDE OBSERVATION SYSTEM · 12.1.2 CHART DATUM AND TIDE TABLE OF YANGON PORT In...
132
CHAPTER 12 STUDY OF TIDE OBSERVATION SYSTEM
Transcript of CHAPTER 12 STUDY OF TIDE OBSERVATION SYSTEM · 12.1.2 CHART DATUM AND TIDE TABLE OF YANGON PORT In...
CHAPTER 12
STUDY OF TIDE OBSERVATION SYSTEM
The Urgent Project for Rehabilitation of Yangon Port and FINAL REPORT Main Inland Water Transport in the Republic of the Union of Myanmar MAIN REPORT
Nippon Koei/OCDI 12-1
CHAPTER 12 STUDY OF TIDE OBSERVATION SYSTEM
12.1 TIDE OBSERVATION SYSTEM
12.1.1 CURRENT SITUATION OF TIDAL OBSERVATION IN MYANMAR
It is said that the tidal range is about 2 to 4 m in the coastal areas of Myanmar and exceeds 6 m in Yangon Port. Since slopes of the riverbed in the delta area are extremely gentle, tidal fluctuation reaches far upstream. Therefore, the influence of tide reaches a wide range on the coastal area and along the rivers in Myanmar.
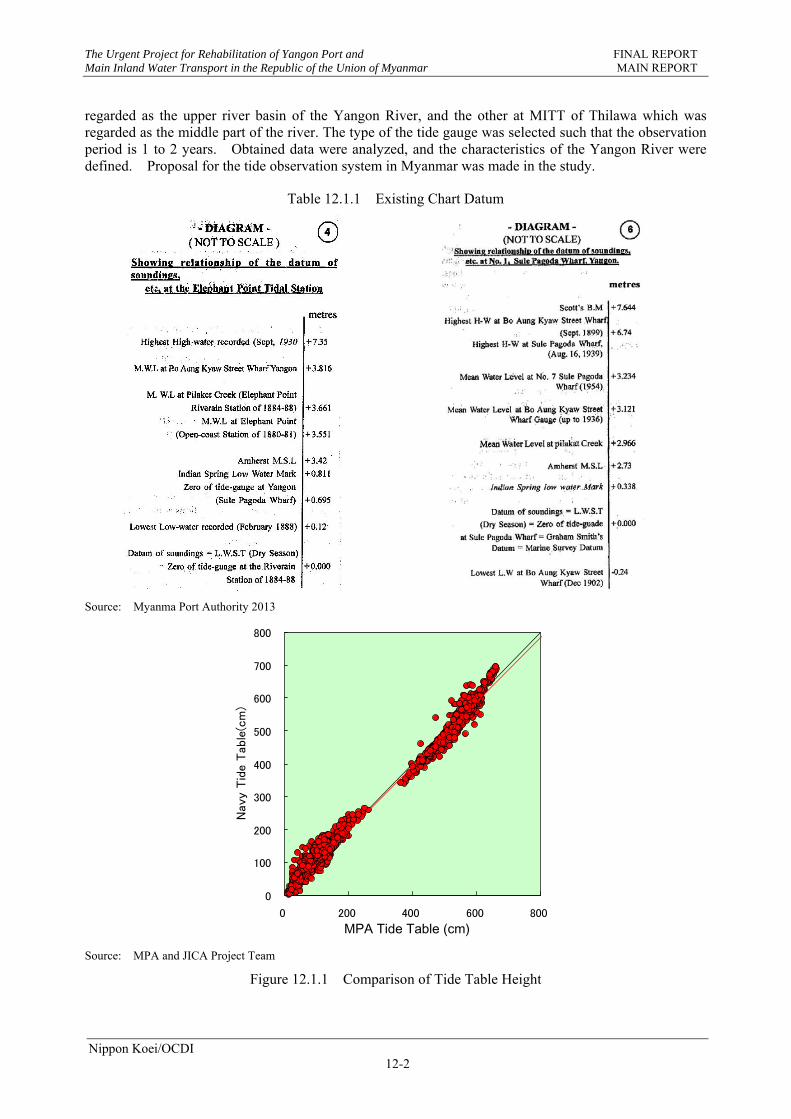
Tidal observation has been carried out in Yangon Port near the junction of the Yangon River and Bago River called Monkey Point, as shown in Figure 12.1.2. However, the observation is only conducted in diurnal period.
There are several ports scattered along the coastal area in Myanmar, but tidal observation has not been conducted. Though some ports for inland water transport have established the water gauge stations, these are not being operated.
12.1.2 CHART DATUM AND TIDE TABLE OF YANGON PORT
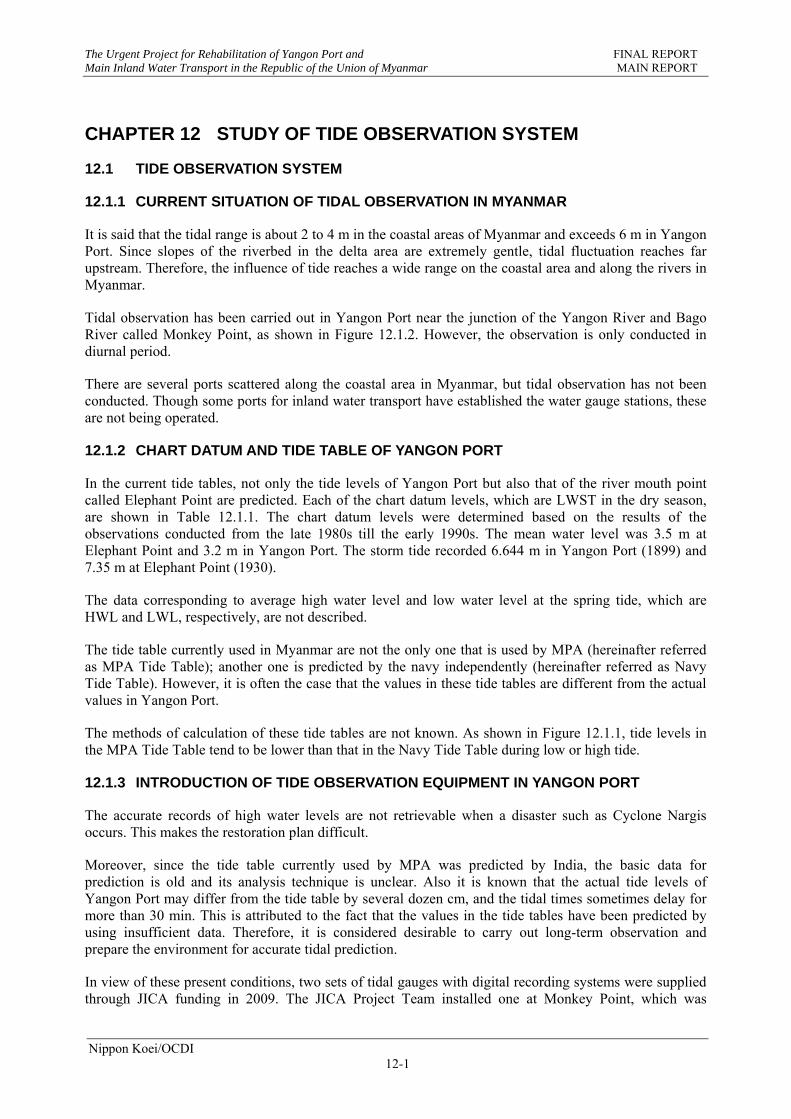
In the current tide tables, not only the tide levels of Yangon Port but also that of the river mouth point called Elephant Point are predicted. Each of the chart datum levels, which are LWST in the dry season, are shown in Table 12.1.1. The chart datum levels were determined based on the results of the observations conducted from the late 1980s till the early 1990s. The mean water level was 3.5 m at Elephant Point and 3.2 m in Yangon Port. The storm tide recorded 6.644 m in Yangon Port (1899) and 7.35 m at Elephant Point (1930).
The data corresponding to average high water level and low water level at the spring tide, which are HWL and LWL, respectively, are not described.
The tide table currently used in Myanmar are not the only one that is used by MPA (hereinafter referred as MPA Tide Table); another one is predicted by the navy independently (hereinafter referred as Navy Tide Table). However, it is often the case that the values in these tide tables are different from the actual values in Yangon Port.
The methods of calculation of these tide tables are not known. As shown in Figure 12.1.1, tide levels in the MPA Tide Table tend to be lower than that in the Navy Tide Table during low or high tide.
12.1.3 INTRODUCTION OF TIDE OBSERVATION EQUIPMENT IN YANGON PORT
The accurate records of high water levels are not retrievable when a disaster such as Cyclone Nargis occurs. This makes the restoration plan difficult.
Moreover, since the tide table currently used by MPA was predicted by India, the basic data for prediction is old and its analysis technique is unclear. Also it is known that the actual tide levels of Yangon Port may differ from the tide table by several dozen cm, and the tidal times sometimes delay for more than 30 min. This is attributed to the fact that the values in the tide tables have been predicted by using insufficient data. Therefore, it is considered desirable to carry out long-term observation and prepare the environment for accurate tidal prediction.
In view of these present conditions, two sets of tidal gauges with digital recording systems were supplied through JICA funding in 2009. The JICA Project Team installed one at Monkey Point, which was
The Urgent Project for Rehabilitation of Yangon Port and FINAL REPORT Main Inland Water Transport in the Republic of the Union of Myanmar MAIN REPORT
Nippon Koei/OCDI 12-2
regarded as the upper river basin of the Yangon River, and the other at MITT of Thilawa which was regarded as the middle part of the river. The type of the tide gauge was selected such that the observation period is 1 to 2 years. Obtained data were analyzed, and the characteristics of the Yangon River were defined. Proposal for the tide observation system in Myanmar was made in the study.
Table 12.1.1 Existing Chart Datum
Source: Myanma Port Authority 2013
Source: MPA and JICA Project Team
Figure 12.1.1 Comparison of Tide Table Height
0
100
200
300
400
500
600
700
800
0 200 400 600 800
Nav
y T
ide T
able
(cm
)
MPA Tide Table (cm)
The Urgent Project for Rehabilitation of Yangon Port and FINAL REPORT Main Inland Water Transport in the Republic of the Union of Myanmar MAIN REPORT
Nippon Koei/OCDI 12-3
Source: JICA Project Team
Figure 12.1.2 Location Map of Tidal Gauges Installed by the JICA Project Team
12.2 TIDAL OBSERVATION DATA ANALYSIS
12.2.1 FLOW OF ANALYSIS
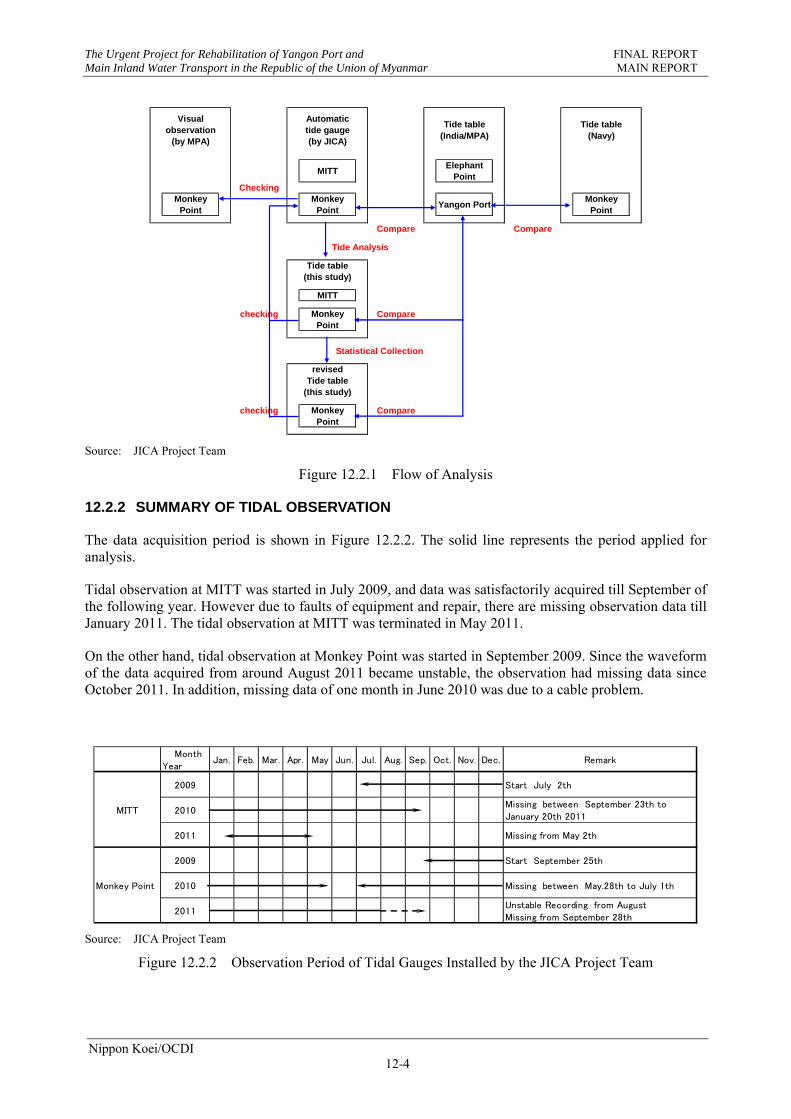
The flow of analysis using the observation data of tide levels obtained at Monkey Point and MITT is shown in Figure 12.2.1. First, the characteristics and accuracy of the MPA and Navy Tide tables were checked by comparing with the observation data. Second, the tide levels during the observation periods were predicted with the harmonic analysis of observation data, and then the accuracy of predicted tide levels were checked with the observation data. In the course of analysis, the errors considered as influence of the river were discovered. The errors were collected, and the accuracy of collected prediction of tide levels were checked with the observed data.
MITT
Monkey Point
The Urgent Project for Rehabilitation of Yangon Port and FINAL REPORT Main Inland Water Transport in the Republic of the Union of Myanmar MAIN REPORT
Nippon Koei/OCDI 12-4
Source: JICA Project Team
Figure 12.2.1 Flow of Analysis
12.2.2 SUMMARY OF TIDAL OBSERVATION
The data acquisition period is shown in Figure 12.2.2. The solid line represents the period applied for analysis.
Tidal observation at MITT was started in July 2009, and data was satisfactorily acquired till September of the following year. However due to faults of equipment and repair, there are missing observation data till January 2011. The tidal observation at MITT was terminated in May 2011.
On the other hand, tidal observation at Monkey Point was started in September 2009. Since the waveform of the data acquired from around August 2011 became unstable, the observation had missing data since October 2011. In addition, missing data of one month in June 2010 was due to a cable problem.
Source: JICA Project Team
Figure 12.2.2 Observation Period of Tidal Gauges Installed by the JICA Project Team
Visualobservation
(by MPA)
Automatictide gauge(by JICA)
Tide table(India/MPA)
Tide table(Navy)
MITTElephant
PointChecking
MonkeyPoint
MonkeyPoint
Yangon PortMonkey
Point
Compare Compare
Tide Analysis
Tide table(this study)
MITT
checking MonkeyPoint
Compare
Statistical Collection
revisedTide table
(this study)
checking MonkeyPoint
Compare
MonthYear
Jan. Feb. Mar. Apr. May Jun. Jul. Aug. Sep. Oct. Nov. Dec. Remark
2009 Start July 2th
MITT 2010Missing between September 23th toJanuary 20th 2011
2011 Missing from May 2th
2009 Start September 25th
Monkey Point 2010 Missing between May.28th to July 1th
2011Unstable Recording from AugustMissing from September 28th
The Urgent Project for Rehabilitation of Yangon Port and FINAL REPORT Main Inland Water Transport in the Republic of the Union of Myanmar MAIN REPORT
Nippon Koei/OCDI 12-5
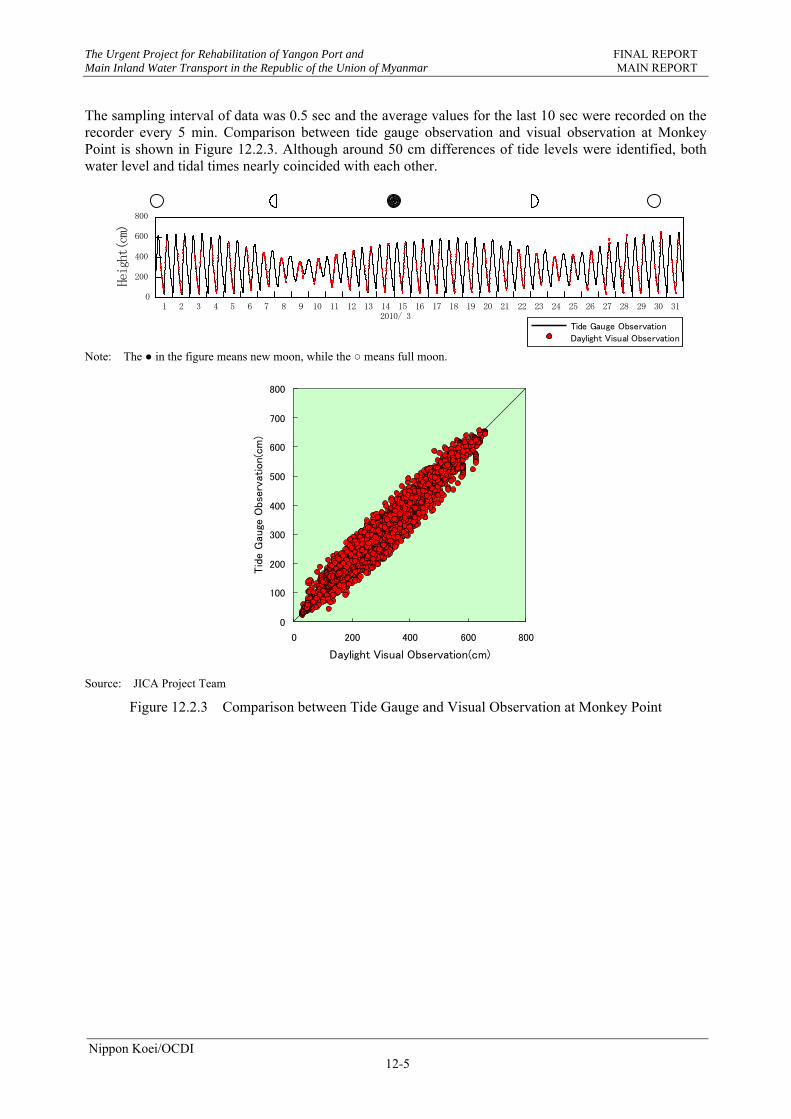
The sampling interval of data was 0.5 sec and the average values for the last 10 sec were recorded on the recorder every 5 min. Comparison between tide gauge observation and visual observation at Monkey Point is shown in Figure 12.2.3. Although around 50 cm differences of tide levels were identified, both water level and tidal times nearly coincided with each other.
Note: The ● in the figure means new moon, while the ○ means full moon.
Source: JICA Project Team
Figure 12.2.3 Comparison between Tide Gauge and Visual Observation at Monkey Point
1 2 3 4 5 6 7 8 9 10 11 12 13 142010/ 3
15 16 17 18 19 20 21 22 23 24 25 26 27 28 29 30 310
200
400
600
800
Height(cm)
Tide Gauge Observation
Daylight Visual Observation
0
100
200
300
400
500
600
700
800
0 200 400 600 800
Daylight Visual Observation(cm)
Tid
e G
auge
Obs
erv
ation(c
m)
The Urgent Project for Rehabilitation of Yangon Port and FINAL REPORT
Main Inland Water Transport in the Republic of the Union of Myanmar MAIN REPORT
Nippon Koei/OCDI
12-6
Source: JICA Project Team
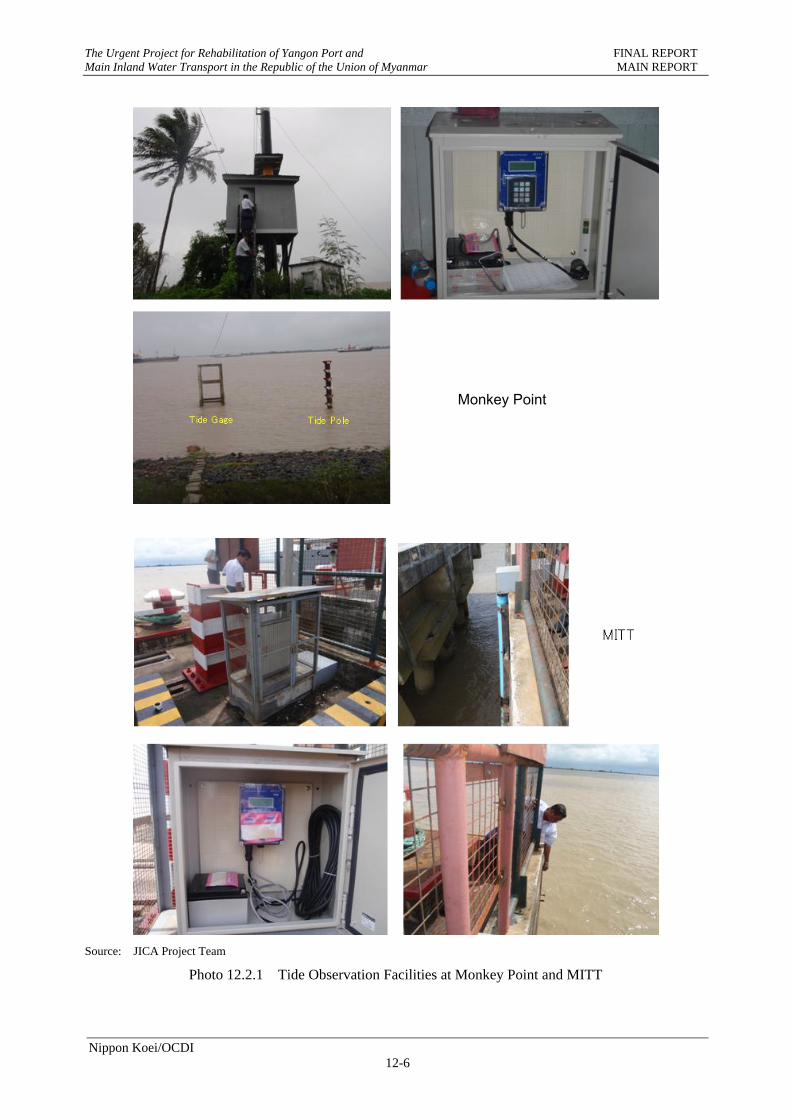
Photo 12.2.1 Tide Observation Facilities at Monkey Point and MITT
Monkey Point
The Urgent Project for Rehabilitation of Yangon Port and FINAL REPORT Main Inland Water Transport in the Republic of the Union of Myanmar MAIN REPORT
Nippon Koei/OCDI 12-7
12.2.3 CHARACTERISTICS OF TIDE LEVELS
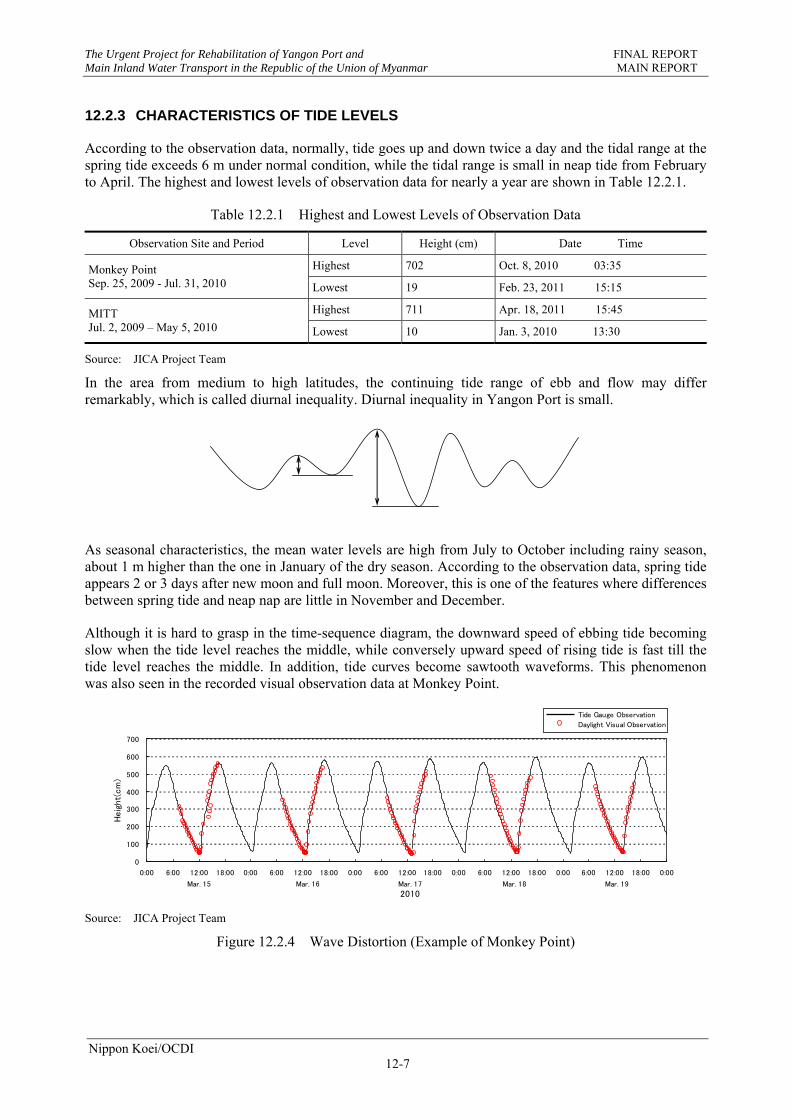
According to the observation data, normally, tide goes up and down twice a day and the tidal range at the spring tide exceeds 6 m under normal condition, while the tidal range is small in neap tide from February to April. The highest and lowest levels of observation data for nearly a year are shown in Table 12.2.1.
Table 12.2.1 Highest and Lowest Levels of Observation Data
Observation Site and Period Level Height (cm) Date Time
Monkey Point Sep. 25, 2009 - Jul. 31, 2010
Highest 702 Oct. 8, 2010 03:35
Lowest 19 Feb. 23, 2011 15:15
MITT Jul. 2, 2009 – May 5, 2010
Highest 711 Apr. 18, 2011 15:45
Lowest 10 Jan. 3, 2010 13:30
Source: JICA Project Team
In the area from medium to high latitudes, the continuing tide range of ebb and flow may differ remarkably, which is called diurnal inequality. Diurnal inequality in Yangon Port is small.
As seasonal characteristics, the mean water levels are high from July to October including rainy season, about 1 m higher than the one in January of the dry season. According to the observation data, spring tide appears 2 or 3 days after new moon and full moon. Moreover, this is one of the features where differences between spring tide and neap nap are little in November and December.
Although it is hard to grasp in the time-sequence diagram, the downward speed of ebbing tide becoming slow when the tide level reaches the middle, while conversely upward speed of rising tide is fast till the tide level reaches the middle. In addition, tide curves become sawtooth waveforms. This phenomenon was also seen in the recorded visual observation data at Monkey Point.
Source: JICA Project Team
Figure 12.2.4 Wave Distortion (Example of Monkey Point)
0
100
200
300
400
500
600
700
0:00 6:00 12:00 18:00 0:00 6:00 12:00 18:00 0:00 6:00 12:00 18:00 0:00 6:00 12:00 18:00 0:00 6:00 12:00 18:00 0:00
Mar. 15 Mar. 16 Mar. 17 Mar. 18 Mar. 19
Heig
ht(
cm
)
2010
Tide Gauge Observation
Daylight Visual Observation
The Urgent Project for Rehabilitation of Yangon Port and FINAL REPORT Main Inland Water Transport in the Republic of the Union of Myanmar MAIN REPORT
Nippon Koei/OCDI 12-8
12.2.4 COMPARISON WITH THE CURRENT TIDE TABLES
As discussed previously, there are two tide tables used in Myanmar, one has been purchased from India and the other has been published by the Navy. Here, the characteristics and the accuracy of these tide tables were determined by comparing each of these tide tables in Yangon Port with the observation data.
(1) Difference of Tide Level
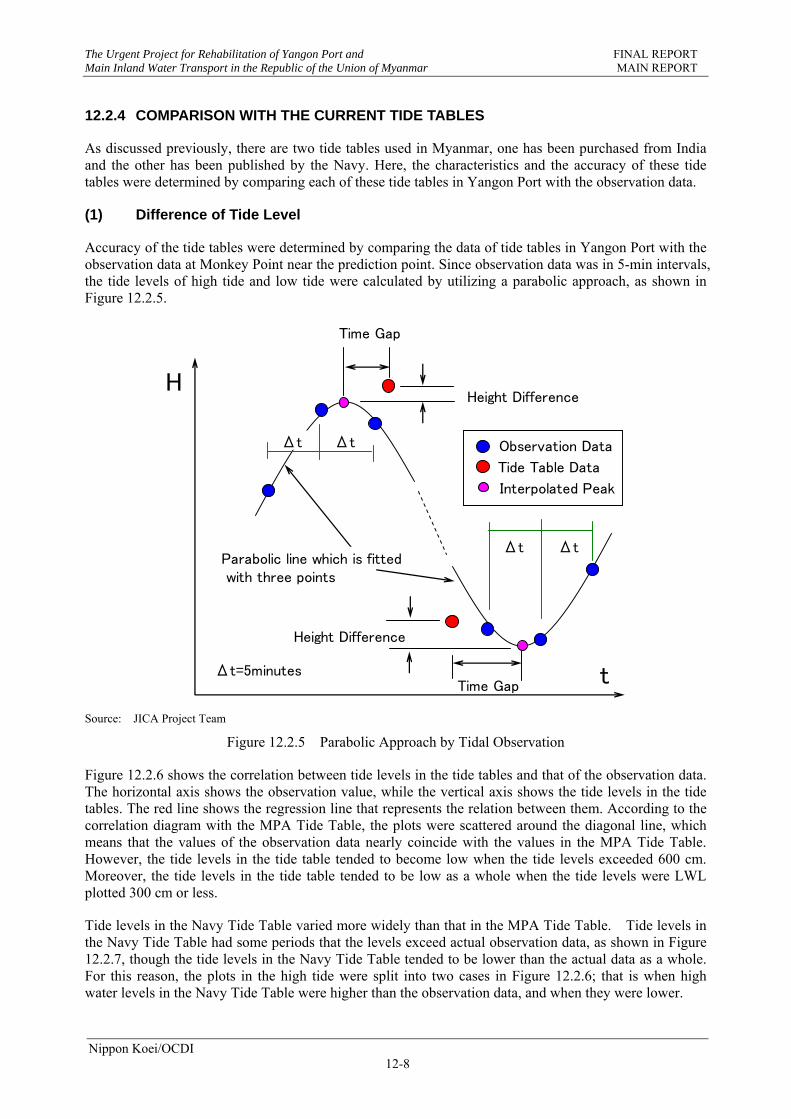
Accuracy of the tide tables were determined by comparing the data of tide tables in Yangon Port with the observation data at Monkey Point near the prediction point. Since observation data was in 5-min intervals, the tide levels of high tide and low tide were calculated by utilizing a parabolic approach, as shown in Figure 12.2.5.
Source: JICA Project Team
Figure 12.2.5 Parabolic Approach by Tidal Observation
Figure 12.2.6 shows the correlation between tide levels in the tide tables and that of the observation data. The horizontal axis shows the observation value, while the vertical axis shows the tide levels in the tide tables. The red line shows the regression line that represents the relation between them. According to the correlation diagram with the MPA Tide Table, the plots were scattered around the diagonal line, which means that the values of the observation data nearly coincide with the values in the MPA Tide Table. However, the tide levels in the tide table tended to become low when the tide levels exceeded 600 cm. Moreover, the tide levels in the tide table tended to be low as a whole when the tide levels were LWL plotted 300 cm or less.
Tide levels in the Navy Tide Table varied more widely than that in the MPA Tide Table. Tide levels in the Navy Tide Table had some periods that the levels exceed actual observation data, as shown in Figure 12.2.7, though the tide levels in the Navy Tide Table tended to be lower than the actual data as a whole. For this reason, the plots in the high tide were split into two cases in Figure 12.2.6; that is when high water levels in the Navy Tide Table were higher than the observation data, and when they were lower.
t
Time Gap
Time Gap
HHeight Difference
Δt=5minutes
Observation Data
Tide Table Data
Parabolic line which is fitted with three points
Δt Δt
ΔtΔt
Height Difference
Interpolated Peak
The Urgent Project for Rehabilitation of Yangon Port and FINAL REPORT Main Inland Water Transport in the Republic of the Union of Myanmar MAIN REPORT
Nippon Koei/OCDI 12-9
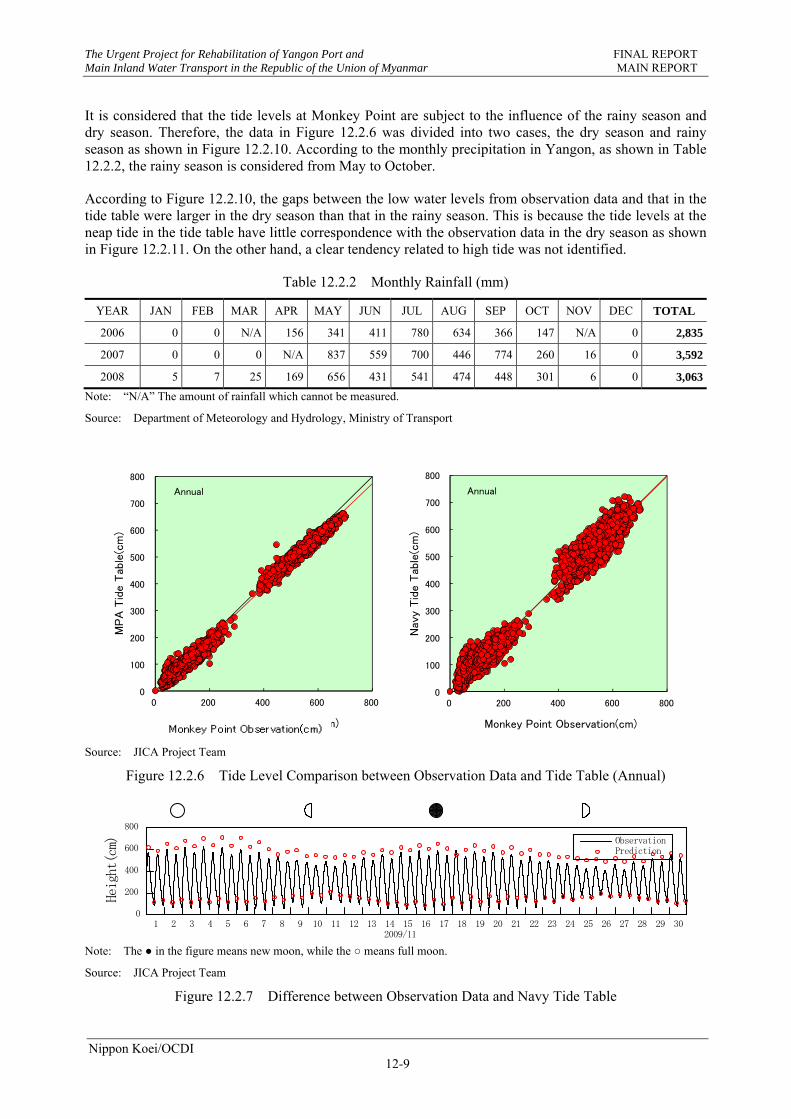
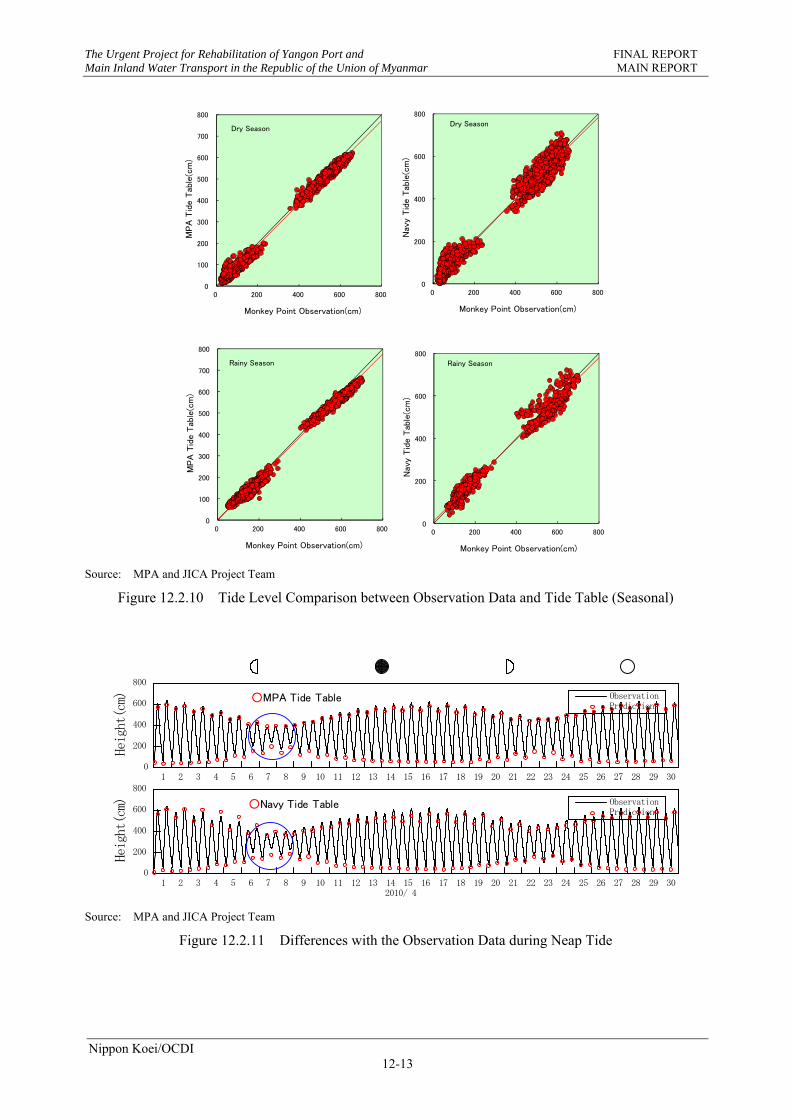
It is considered that the tide levels at Monkey Point are subject to the influence of the rainy season and dry season. Therefore, the data in Figure 12.2.6 was divided into two cases, the dry season and rainy season as shown in Figure 12.2.10. According to the monthly precipitation in Yangon, as shown in Table 12.2.2, the rainy season is considered from May to October.
According to Figure 12.2.10, the gaps between the low water levels from observation data and that in the tide table were larger in the dry season than that in the rainy season. This is because the tide levels at the neap tide in the tide table have little correspondence with the observation data in the dry season as shown in Figure 12.2.11. On the other hand, a clear tendency related to high tide was not identified.
Table 12.2.2 Monthly Rainfall (mm)
YEAR JAN FEB MAR APR MAY JUN JUL AUG SEP OCT NOV DEC TOTAL
2006 0 0 N/A 156 341 411 780 634 366 147 N/A 0 2,835
2007 0 0 0 N/A 837 559 700 446 774 260 16 0 3,592
2008 5 7 25 169 656 431 541 474 448 301 6 0 3,063
Note: “N/A” The amount of rainfall which cannot be measured.
Source: Department of Meteorology and Hydrology, Ministry of Transport
Source: JICA Project Team
Figure 12.2.6 Tide Level Comparison between Observation Data and Tide Table (Annual)
Note: The ● in the figure means new moon, while the ○ means full moon.
Source: JICA Project Team
Figure 12.2.7 Difference between Observation Data and Navy Tide Table
0
100
200
300
400
500
600
700
800
0 200 400 600 800
MP
A T
ide T
able
(cm
)
Monke Point Observation(cm)
Annual
0
100
200
300
400
500
600
700
800
0 200 400 600 800
Nav
y Tid
e T
able
(cm
)
Monkey Point Observation(cm)
Annual
1 2 3 4 5 6 7 8 9 10 11 12 13 142009/11
15 16 17 18 19 20 21 22 23 24 25 26 27 28 29 300
200
400
600
800
Height(cm) Observation
Prediction
The Urgent Project for Rehabilitation of Yangon Port and FINAL REPORT Main Inland Water Transport in the Republic of the Union of Myanmar MAIN REPORT
Nippon Koei/OCDI 12-10
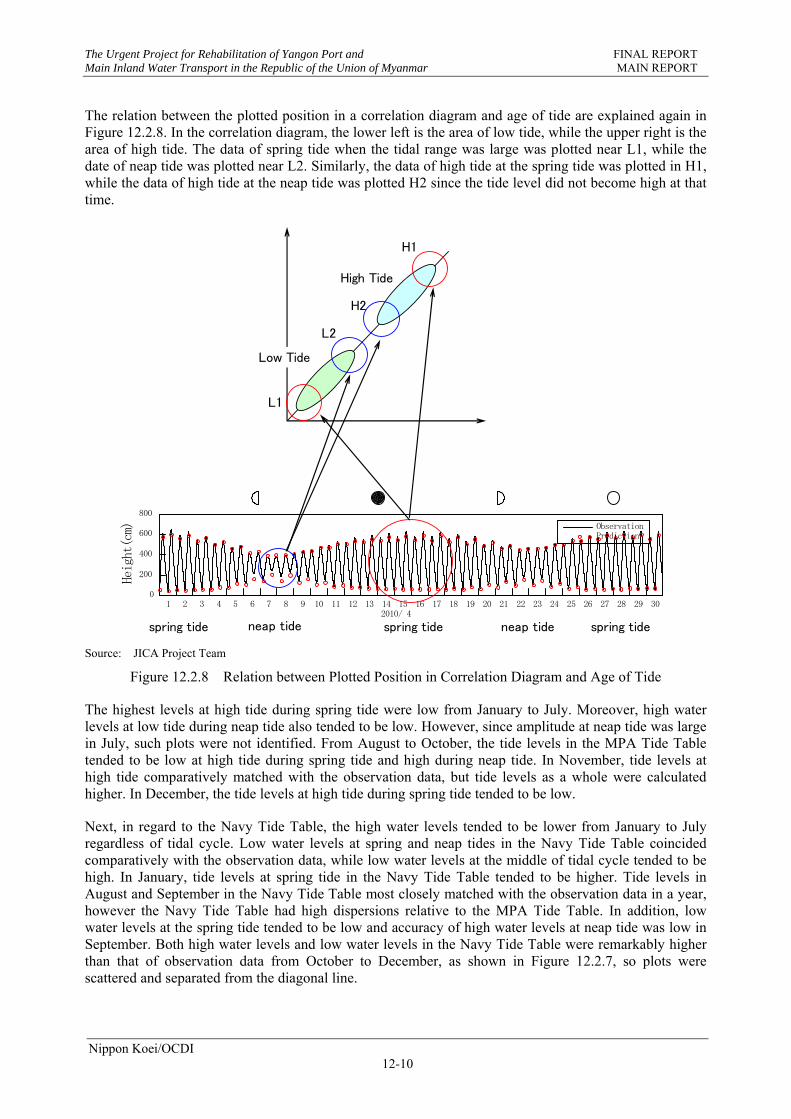
The relation between the plotted position in a correlation diagram and age of tide are explained again in Figure 12.2.8. In the correlation diagram, the lower left is the area of low tide, while the upper right is the area of high tide. The data of spring tide when the tidal range was large was plotted near L1, while the date of neap tide was plotted near L2. Similarly, the data of high tide at the spring tide was plotted in H1, while the data of high tide at the neap tide was plotted H2 since the tide level did not become high at that time.
Source: JICA Project Team
Figure 12.2.8 Relation between Plotted Position in Correlation Diagram and Age of Tide
The highest levels at high tide during spring tide were low from January to July. Moreover, high water levels at low tide during neap tide also tended to be low. However, since amplitude at neap tide was large in July, such plots were not identified. From August to October, the tide levels in the MPA Tide Table tended to be low at high tide during spring tide and high during neap tide. In November, tide levels at high tide comparatively matched with the observation data, but tide levels as a whole were calculated higher. In December, the tide levels at high tide during spring tide tended to be low.
Next, in regard to the Navy Tide Table, the high water levels tended to be lower from January to July regardless of tidal cycle. Low water levels at spring and neap tides in the Navy Tide Table coincided comparatively with the observation data, while low water levels at the middle of tidal cycle tended to be high. In January, tide levels at spring tide in the Navy Tide Table tended to be higher. Tide levels in August and September in the Navy Tide Table most closely matched with the observation data in a year, however the Navy Tide Table had high dispersions relative to the MPA Tide Table. In addition, low water levels at the spring tide tended to be low and accuracy of high water levels at neap tide was low in September. Both high water levels and low water levels in the Navy Tide Table were remarkably higher than that of observation data from October to December, as shown in Figure 12.2.7, so plots were scattered and separated from the diagonal line.
1 2 3 4 5 6 7 8 9 10 11 12 13 142010/ 4
15 16 17 18 19 20 21 22 23 24 25 26 27 28 29 300
200
400
600
800
Height(cm) Observation
Prediction
neap tide spring tide neap tide spring tidespring tide
High Tide
Low Tide
L1
L2
H2
H1
The Urgent Project for Rehabilitation of Yangon Port and FINAL REPORT Main Inland Water Transport in the Republic of the Union of Myanmar MAIN REPORT
Nippon Koei/OCDI 12-11
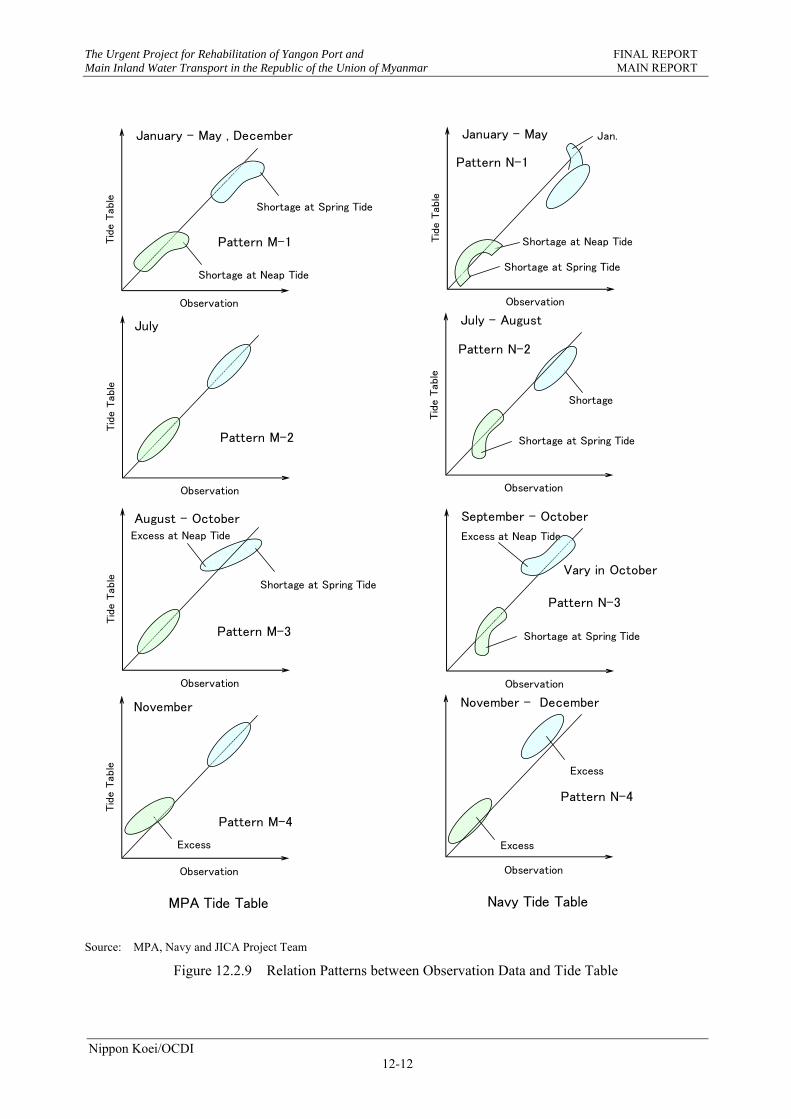
By organizing the above condition, there is a relation, which is illustrated in Figure 12.2.9
The left side figures show the patterns regarding the MPA Tide Table, while the right side figures show the patterns regarding the Navy Tide Table. The relevant month is written in the upper left side of each figure.
In regard to the MPA Tide Table, Pattern M-1 describes that both high water levels and low water levels at spring tide tend to be low, while Pattern M-2 describes that levels of two cases matched comparatively. Pattern M-3 has unique tendency that tide levels in the MPA Tide Table are lower at spring tide than that of the observation data and higher at neap tide. Pattern M-4 describes that most of low water levels in the MPA Tide Table were higher than that of the observation data.
In regard to the Navy Tide Table, Pattern N-1 describes that high water levels are constantly low and low water levels are not stable. Pattern N-2 describes that low water levels at spring tide are low, that is also common in Pattern N-3. However, Pattern N-3 also has tendency to show that tide levels of high tide at neap tide in the Tide Table tend to be high. On the other hand, Pattern N-4 that has similar tendency with Pattern M-3, has tendency that low water levels in the Navy Tide Table are constantly higher than that of the observation data and also shares similar feature with Patter M-4.
While amplitudes of tide become fairly small at neap tide, the tide levels in tide tables do not match the observation data. Since the amplitude did not become small at neap tide in Patterns M-2 and M-3, the gap with the observation data was still small. It was thought that the reason why the tide levels would not match at spring tide or neap tide is because amplitudes of harmonic constants used for prediction was small. Moreover, the reason why both low water levels and high water levels were constantly high was because it did not correspond to variation of mean water level at the point.
The Urgent Project for Rehabilitation of Yangon Port and FINAL REPORT Main Inland Water Transport in the Republic of the Union of Myanmar MAIN REPORT
Nippon Koei/OCDI 12-12
Source: MPA, Navy and JICA Project Team
Figure 12.2.9 Relation Patterns between Observation Data and Tide Table
Observation
Tid
e T
able
Shortage at Neap Tide
January - May , December
Observation
Tid
e T
able
July
Shortage at Spring Tide
Observation
Tid
e T
able
August - October
Shortage at Spring Tide
Excess at Neap Tide
Observation
Tid
e T
able
November
Excess
MPA Tide Table
Observation
Tid
e T
able
Shortage at Neap Tide
January - May
Shortage
Shortage at Spring Tide
Pattern M-1
Pattern M-3
Pattern M-4
Pattern M-2
Pattern N-1
Observation
Tid
e T
able
July - August
Pattern N-2
Observation
September - October
Excess at Neap Tide
Pattern N-3
Shortage at Spring Tide
Shortage at Spring Tide
Observation
November - December
Pattern N-4
Navy Tide Table
Excess
Vary in October
Excess
Jan.
The Urgent Project for Rehabilitation of Yangon Port and FINAL REPORT Main Inland Water Transport in the Republic of the Union of Myanmar MAIN REPORT
Nippon Koei/OCDI 12-13
Source: MPA and JICA Project Team
Figure 12.2.10 Tide Level Comparison between Observation Data and Tide Table (Seasonal)
Source: MPA and JICA Project Team
Figure 12.2.11 Differences with the Observation Data during Neap Tide
0
200
400
600
800
0 200 400 600 800
Nav
y Tid
e T
able
(cm
)
Monkey Point Observation(cm)
Rainy Season
0
100
200
300
400
500
600
700
800
0 200 400 600 800
MP
A T
ide T
able
(cm
)
Monkey Point Observation(cm)
Dry Season
0
200
400
600
800
0 200 400 600 800
Nav
y Tid
e T
able
(cm
)
Monkey Point Observation(cm)
Dry Season
0
100
200
300
400
500
600
700
800
0 200 400 600 800
MP
A T
ide T
able
(cm
)
Monkey Point Observation(cm)
Rainy Season
1 2 3 4 5 6 7 8 9 10 11 12 13 142010/ 4
15 16 17 18 19 20 21 22 23 24 25 26 27 28 29 300
200
400
600
800
Height(cm) Observation
Prediction
1 2 3 4 5 6 7 8 9 10 11 12 13 142010/ 4
15 16 17 18 19 20 21 22 23 24 25 26 27 28 29 300
200
400
600
800
Height(cm) Observation
Prediction
○MPA Tide Table
○Navy Tide Table
The Urgent Project for Rehabilitation of Yangon Port and FINAL REPORT Main Inland Water Transport in the Republic of the Union of Myanmar MAIN REPORT
Nippon Koei/OCDI 12-14
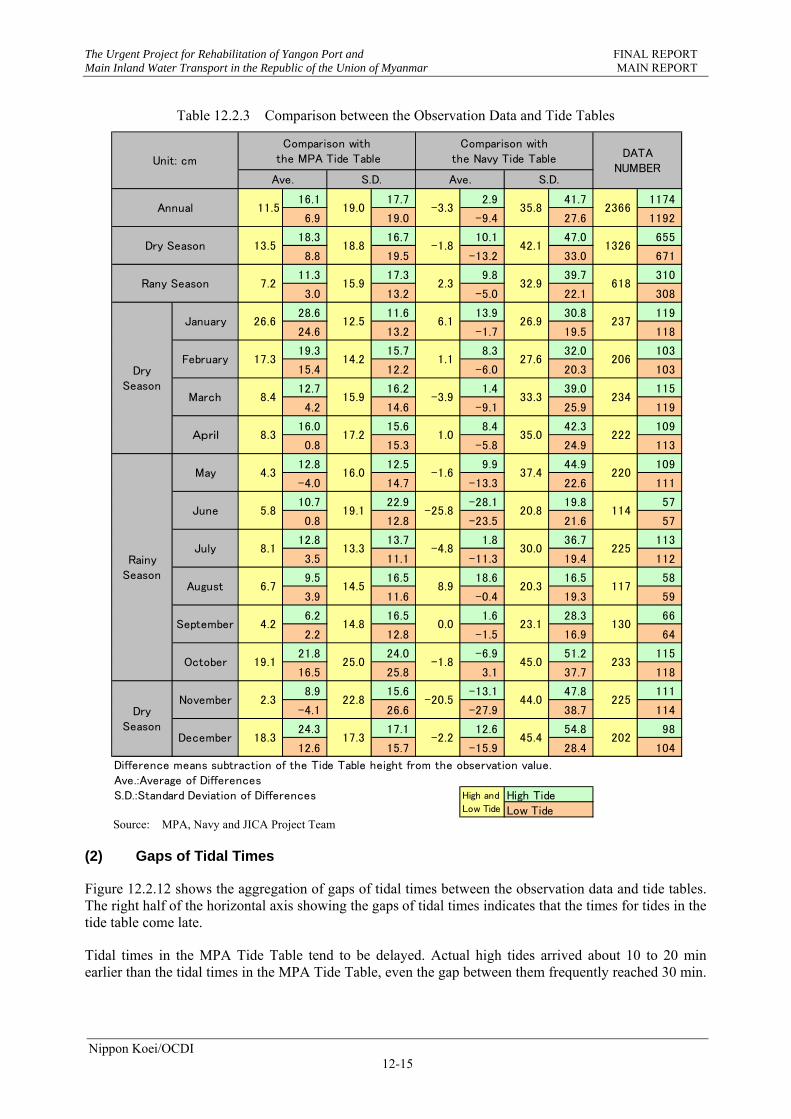
The average of differences and standard deviation of differences between the observation data and the data in tide tables are shown in Table 12.2.3. The value in yellow box includes statistical value of both low tide and high tide, while statistical value of high tide and that of low tide are shown in green box and orange box, respectively.
Even if each value of differences is large, the average of differences might be small since plus and minus value can cancel each other out. Therefore, evaluation was focused on the standard deviation of differences that indicate the degree of variation.
First, in regard to the MPA Tide Table, the standard deviation of dry season was larger than that of rainy season. On the other hand, the monthly standard deviation in the dry season was smaller than that in the rainy season as a whole. The reason why the standard deviation of the dry season was larger than that of the rainy season is that the standard deviation was large in November and December which was the beginning of the dry season, while the rainy season was considered from May to October. As with the comparison between low tide and high tide, the standard deviation of low tide is larger than that of high tide on the average, while smaller in rainy season. In the dry season when water levels are low, it might have a certain effects when tide levels become low.
In regard to the comparison between the Navy Tide Table and the MPA Tide Table, the standard deviation of differences of the Navy Tide Table was more than double of that of MPA Tide Table. Especially, the gaps were large in the dry season. On the other hand, the Navy Tide Table has similar seasonal trends with the MPA Tide Table, for example, the standard deviation of differences was larger in the dry season than in the rainy season and was large from October to December. The different point from the MPA Tide Table was that the values around August were small. A possible reason was that the harmonic constants used for the prediction were based on the data of the same season. Furthermore, since there were comparatively many differences from the observation data except around August, it was assumed that the data was obtained from short-term observation.
The Urgent Project for Rehabilitation of Yangon Port and FINAL REPORT Main Inland Water Transport in the Republic of the Union of Myanmar MAIN REPORT
Nippon Koei/OCDI 12-15
Table 12.2.3 Comparison between the Observation Data and Tide Tables
Source: MPA, Navy and JICA Project Team
(2) Gaps of Tidal Times
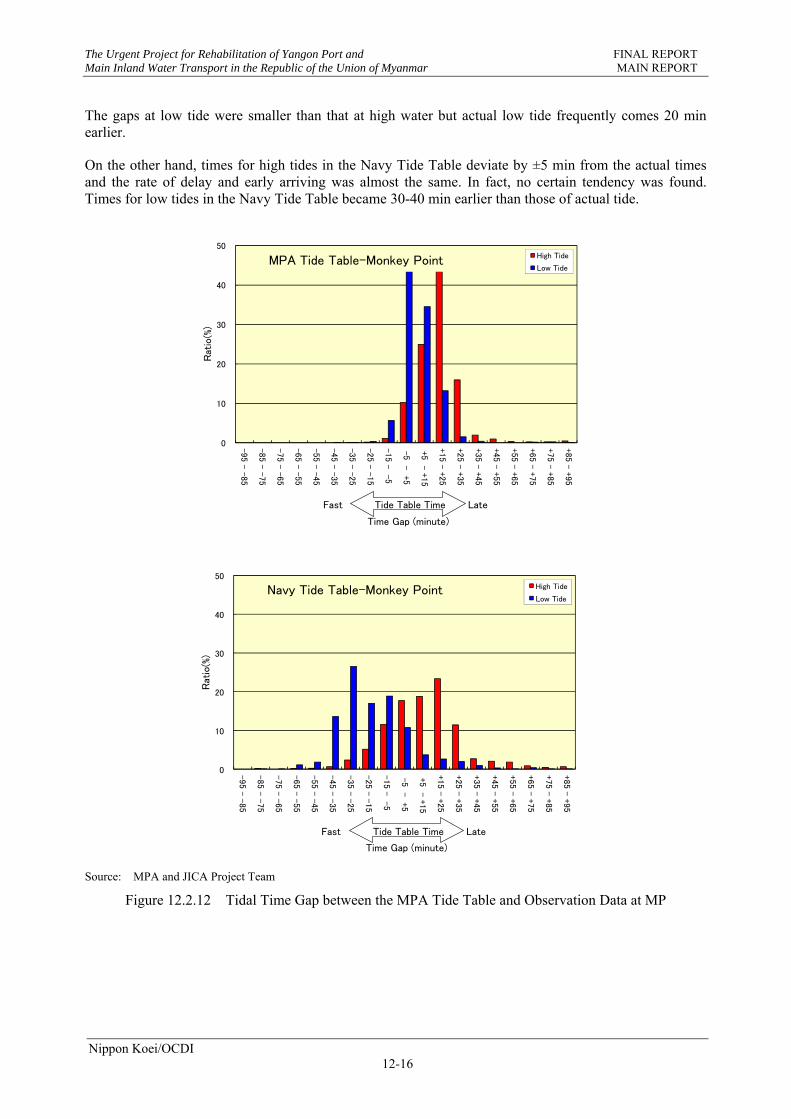
Figure 12.2.12 shows the aggregation of gaps of tidal times between the observation data and tide tables. The right half of the horizontal axis showing the gaps of tidal times indicates that the times for tides in the tide table come late.
Tidal times in the MPA Tide Table tend to be delayed. Actual high tides arrived about 10 to 20 min earlier than the tidal times in the MPA Tide Table, even the gap between them frequently reached 30 min.
16.1 17.7 2.9 41.7 1174
6.9 19.0 -9.4 27.6 1192
18.3 16.7 10.1 47.0 655
8.8 19.5 -13.2 33.0 671
11.3 17.3 9.8 39.7 310
3.0 13.2 -5.0 22.1 308
28.6 11.6 13.9 30.8 119
24.6 13.2 -1.7 19.5 118
19.3 15.7 8.3 32.0 103
15.4 12.2 -6.0 20.3 103
12.7 16.2 1.4 39.0 115
4.2 14.6 -9.1 25.9 119
16.0 15.6 8.4 42.3 109
0.8 15.3 -5.8 24.9 113
12.8 12.5 9.9 44.9 109
-4.0 14.7 -13.3 22.6 111
10.7 22.9 -28.1 19.8 57
0.8 12.8 -23.5 21.6 57
12.8 13.7 1.8 36.7 113
3.5 11.1 -11.3 19.4 112
9.5 16.5 18.6 16.5 58
3.9 11.6 -0.4 19.3 59
6.2 16.5 1.6 28.3 66
2.2 12.8 -1.5 16.9 64
21.8 24.0 -6.9 51.2 115
16.5 25.8 3.1 37.7 118
8.9 15.6 -13.1 47.8 111
-4.1 26.6 -27.9 38.7 114
24.3 17.1 12.6 54.8 98
12.6 15.7 -15.9 28.4 104
Difference means subtraction of the Tide Table height from the observation value.Ave.:Average of Differences S.D.:Standard Deviation of Differences High Tide
Low Tide
DrySeason
2.3
18.3
22.8
17.3
November
December
45.0October
202
-20.5
-2.2
44.0
45.4
225
1.0
-1.6
-25.8
225
117
130
-1.8
26.9
27.6
33.3
35.0
37.4
20.8
237
206
234
222
220
114
233
September
August
DrySeason
January
February
March
April
RainySeason
May
June
July
26.6
17.3
8.4
618
Dry Season 13.5 18.8 -1.8 1326
8.3
4.3
5.8
8.1 -4.8
12.5
14.2
15.9
17.2
16.0
19.1
30.0
6.1
1.1
DATANUMBER
11.5 -3.3 35.8 2366
High and
Low Tide
42.1
15.9 2.3 32.9
Ave. S.D.
13.3
14.5
14.8
6.7
4.2
8.9
0.0
19.1
20.3
23.1
25.0
-3.9
Rany Season 7.2
S.D.
Unit: cm
Annual 19.0
Comparison with the MPA Tide Table
Comparison with the Navy Tide Table
Ave.
The Urgent Project for Rehabilitation of Yangon Port and FINAL REPORT Main Inland Water Transport in the Republic of the Union of Myanmar MAIN REPORT
Nippon Koei/OCDI 12-16
The gaps at low tide were smaller than that at high water but actual low tide frequently comes 20 min earlier.
On the other hand, times for high tides in the Navy Tide Table deviate by ±5 min from the actual times and the rate of delay and early arriving was almost the same. In fact, no certain tendency was found. Times for low tides in the Navy Tide Table became 30-40 min earlier than those of actual tide.
Source: MPA and JICA Project Team
Figure 12.2.12 Tidal Time Gap between the MPA Tide Table and Observation Data at MP
0
10
20
30
40
50
-95 -
-85
-85 -
-75
-75 -
-65
-65 -
-55
-55 -
-45
-45 -
-35
-35 -
-25
-25 -
-15
-15 -
-5
-5 -
+5
+5 -
+15
+15 -
+25
+25 -
+35
+35 -
+45
+45 -
+55
+55 -
+65
+65 -
+75
+75 -
+85
+85 -
+95
Rat
io(%
)
Time Gap (minute)
Comparison between MPA Tide Table and Monkey Point Obserbation Data High Tide
Low Tide
Fast Tide Table Time Late
0
10
20
30
40
50
-95 - -
85
-85 - -
75
-75 - -
65
-65 - -
55
-55 - -
45
-45 - -
35
-35 - -
25
-25 - -
15
-15 - -
5
-5 -
+5
+5 -
+15
+15 - +
25
+25 - +
35
+35 - +
45
+45 - +
55
+55 - +
65
+65 - +
75
+75 - +
85
+85 - +
95
Rat
io(%
)
Time Gap (minute)
Comparison between Navy Tide Table and Monkey Point Obserbation Data High Tide
Low Tide
Fast Tide Table Time Late
MPA Tide Table-Monkey Point
Navy Tide Table-Monkey Point
The Urgent Project for Rehabilitation of Yangon Port and FINAL REPORT Main Inland Water Transport in the Republic of the Union of Myanmar MAIN REPORT
Nippon Koei/OCDI 12-17
(3) Chart Datum
According to the definition of datum level, the tide level components were identified by using observed tide level data for one year.
There are differences in the type and calculation method of the datum level by country. Here, the Nearly Highest High Water (hereinafter referred to as “NHHW”), Nearly Lowest Low Water (hereinafter referred to as “NLLW”), Mean Monthly Highest Water Level (hereinafter referred to as “HWL”), Mean Monthly Lowest Water Level (hereinafter referred to as “LWL”), and Mean Sea Level (equivalent to Mean Water Level, and hereinafter referred to as “MSL”), all of which are used in Japan, are to be targeted.
NHHW is defined as the value which is calculated by adding mean water level to major four tidal components, while NLLW is defined as the value which is calculated by subtracting major four tidal components from mean water level.
NHHW = MSL + HM2 + HS2 + HK1 + HO1
NLLW = MSL - (HM2 + HS2 + HK1 + HO1)
Here, HM2, HS2, HK1, and HO1 are amplitudes of major four tidal components (amplitude of the harmonic constants). NHHW corresponds to the value called the Indian Spring Low Water in England. By substituting amplitudes of major four tidal components shown in Table 12.3.1 and MSL (A0 in Table 12.3.1) for the above equation, the following were calculated:
Monkey Point: NHHW = 338.4+181.9+67.9+20.8+9.8 = 618.8 (cm) NLLW = 338.4-(181.9+67.9+20.8+9.8) = 58.0 (cm)
MITT: NHHW = 328.5+188.7+74.0+22.4+10.3 = 623.9 (cm) ※no change at MITT NLLW = 328.5-(188.7+74.0+22.4+10.3) = 33.1 (cm)
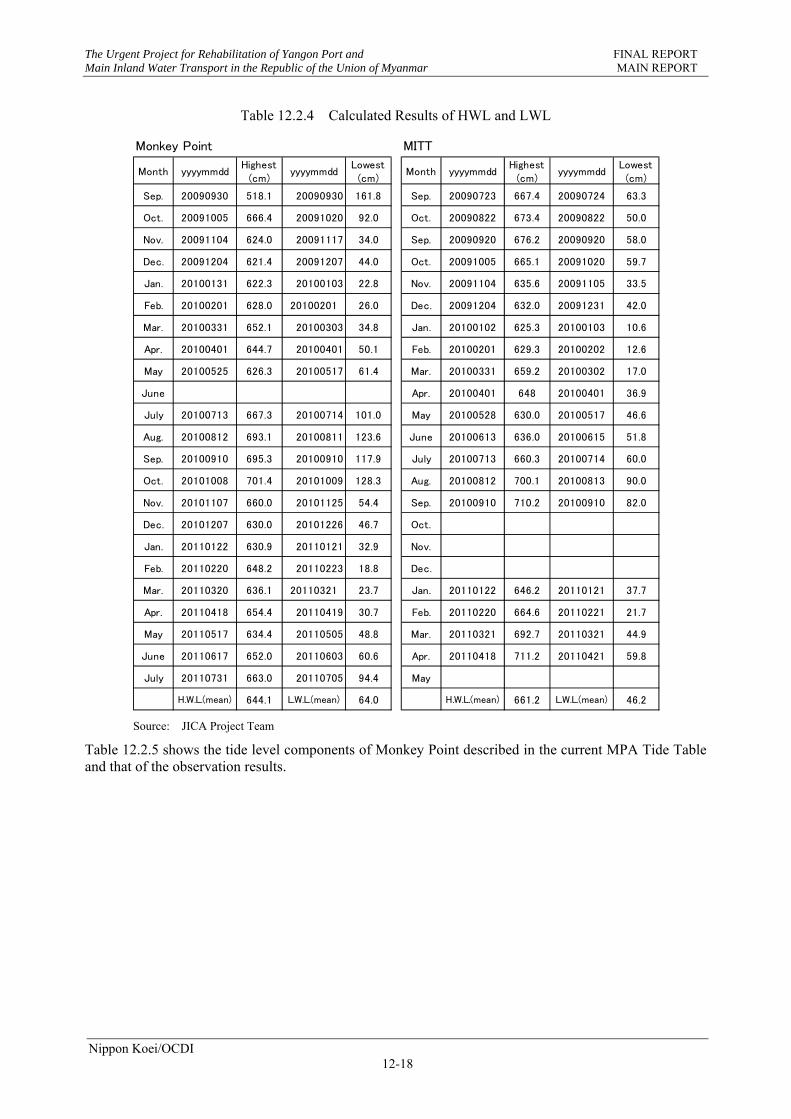
HWL and LWL are the yearly average of highest tide level and lowest tide level, respectively, that appear in five days at the maximum after new moon or full moon, respectively. Table 12.2.4 shows the calculated values according to this definition.
The Urgent Project for Rehabilitation of Yangon Port and FINAL REPORT Main Inland Water Transport in the Republic of the Union of Myanmar MAIN REPORT
Nippon Koei/OCDI 12-18
Table 12.2.4 Calculated Results of HWL and LWL
Source: JICA Project Team
Table 12.2.5 shows the tide level components of Monkey Point described in the current MPA Tide Table and that of the observation results.
Monkey Point MITT
Month yyyymmddHighest
(cm)yyyymmdd
Lowest(cm)
Month yyyymmddHighest
(cm)yyyymmdd
Lowest(cm)
Sep. 20090930 518.1 20090930 161.8 Sep. 20090723 667.4 20090724 63.3
Oct. 20091005 666.4 20091020 92.0 Oct. 20090822 673.4 20090822 50.0
Nov. 20091104 624.0 20091117 34.0 Sep. 20090920 676.2 20090920 58.0
Dec. 20091204 621.4 20091207 44.0 Oct. 20091005 665.1 20091020 59.7
Jan. 20100131 622.3 20100103 22.8 Nov. 20091104 635.6 20091105 33.5
Feb. 20100201 628.0 20100201 26.0 Dec. 20091204 632.0 20091231 42.0
Mar. 20100331 652.1 20100303 34.8 Jan. 20100102 625.3 20100103 10.6
Apr. 20100401 644.7 20100401 50.1 Feb. 20100201 629.3 20100202 12.6
May 20100525 626.3 20100517 61.4 Mar. 20100331 659.2 20100302 17.0
June Apr. 20100401 648 20100401 36.9
July 20100713 667.3 20100714 101.0 May 20100528 630.0 20100517 46.6
Aug. 20100812 693.1 20100811 123.6 June 20100613 636.0 20100615 51.8
Sep. 20100910 695.3 20100910 117.9 July 20100713 660.3 20100714 60.0
Oct. 20101008 701.4 20101009 128.3 Aug. 20100812 700.1 20100813 90.0
Nov. 20101107 660.0 20101125 54.4 Sep. 20100910 710.2 20100910 82.0
Dec. 20101207 630.0 20101226 46.7 Oct.
Jan. 20110122 630.9 20110121 32.9 Nov.
Feb. 20110220 648.2 20110223 18.8 Dec.
Mar. 20110320 636.1 20110321 23.7 Jan. 20110122 646.2 20110121 37.7
Apr. 20110418 654.4 20110419 30.7 Feb. 20110220 664.6 20110221 21.7
May 20110517 634.4 20110505 48.8 Mar. 20110321 692.7 20110321 44.9
June 20110617 652.0 20110603 60.6 Apr. 20110418 711.2 20110421 59.8
July 20110731 663.0 20110705 94.4 May
H.W.L.(mean) 644.1 L.W.L.(mean) 64.0 H.W.L.(mean) 661.2 L.W.L.(mean) 46.2
The Urgent Project for Rehabilitation of Yangon Port and FINAL REPORT Main Inland Water Transport in the Republic of the Union of Myanmar MAIN REPORT
Nippon Koei/OCDI 12-19
Table 12.2.5 Comparison of Datum Level
Datum MPA
Tide Table Monkey Point Observation
Highest H-W at Sule Pagoda Wharf (1899) +6.74
Highest H-W at Bo Aung Kyaw Street Wharf (1939) +6.664
HWL +6.441
NHHW +6.188
MSL(Mean Water Level) +3.384
Mean Water Level at No.7 Sule Pagoda Wharf (1954) +3.234
Mean Water Level at Bo Aung Kyaw Street Wharf (1936) +3.121
Mean Water Level at Pilakat Creek +2.966
Amherst MSL +2.73
LWL +0.640
NLLW ( Indian Spring Low Water Mark) +0.338 +0.58
Datum of soundings = LWST (Dry season) +0.000
Lowest L.W at Bo Aung Kyaw Street Wharf (1902) -0.24
Source: MPA and JICA Project Team
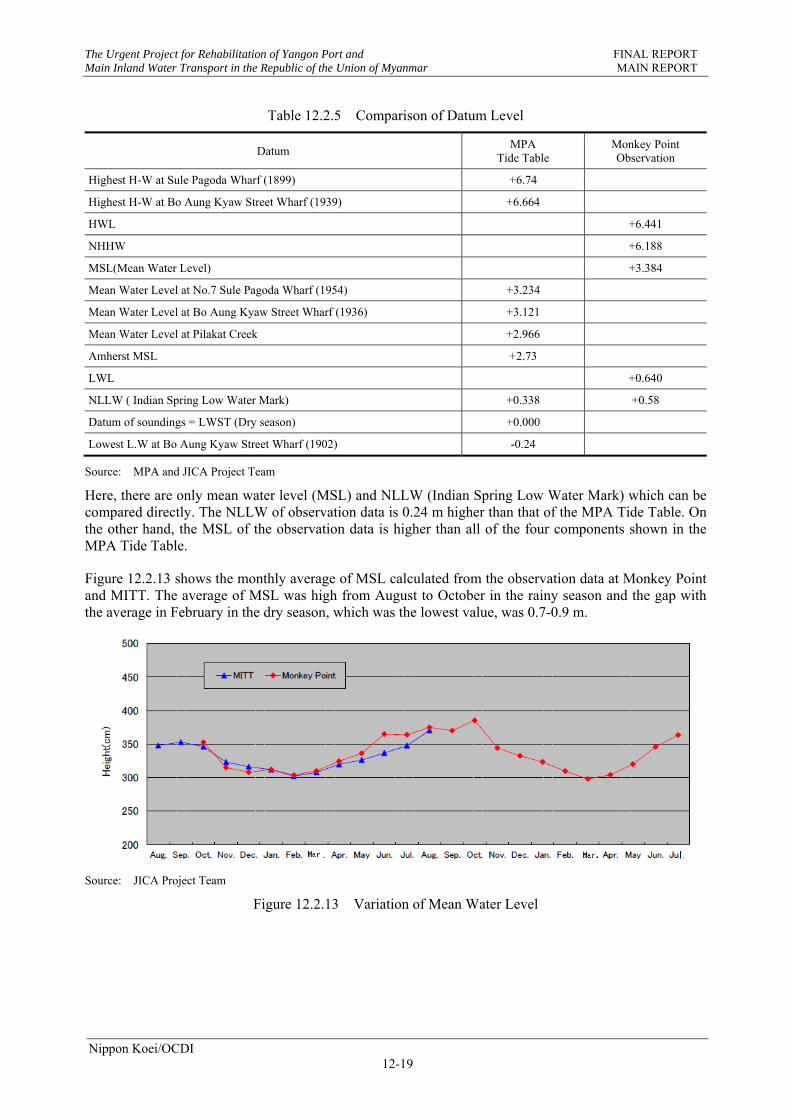
Here, there are only mean water level (MSL) and NLLW (Indian Spring Low Water Mark) which can be compared directly. The NLLW of observation data is 0.24 m higher than that of the MPA Tide Table. On the other hand, the MSL of the observation data is higher than all of the four components shown in the MPA Tide Table.
Figure 12.2.13 shows the monthly average of MSL calculated from the observation data at Monkey Point and MITT. The average of MSL was high from August to October in the rainy season and the gap with the average in February in the dry season, which was the lowest value, was 0.7-0.9 m.
Source: JICA Project Team
Figure 12.2.13 Variation of Mean Water Level
The Urgent Project for Rehabilitation of Yangon Port and FINAL REPORT Main Inland Water Transport in the Republic of the Union of Myanmar MAIN REPORT
Nippon Koei/OCDI 12-20
12.3 PREDICTION OF TIDE LEVEL
12.3.1 HARMONIC CONSTANT
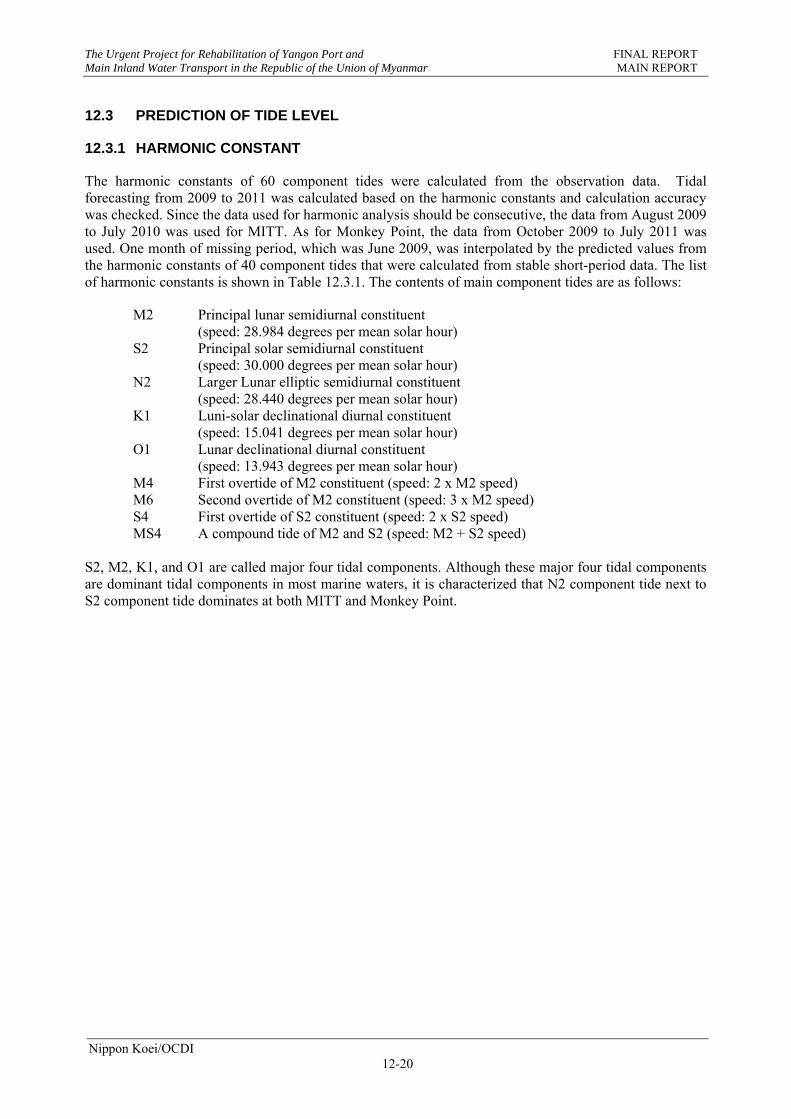
The harmonic constants of 60 component tides were calculated from the observation data. Tidal forecasting from 2009 to 2011 was calculated based on the harmonic constants and calculation accuracy was checked. Since the data used for harmonic analysis should be consecutive, the data from August 2009 to July 2010 was used for MITT. As for Monkey Point, the data from October 2009 to July 2011 was used. One month of missing period, which was June 2009, was interpolated by the predicted values from the harmonic constants of 40 component tides that were calculated from stable short-period data. The list of harmonic constants is shown in Table 12.3.1. The contents of main component tides are as follows:
M2 Principal lunar semidiurnal constituent (speed: 28.984 degrees per mean solar hour)
S2 Principal solar semidiurnal constituent (speed: 30.000 degrees per mean solar hour)
N2 Larger Lunar elliptic semidiurnal constituent (speed: 28.440 degrees per mean solar hour)
K1 Luni-solar declinational diurnal constituent (speed: 15.041 degrees per mean solar hour)
O1 Lunar declinational diurnal constituent (speed: 13.943 degrees per mean solar hour)
M4 First overtide of M2 constituent (speed: 2 x M2 speed) M6 Second overtide of M2 constituent (speed: 3 x M2 speed) S4 First overtide of S2 constituent (speed: 2 x S2 speed) MS4 A compound tide of M2 and S2 (speed: M2 + S2 speed)
S2, M2, K1, and O1 are called major four tidal components. Although these major four tidal components are dominant tidal components in most marine waters, it is characterized that N2 component tide next to S2 component tide dominates at both MITT and Monkey Point.
The Urgent Project for Rehabilitation of Yangon Port and FINAL REPORT Main Inland Water Transport in the Republic of the Union of Myanmar MAIN REPORT
Nippon Koei/OCDI 12-21
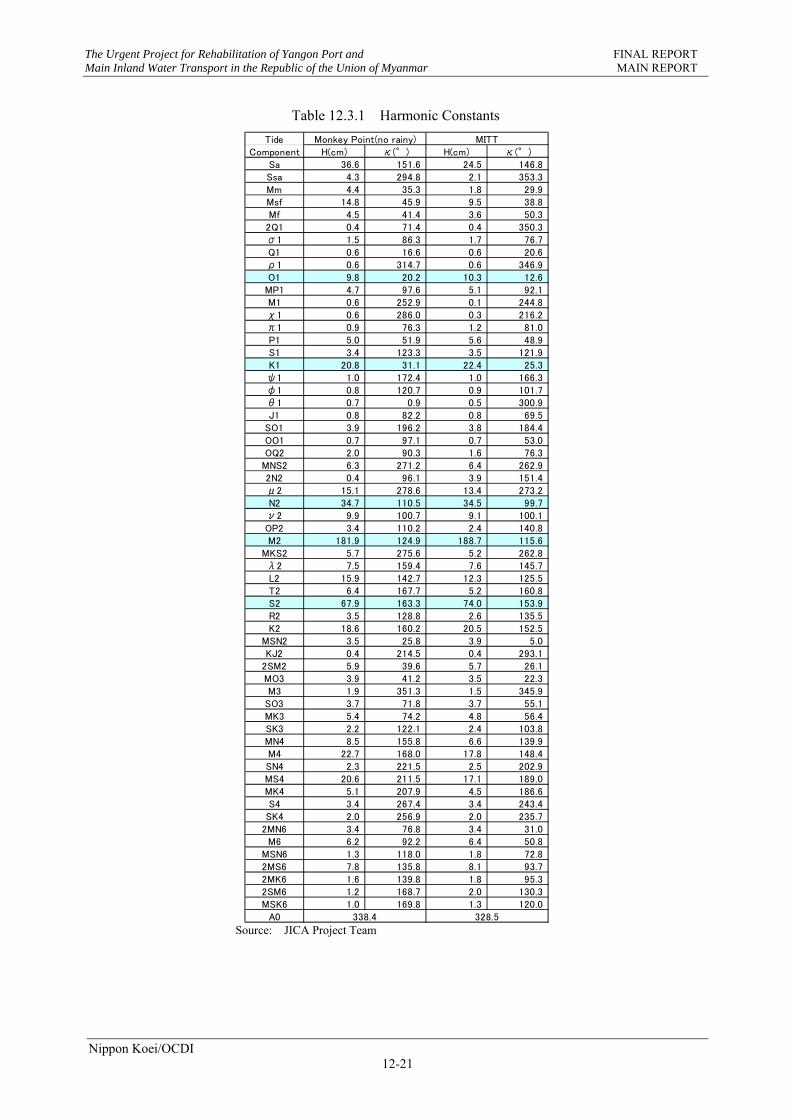
Table 12.3.1 Harmonic Constants
Source: JICA Project Team
Tide Monkey Point(no rainy) MITTComponent H(cm) κ(°) H(cm) κ(°)
Sa 36.6 151.6 24.5 146.8Ssa 4.3 294.8 2.1 353.3Mm 4.4 35.3 1.8 29.9Msf 14.8 45.9 9.5 38.8Mf 4.5 41.4 3.6 50.3
2Q1 0.4 71.4 0.4 350.3σ1 1.5 86.3 1.7 76.7Q1 0.6 16.6 0.6 20.6ρ1 0.6 314.7 0.6 346.9O1 9.8 20.2 10.3 12.6
MP1 4.7 97.6 5.1 92.1M1 0.6 252.9 0.1 244.8χ1 0.6 286.0 0.3 216.2π1 0.9 76.3 1.2 81.0P1 5.0 51.9 5.6 48.9S1 3.4 123.3 3.5 121.9K1 20.8 31.1 22.4 25.3ψ1 1.0 172.4 1.0 166.3φ1 0.8 120.7 0.9 101.7θ1 0.7 0.9 0.5 300.9J1 0.8 82.2 0.8 69.5
SO1 3.9 196.2 3.8 184.4OO1 0.7 97.1 0.7 53.0OQ2 2.0 90.3 1.6 76.3
MNS2 6.3 271.2 6.4 262.92N2 0.4 96.1 3.9 151.4μ2 15.1 278.6 13.4 273.2N2 34.7 110.5 34.5 99.7ν2 9.9 100.7 9.1 100.1OP2 3.4 110.2 2.4 140.8M2 181.9 124.9 188.7 115.6
MKS2 5.7 275.6 5.2 262.8λ2 7.5 159.4 7.6 145.7L2 15.9 142.7 12.3 125.5T2 6.4 167.7 5.2 160.8S2 67.9 163.3 74.0 153.9R2 3.5 128.8 2.6 135.5K2 18.6 160.2 20.5 152.5
MSN2 3.5 25.8 3.9 5.0KJ2 0.4 214.5 0.4 293.1
2SM2 5.9 39.6 5.7 26.1MO3 3.9 41.2 3.5 22.3M3 1.9 351.3 1.5 345.9
SO3 3.7 71.8 3.7 55.1MK3 5.4 74.2 4.8 56.4SK3 2.2 122.1 2.4 103.8MN4 8.5 155.8 6.6 139.9M4 22.7 168.0 17.8 148.4SN4 2.3 221.5 2.5 202.9MS4 20.6 211.5 17.1 189.0MK4 5.1 207.9 4.5 186.6S4 3.4 267.4 3.4 243.4
SK4 2.0 256.9 2.0 235.72MN6 3.4 76.8 3.4 31.0
M6 6.2 92.2 6.4 50.8MSN6 1.3 118.0 1.8 72.82MS6 7.8 135.8 8.1 93.72MK6 1.6 139.8 1.8 95.32SM6 1.2 168.7 2.0 130.3MSK6 1.0 169.8 1.3 120.0
A0 338.4 328.5
The Urgent Project for Rehabilitation of Yangon Port and FINAL REPORT Main Inland Water Transport in the Republic of the Union of Myanmar MAIN REPORT
Nippon Koei/OCDI 12-22
12.3.2 ACCURACY CONFIRMATION
(1) Accuracy of Tide Level
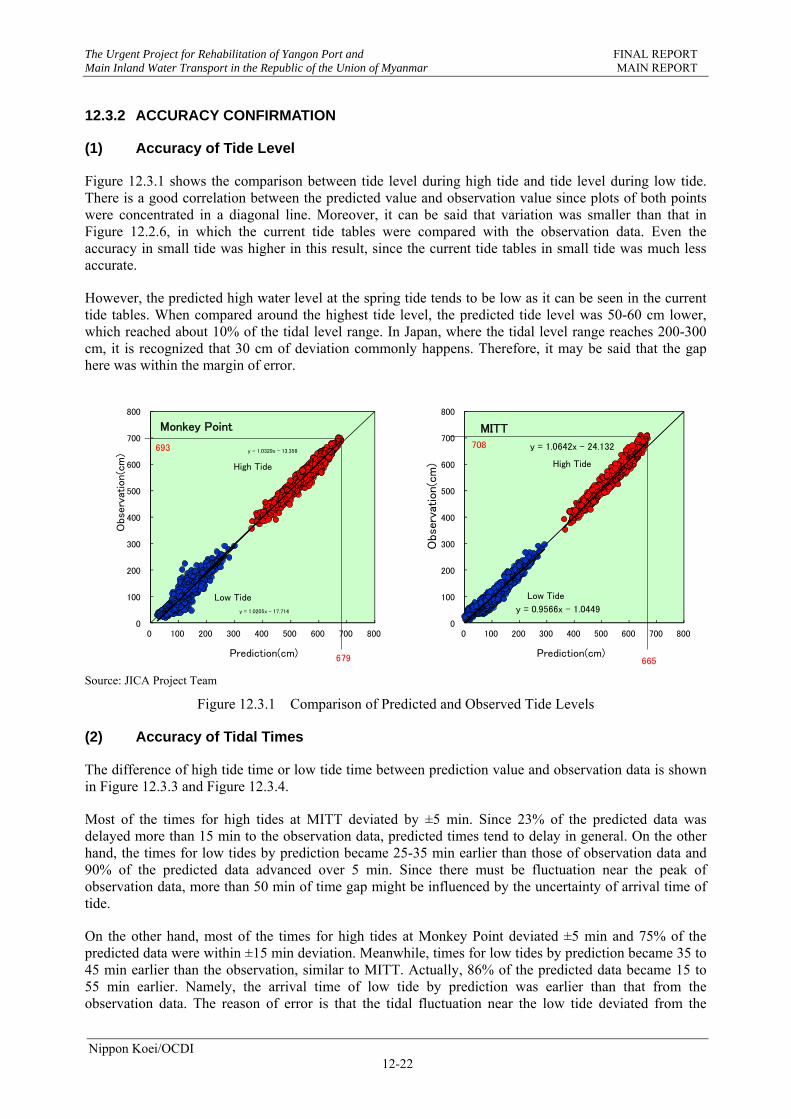
Figure 12.3.1 shows the comparison between tide level during high tide and tide level during low tide. There is a good correlation between the predicted value and observation value since plots of both points were concentrated in a diagonal line. Moreover, it can be said that variation was smaller than that in Figure 12.2.6, in which the current tide tables were compared with the observation data. Even the accuracy in small tide was higher in this result, since the current tide tables in small tide was much less accurate.
However, the predicted high water level at the spring tide tends to be low as it can be seen in the current tide tables. When compared around the highest tide level, the predicted tide level was 50-60 cm lower, which reached about 10% of the tidal level range. In Japan, where the tidal level range reaches 200-300 cm, it is recognized that 30 cm of deviation commonly happens. Therefore, it may be said that the gap here was within the margin of error.
Source: JICA Project Team
Figure 12.3.1 Comparison of Predicted and Observed Tide Levels
(2) Accuracy of Tidal Times
The difference of high tide time or low tide time between prediction value and observation data is shown in Figure 12.3.3 and Figure 12.3.4.
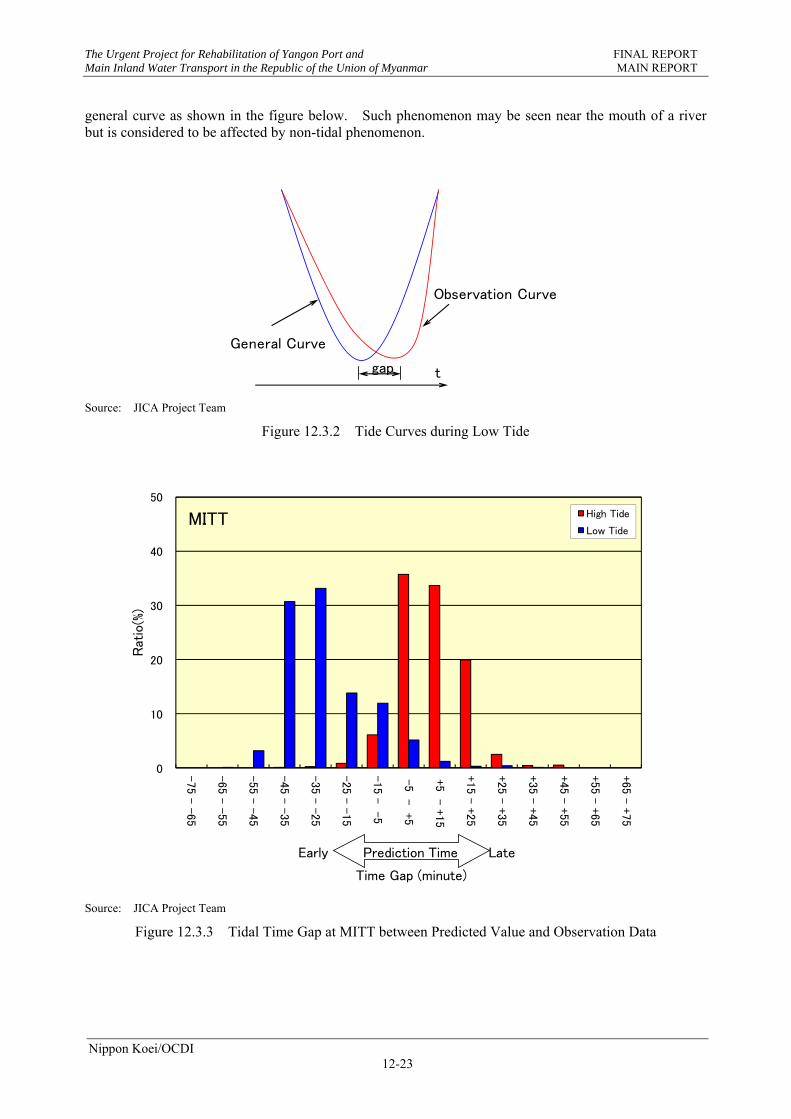
Most of the times for high tides at MITT deviated by ±5 min. Since 23% of the predicted data was delayed more than 15 min to the observation data, predicted times tend to delay in general. On the other hand, the times for low tides by prediction became 25-35 min earlier than those of observation data and 90% of the predicted data advanced over 5 min. Since there must be fluctuation near the peak of observation data, more than 50 min of time gap might be influenced by the uncertainty of arrival time of tide.
On the other hand, most of the times for high tides at Monkey Point deviated ±5 min and 75% of the predicted data were within ±15 min deviation. Meanwhile, times for low tides by prediction became 35 to 45 min earlier than the observation, similar to MITT. Actually, 86% of the predicted data became 15 to 55 min earlier. Namely, the arrival time of low tide by prediction was earlier than that from the observation data. The reason of error is that the tidal fluctuation near the low tide deviated from the
y = 1.0642x - 24.132
y = 0.9566x - 1.0449
0
100
200
300
400
500
600
700
800
0 100 200 300 400 500 600 700 800
Obs
erva
tion(
cm)
Prediction(cm)
y = 1.0329x - 13.358
y = 1.0205x - 17.714
0
100
200
300
400
500
600
700
800
0 100 200 300 400 500 600 700 800
Obs
erv
atio
n(c
m)
Prediction(cm)
High Tide
Low Tide
High Tide
Low Tide
MITTMonkey Point
679 665
708693
The Urgent Project for Rehabilitation of Yangon Port and FINAL REPORT Main Inland Water Transport in the Republic of the Union of Myanmar MAIN REPORT
Nippon Koei/OCDI 12-23
general curve as shown in the figure below. Such phenomenon may be seen near the mouth of a river but is considered to be affected by non-tidal phenomenon.
Source: JICA Project Team
Figure 12.3.2 Tide Curves during Low Tide
Source: JICA Project Team
Figure 12.3.3 Tidal Time Gap at MITT between Predicted Value and Observation Data
General Curve
Observation Curve
tgap
0
10
20
30
40
50
-75 -
-65
-65 -
-55
-55 -
-45
-45 -
-35
-35 -
-25
-25 -
-15
-15 -
-5
-5 -
+5
+5 -
+15
+15 -
+25
+25 -
+35
+35 -
+45
+45 -
+55
+55 -
+65
+65 -
+75
Rat
io(%
)
Time Gap (minute)
MITT High Tide
Low Tide
Early Prediction Time Late
The Urgent Project for Rehabilitation of Yangon Port and FINAL REPORT Main Inland Water Transport in the Republic of the Union of Myanmar MAIN REPORT
Nippon Koei/OCDI 12-24
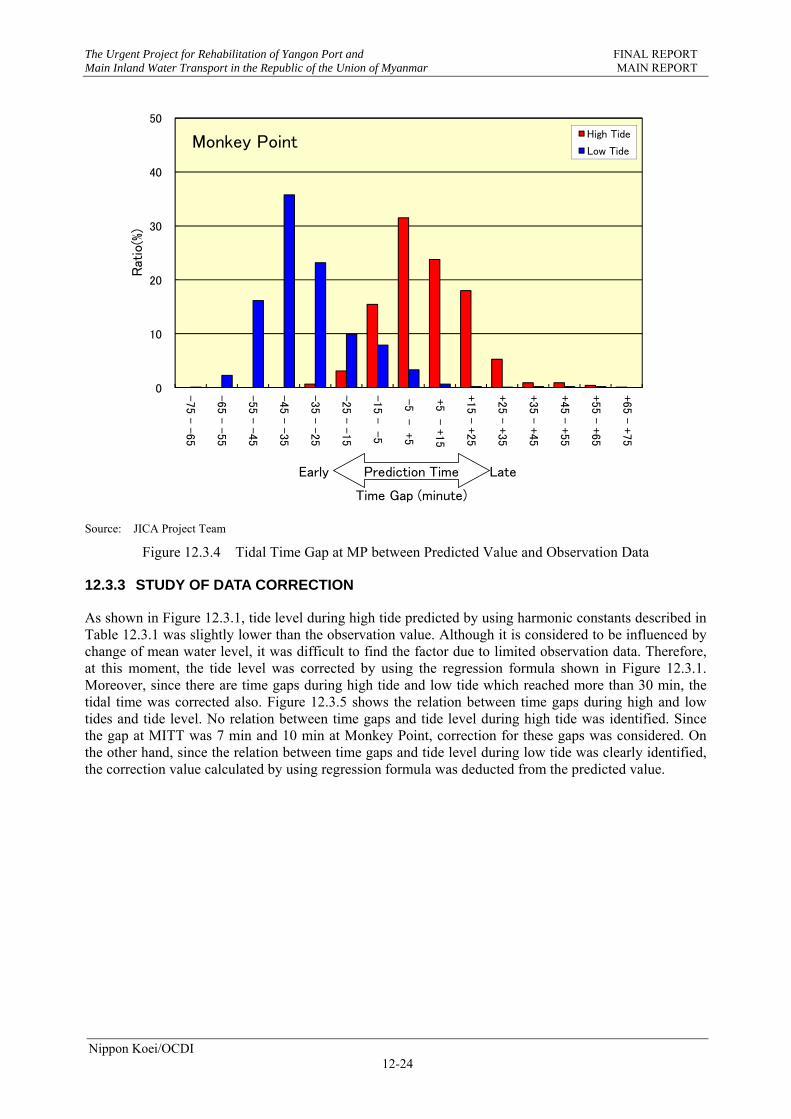
Source: JICA Project Team
Figure 12.3.4 Tidal Time Gap at MP between Predicted Value and Observation Data
12.3.3 STUDY OF DATA CORRECTION
As shown in Figure 12.3.1, tide level during high tide predicted by using harmonic constants described in Table 12.3.1 was slightly lower than the observation value. Although it is considered to be influenced by change of mean water level, it was difficult to find the factor due to limited observation data. Therefore, at this moment, the tide level was corrected by using the regression formula shown in Figure 12.3.1. Moreover, since there are time gaps during high tide and low tide which reached more than 30 min, the tidal time was corrected also. Figure 12.3.5 shows the relation between time gaps during high and low tides and tide level. No relation between time gaps and tide level during high tide was identified. Since the gap at MITT was 7 min and 10 min at Monkey Point, correction for these gaps was considered. On the other hand, since the relation between time gaps and tide level during low tide was clearly identified, the correction value calculated by using regression formula was deducted from the predicted value.
0
10
20
30
40
50
-75 - -
65
-65 - -
55
-55 - -
45
-45 - -
35
-35 - -
25
-25 - -
15
-15 -
-5
-5 - +
5
+5 - +1
5
+15 - +
25
+25 - +
35
+35 - +
45
+45 - +
55
+55 - +
65
+65 - +
75
Rat
io(%
)
Time Gap (minute)
Monkey PointHigh Tide
Low Tide
Early Prediction Time Late
The Urgent Project for Rehabilitation of Yangon Port and FINAL REPORT Main Inland Water Transport in the Republic of the Union of Myanmar MAIN REPORT
Nippon Koei/OCDI 12-25
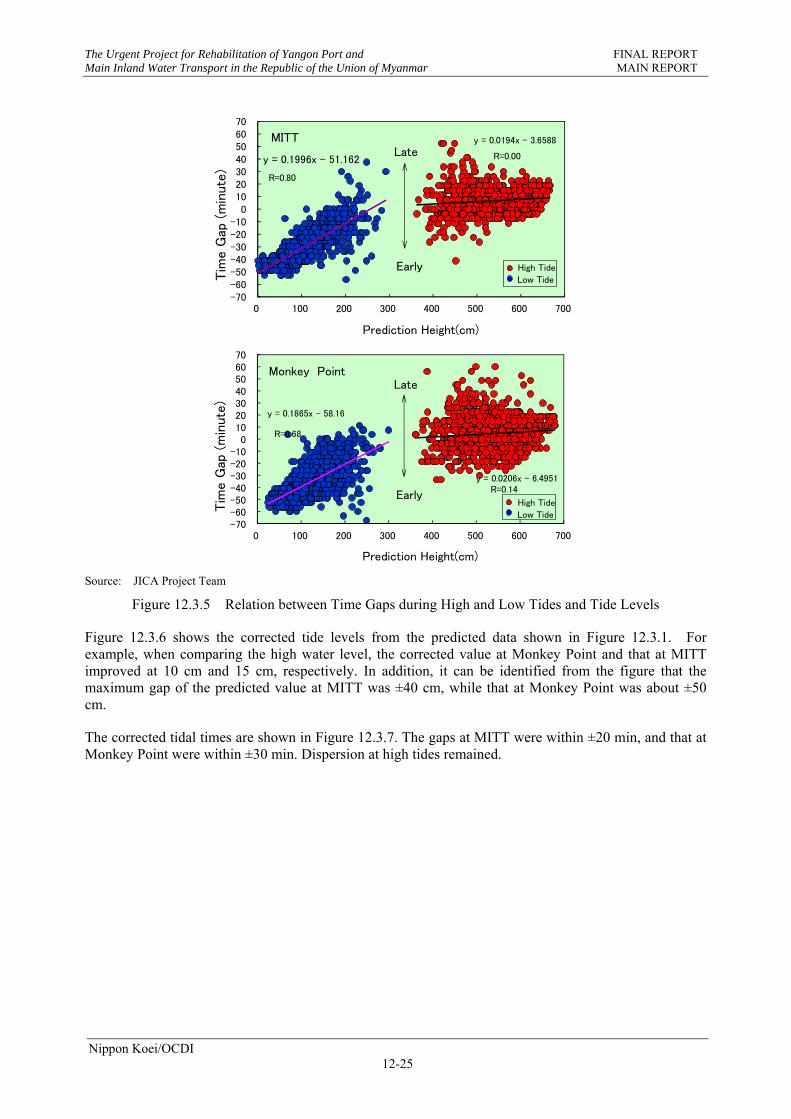
Source: JICA Project Team
Figure 12.3.5 Relation between Time Gaps during High and Low Tides and Tide Levels
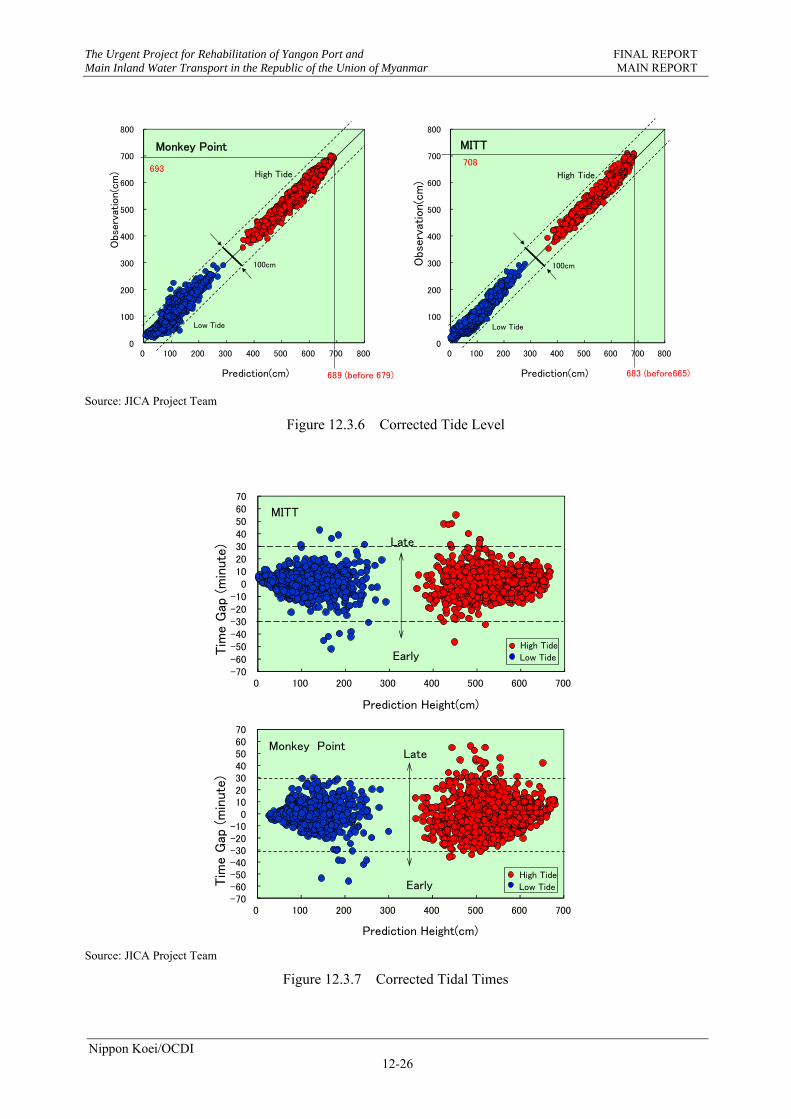
Figure 12.3.6 shows the corrected tide levels from the predicted data shown in Figure 12.3.1. For example, when comparing the high water level, the corrected value at Monkey Point and that at MITT improved at 10 cm and 15 cm, respectively. In addition, it can be identified from the figure that the maximum gap of the predicted value at MITT was ±40 cm, while that at Monkey Point was about ±50 cm.
The corrected tidal times are shown in Figure 12.3.7. The gaps at MITT were within ±20 min, and that at Monkey Point were within ±30 min. Dispersion at high tides remained.
y = 0.0194x - 3.6588
y = 0.1996x - 51.162
-70-60-50-40-30-20-10
010203040506070
0 100 200 300 400 500 600 700
Tim
e G
ap (
min
ute)
Prediction Height(cm)
MITT
Early
Late
High Tide
Low Tide
R=0.80
R=0.00
y = 0.0206x - 6.4951
y = 0.1865x - 58.16
-70-60-50-40-30-20-10
010203040506070
0 100 200 300 400 500 600 700
Tim
e G
ap (
min
ute)
Prediction Height(cm)
Monkey Point
Early
Late
High Tide
Low Tide
R=0.68
R=0.14
The Urgent Project for Rehabilitation of Yangon Port and FINAL REPORT Main Inland Water Transport in the Republic of the Union of Myanmar MAIN REPORT
Nippon Koei/OCDI 12-26
Source: JICA Project Team
Figure 12.3.6 Corrected Tide Level
Source: JICA Project Team
Figure 12.3.7 Corrected Tidal Times
0
100
200
300
400
500
600
700
800
0 100 200 300 400 500 600 700 800
Obs
erva
tion(
cm)
Prediction(cm)
0
100
200
300
400
500
600
700
800
0 100 200 300 400 500 600 700 800
Obs
erv
atio
n(c
m)
Prediction(cm)
High Tide High Tide
Low Tide Low Tide
MITTMonkey Point708
689 (before 679)
693
100cm100cm
683 (before665)
-70-60-50-40-30-20-10
010203040506070
0 100 200 300 400 500 600 700
Tim
e G
ap (
min
ute)
Prediction Height(cm)
MITT
Early
Late
High Tide
Low Tide
-70-60-50-40-30-20-10
010203040506070
0 100 200 300 400 500 600 700
Tim
e G
ap (
min
ute)
Prediction Height(cm)
Monkey Point
Early
Late
High Tide
Low Tide
The Urgent Project for Rehabilitation of Yangon Port and FINAL REPORT Main Inland Water Transport in the Republic of the Union of Myanmar MAIN REPORT
Nippon Koei/OCDI 12-27
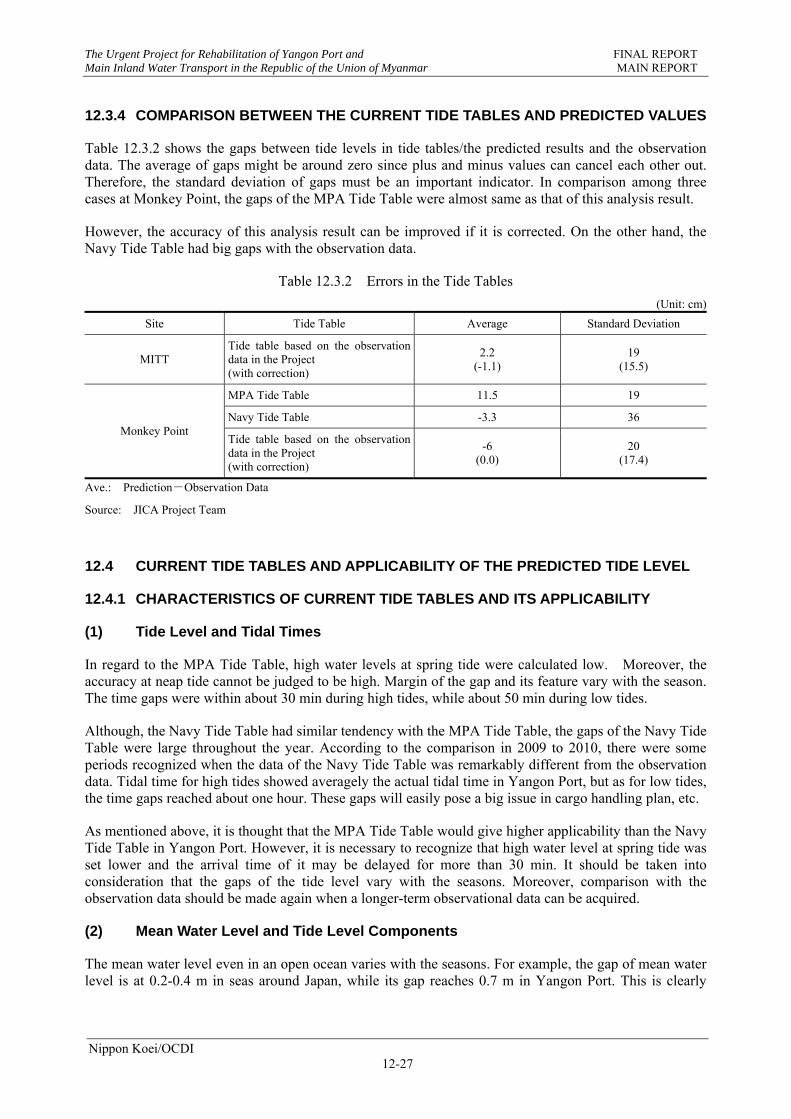
12.3.4 COMPARISON BETWEEN THE CURRENT TIDE TABLES AND PREDICTED VALUES
Table 12.3.2 shows the gaps between tide levels in tide tables/the predicted results and the observation data. The average of gaps might be around zero since plus and minus values can cancel each other out. Therefore, the standard deviation of gaps must be an important indicator. In comparison among three cases at Monkey Point, the gaps of the MPA Tide Table were almost same as that of this analysis result.
However, the accuracy of this analysis result can be improved if it is corrected. On the other hand, the Navy Tide Table had big gaps with the observation data.
Table 12.3.2 Errors in the Tide Tables
(Unit: cm)
Site Tide Table Average Standard Deviation
MITT Tide table based on the observation data in the Project (with correction)
2.2 (-1.1)
19 (15.5)
Monkey Point
MPA Tide Table 11.5 19
Navy Tide Table -3.3 36
Tide table based on the observation data in the Project (with correction)
-6 (0.0)
20 (17.4)
Ave.: Prediction-Observation Data
Source: JICA Project Team
12.4 CURRENT TIDE TABLES AND APPLICABILITY OF THE PREDICTED TIDE LEVEL
12.4.1 CHARACTERISTICS OF CURRENT TIDE TABLES AND ITS APPLICABILITY
(1) Tide Level and Tidal Times
In regard to the MPA Tide Table, high water levels at spring tide were calculated low. Moreover, the accuracy at neap tide cannot be judged to be high. Margin of the gap and its feature vary with the season. The time gaps were within about 30 min during high tides, while about 50 min during low tides.
Although, the Navy Tide Table had similar tendency with the MPA Tide Table, the gaps of the Navy Tide Table were large throughout the year. According to the comparison in 2009 to 2010, there were some periods recognized when the data of the Navy Tide Table was remarkably different from the observation data. Tidal time for high tides showed averagely the actual tidal time in Yangon Port, but as for low tides, the time gaps reached about one hour. These gaps will easily pose a big issue in cargo handling plan, etc.
As mentioned above, it is thought that the MPA Tide Table would give higher applicability than the Navy Tide Table in Yangon Port. However, it is necessary to recognize that high water level at spring tide was set lower and the arrival time of it may be delayed for more than 30 min. It should be taken into consideration that the gaps of the tide level vary with the seasons. Moreover, comparison with the observation data should be made again when a longer-term observational data can be acquired.
(2) Mean Water Level and Tide Level Components
The mean water level even in an open ocean varies with the seasons. For example, the gap of mean water level is at 0.2-0.4 m in seas around Japan, while its gap reaches 0.7 m in Yangon Port. This is clearly
The Urgent Project for Rehabilitation of Yangon Port and FINAL REPORT Main Inland Water Transport in the Republic of the Union of Myanmar MAIN REPORT
Nippon Koei/OCDI 12-28
caused by the difference in precipitation by season. For this reason, it is necessary to calculate the mean water level in the Yangon River including Yangon Port from the observation data for at least one year.
Although some tide level components were shown in the current tide tables, the observation data to generate them has not been clarified.
Although the tide level components of high water were calculated based on the old record of data, it is considered that the quality of data, i.e., how the data was observed, will become vitally important in the future. Therefore, it is thought that the time has come to review them by using the statistical technique. For this purpose, a long-term tidal observation is indispensable. For example, at least one year is needed to get the mean water level, while theoretically 19 years of observation data is needed. On the other hand, the Hydrographic Department of the Japan Coast Guard and the Japan Meteorological Agency have used the recent five-year data to calculate the mean water lever.
12.4.2 APPLICABILITY OF PREDICTED TIDE LEVEL
It was confirmed that the predicted tide level by harmonic constants calculated from the data of tide observation started from 2009 had equivalent level of accuracy or more as the tide levels in the MPA Tide Table. The accuracy had few differences by seasons, and also the tidal fluctuation at neap tide was more accurate than the one in the existing tide tables. However, there was still an issue that the tidal times for low tides deviated from the actual state. The time gaps reached to 60 min. The errors were corrected by the regression analysis to be less than 30 min. Continuous observation and further update of analysis for practical use are recommended.
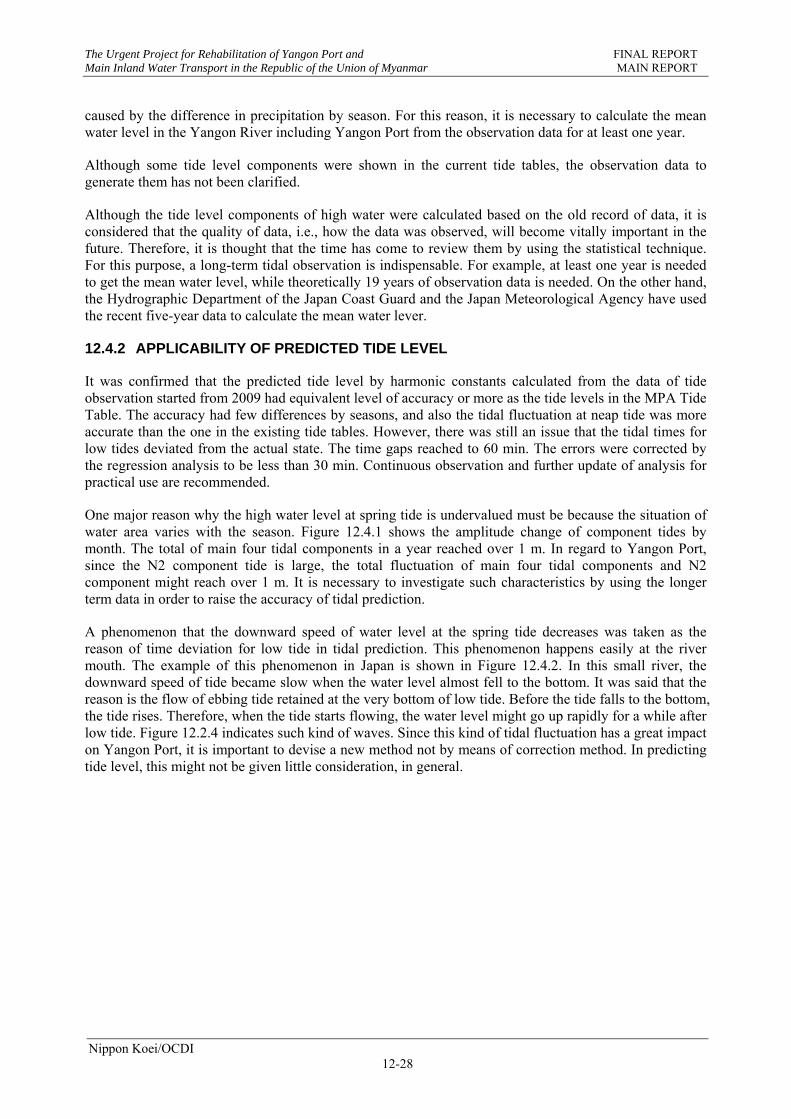
One major reason why the high water level at spring tide is undervalued must be because the situation of water area varies with the season. Figure 12.4.1 shows the amplitude change of component tides by month. The total of main four tidal components in a year reached over 1 m. In regard to Yangon Port, since the N2 component tide is large, the total fluctuation of main four tidal components and N2 component might reach over 1 m. It is necessary to investigate such characteristics by using the longer term data in order to raise the accuracy of tidal prediction.
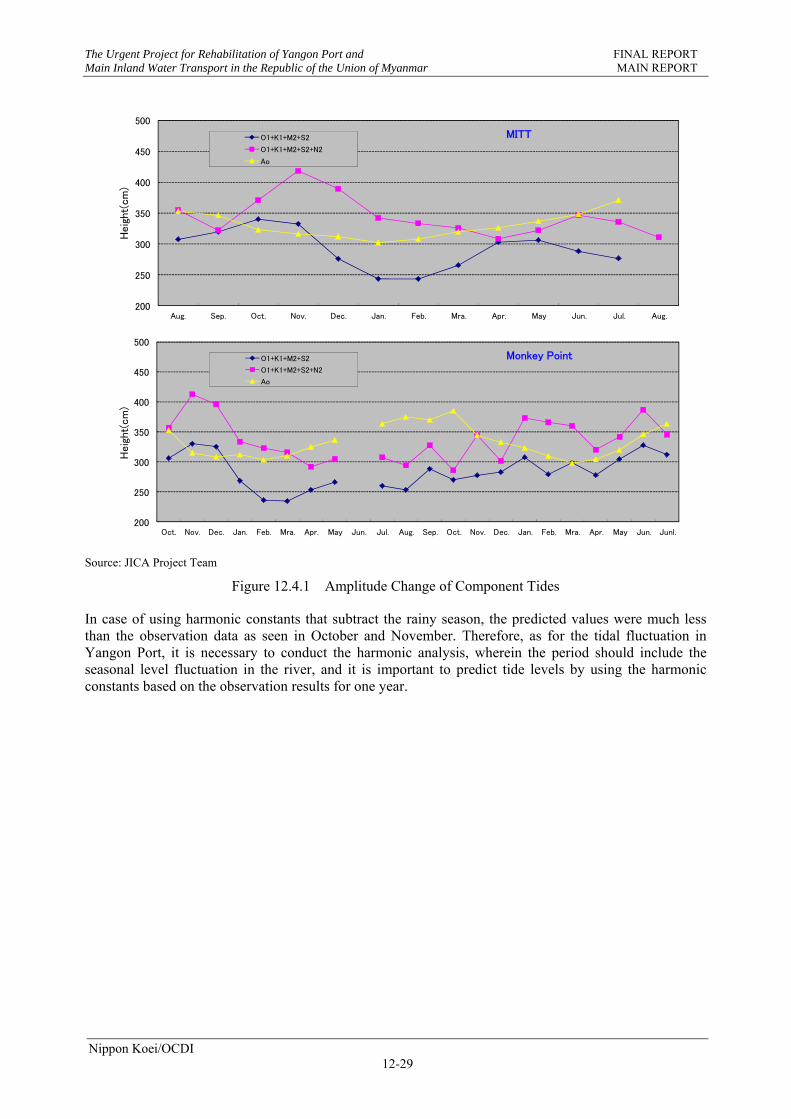
A phenomenon that the downward speed of water level at the spring tide decreases was taken as the reason of time deviation for low tide in tidal prediction. This phenomenon happens easily at the river mouth. The example of this phenomenon in Japan is shown in Figure 12.4.2. In this small river, the downward speed of tide became slow when the water level almost fell to the bottom. It was said that the reason is the flow of ebbing tide retained at the very bottom of low tide. Before the tide falls to the bottom, the tide rises. Therefore, when the tide starts flowing, the water level might go up rapidly for a while after low tide. Figure 12.2.4 indicates such kind of waves. Since this kind of tidal fluctuation has a great impact on Yangon Port, it is important to devise a new method not by means of correction method. In predicting tide level, this might not be given little consideration, in general.
The Urgent Project for Rehabilitation of Yangon Port and FINAL REPORT Main Inland Water Transport in the Republic of the Union of Myanmar MAIN REPORT
Nippon Koei/OCDI 12-29
Source: JICA Project Team
Figure 12.4.1 Amplitude Change of Component Tides
In case of using harmonic constants that subtract the rainy season, the predicted values were much less than the observation data as seen in October and November. Therefore, as for the tidal fluctuation in Yangon Port, it is necessary to conduct the harmonic analysis, wherein the period should include the seasonal level fluctuation in the river, and it is important to predict tide levels by using the harmonic constants based on the observation results for one year.
200
250
300
350
400
450
500
Aug. Sep. Oct. Nov. Dec. Jan. Feb. Mra. Apr. May Jun. Jul. Aug.
Heig
ht(
cm
)MITTO1+K1+M2+S2
O1+K1+M2+S2+N2
Ao
200
250
300
350
400
450
500
Oct. Nov. Dec. Jan. Feb. Mra. Apr. May Jun. Jul. Aug. Sep. Oct. Nov. Dec. Jan. Feb. Mra. Apr. May Jun. Junl.
Heig
ht(
cm
)
Monkey PointO1+K1+M2+S2
O1+K1+M2+S2+N2
Ao
The Urgent Project for Rehabilitation of Yangon Port and FINAL REPORT Main Inland Water Transport in the Republic of the Union of Myanmar MAIN REPORT
Nippon Koei/OCDI 12-30
Source: JICA Project Team
Figure 12.4.2 Example of Tidal Fluctuation near the River Mouth in Japan
12.4.3 IMPORTANCE OF TIDAL OBSERVATION IN YANGON PORT
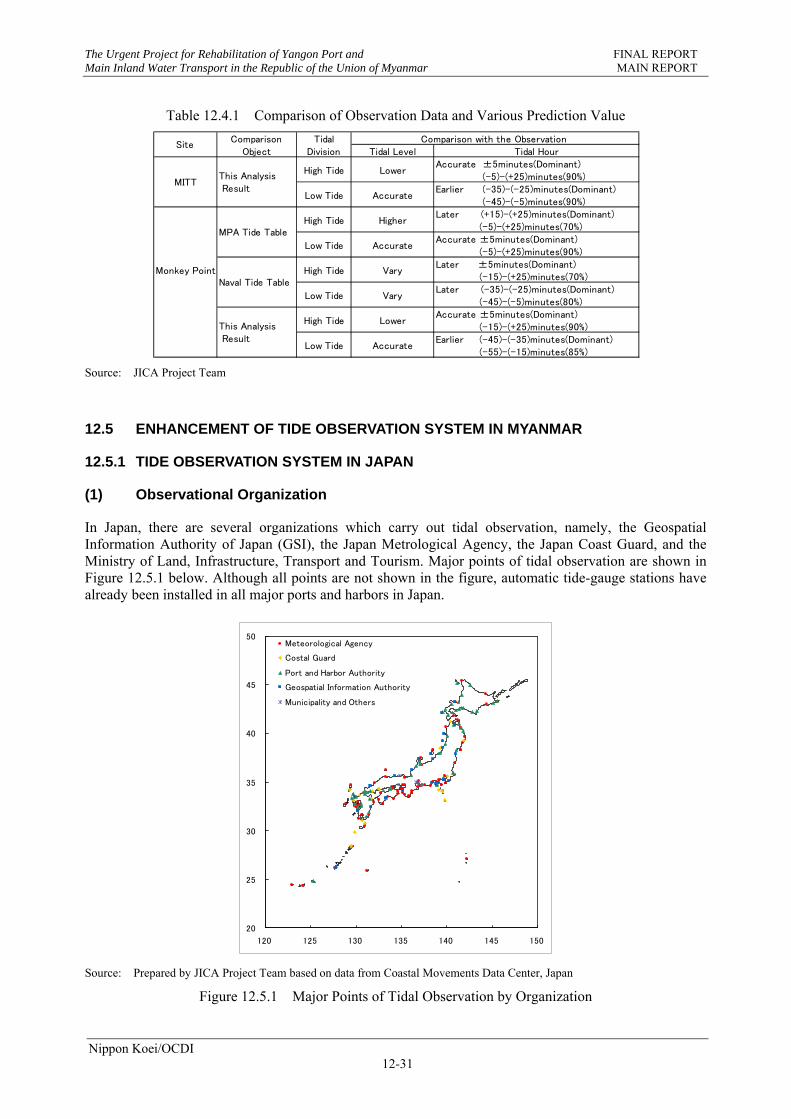
Table 12.4.1 shows the qualitative comparison between the current tide tables and the observation data of this study. Tide levels were judged not only from the error of prediction accuracy by standard deviation but also from the comparison scatter diagram with the observation data.
In regard to the tide tables, the MPA Tide Table seems better. However, there are also many points to be considered. On the other hand, the prediction value by harmonic constants based on the observation data is almost at equivalent level as the MPA Tide Table. Although it is expected that the accuracy of the prediction value can be raised by rectifying, it is hard to say that the correction coefficient calculated in this study is of universal value. For this purpose, tidal observation should be continued.
St.1
-300
-200
-100
0
100
200
300
2006/5/12 2006/5/13 2006/5/14 2006/5/15 2006/5/16 2006/5/17
Heig
ht(
cm
)
St.2
-300
-200
-100
0
100
200
300
2006/5/12 2006/5/13 2006/5/14 2006/5/15 2006/5/16 2006/5/17
Heig
ht(
cm
)
St.2St.3 St.1St.2
Kyusyu
The Urgent Project for Rehabilitation of Yangon Port and FINAL REPORT Main Inland Water Transport in the Republic of the Union of Myanmar MAIN REPORT
Nippon Koei/OCDI 12-31
Table 12.4.1 Comparison of Observation Data and Various Prediction Value
Source: JICA Project Team
12.5 ENHANCEMENT OF TIDE OBSERVATION SYSTEM IN MYANMAR
12.5.1 TIDE OBSERVATION SYSTEM IN JAPAN
(1) Observational Organization
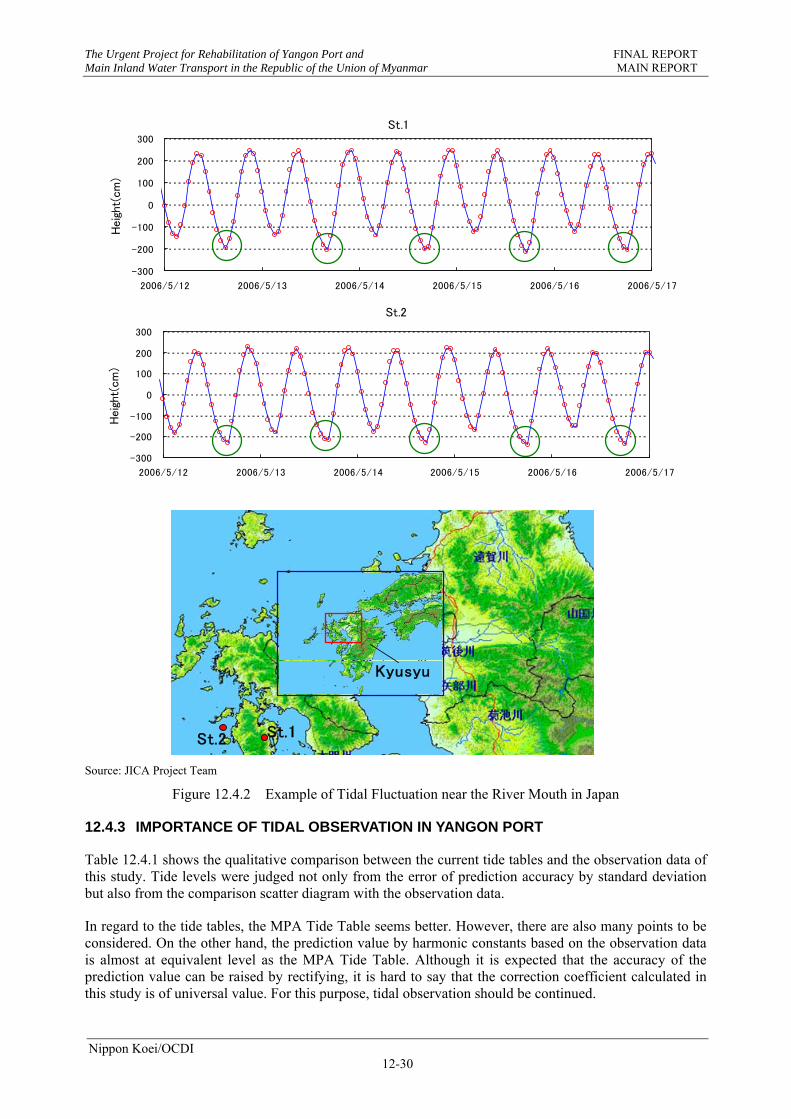
In Japan, there are several organizations which carry out tidal observation, namely, the Geospatial Information Authority of Japan (GSI), the Japan Metrological Agency, the Japan Coast Guard, and the Ministry of Land, Infrastructure, Transport and Tourism. Major points of tidal observation are shown in Figure 12.5.1 below. Although all points are not shown in the figure, automatic tide-gauge stations have already been installed in all major ports and harbors in Japan.
Source: Prepared by JICA Project Team based on data from Coastal Movements Data Center, Japan
Figure 12.5.1 Major Points of Tidal Observation by Organization
Comparison with the Observation Tidal Level Tidal Hour
High Tide LowerAccurate ±5minutes(Dominant) (-5)-(+25)minutes(90%)
Low Tide AccurateEarlier (-35)-(-25)minutes(Dominant) (-45)-(-5)minutes(90%)
High Tide HigherLater (+15)-(+25)minutes(Dominant) (-5)-(+25)minutes(70%)
Low Tide AccurateAccurate ±5minutes(Dominant) (-5)-(+25)minutes(90%)
Monkey Point High Tide VaryLater ±5minutes(Dominant) (-15)-(+25)minutes(70%)
Low Tide VaryLater (-35)-(-25)minutes(Dominant) (-45)-(-5)minutes(80%)
High Tide LowerAccurate ±5minutes(Dominant) (-15)-(+25)minutes(90%)
Low Tide AccurateEarlier (-45)-(-35)minutes(Dominant) (-55)-(-15)minutes(85%)
MPA Tide Table
Naval Tide Table
This Analysis Result
SiteComparison
ObjectTidal
Division
MITTThis Analysis Result
20
25
30
35
40
45
50
120 125 130 135 140 145 150
Meteorological Agency
Costal Guard
Port and Harbor Authority
Geospatial Information Authority
Municipality and Others
The Urgent Project for Rehabilitation of Yangon Port and FINAL REPORT Main Inland Water Transport in the Republic of the Union of Myanmar MAIN REPORT
Nippon Koei/OCDI 12-32
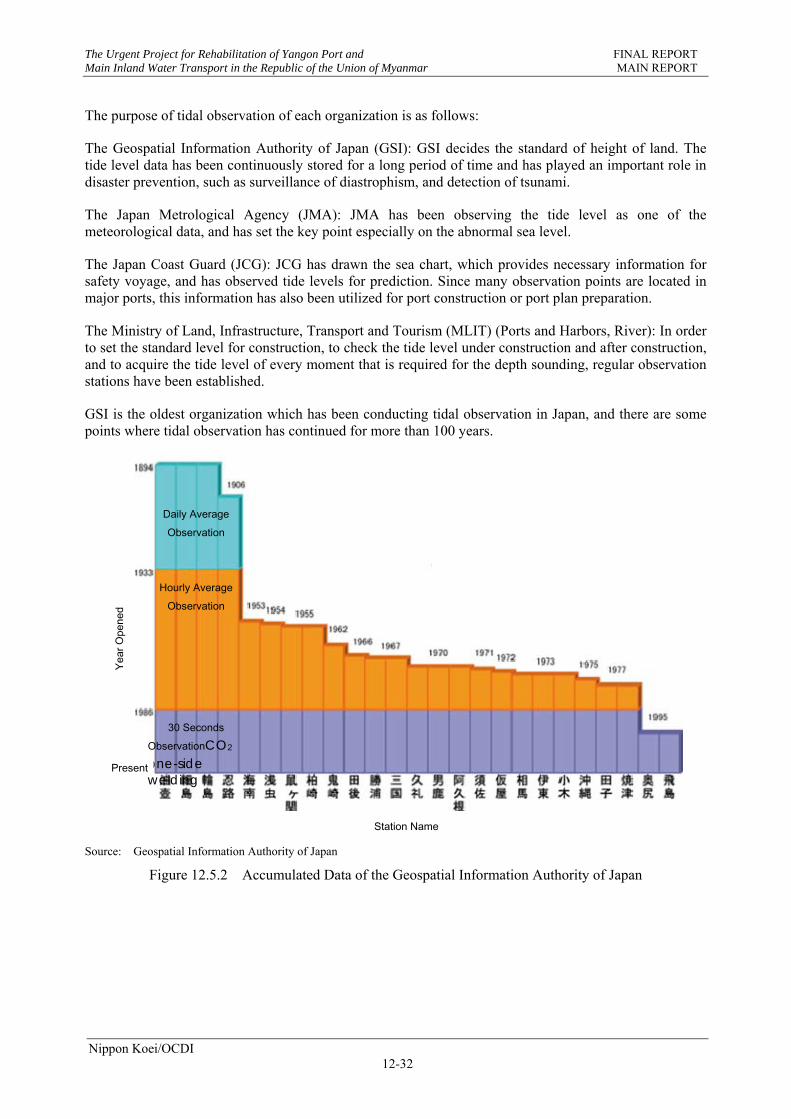
The purpose of tidal observation of each organization is as follows:
The Geospatial Information Authority of Japan (GSI): GSI decides the standard of height of land. The tide level data has been continuously stored for a long period of time and has played an important role in disaster prevention, such as surveillance of diastrophism, and detection of tsunami.
The Japan Metrological Agency (JMA): JMA has been observing the tide level as one of the meteorological data, and has set the key point especially on the abnormal sea level.
The Japan Coast Guard (JCG): JCG has drawn the sea chart, which provides necessary information for safety voyage, and has observed tide levels for prediction. Since many observation points are located in major ports, this information has also been utilized for port construction or port plan preparation.
The Ministry of Land, Infrastructure, Transport and Tourism (MLIT) (Ports and Harbors, River): In order to set the standard level for construction, to check the tide level under construction and after construction, and to acquire the tide level of every moment that is required for the depth sounding, regular observation stations have been established.
GSI is the oldest organization which has been conducting tidal observation in Japan, and there are some points where tidal observation has continued for more than 100 years.
Source: Geospatial Information Authority of Japan
Figure 12.5.2 Accumulated Data of the Geospatial Information Authority of Japan
Station Name
Year
Ope
ned
Daily Average Observation
Hourly AverageObservation
30 Seconds ObservationCO2 one-side welding
Present
The Urgent Project for Rehabilitation of Yangon Port and FINAL REPORT Main Inland Water Transport in the Republic of the Union of Myanmar MAIN REPORT
Nippon Koei/OCDI 12-33
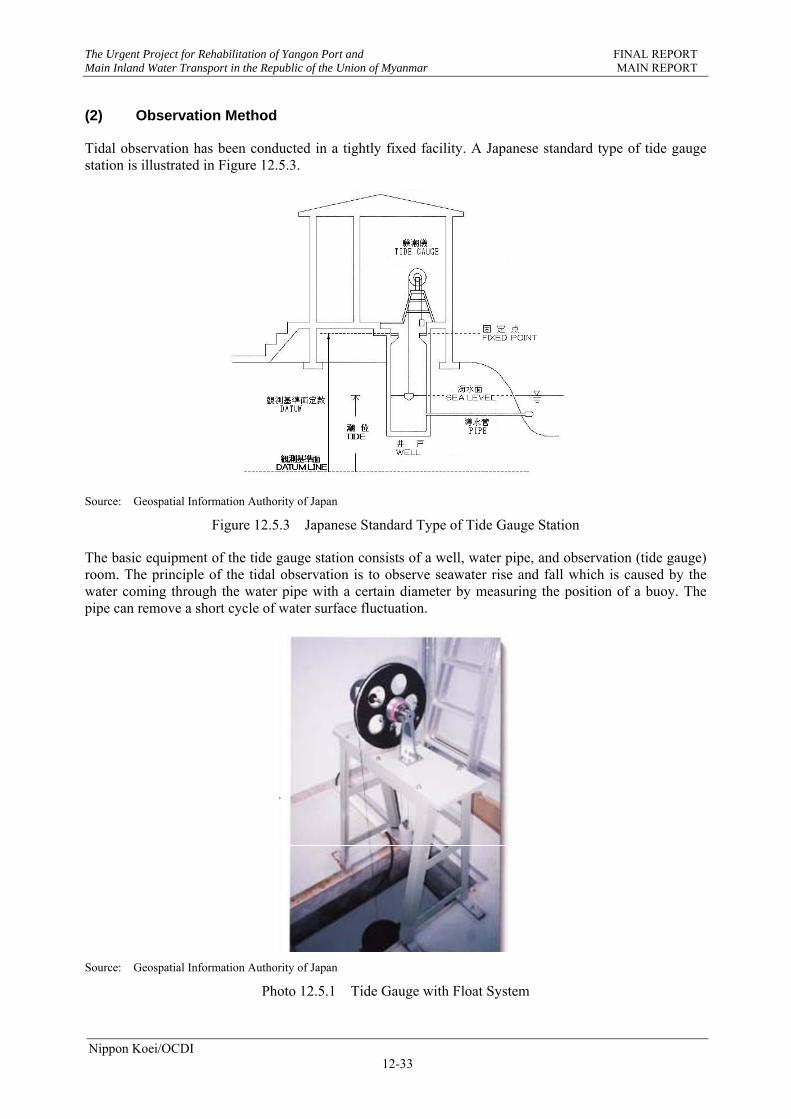
(2) Observation Method
Tidal observation has been conducted in a tightly fixed facility. A Japanese standard type of tide gauge station is illustrated in Figure 12.5.3.
Source: Geospatial Information Authority of Japan
Figure 12.5.3 Japanese Standard Type of Tide Gauge Station
The basic equipment of the tide gauge station consists of a well, water pipe, and observation (tide gauge) room. The principle of the tidal observation is to observe seawater rise and fall which is caused by the water coming through the water pipe with a certain diameter by measuring the position of a buoy. The pipe can remove a short cycle of water surface fluctuation.
Source: Geospatial Information Authority of Japan
Photo 12.5.1 Tide Gauge with Float System
The Urgent Project for Rehabilitation of Yangon Port and FINAL REPORT Main Inland Water Transport in the Republic of the Union of Myanmar MAIN REPORT
Nippon Koei/OCDI 12-34
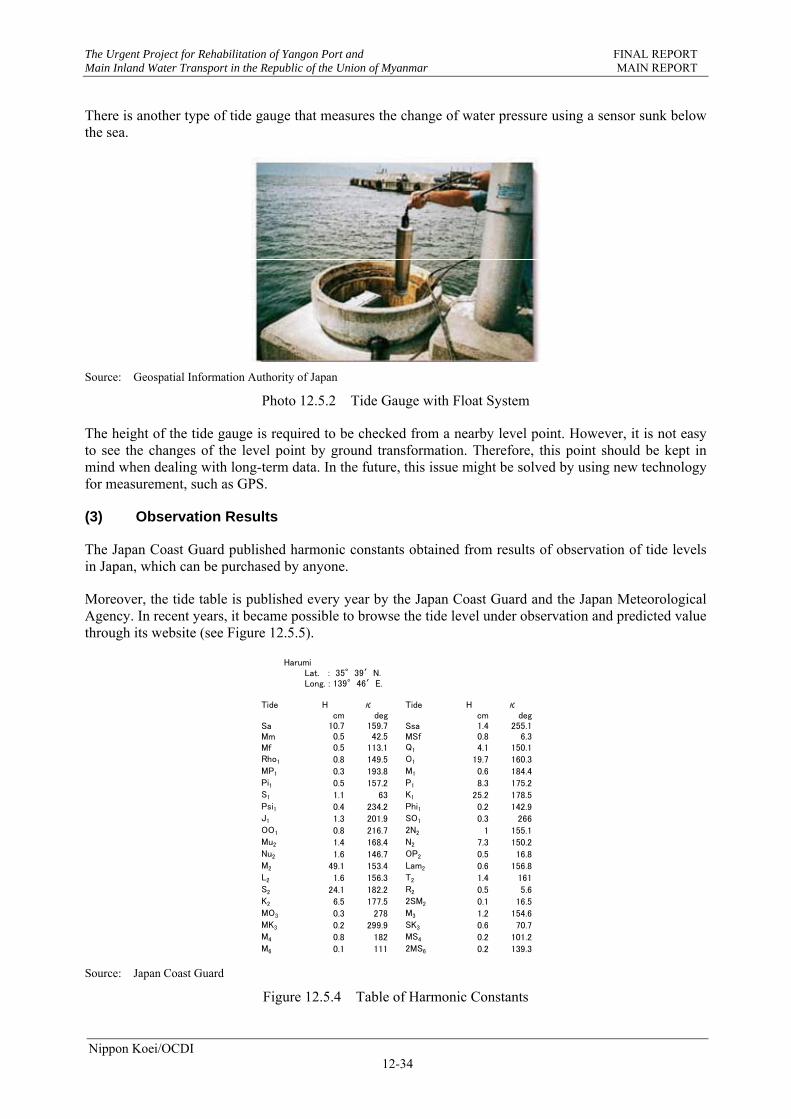
There is another type of tide gauge that measures the change of water pressure using a sensor sunk below the sea.
Source: Geospatial Information Authority of Japan
Photo 12.5.2 Tide Gauge with Float System
The height of the tide gauge is required to be checked from a nearby level point. However, it is not easy to see the changes of the level point by ground transformation. Therefore, this point should be kept in mind when dealing with long-term data. In the future, this issue might be solved by using new technology for measurement, such as GPS.
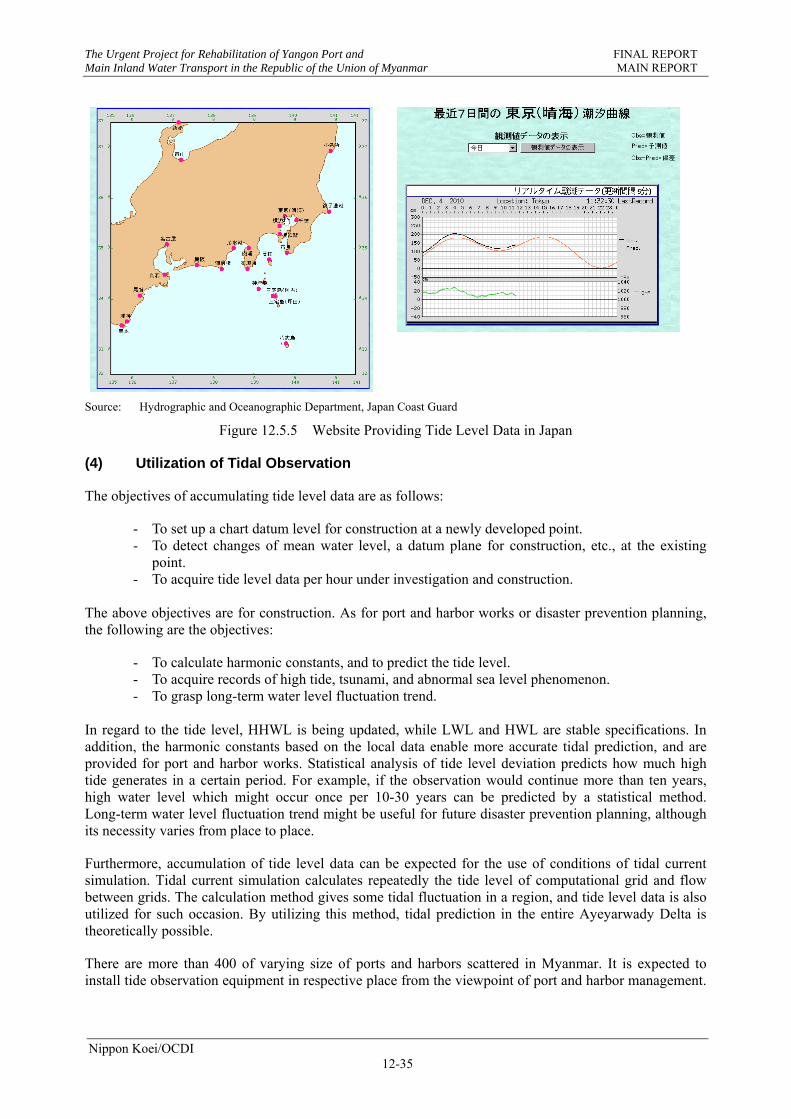
(3) Observation Results
The Japan Coast Guard published harmonic constants obtained from results of observation of tide levels in Japan, which can be purchased by anyone.
Moreover, the tide table is published every year by the Japan Coast Guard and the Japan Meteorological Agency. In recent years, it became possible to browse the tide level under observation and predicted value through its website (see Figure 12.5.5).
Source: Japan Coast Guard
Figure 12.5.4 Table of Harmonic Constants
HarumiLat. : 35°39′N.Long. : 139°46′E.
Tide H κ Tide H κcm deg cm deg
Sa 10.7 159.7 Ssa 1.4 255.1Mm 0.5 42.5 MSf 0.8 6.3Mf 0.5 113.1 Q1 4.1 150.1Rho1 0.8 149.5 O1 19.7 160.3MP1 0.3 193.8 M1 0.6 184.4Pi1 0.5 157.2 P1 8.3 175.2S1 1.1 63 K1 25.2 178.5Psi1 0.4 234.2 Phi1 0.2 142.9J1 1.3 201.9 SO1 0.3 266OO1 0.8 216.7 2N2 1 155.1Mu2 1.4 168.4 N2 7.3 150.2Nu2 1.6 146.7 OP2 0.5 16.8M2 49.1 153.4 Lam2 0.6 156.8L2 1.6 156.3 T2 1.4 161S2 24.1 182.2 R2 0.5 5.6K2 6.5 177.5 2SM2 0.1 16.5MO3 0.3 278 M3 1.2 154.6MK3 0.2 299.9 SK3 0.6 70.7M4 0.8 182 MS4 0.2 101.2M6 0.1 111 2MS6 0.2 139.3
The Urgent Project for Rehabilitation of Yangon Port and FINAL REPORT Main Inland Water Transport in the Republic of the Union of Myanmar MAIN REPORT
Nippon Koei/OCDI 12-35
Source: Hydrographic and Oceanographic Department, Japan Coast Guard
Figure 12.5.5 Website Providing Tide Level Data in Japan
(4) Utilization of Tidal Observation
The objectives of accumulating tide level data are as follows:
- To set up a chart datum level for construction at a newly developed point. - To detect changes of mean water level, a datum plane for construction, etc., at the existing
point. - To acquire tide level data per hour under investigation and construction.
The above objectives are for construction. As for port and harbor works or disaster prevention planning, the following are the objectives:
- To calculate harmonic constants, and to predict the tide level. - To acquire records of high tide, tsunami, and abnormal sea level phenomenon. - To grasp long-term water level fluctuation trend.
In regard to the tide level, HHWL is being updated, while LWL and HWL are stable specifications. In addition, the harmonic constants based on the local data enable more accurate tidal prediction, and are provided for port and harbor works. Statistical analysis of tide level deviation predicts how much high tide generates in a certain period. For example, if the observation would continue more than ten years, high water level which might occur once per 10-30 years can be predicted by a statistical method. Long-term water level fluctuation trend might be useful for future disaster prevention planning, although its necessity varies from place to place.
Furthermore, accumulation of tide level data can be expected for the use of conditions of tidal current simulation. Tidal current simulation calculates repeatedly the tide level of computational grid and flow between grids. The calculation method gives some tidal fluctuation in a region, and tide level data is also utilized for such occasion. By utilizing this method, tidal prediction in the entire Ayeyarwady Delta is theoretically possible.
There are more than 400 of varying size of ports and harbors scattered in Myanmar. It is expected to install tide observation equipment in respective place from the viewpoint of port and harbor management.
The Urgent Project for Rehabilitation of Yangon Port and FINAL REPORT Main Inland Water Transport in the Republic of the Union of Myanmar MAIN REPORT
Nippon Koei/OCDI 12-36
However, it must be impossible to realize early installation of them. Therefore, it would be reasonable to consider how to cover the thin observation network by numeric simulation.
12.5.2 PROPOSAL OF TIDE OBSERVATION SYSTEM IN MYANMAR
(1) Medium/Long-Term Plans
The tide observation is important not only for the establishment of chart datum, but also for the disaster prevention information system. Continuous observations are necessary in major ports. Therefore, the JICA Project Team proposed medium/long-term plans for improvement of the tide observation system in Myanmar as follows:
- Tide stations, which can regularly observe tide levels, with the function of disaster prevention are installed. The function of disaster prevention means automatic measuring, recording, and transmission of meteorological and hydrographic data on disasters such as tsunamis, storm surges, and floods.
- The tide fluctuations can be different among neighboring points due to topography or the resonance phenomenon in inner bays or rivers. Dense installation of supplemental stations on the coast line or the Ayeyarwady Delta and continuous observation for more than one year at each point are proposed.
Tide observation for 19 years is theoretically required for tide analysis. On the other hand, the chart datum is practically prepared based on five years of observation, in the case of the Japan Meteorological Agency. Updating of tide tables of major ports through the analysis of the five-year records of the above proposed stations is recommended.
(2) Short-Term Plan
1) Yangon Port
Yangon Port, which deals 90% of cargo, is the most important port among the nine international ports in Myanmar. The implementation of a tide observation system in Yangon Port should be prioritized. In the Project, the temporal tide stations at Monkey Point and MITT, located upstream and midstream of the Yangon River respectively, were installed, and tide observation by automatic gauges, granted by the Project, was conducted. Consequently, the existing tide tables were verified with the observation data, and the comparison revealed the characteristics of the tide in Yangon Port. The importance of tide observation systems was also recognized.
2) Other Ports
In the Project, Yangon Port was mainly studied due to the limitation of the study area and transfer to rural areas. However, the JICA Project Team recognized the importance of tide observation system in the other ports as described in the proposal of medium/long-term plans. As a first step for the establishment of tide observation system, temporal observations for one month at each port in sequence with the automatic gauge granted by the Project is proposed. The importance of ports, construction costs, and accuracy of existing data compared with the observed data are analyzed. The installation priority order of each station is finally studied.
The Urgent Project for Rehabilitation of Yangon Port and FINAL REPORT Main Inland Water Transport in the Republic of the Union of Myanmar MAIN REPORT
Nippon Koei/OCDI 12-37
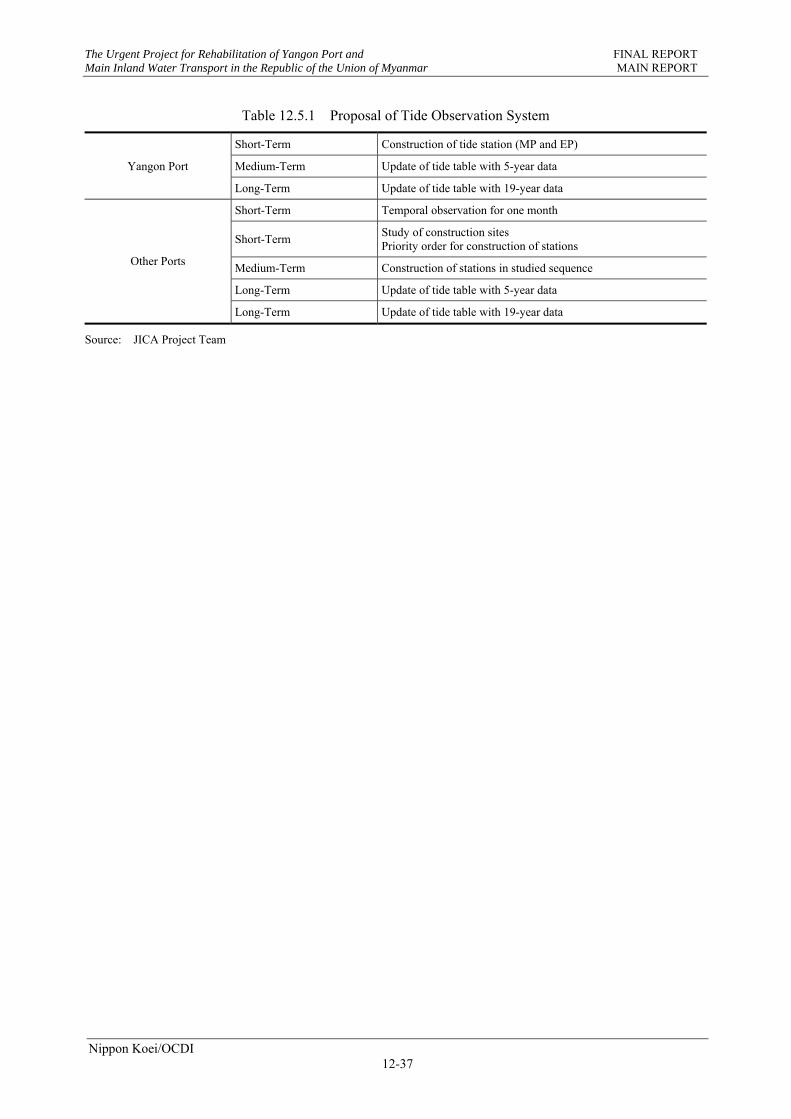
Table 12.5.1 Proposal of Tide Observation System
Yangon Port
Short-Term Construction of tide station (MP and EP)
Medium-Term Update of tide table with 5-year data
Long-Term Update of tide table with 19-year data
Other Ports
Short-Term Temporal observation for one month
Short-Term Study of construction sites Priority order for construction of stations
Medium-Term Construction of stations in studied sequence
Long-Term Update of tide table with 5-year data
Long-Term Update of tide table with 19-year data
Source: JICA Project Team
CHAPTER 13
DESIGN AND IMPLEMENTATION OF PILOT PROJECT FOR JETTY RESTORATION
The Urgent Project for Rehabilitation of Yangon Port and FINAL REPORT Main Inland Water Transport in the Republic of the Union of Myanmar MAIN REPORT
Nippon Koei/OCDI 13-1
CHAPTER 13 DESIGN AND IMPLEMENTATION OF PILOT PROJECT FOR JETTY RESTORATION
13.1 GENERAL
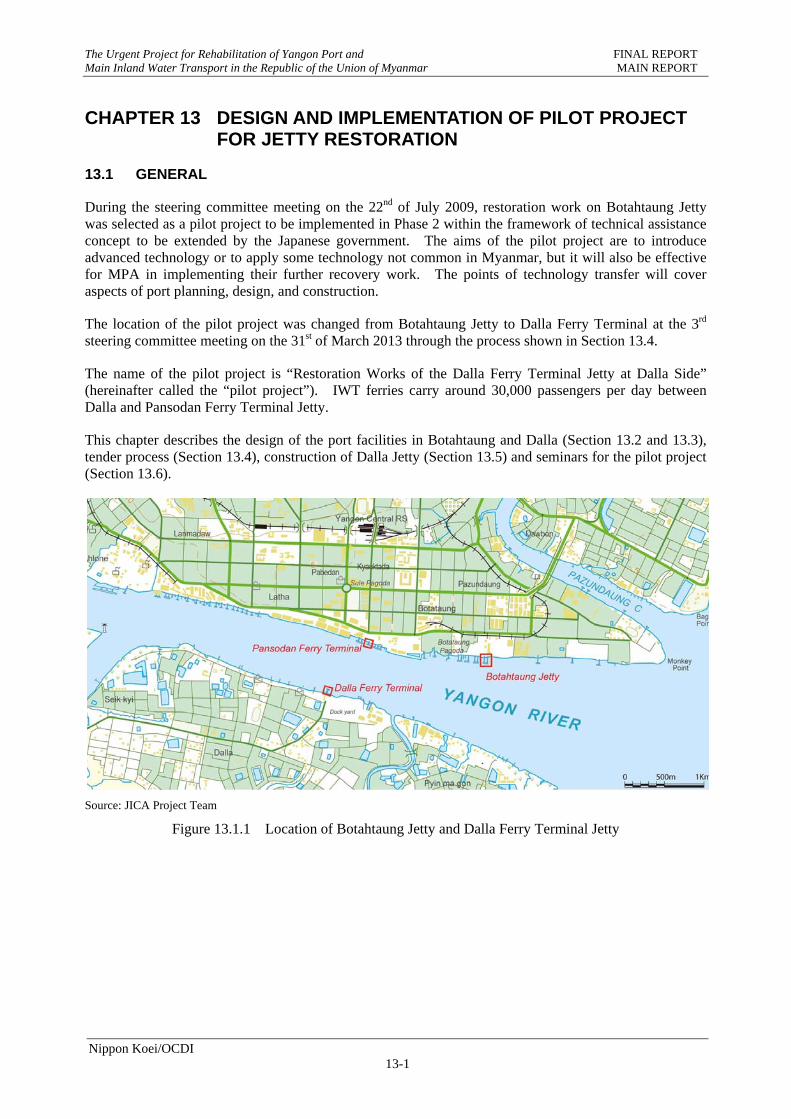
During the steering committee meeting on the 22nd of July 2009, restoration work on Botahtaung Jetty was selected as a pilot project to be implemented in Phase 2 within the framework of technical assistance concept to be extended by the Japanese government. The aims of the pilot project are to introduce advanced technology or to apply some technology not common in Myanmar, but it will also be effective for MPA in implementing their further recovery work. The points of technology transfer will cover aspects of port planning, design, and construction.
The location of the pilot project was changed from Botahtaung Jetty to Dalla Ferry Terminal at the 3rd steering committee meeting on the 31st of March 2013 through the process shown in Section 13.4.
The name of the pilot project is “Restoration Works of the Dalla Ferry Terminal Jetty at Dalla Side” (hereinafter called the “pilot project”). IWT ferries carry around 30,000 passengers per day between Dalla and Pansodan Ferry Terminal Jetty.
This chapter describes the design of the port facilities in Botahtaung and Dalla (Section 13.2 and 13.3), tender process (Section 13.4), construction of Dalla Jetty (Section 13.5) and seminars for the pilot project (Section 13.6).
Source: JICA Project Team
Figure 13.1.1 Location of Botahtaung Jetty and Dalla Ferry Terminal Jetty

The Urgent Project for Rehabilitation of Yangon Port and FINAL REPORT Main Inland Water Transport in the Republic of the Union of Myanmar MAIN REPORT
Nippon Koei/OCDI 13-2
Source: JICA Project Team
Figure 13.1.2 3D View of Planed Botahtaung Jetty
Source: JICA Project Team
Figure 13.1.3 3D View of the Dalla Ferry Terminal
The Urgent Project for Rehabilitation of Yangon Port and FINAL REPORT Main Inland Water Transport in the Republic of the Union of Myanmar MAIN REPORT
Nippon Koei/OCDI 13-3
13.2 NATURAL CONDITIONS
13.2.1 METEOROLOGICAL CONDITIONS
(1) Rainfall, Temperature, Humidity and Wind
Myanmar is located between the latitude of 10º and 28º N and between the longitude of 92º and 100º E. The port of Yangon is situated at latitude 16º47' N and longitude 96º15' E on the Yangon River and about 32 km from the Elephant Point on the Gulf of Martaban.
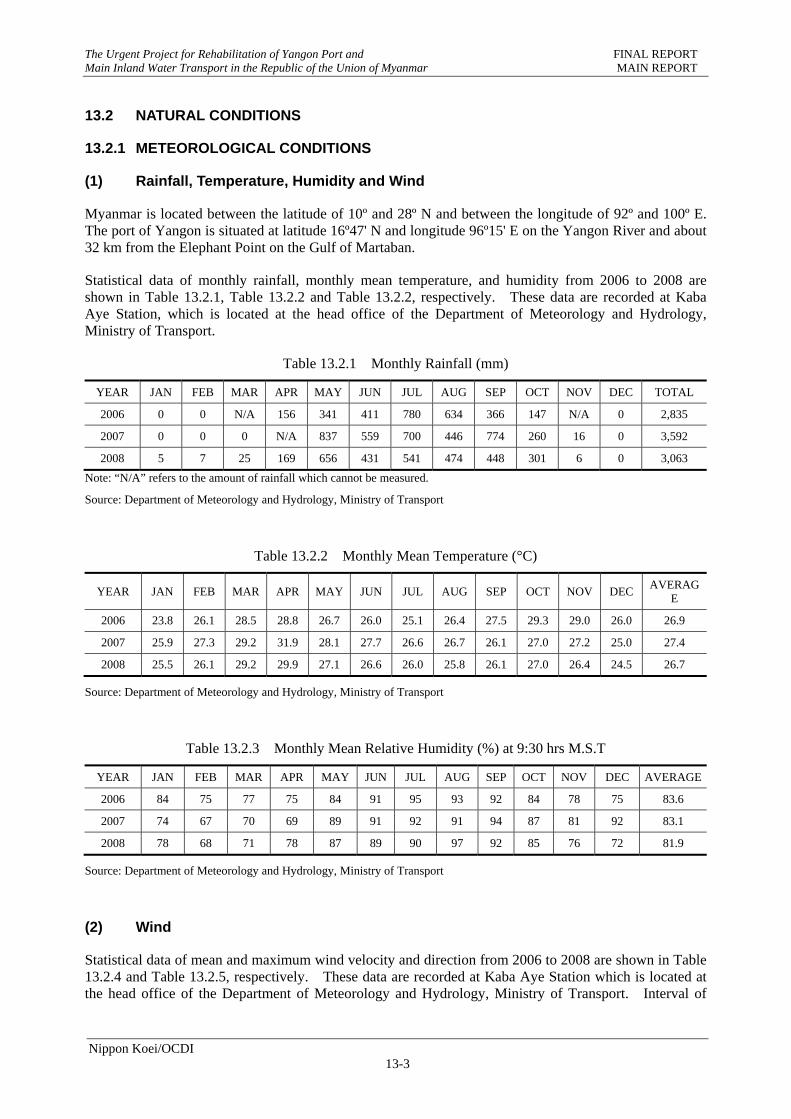
Statistical data of monthly rainfall, monthly mean temperature, and humidity from 2006 to 2008 are shown in Table 13.2.1, Table 13.2.2 and Table 13.2.2, respectively. These data are recorded at Kaba Aye Station, which is located at the head office of the Department of Meteorology and Hydrology, Ministry of Transport.
Table 13.2.1 Monthly Rainfall (mm)
YEAR JAN FEB MAR APR MAY JUN JUL AUG SEP OCT NOV DEC TOTAL
2006 0 0 N/A 156 341 411 780 634 366 147 N/A 0 2,835
2007 0 0 0 N/A 837 559 700 446 774 260 16 0 3,592
2008 5 7 25 169 656 431 541 474 448 301 6 0 3,063
Note: “N/A” refers to the amount of rainfall which cannot be measured.
Source: Department of Meteorology and Hydrology, Ministry of Transport
Table 13.2.2 Monthly Mean Temperature (°C)
YEAR JAN FEB MAR APR MAY JUN JUL AUG SEP OCT NOV DEC AVERAG
E
2006 23.8 26.1 28.5 28.8 26.7 26.0 25.1 26.4 27.5 29.3 29.0 26.0 26.9
2007 25.9 27.3 29.2 31.9 28.1 27.7 26.6 26.7 26.1 27.0 27.2 25.0 27.4
2008 25.5 26.1 29.2 29.9 27.1 26.6 26.0 25.8 26.1 27.0 26.4 24.5 26.7
Source: Department of Meteorology and Hydrology, Ministry of Transport
Table 13.2.3 Monthly Mean Relative Humidity (%) at 9:30 hrs M.S.T
YEAR JAN FEB MAR APR MAY JUN JUL AUG SEP OCT NOV DEC AVERAGE
2006 84 75 77 75 84 91 95 93 92 84 78 75 83.6
2007 74 67 70 69 89 91 92 91 94 87 81 92 83.1
2008 78 68 71 78 87 89 90 97 92 85 76 72 81.9
Source: Department of Meteorology and Hydrology, Ministry of Transport
(2) Wind
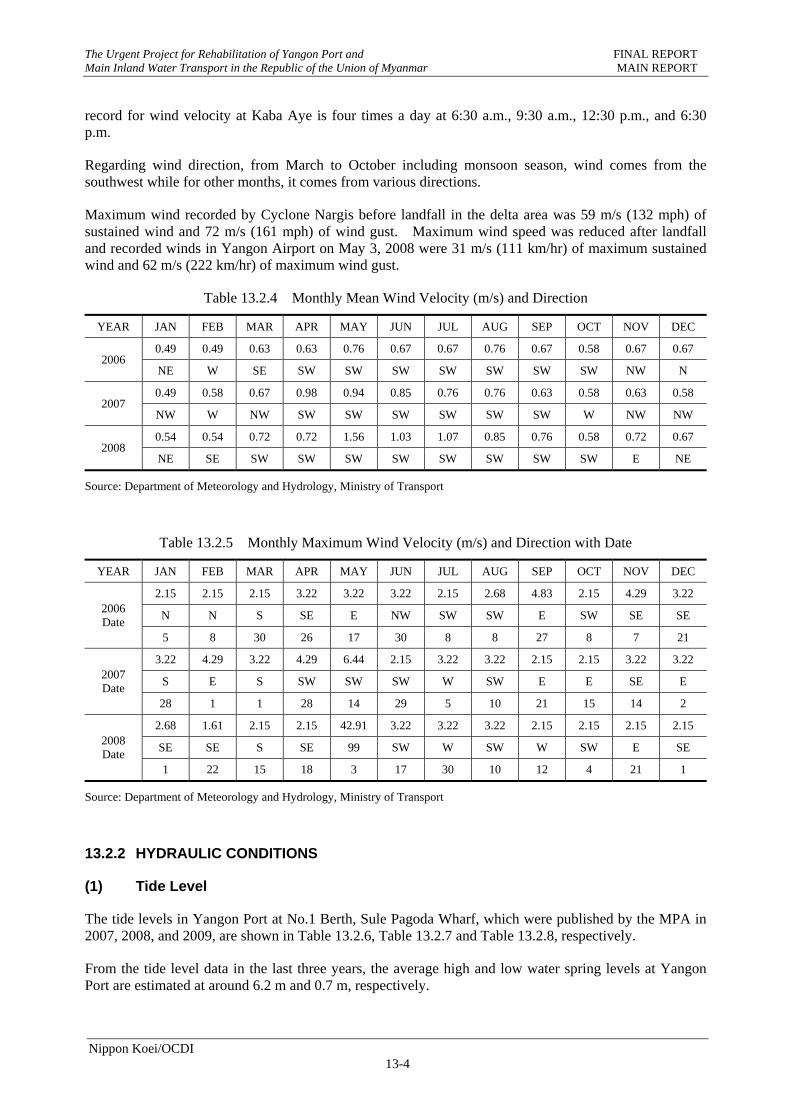
Statistical data of mean and maximum wind velocity and direction from 2006 to 2008 are shown in Table 13.2.4 and Table 13.2.5, respectively. These data are recorded at Kaba Aye Station which is located at the head office of the Department of Meteorology and Hydrology, Ministry of Transport. Interval of
The Urgent Project for Rehabilitation of Yangon Port and FINAL REPORT Main Inland Water Transport in the Republic of the Union of Myanmar MAIN REPORT
Nippon Koei/OCDI 13-4
record for wind velocity at Kaba Aye is four times a day at 6:30 a.m., 9:30 a.m., 12:30 p.m., and 6:30 p.m.
Regarding wind direction, from March to October including monsoon season, wind comes from the southwest while for other months, it comes from various directions.
Maximum wind recorded by Cyclone Nargis before landfall in the delta area was 59 m/s (132 mph) of sustained wind and 72 m/s (161 mph) of wind gust. Maximum wind speed was reduced after landfall and recorded winds in Yangon Airport on May 3, 2008 were 31 m/s (111 km/hr) of maximum sustained wind and 62 m/s (222 km/hr) of maximum wind gust.
Table 13.2.4 Monthly Mean Wind Velocity (m/s) and Direction
YEAR JAN FEB MAR APR MAY JUN JUL AUG SEP OCT NOV DEC
2006 0.49 0.49 0.63 0.63 0.76 0.67 0.67 0.76 0.67 0.58 0.67 0.67
NE W SE SW SW SW SW SW SW SW NW N
2007 0.49 0.58 0.67 0.98 0.94 0.85 0.76 0.76 0.63 0.58 0.63 0.58
NW W NW SW SW SW SW SW SW W NW NW
2008 0.54 0.54 0.72 0.72 1.56 1.03 1.07 0.85 0.76 0.58 0.72 0.67
NE SE SW SW SW SW SW SW SW SW E NE
Source: Department of Meteorology and Hydrology, Ministry of Transport
Table 13.2.5 Monthly Maximum Wind Velocity (m/s) and Direction with Date
YEAR JAN FEB MAR APR MAY JUN JUL AUG SEP OCT NOV DEC
2006 Date
2.15 2.15 2.15 3.22 3.22 3.22 2.15 2.68 4.83 2.15 4.29 3.22
N N S SE E NW SW SW E SW SE SE
5 8 30 26 17 30 8 8 27 8 7 21
2007 Date
3.22 4.29 3.22 4.29 6.44 2.15 3.22 3.22 2.15 2.15 3.22 3.22
S E S SW SW SW W SW E E SE E
28 1 1 28 14 29 5 10 21 15 14 2
2008 Date
2.68 1.61 2.15 2.15 42.91 3.22 3.22 3.22 2.15 2.15 2.15 2.15
SE SE S SE 99 SW W SW W SW E SE
1 22 15 18 3 17 30 10 12 4 21 1
Source: Department of Meteorology and Hydrology, Ministry of Transport
13.2.2 HYDRAULIC CONDITIONS
(1) Tide Level
The tide levels in Yangon Port at No.1 Berth, Sule Pagoda Wharf, which were published by the MPA in 2007, 2008, and 2009, are shown in Table 13.2.6, Table 13.2.7 and Table 13.2.8, respectively.
From the tide level data in the last three years, the average high and low water spring levels at Yangon Port are estimated at around 6.2 m and 0.7 m, respectively.
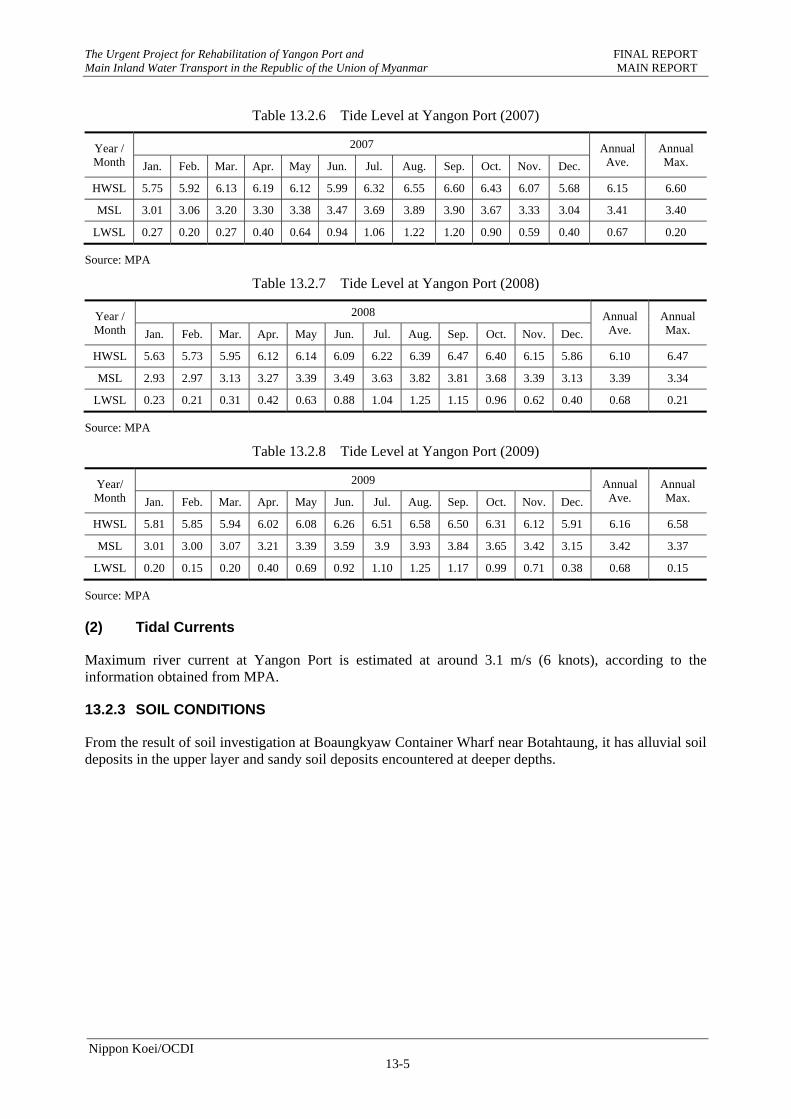
The Urgent Project for Rehabilitation of Yangon Port and FINAL REPORT Main Inland Water Transport in the Republic of the Union of Myanmar MAIN REPORT
Nippon Koei/OCDI 13-5
Table 13.2.6 Tide Level at Yangon Port (2007)
Year / Month
2007 Annual Ave.
Annual Max. Jan. Feb. Mar. Apr. May Jun. Jul. Aug. Sep. Oct. Nov. Dec.
HWSL 5.75 5.92 6.13 6.19 6.12 5.99 6.32 6.55 6.60 6.43 6.07 5.68 6.15 6.60
MSL 3.01 3.06 3.20 3.30 3.38 3.47 3.69 3.89 3.90 3.67 3.33 3.04 3.41 3.40
LWSL 0.27 0.20 0.27 0.40 0.64 0.94 1.06 1.22 1.20 0.90 0.59 0.40 0.67 0.20
Source: MPA
Table 13.2.7 Tide Level at Yangon Port (2008)
Year / Month
2008 Annual Ave.
AnnualMax. Jan. Feb. Mar. Apr. May Jun. Jul. Aug. Sep. Oct. Nov. Dec.
HWSL 5.63 5.73 5.95 6.12 6.14 6.09 6.22 6.39 6.47 6.40 6.15 5.86 6.10 6.47
MSL 2.93 2.97 3.13 3.27 3.39 3.49 3.63 3.82 3.81 3.68 3.39 3.13 3.39 3.34
LWSL 0.23 0.21 0.31 0.42 0.63 0.88 1.04 1.25 1.15 0.96 0.62 0.40 0.68 0.21
Source: MPA
Table 13.2.8 Tide Level at Yangon Port (2009)
Year/ Month
2009 Annual Ave.
AnnualMax. Jan. Feb. Mar. Apr. May Jun. Jul. Aug. Sep. Oct. Nov. Dec.
HWSL 5.81 5.85 5.94 6.02 6.08 6.26 6.51 6.58 6.50 6.31 6.12 5.91 6.16 6.58
MSL 3.01 3.00 3.07 3.21 3.39 3.59 3.9 3.93 3.84 3.65 3.42 3.15 3.42 3.37
LWSL 0.20 0.15 0.20 0.40 0.69 0.92 1.10 1.25 1.17 0.99 0.71 0.38 0.68 0.15
Source: MPA
(2) Tidal Currents
Maximum river current at Yangon Port is estimated at around 3.1 m/s (6 knots), according to the information obtained from MPA.
13.2.3 SOIL CONDITIONS
From the result of soil investigation at Boaungkyaw Container Wharf near Botahtaung, it has alluvial soil deposits in the upper layer and sandy soil deposits encountered at deeper depths.
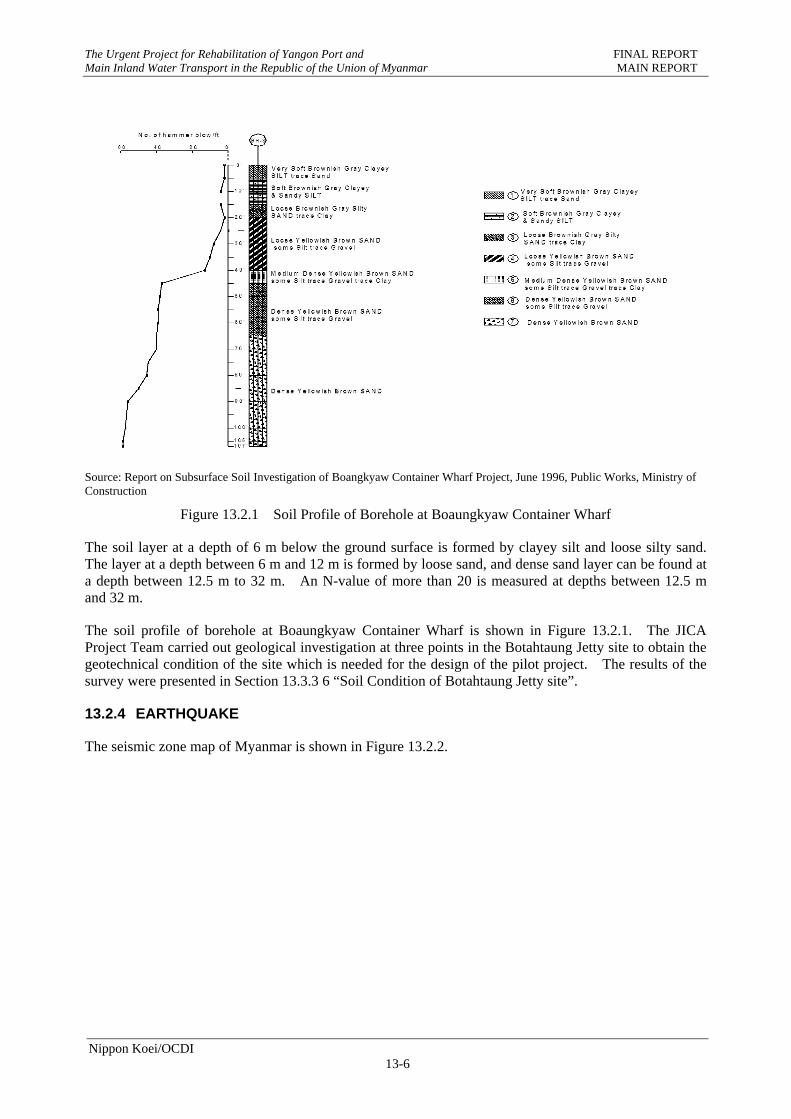
The Urgent Project for Rehabilitation of Yangon Port and FINAL REPORT Main Inland Water Transport in the Republic of the Union of Myanmar MAIN REPORT
Nippon Koei/OCDI 13-6
Source: Report on Subsurface Soil Investigation of Boangkyaw Container Wharf Project, June 1996, Public Works, Ministry of Construction
Figure 13.2.1 Soil Profile of Borehole at Boaungkyaw Container Wharf
The soil layer at a depth of 6 m below the ground surface is formed by clayey silt and loose silty sand. The layer at a depth between 6 m and 12 m is formed by loose sand, and dense sand layer can be found at a depth between 12.5 m to 32 m. An N-value of more than 20 is measured at depths between 12.5 m and 32 m.
The soil profile of borehole at Boaungkyaw Container Wharf is shown in Figure 13.2.1. The JICA Project Team carried out geological investigation at three points in the Botahtaung Jetty site to obtain the geotechnical condition of the site which is needed for the design of the pilot project. The results of the survey were presented in Section 13.3.3 6 “Soil Condition of Botahtaung Jetty site”.
13.2.4 EARTHQUAKE
The seismic zone map of Myanmar is shown in Figure 13.2.2.
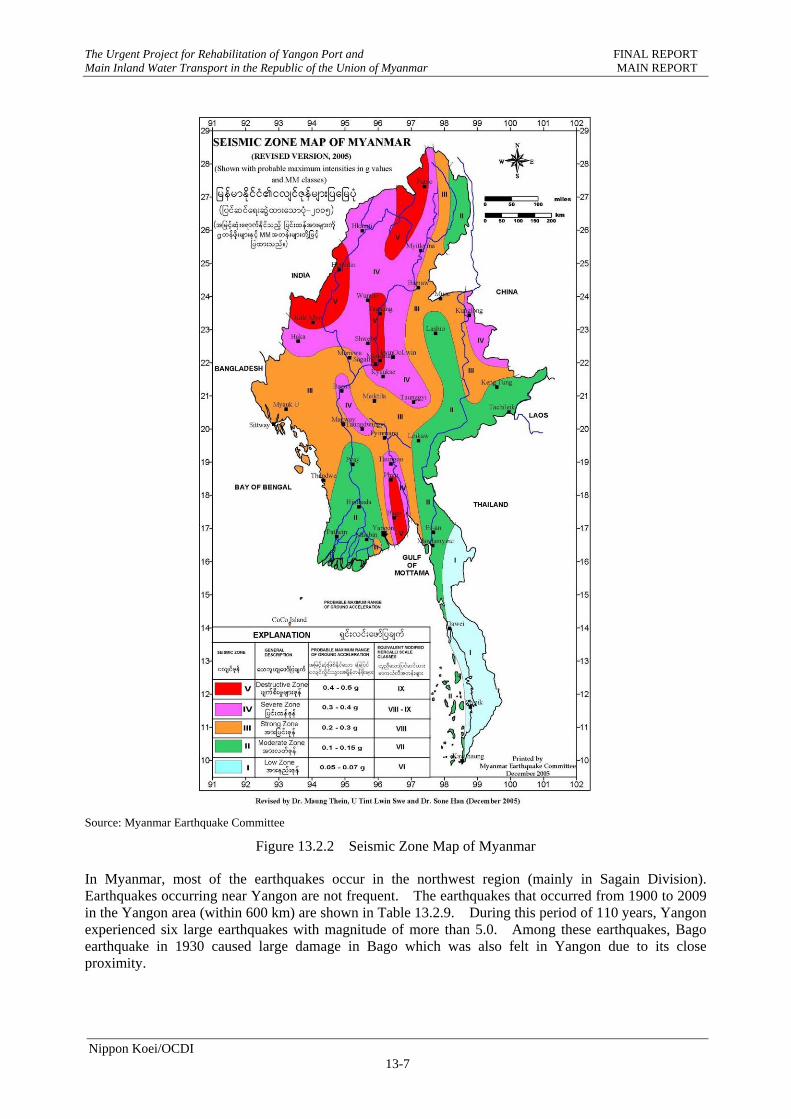
The Urgent Project for Rehabilitation of Yangon Port and FINAL REPORT Main Inland Water Transport in the Republic of the Union of Myanmar MAIN REPORT
Nippon Koei/OCDI 13-7
Source: Myanmar Earthquake Committee
Figure 13.2.2 Seismic Zone Map of Myanmar
In Myanmar, most of the earthquakes occur in the northwest region (mainly in Sagain Division). Earthquakes occurring near Yangon are not frequent. The earthquakes that occurred from 1900 to 2009 in the Yangon area (within 600 km) are shown in Table 13.2.9. During this period of 110 years, Yangon experienced six large earthquakes with magnitude of more than 5.0. Among these earthquakes, Bago earthquake in 1930 caused large damage in Bago which was also felt in Yangon due to its close proximity.
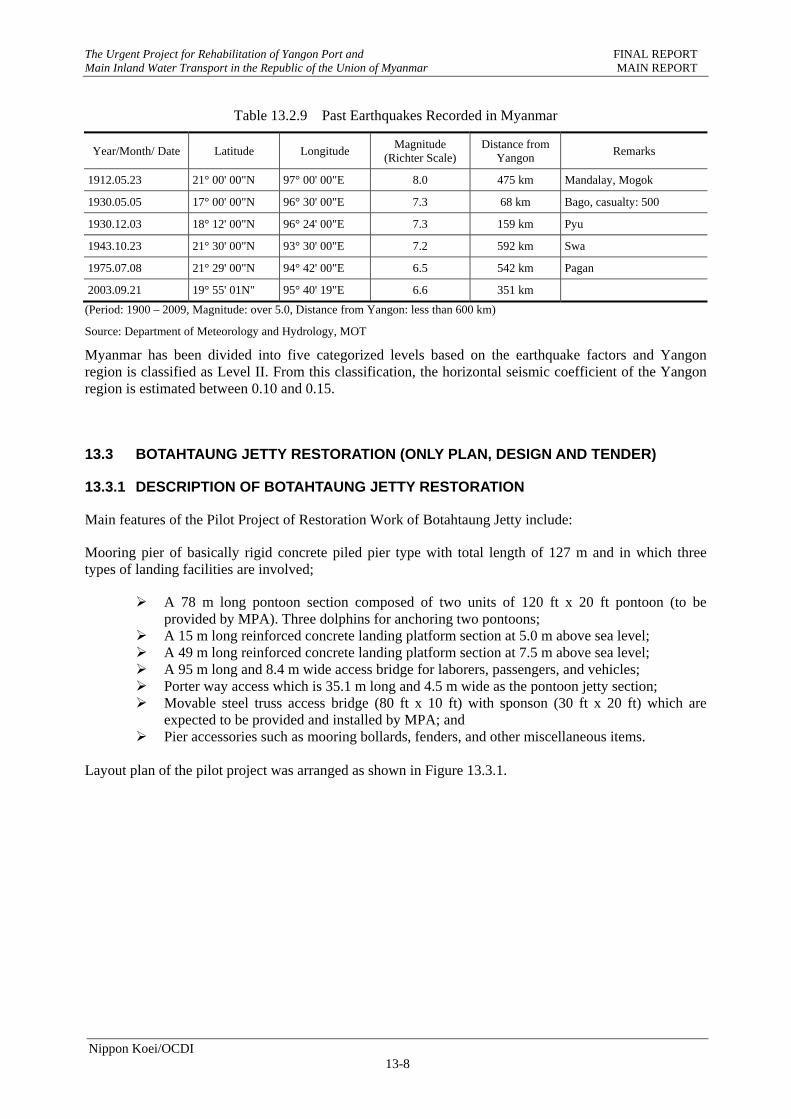
The Urgent Project for Rehabilitation of Yangon Port and FINAL REPORT Main Inland Water Transport in the Republic of the Union of Myanmar MAIN REPORT
Nippon Koei/OCDI 13-8
Table 13.2.9 Past Earthquakes Recorded in Myanmar
Year/Month/ Date Latitude Longitude Magnitude
(Richter Scale) Distance from
Yangon Remarks
1912.05.23 21° 00' 00"N 97° 00' 00"E 8.0 475 km Mandalay, Mogok
1930.05.05 17° 00' 00"N 96° 30' 00"E 7.3 68 km Bago, casualty: 500
1930.12.03 18° 12' 00"N 96° 24' 00"E 7.3 159 km Pyu
1943.10.23 21° 30' 00"N 93° 30' 00"E 7.2 592 km Swa
1975.07.08 21° 29' 00"N 94° 42' 00"E 6.5 542 km Pagan
2003.09.21 19° 55' 01N" 95° 40' 19"E 6.6 351 km
(Period: 1900 – 2009, Magnitude: over 5.0, Distance from Yangon: less than 600 km)
Source: Department of Meteorology and Hydrology, MOT
Myanmar has been divided into five categorized levels based on the earthquake factors and Yangon region is classified as Level II. From this classification, the horizontal seismic coefficient of the Yangon region is estimated between 0.10 and 0.15.
13.3 BOTAHTAUNG JETTY RESTORATION (ONLY PLAN, DESIGN AND TENDER)
13.3.1 DESCRIPTION OF BOTAHTAUNG JETTY RESTORATION
Main features of the Pilot Project of Restoration Work of Botahtaung Jetty include:
Mooring pier of basically rigid concrete piled pier type with total length of 127 m and in which three types of landing facilities are involved;
A 78 m long pontoon section composed of two units of 120 ft x 20 ft pontoon (to be provided by MPA). Three dolphins for anchoring two pontoons;
A 15 m long reinforced concrete landing platform section at 5.0 m above sea level; A 49 m long reinforced concrete landing platform section at 7.5 m above sea level; A 95 m long and 8.4 m wide access bridge for laborers, passengers, and vehicles; Porter way access which is 35.1 m long and 4.5 m wide as the pontoon jetty section; Movable steel truss access bridge (80 ft x 10 ft) with sponson (30 ft x 20 ft) which are
expected to be provided and installed by MPA; and Pier accessories such as mooring bollards, fenders, and other miscellaneous items.
Layout plan of the pilot project was arranged as shown in Figure 13.3.1.
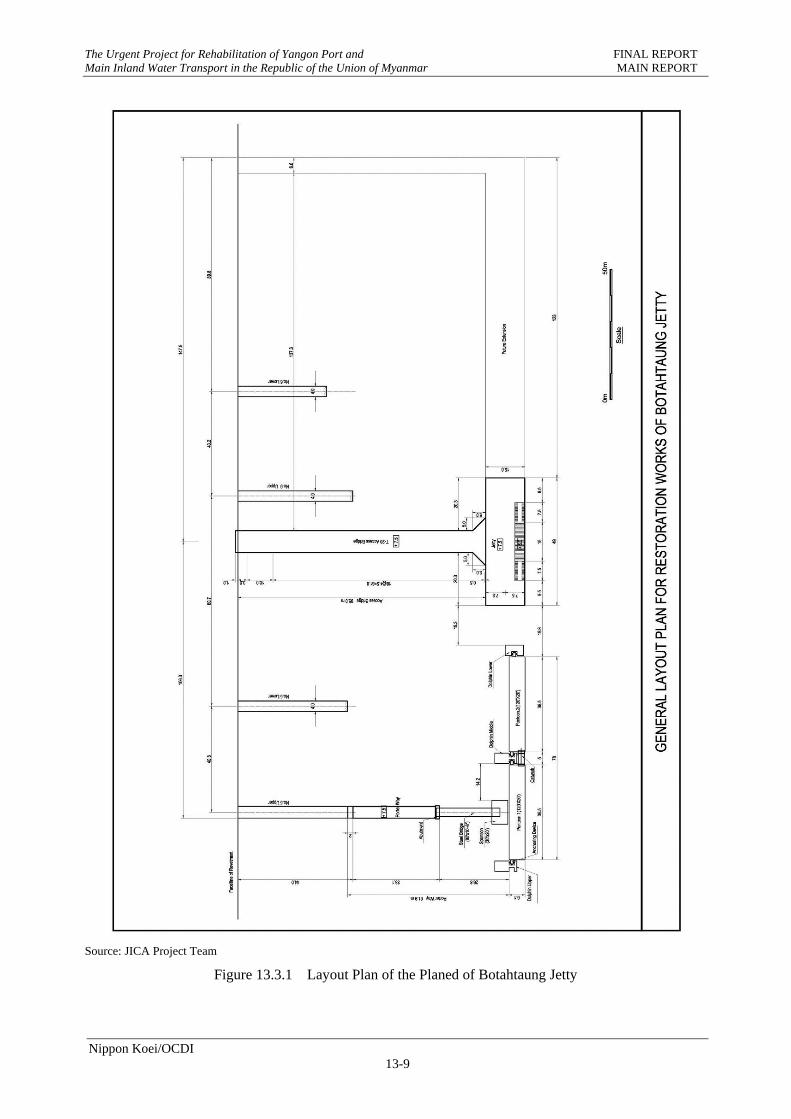
The Urgent Project for Rehabilitation of Yangon Port and FINAL REPORT Main Inland Water Transport in the Republic of the Union of Myanmar MAIN REPORT
Nippon Koei/OCDI 13-9
Source: JICA Project Team
Figure 13.3.1 Layout Plan of the Planed of Botahtaung Jetty
The Urgent Project for Rehabilitation of Yangon Port and FINAL REPORT Main Inland Water Transport in the Republic of the Union of Myanmar MAIN REPORT
Nippon Koei/OCDI 13-10
13.3.2 APPLICABLE STANDARDS, CODES AND SPECIFICATIONS
The structures of the pilot project were designed in accordance with the following standards and codes:
Technical Standards and Commentaries for Port and Harbor Facilities in Japan 1999 edition (TS), which is the primary standard applied for the design;
Japanese Industrial Standards (JIS); Standard Specifications for Concrete in Japan; Specifications for Highway Bridges V: Japan Road Association, Jan 2004; Standards of Japanese Geotechnical Society; and Guideline for the Design of Fenders Systems (2002).
All dimensions and weights used for the design and detailing of all items are in international system of units (S.I.), unless specified otherwise.
13.3.3 DESIGN CRITERIA
(1) Natural Condition
Design criteria covers various items of natural condition and are described hereinafter.
1) Tide
Design tidal levels are defined as shown below, based on the available tide table and information obtained from MPA.
Extremely High Water Level: +7.10 m (Nargis estimate) Highest High Water Level: +6.74 m (Sule Pagoda Wharf on 16 Aug. 1939) HWLS: +6.20 m Mean Water Level: +3.23 m (Sule Pagoda Wharf in 1954) LWLS: +0.34 m Low Water Spring Tide: ±0.00 m Lowest Low Water Level: -0.24 m (Bo Aung Kyaw Wharf in Dec. 1902)
2) Tidal Current
Maximum current speed is estimated at 6 knots (3 m/s) based mainly on the hearing from MPA.
3) Wind
The sustained maximum wind speed recorded at Yangon Airport was 30 m/s during Cyclone Nargis. The design wind speed was assumed by converting landside wind to river surface wind by multiplying a coefficient of 1.3. Based on the record at Yangon Airport, the design wind speed is assumed at 40 m/s (30 m/s x 1.3 = 40 m/s).
The design wind speed was applied for the wave hindcast analysis and estimation of wind pressure acting on the ships and pontoon.
4) Wave
Wave height is estimated by applying the SMB method. Design wind speed is assumed at 40 m/s for all directions.
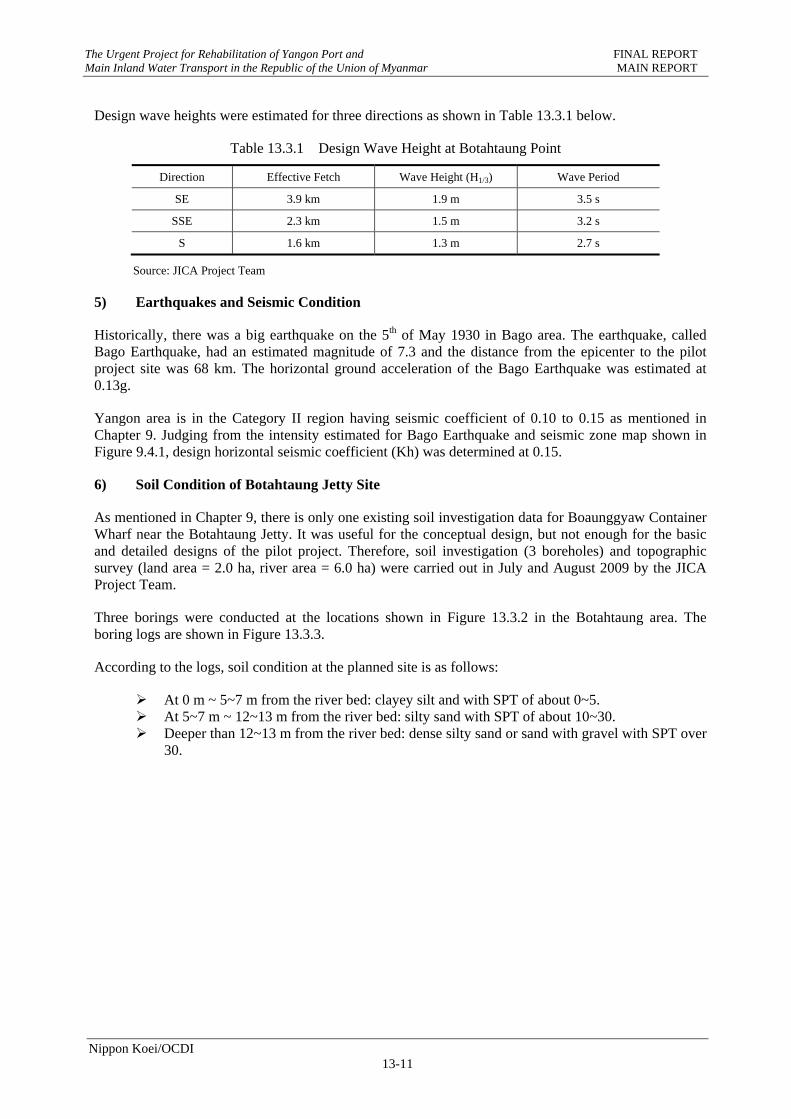
The Urgent Project for Rehabilitation of Yangon Port and FINAL REPORT Main Inland Water Transport in the Republic of the Union of Myanmar MAIN REPORT
Nippon Koei/OCDI 13-11
Design wave heights were estimated for three directions as shown in Table 13.3.1 below.
Table 13.3.1 Design Wave Height at Botahtaung Point
Direction Effective Fetch Wave Height (H1/3) Wave Period
SE 3.9 km 1.9 m 3.5 s
SSE 2.3 km 1.5 m 3.2 s
S 1.6 km 1.3 m 2.7 s
Source: JICA Project Team
5) Earthquakes and Seismic Condition
Historically, there was a big earthquake on the 5th of May 1930 in Bago area. The earthquake, called Bago Earthquake, had an estimated magnitude of 7.3 and the distance from the epicenter to the pilot project site was 68 km. The horizontal ground acceleration of the Bago Earthquake was estimated at 0.13g.
Yangon area is in the Category II region having seismic coefficient of 0.10 to 0.15 as mentioned in Chapter 9. Judging from the intensity estimated for Bago Earthquake and seismic zone map shown in Figure 9.4.1, design horizontal seismic coefficient (Kh) was determined at 0.15.
6) Soil Condition of Botahtaung Jetty Site
As mentioned in Chapter 9, there is only one existing soil investigation data for Boaunggyaw Container Wharf near the Botahtaung Jetty. It was useful for the conceptual design, but not enough for the basic and detailed designs of the pilot project. Therefore, soil investigation (3 boreholes) and topographic survey (land area = 2.0 ha, river area = 6.0 ha) were carried out in July and August 2009 by the JICA Project Team.
Three borings were conducted at the locations shown in Figure 13.3.2 in the Botahtaung area. The boring logs are shown in Figure 13.3.3.
According to the logs, soil condition at the planned site is as follows:
At 0 m ~ 5~7 m from the river bed: clayey silt and with SPT of about 0~5. At 5~7 m ~ 12~13 m from the river bed: silty sand with SPT of about 10~30. Deeper than 12~13 m from the river bed: dense silty sand or sand with gravel with SPT over
30.
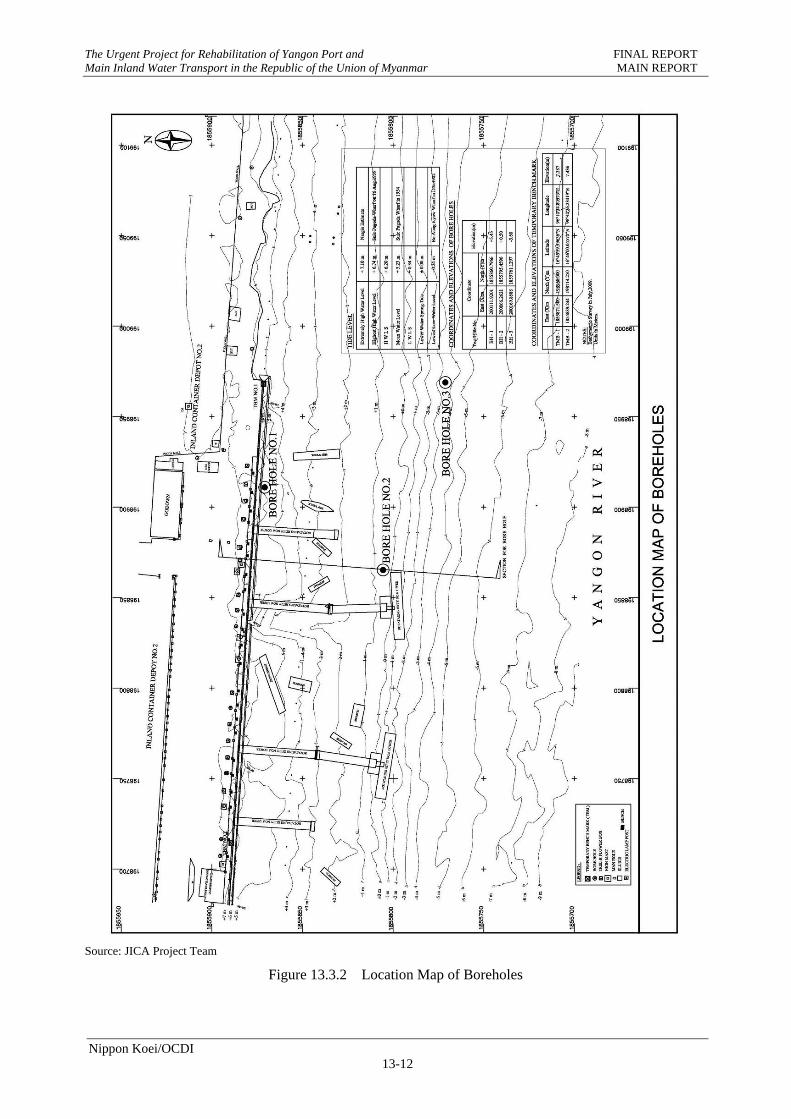
The Urgent Project for Rehabilitation of Yangon Port and FINAL REPORT Main Inland Water Transport in the Republic of the Union of Myanmar MAIN REPORT
Nippon Koei/OCDI 13-12
Source: JICA Project Team
Figure 13.3.2 Location Map of Boreholes
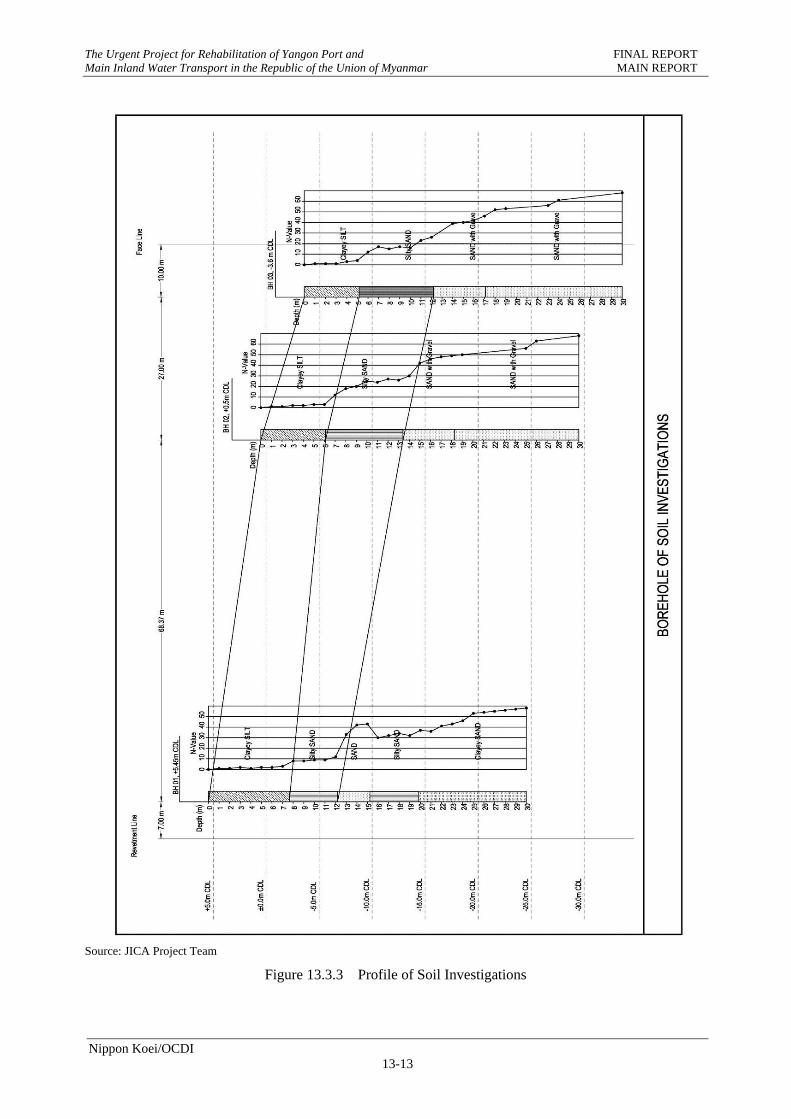
The Urgent Project for Rehabilitation of Yangon Port and FINAL REPORT Main Inland Water Transport in the Republic of the Union of Myanmar MAIN REPORT
Nippon Koei/OCDI 13-13
Source: JICA Project Team
Figure 13.3.3 Profile of Soil Investigations
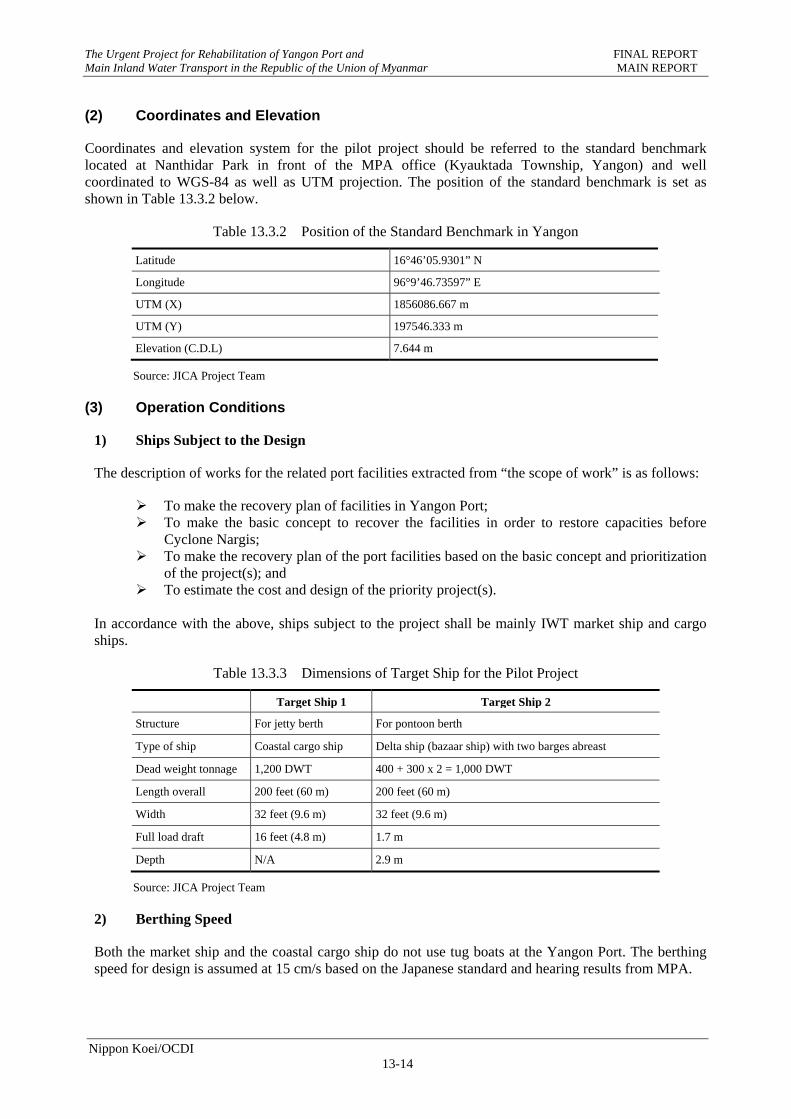
The Urgent Project for Rehabilitation of Yangon Port and FINAL REPORT Main Inland Water Transport in the Republic of the Union of Myanmar MAIN REPORT
Nippon Koei/OCDI 13-14
(2) Coordinates and Elevation
Coordinates and elevation system for the pilot project should be referred to the standard benchmark located at Nanthidar Park in front of the MPA office (Kyauktada Township, Yangon) and well coordinated to WGS-84 as well as UTM projection. The position of the standard benchmark is set as shown in Table 13.3.2 below.
Table 13.3.2 Position of the Standard Benchmark in Yangon
Latitude 16°46’05.9301” N
Longitude 96°9’46.73597” E
UTM (X) 1856086.667 m
UTM (Y) 197546.333 m
Elevation (C.D.L) 7.644 m
Source: JICA Project Team
(3) Operation Conditions
1) Ships Subject to the Design
The description of works for the related port facilities extracted from “the scope of work” is as follows:
To make the recovery plan of facilities in Yangon Port; To make the basic concept to recover the facilities in order to restore capacities before
Cyclone Nargis; To make the recovery plan of the port facilities based on the basic concept and prioritization
of the project(s); and To estimate the cost and design of the priority project(s).
In accordance with the above, ships subject to the project shall be mainly IWT market ship and cargo ships.
Table 13.3.3 Dimensions of Target Ship for the Pilot Project
Target Ship 1 Target Ship 2
Structure For jetty berth For pontoon berth
Type of ship Coastal cargo ship Delta ship (bazaar ship) with two barges abreast
Dead weight tonnage 1,200 DWT 400 + 300 x 2 = 1,000 DWT
Length overall 200 feet (60 m) 200 feet (60 m)
Width 32 feet (9.6 m) 32 feet (9.6 m)
Full load draft 16 feet (4.8 m) 1.7 m
Depth N/A 2.9 m
Source: JICA Project Team
2) Berthing Speed
Both the market ship and the coastal cargo ship do not use tug boats at the Yangon Port. The berthing speed for design is assumed at 15 cm/s based on the Japanese standard and hearing results from MPA.
The Urgent Project for Rehabilitation of Yangon Port and FINAL REPORT Main Inland Water Transport in the Republic of the Union of Myanmar MAIN REPORT
Nippon Koei/OCDI 13-15
3) Live Load
Design load is assumed at 20 tons of truck load on full load condition for the access bridge and jetty. The design live load is not considered for the porter way.
4) Surcharge
Design load of surcharge is assumed at 1.0 ton under normal conditions and 0.0 ton under seismic conditions.
13.3.4 DESIGN OF FACILITIES
(1) Design Concept
Basic concepts of the implementation of the pilot project are as follows:
To introduce new technology to the traditional system without large investment cost for the construction facilities, and
To utilize newly introduced technology to adopt for further recovery work as much as possible.
In this context, the following considerations were taken into account in selecting structural type and materials:
In selecting materials, locally available materials are given priority. Traditionally manufactured concrete piles (square pile) with maximum size of 40 cm x 40
cm were considered to be selected; and special piles like steel pipe pile, special featured concrete pile, and pre-stressed concrete piles were avoided.
It was considered that pile driving barges of MPA can be utilized for new structural design.
Design concept of the pilot project facilities is described below.
1) Structural Composition
The design ship (IWT market ship) has very small freeboard of only about 2 ft (0.6 m). In addition, cargo handling for this ship is performed manually.
In order to allow manual cargo handling, taking into consideration the high tidal range of about 6 m, the berthing facility shall be a structure such as a pontoon which can move vertically in accordance with the tidal fluctuation. However, anchoring system for the pontoon shall not be an anchor and chain system used for the existing pontoon jetties. The reason is that this system will not have sufficient pontoon holding capacity at a place where natural conditions are supposed to be severe like in Botahtaung area.
An anchoring dolphin system is considered appropriate to secure sufficient anchoring capacity for the pontoon portion. The anchoring dolphin system is composed of steel frames made up of anchoring devices with four rubber rollers inside each to allow smooth movement of the supporting columns that penetrate inside them.
A lower concrete floor with length of 15 m to accommodate manual cargo handling ships and cargo ships with gears during low tide conditions is provided in the concrete pier.
2) Water Depth
The water depth at the pier shall allow the design ships to berth in the pier at any tidal condition.
The Urgent Project for Rehabilitation of Yangon Port and FINAL REPORT Main Inland Water Transport in the Republic of the Union of Myanmar MAIN REPORT
Nippon Koei/OCDI 13-16
The maximum draft of the design ships is estimated at 4.2 m. In consideration of possible siltation near the pier which is supposed to increase due to the effect of piles driven for the pier, the design water depth is determined at about 5.0 m.
Length of the Jetty
Previously, there were three tank pontoon jetties, each 200 ft (60 m) long, at this location over a total length of 920 ft (270 m).
The particular configuration of the pier is as follow:
A set of pontoons approximately 75 m in length which accommodates IWT ships such as market ships;
A 7.5 m high concrete floor portion with length of 145 m (inclusive of margin for mooring) which accommodates two cargo ships with length of 200 ft (60 m) which are expected to use this jetty; and
A 15 m (30 m inclusive of stairs portion) long lower floor which accommodates fully loaded IWT cargo ships during low tide conditions.
The total length required for the concrete pier is 250 m (= 75 m + 145 m + 30 m).
Out of the 250 m long pier, the length subject to JICA’s pilot project is approximately 130 m.
3) Width of the Jetty
The width of the pier is determined taking into account the surface area utilization for cargo handling. To allow for mechanical cargo handling including truck traffic in the future, a width of 15 m at the concrete jetty section is determined.
4) Structure and Elevation of the Jetty
Considering the elevation of the existing pier at Botahtaung of about 7.2 m above CD and an anticipated extremely high water level of about 7.1 m during cyclones, an elevation of 7.5 m is determined for the concrete jetty.
Due to limited cargo hoisting height of cargo ships of about 5.4 m, a 7.5 m elevation pier could not be appropriate for cargo handling at lower tide situation. In order to accommodate cargo handling at lower tide situation, a lower elevation floor of 5.0 m above CD is determined.
The lower elevation floor will be submerged in water for several hours a day due to tide. As a result, soil particles in the river water are expected to be deposited on the floor. The deposited soil may create a slippery layer on the floor and this will result in danger to laborer activities. Grating structure for the lower floor section is adopted to avoid accumulation of soil particle deposits on the floor.
5) Pontoon
The pontoons are to be provided by MPA. In order to accommodate IWT market ships or similar ships, two pontoons will be installed. The pontoon available for the jetty is 120 ft (36 m) in length, 20 ft (6 m) in width, and 6.5 ft (2 m) in depth.
As indicated in above item “(1) Structural Composition”, the pontoons should be equipped with special anchoring devices. In addition, aluminum anodes are to be attached to the pontoons for cathodic protection.
The Urgent Project for Rehabilitation of Yangon Port and FINAL REPORT Main Inland Water Transport in the Republic of the Union of Myanmar MAIN REPORT
Nippon Koei/OCDI 13-17
6) Access to the Pier and Pontoons
A 95 m long access way to the pier shall allow 20 ton truck traffic. For securing smooth truck traffic, one access way should have a width of 8 m to allow two-way traffic. The remaining concrete pier section of the former jetty pier (No. 5 upper) is to be connected to the new pier for manual handling only without spending costs for the construction. The access way shall be constructed using concrete beams.
An 80 ft long steel truss bridge owned by MPA is provided for pedestrian access and gangway from the concrete pier portion to the pontoon portion.
7) Fender System and Bollards
Rubber fenders are to be installed on frames of the concrete pier. Large used rubber tires are to be hanged on the river side hulls of the pontoons as substitute fender.
Pontoons will be equipped with bollards, but additional bollards shall be installed on the concrete pier as necessary.
(2) Design of Pier Structures (Jetty, Access Bridge and Porter Way)
1) General
Based on the design criteria described in the previous section, the design work was carried out. For some works or structures, alternative methods and techniques are compared in order to determine the most suitable type.
2) Alternatives
The following alternative structures were considered:
- Alternative 1 - Concrete block type quay wall and reclamation, - Alternative 2 - Sheet pile type quay wall and reclamation, - Alternative 3 - Pile deck type.
The pile deck type is the most suitable in Yangon Port because of the soft soil condition, very high speed of river current, materials and construction equipment. Pile deck type is selected for the pilot project.
3) Design Conditions for the Jetty
Summary of design conditions for the jetty is shown in Table 13.3.4 below.
The Urgent Project for Rehabilitation of Yangon Port and FINAL REPORT Main Inland Water Transport in the Republic of the Union of Myanmar MAIN REPORT
Nippon Koei/OCDI 13-18
Table 13.3.4 Design Conditions for the Jetty
Tide HHWL = +7.1 m, HWL = +6.20 m, MSL = +3.23 m, LWL = +0.34 m
Maximum current 6 knots (3 m/s)
Wave significant height 1.90 m
Wave period 3.5 s
Ship size 1 General Cargo Ship (1,200 DWT)
Berthing speed 0.15 m/s
Fender size H = 300 mm
Bollard size 25 ton
Live load T20 Truck
Surcharge 1.0 ton/m2 for ordinal condition and 0 ton/m2 for seismic condition
Crown level +7.5 m and +5.0 m
Existing riverbed level -5.0 m ~ -2.4 m CDL
Subsoil conditions Soft clayey SILT, N average = 2 (riverbed ~ -7.6 m CDL) Silty SAND, N average = 15 (-7.6 m ~ -16 m CDL) SAND with Gravel, N average = 30 (below -16 m CDL)
Seismic Coefficient Kh = 0.15
Source: JICA Project Team
Table 13.3.5 Design Conditions for the Access Bridge and Porter Way
Tide HHWL = +7.1 m, HWL = +6.20 m, MSL = +3.23 m, LWL = +0.34 m
Live load T20 Truck (only for Access Bridge)
Surcharge 0.5 ton/m2 for ordinal condition, and 0.0 ton/m2 for seismic condition
Crown level +7.5 m
Existing riverbed level -3.0 m ~ +5.0 CDL
Subsoil conditions
Soft clayey SILT, N average = 2 (riverbed ~ 6 m from the riverbed level) Silty SAND, N average = 15 (6 m ~ 12 m) Silty SAND or SAND with Gravel, N average = 30 (12 m ~ 18 m) Dense SAND or SAND with Gravel, N average > 50 (below 18 m)
Seismic Coefficient Kh = 0.15
Source: JICA Project Team
4) Calculation
Pier structures were designed by three dimensional frame analysis method. From the results of structural calculations, the following dimensions were determined.
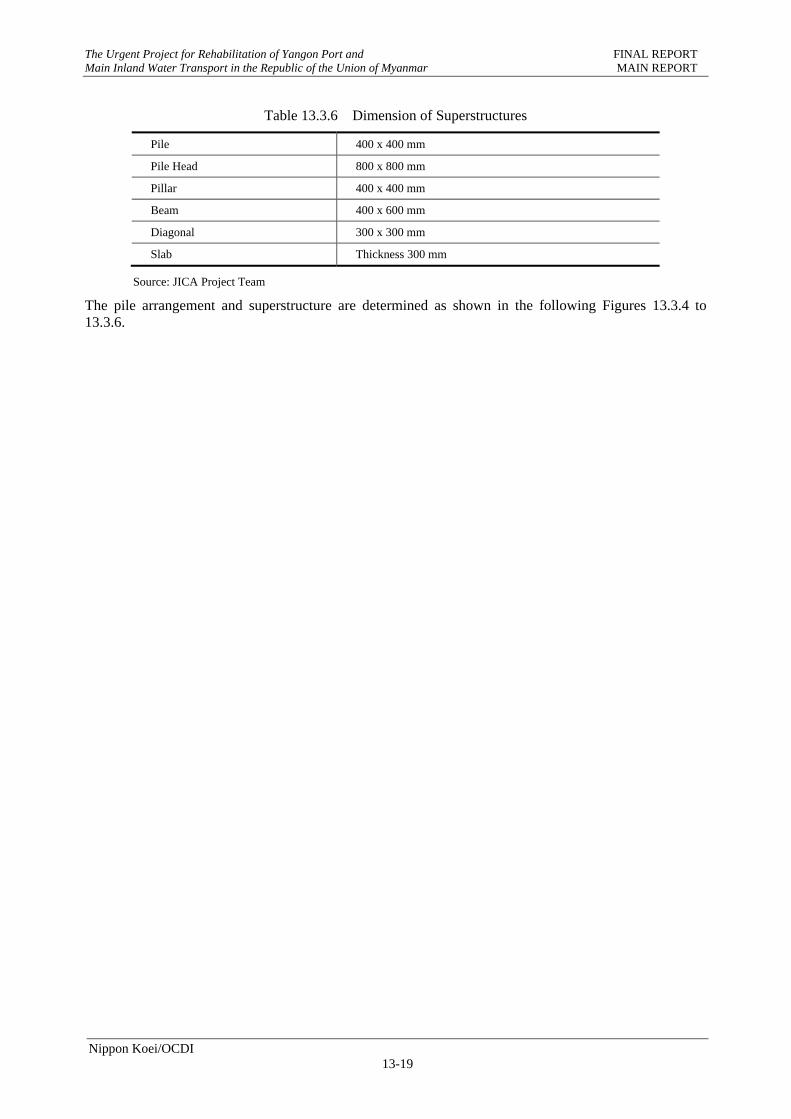
The Urgent Project for Rehabilitation of Yangon Port and FINAL REPORT Main Inland Water Transport in the Republic of the Union of Myanmar MAIN REPORT
Nippon Koei/OCDI 13-19
Table 13.3.6 Dimension of Superstructures
Pile 400 x 400 mm
Pile Head 800 x 800 mm
Pillar 400 x 400 mm
Beam 400 x 600 mm
Diagonal 300 x 300 mm
Slab Thickness 300 mm
Source: JICA Project Team
The pile arrangement and superstructure are determined as shown in the following Figures 13.3.4 to 13.3.6.
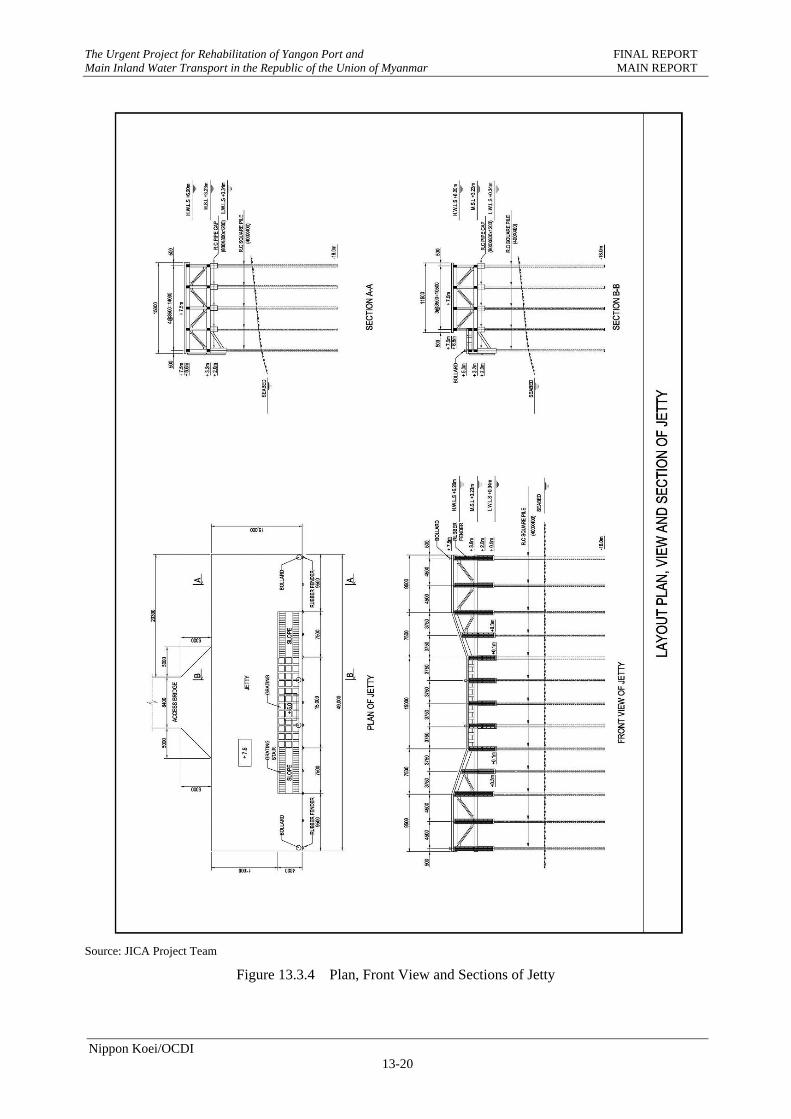
The Urgent Project for Rehabilitation of Yangon Port and FINAL REPORT Main Inland Water Transport in the Republic of the Union of Myanmar MAIN REPORT
Nippon Koei/OCDI 13-20
Source: JICA Project Team
Figure 13.3.4 Plan, Front View and Sections of Jetty
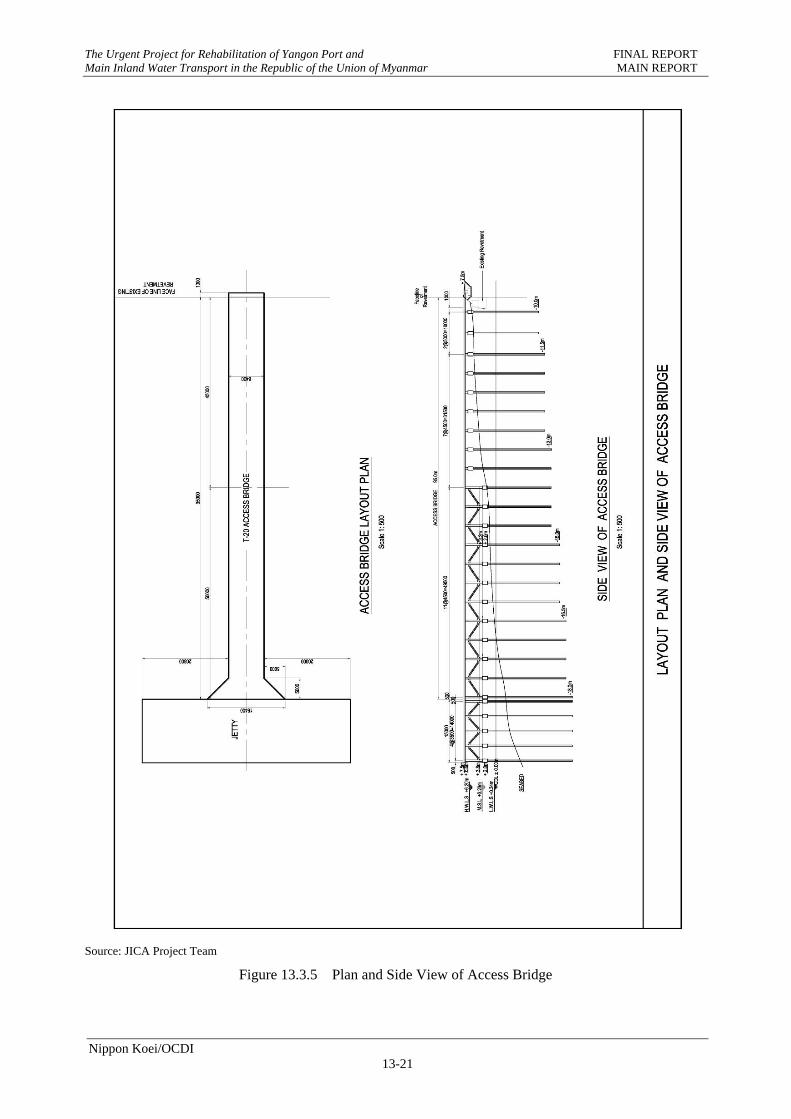
The Urgent Project for Rehabilitation of Yangon Port and FINAL REPORT Main Inland Water Transport in the Republic of the Union of Myanmar MAIN REPORT
Nippon Koei/OCDI 13-21
Source: JICA Project Team
Figure 13.3.5 Plan and Side View of Access Bridge
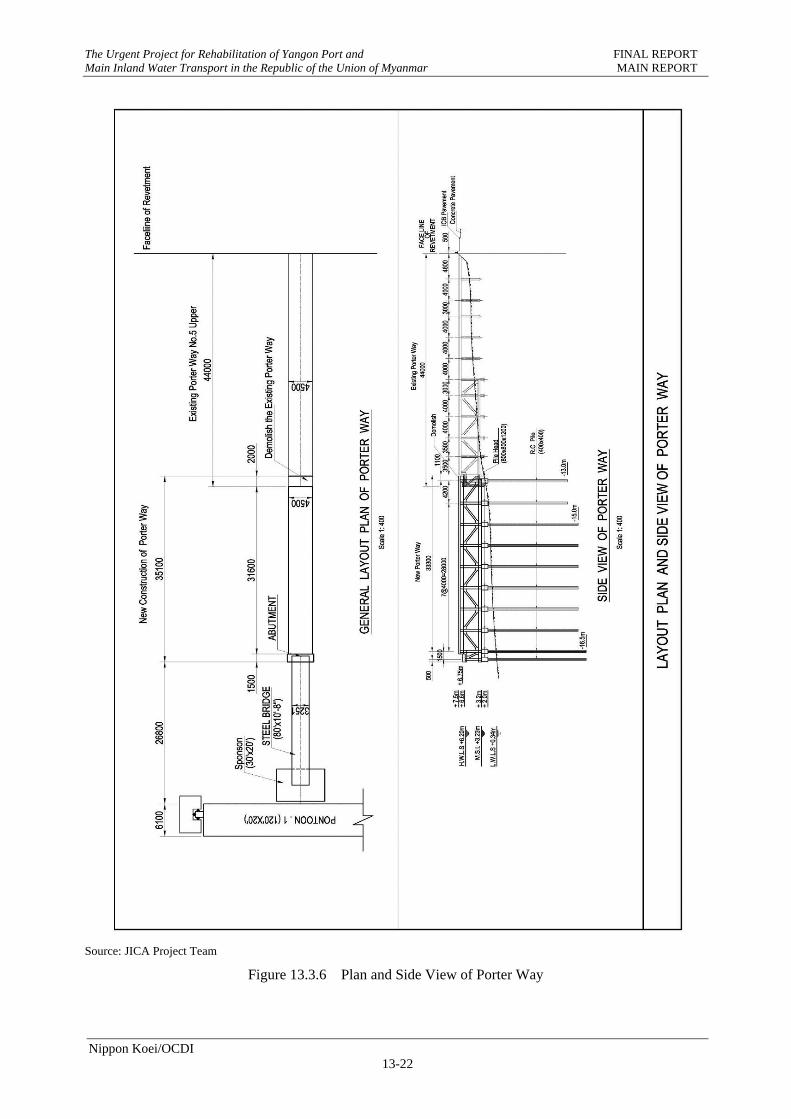
The Urgent Project for Rehabilitation of Yangon Port and FINAL REPORT Main Inland Water Transport in the Republic of the Union of Myanmar MAIN REPORT
Nippon Koei/OCDI 13-22
Source: JICA Project Team
Figure 13.3.6 Plan and Side View of Porter Way
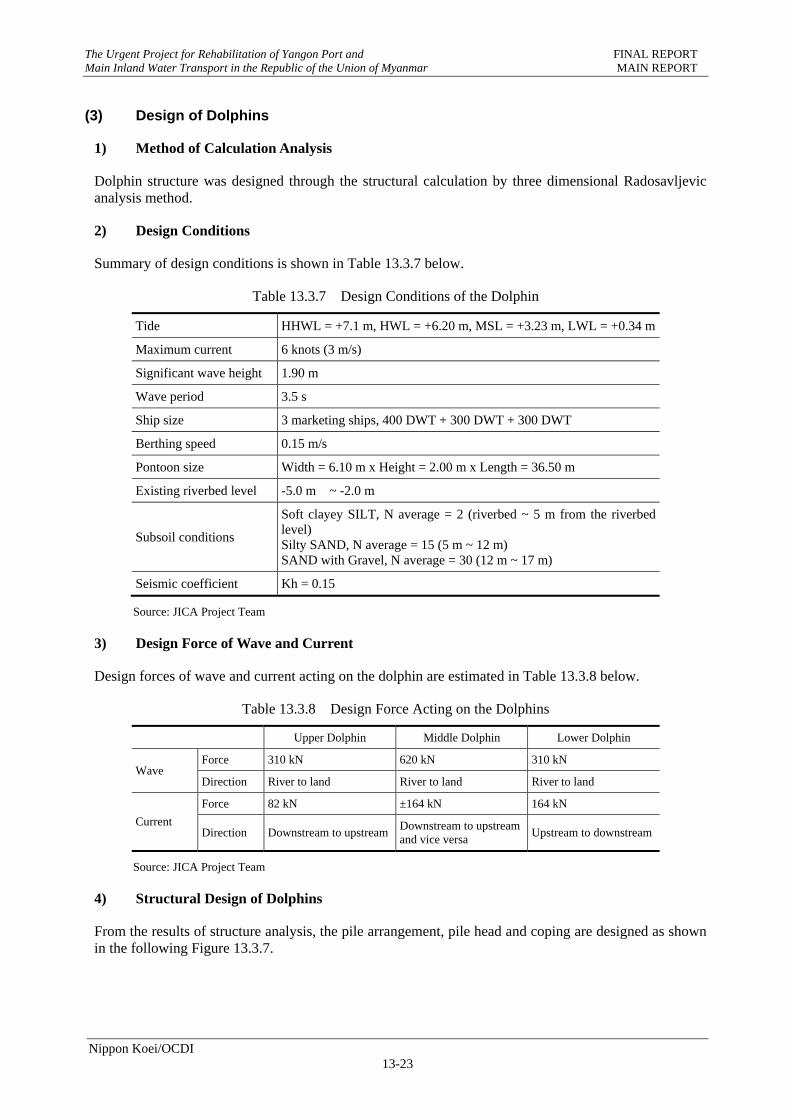
The Urgent Project for Rehabilitation of Yangon Port and FINAL REPORT Main Inland Water Transport in the Republic of the Union of Myanmar MAIN REPORT
Nippon Koei/OCDI 13-23
(3) Design of Dolphins
1) Method of Calculation Analysis
Dolphin structure was designed through the structural calculation by three dimensional Radosavljevic analysis method.
2) Design Conditions
Summary of design conditions is shown in Table 13.3.7 below.
Table 13.3.7 Design Conditions of the Dolphin
Tide HHWL = +7.1 m, HWL = +6.20 m, MSL = +3.23 m, LWL = +0.34 m
Maximum current 6 knots (3 m/s)
Significant wave height 1.90 m
Wave period 3.5 s
Ship size 3 marketing ships, 400 DWT + 300 DWT + 300 DWT
Berthing speed 0.15 m/s
Pontoon size Width = 6.10 m x Height = 2.00 m x Length = 36.50 m
Existing riverbed level -5.0 m ~ -2.0 m
Subsoil conditions
Soft clayey SILT, N average = 2 (riverbed ~ 5 m from the riverbed level) Silty SAND, N average = 15 (5 m ~ 12 m) SAND with Gravel, N average = 30 (12 m ~ 17 m)
Seismic coefficient Kh = 0.15
Source: JICA Project Team
3) Design Force of Wave and Current
Design forces of wave and current acting on the dolphin are estimated in Table 13.3.8 below.
Table 13.3.8 Design Force Acting on the Dolphins
Upper Dolphin Middle Dolphin Lower Dolphin
Wave Force 310 kN 620 kN 310 kN
Direction River to land River to land River to land
Current
Force 82 kN ±164 kN 164 kN
Direction Downstream to upstreamDownstream to upstream and vice versa
Upstream to downstream
Source: JICA Project Team
4) Structural Design of Dolphins
From the results of structure analysis, the pile arrangement, pile head and coping are designed as shown in the following Figure 13.3.7.
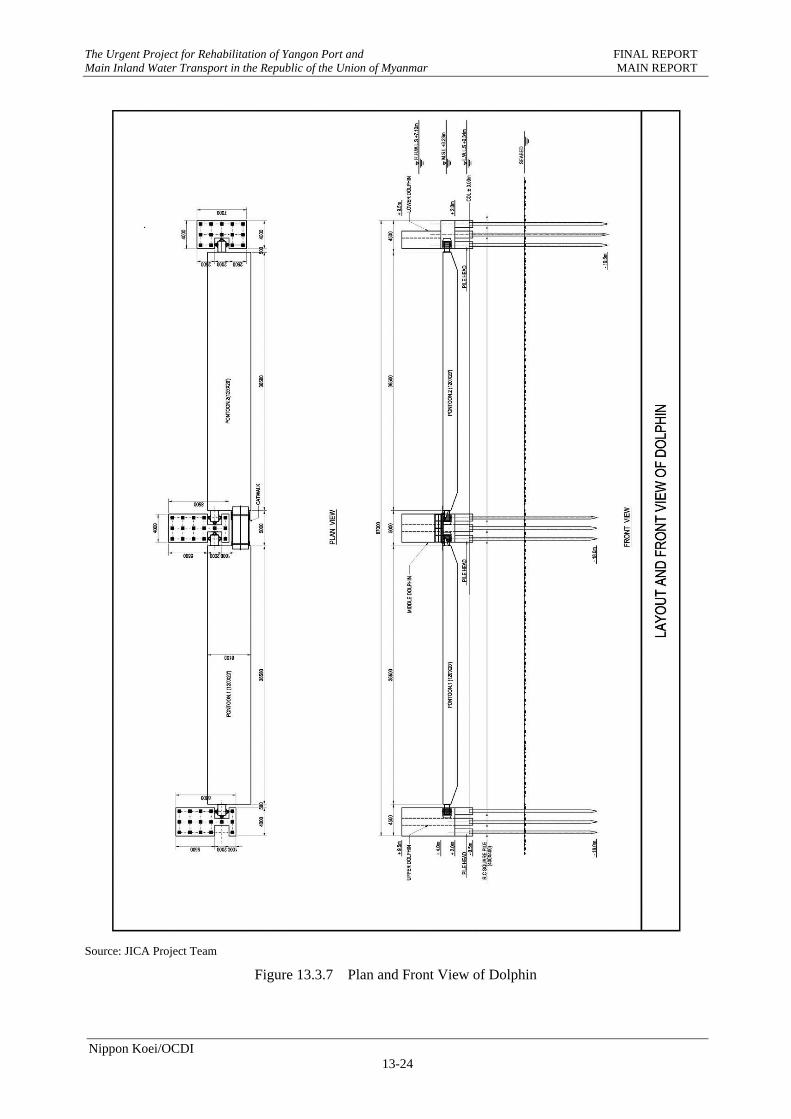
The Urgent Project for Rehabilitation of Yangon Port and FINAL REPORT Main Inland Water Transport in the Republic of the Union of Myanmar MAIN REPORT
Nippon Koei/OCDI 13-24
Source: JICA Project Team
Figure 13.3.7 Plan and Front View of Dolphin
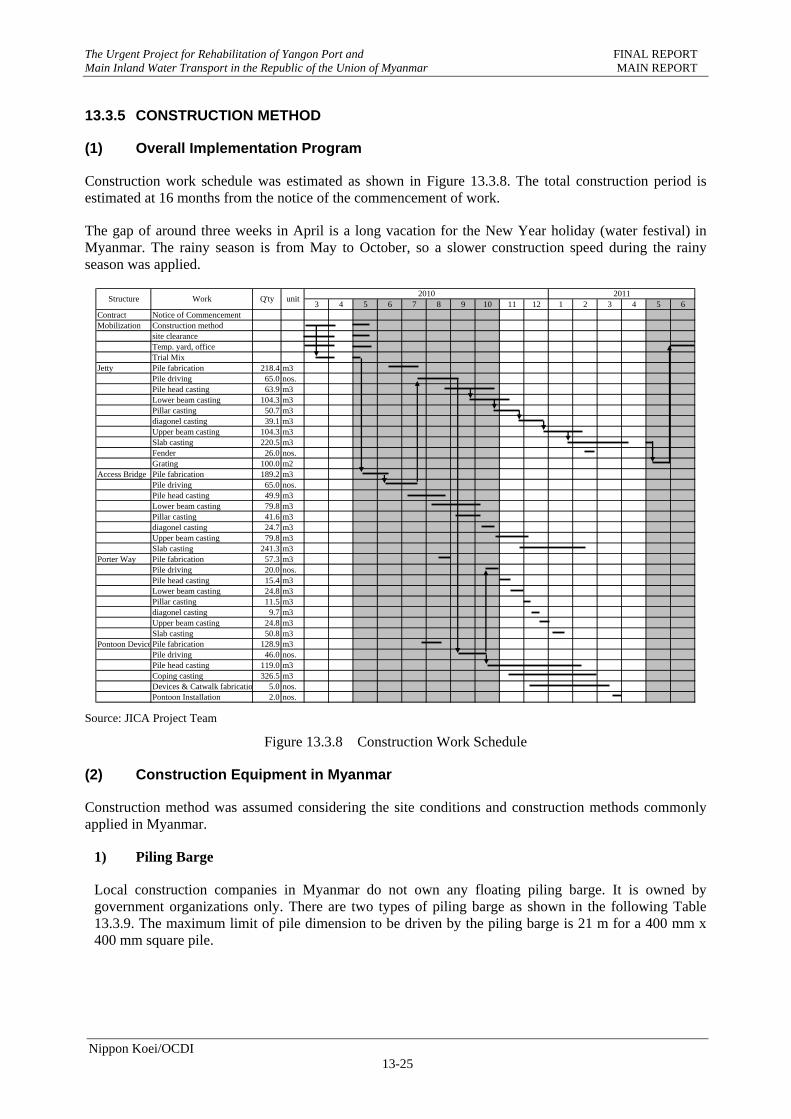
The Urgent Project for Rehabilitation of Yangon Port and FINAL REPORT Main Inland Water Transport in the Republic of the Union of Myanmar MAIN REPORT
Nippon Koei/OCDI 13-25
13.3.5 CONSTRUCTION METHOD
(1) Overall Implementation Program
Construction work schedule was estimated as shown in Figure 13.3.8. The total construction period is estimated at 16 months from the notice of the commencement of work.
The gap of around three weeks in April is a long vacation for the New Year holiday (water festival) in Myanmar. The rainy season is from May to October, so a slower construction speed during the rainy season was applied.
Source: JICA Project Team
Figure 13.3.8 Construction Work Schedule
(2) Construction Equipment in Myanmar
Construction method was assumed considering the site conditions and construction methods commonly applied in Myanmar.
1) Piling Barge
Local construction companies in Myanmar do not own any floating piling barge. It is owned by government organizations only. There are two types of piling barge as shown in the following Table 13.3.9. The maximum limit of pile dimension to be driven by the piling barge is 21 m for a 400 mm x 400 mm square pile.
3 4 5 6 7 8 9 10 11 12 1 2 3 4 5 6Contract Notice of Commencement Mobilization Construction method
site clearanceTemp. yard, officeTrial Mix
Jetty Pile fabrication 218.4 m3Pile driving 65.0 nos.Pile head casting 63.9 m3Lower beam casting 104.3 m3Pillar casting 50.7 m3diagonel casting 39.1 m3Upper beam casting 104.3 m3Slab casting 220.5 m3Fender 26.0 nos.Grating 100.0 m2
Access Bridge Pile fabrication 189.2 m3Pile driving 65.0 nos.Pile head casting 49.9 m3Lower beam casting 79.8 m3Pillar casting 41.6 m3diagonel casting 24.7 m3Upper beam casting 79.8 m3Slab casting 241.3 m3
Porter Way Pile fabrication 57.3 m3Pile driving 20.0 nos.Pile head casting 15.4 m3Lower beam casting 24.8 m3Pillar casting 11.5 m3diagonel casting 9.7 m3Upper beam casting 24.8 m3Slab casting 50.8 m3
Pontoon DevicePile fabrication 128.9 m3Pile driving 46.0 nos.Pile head casting 119.0 m3Coping casting 326.5 m3Devices & Catwalk fabricatio 5.0 nos.Pontoon Installation 2.0 nos.
2010 2011WorkStructure Q'ty unit
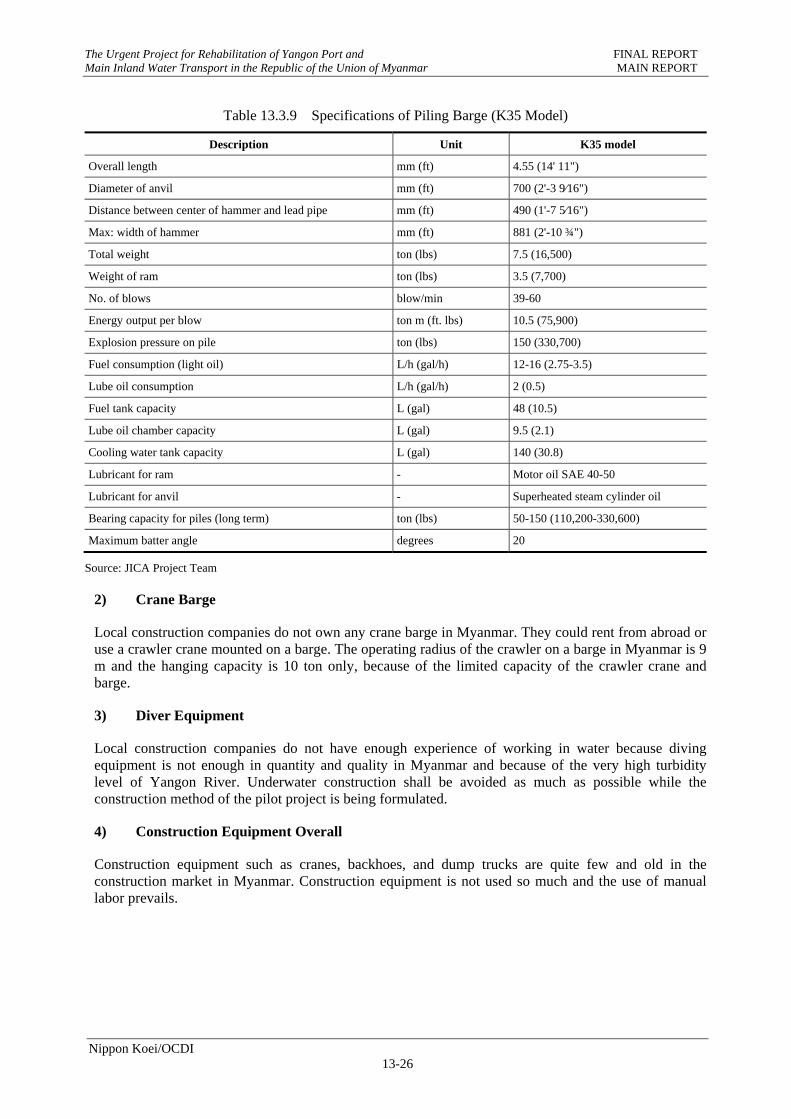
The Urgent Project for Rehabilitation of Yangon Port and FINAL REPORT Main Inland Water Transport in the Republic of the Union of Myanmar MAIN REPORT
Nippon Koei/OCDI 13-26
Table 13.3.9 Specifications of Piling Barge (K35 Model)
Description Unit K35 model
Overall length mm (ft) 4.55 (14' 11")
Diameter of anvil mm (ft) 700 (2'-3 9⁄16")
Distance between center of hammer and lead pipe mm (ft) 490 (1'-7 5⁄16")
Max: width of hammer mm (ft) 881 (2'-10 ¾")
Total weight ton (lbs) 7.5 (16,500)
Weight of ram ton (lbs) 3.5 (7,700)
No. of blows blow/min 39-60
Energy output per blow ton m (ft. lbs) 10.5 (75,900)
Explosion pressure on pile ton (lbs) 150 (330,700)
Fuel consumption (light oil) L/h (gal/h) 12-16 (2.75-3.5)
Lube oil consumption L/h (gal/h) 2 (0.5)
Fuel tank capacity L (gal) 48 (10.5)
Lube oil chamber capacity L (gal) 9.5 (2.1)
Cooling water tank capacity L (gal) 140 (30.8)
Lubricant for ram - Motor oil SAE 40-50
Lubricant for anvil - Superheated steam cylinder oil
Bearing capacity for piles (long term) ton (lbs) 50-150 (110,200-330,600)
Maximum batter angle degrees 20
Source: JICA Project Team
2) Crane Barge
Local construction companies do not own any crane barge in Myanmar. They could rent from abroad or use a crawler crane mounted on a barge. The operating radius of the crawler on a barge in Myanmar is 9 m and the hanging capacity is 10 ton only, because of the limited capacity of the crawler crane and barge.
3) Diver Equipment
Local construction companies do not have enough experience of working in water because diving equipment is not enough in quantity and quality in Myanmar and because of the very high turbidity level of Yangon River. Underwater construction shall be avoided as much as possible while the construction method of the pilot project is being formulated.
4) Construction Equipment Overall
Construction equipment such as cranes, backhoes, and dump trucks are quite few and old in the construction market in Myanmar. Construction equipment is not used so much and the use of manual labor prevails.
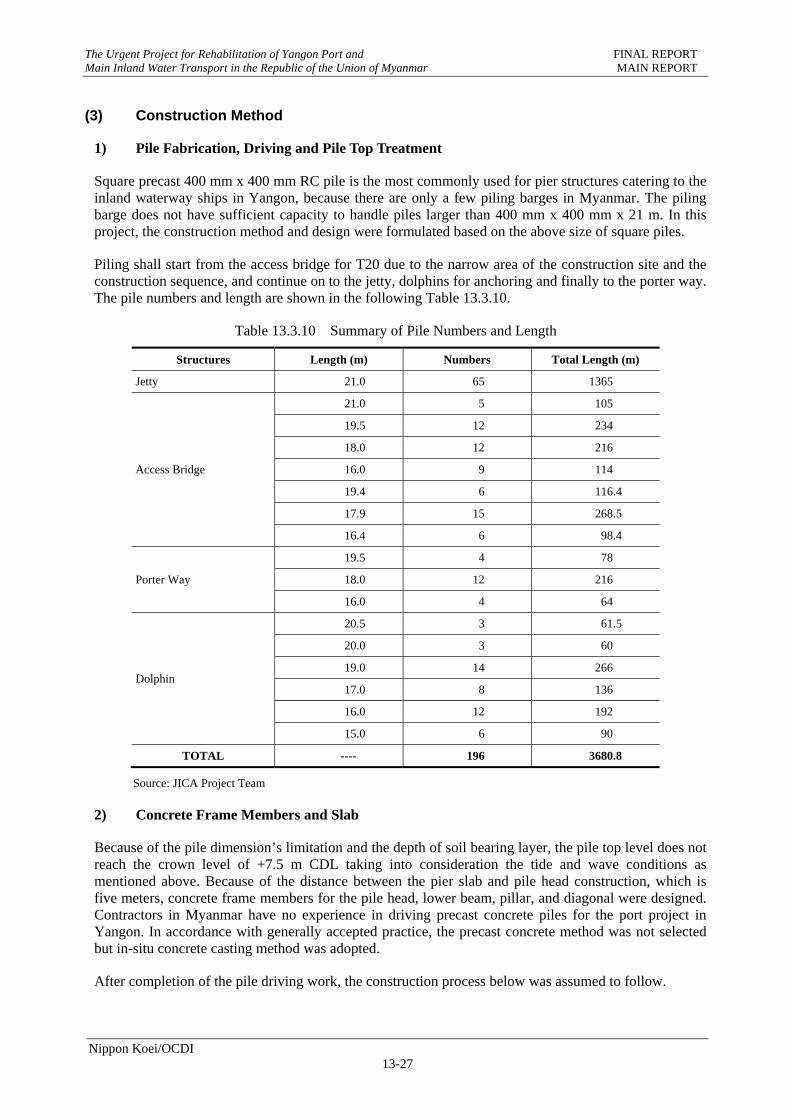
The Urgent Project for Rehabilitation of Yangon Port and FINAL REPORT Main Inland Water Transport in the Republic of the Union of Myanmar MAIN REPORT
Nippon Koei/OCDI 13-27
(3) Construction Method
1) Pile Fabrication, Driving and Pile Top Treatment
Square precast 400 mm x 400 mm RC pile is the most commonly used for pier structures catering to the inland waterway ships in Yangon, because there are only a few piling barges in Myanmar. The piling barge does not have sufficient capacity to handle piles larger than 400 mm x 400 mm x 21 m. In this project, the construction method and design were formulated based on the above size of square piles.
Piling shall start from the access bridge for T20 due to the narrow area of the construction site and the construction sequence, and continue on to the jetty, dolphins for anchoring and finally to the porter way. The pile numbers and length are shown in the following Table 13.3.10.
Table 13.3.10 Summary of Pile Numbers and Length
Structures Length (m) Numbers Total Length (m)
Jetty 21.0 65 1365
Access Bridge
21.0 5 105
19.5 12 234
18.0 12 216
16.0 9 114
19.4 6 116.4
17.9 15 268.5
16.4 6 98.4
Porter Way
19.5 4 78
18.0 12 216
16.0 4 64
Dolphin
20.5 3 61.5
20.0 3 60
19.0 14 266
17.0 8 136
16.0 12 192
15.0 6 90
TOTAL ---- 196 3680.8
Source: JICA Project Team
2) Concrete Frame Members and Slab
Because of the pile dimension’s limitation and the depth of soil bearing layer, the pile top level does not reach the crown level of +7.5 m CDL taking into consideration the tide and wave conditions as mentioned above. Because of the distance between the pier slab and pile head construction, which is five meters, concrete frame members for the pile head, lower beam, pillar, and diagonal were designed. Contractors in Myanmar have no experience in driving precast concrete piles for the port project in Yangon. In accordance with generally accepted practice, the precast concrete method was not selected but in-situ concrete casting method was adopted.
After completion of the pile driving work, the construction process below was assumed to follow.
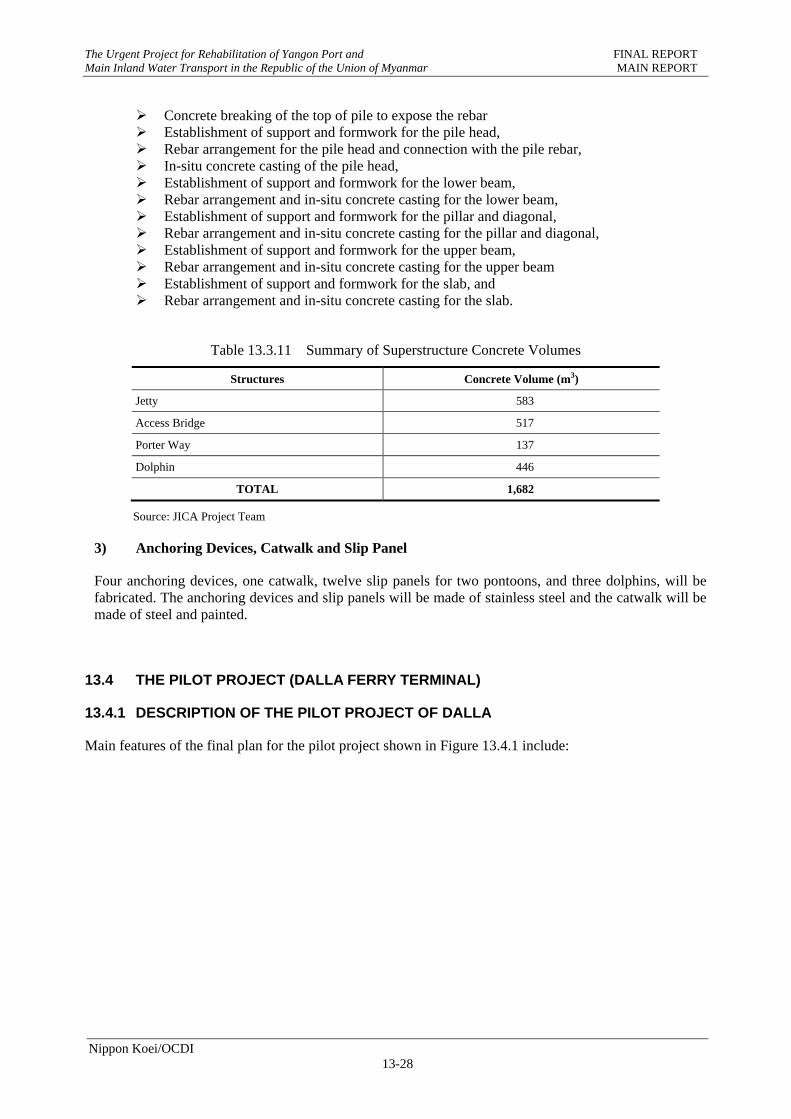
The Urgent Project for Rehabilitation of Yangon Port and FINAL REPORT Main Inland Water Transport in the Republic of the Union of Myanmar MAIN REPORT
Nippon Koei/OCDI 13-28
Concrete breaking of the top of pile to expose the rebar Establishment of support and formwork for the pile head, Rebar arrangement for the pile head and connection with the pile rebar, In-situ concrete casting of the pile head, Establishment of support and formwork for the lower beam, Rebar arrangement and in-situ concrete casting for the lower beam, Establishment of support and formwork for the pillar and diagonal, Rebar arrangement and in-situ concrete casting for the pillar and diagonal, Establishment of support and formwork for the upper beam, Rebar arrangement and in-situ concrete casting for the upper beam Establishment of support and formwork for the slab, and Rebar arrangement and in-situ concrete casting for the slab.
Table 13.3.11 Summary of Superstructure Concrete Volumes
Structures Concrete Volume (m3)
Jetty 583
Access Bridge 517
Porter Way 137
Dolphin 446
TOTAL 1,682
Source: JICA Project Team
3) Anchoring Devices, Catwalk and Slip Panel
Four anchoring devices, one catwalk, twelve slip panels for two pontoons, and three dolphins, will be fabricated. The anchoring devices and slip panels will be made of stainless steel and the catwalk will be made of steel and painted.
13.4 THE PILOT PROJECT (DALLA FERRY TERMINAL)
13.4.1 DESCRIPTION OF THE PILOT PROJECT OF DALLA
Main features of the final plan for the pilot project shown in Figure 13.4.1 include:
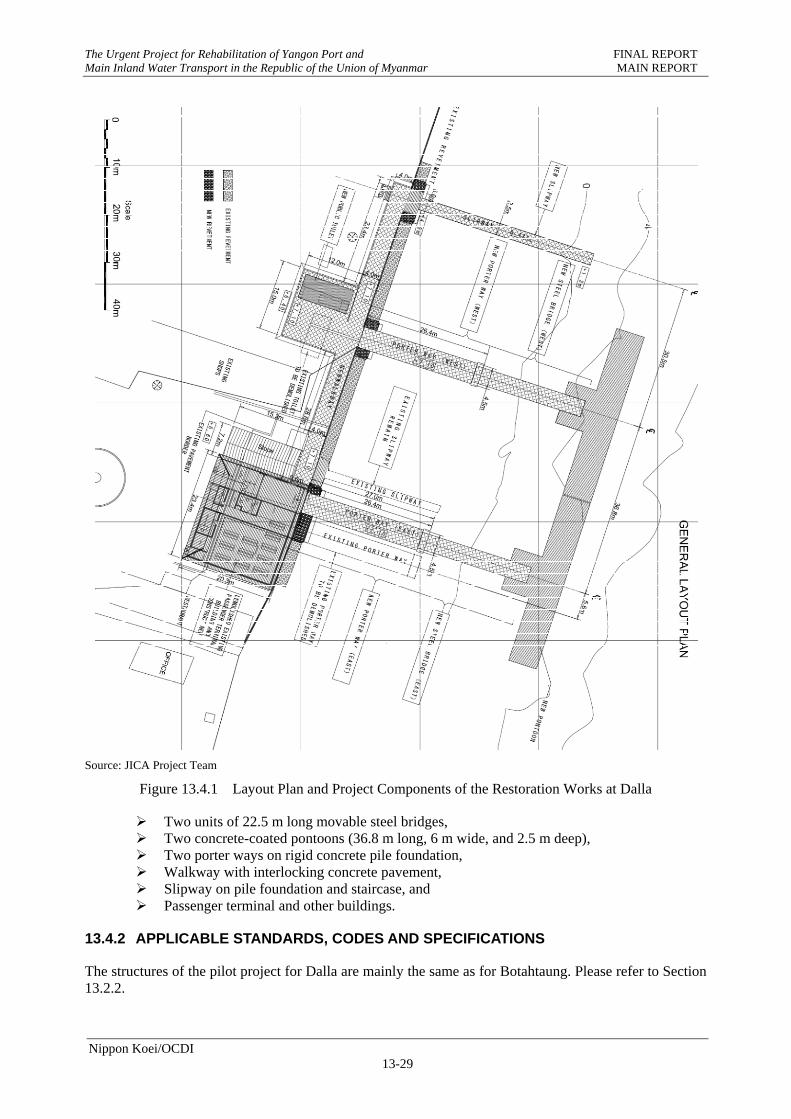
The Urgent Project for Rehabilitation of Yangon Port and FINAL REPORT Main Inland Water Transport in the Republic of the Union of Myanmar MAIN REPORT
Nippon Koei/OCDI 13-29
Source: JICA Project Team
Figure 13.4.1 Layout Plan and Project Components of the Restoration Works at Dalla
Two units of 22.5 m long movable steel bridges, Two concrete-coated pontoons (36.8 m long, 6 m wide, and 2.5 m deep), Two porter ways on rigid concrete pile foundation, Walkway with interlocking concrete pavement, Slipway on pile foundation and staircase, and Passenger terminal and other buildings.
13.4.2 APPLICABLE STANDARDS, CODES AND SPECIFICATIONS
The structures of the pilot project for Dalla are mainly the same as for Botahtaung. Please refer to Section 13.2.2.
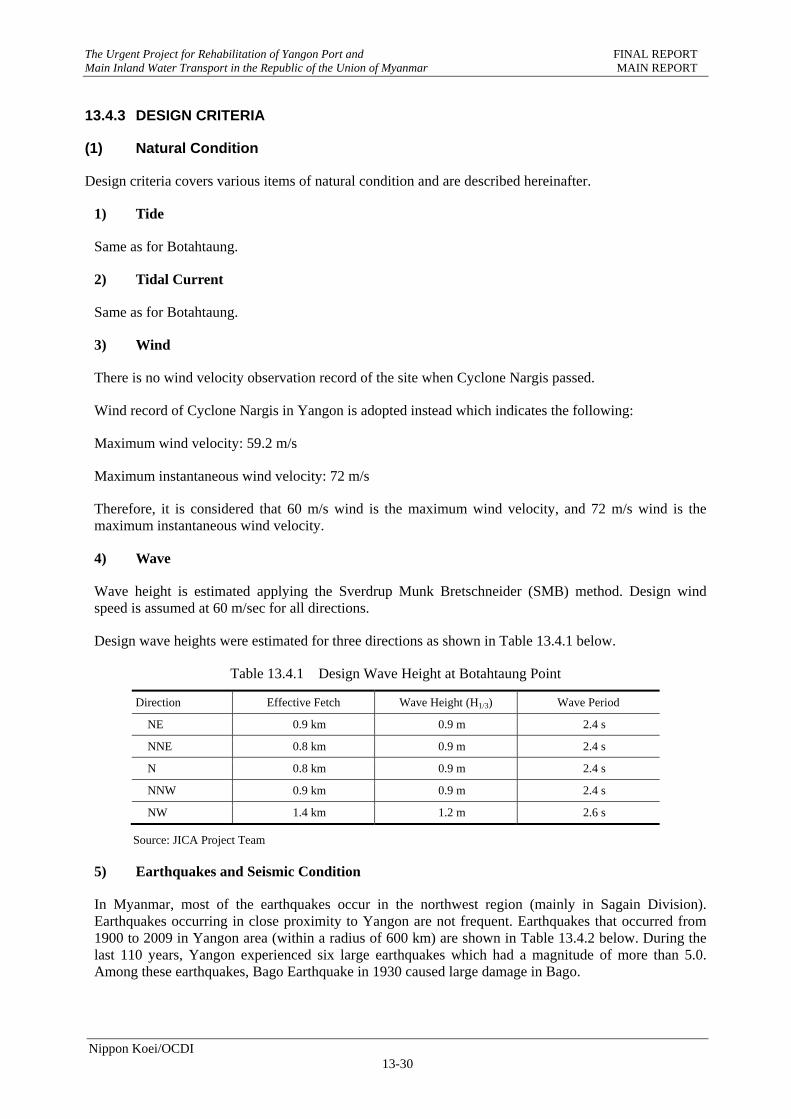
The Urgent Project for Rehabilitation of Yangon Port and FINAL REPORT Main Inland Water Transport in the Republic of the Union of Myanmar MAIN REPORT
Nippon Koei/OCDI 13-30
13.4.3 DESIGN CRITERIA
(1) Natural Condition
Design criteria covers various items of natural condition and are described hereinafter.
1) Tide
Same as for Botahtaung.
2) Tidal Current
Same as for Botahtaung.
3) Wind
There is no wind velocity observation record of the site when Cyclone Nargis passed.
Wind record of Cyclone Nargis in Yangon is adopted instead which indicates the following:
Maximum wind velocity: 59.2 m/s
Maximum instantaneous wind velocity: 72 m/s
Therefore, it is considered that 60 m/s wind is the maximum wind velocity, and 72 m/s wind is the maximum instantaneous wind velocity.
4) Wave
Wave height is estimated applying the Sverdrup Munk Bretschneider (SMB) method. Design wind speed is assumed at 60 m/sec for all directions.
Design wave heights were estimated for three directions as shown in Table 13.4.1 below.
Table 13.4.1 Design Wave Height at Botahtaung Point
Direction Effective Fetch Wave Height (H1/3) Wave Period
NE 0.9 km 0.9 m 2.4 s
NNE 0.8 km 0.9 m 2.4 s
N 0.8 km 0.9 m 2.4 s
NNW 0.9 km 0.9 m 2.4 s
NW 1.4 km 1.2 m 2.6 s
Source: JICA Project Team
5) Earthquakes and Seismic Condition
In Myanmar, most of the earthquakes occur in the northwest region (mainly in Sagain Division). Earthquakes occurring in close proximity to Yangon are not frequent. Earthquakes that occurred from 1900 to 2009 in Yangon area (within a radius of 600 km) are shown in Table 13.4.2 below. During the last 110 years, Yangon experienced six large earthquakes which had a magnitude of more than 5.0. Among these earthquakes, Bago Earthquake in 1930 caused large damage in Bago.
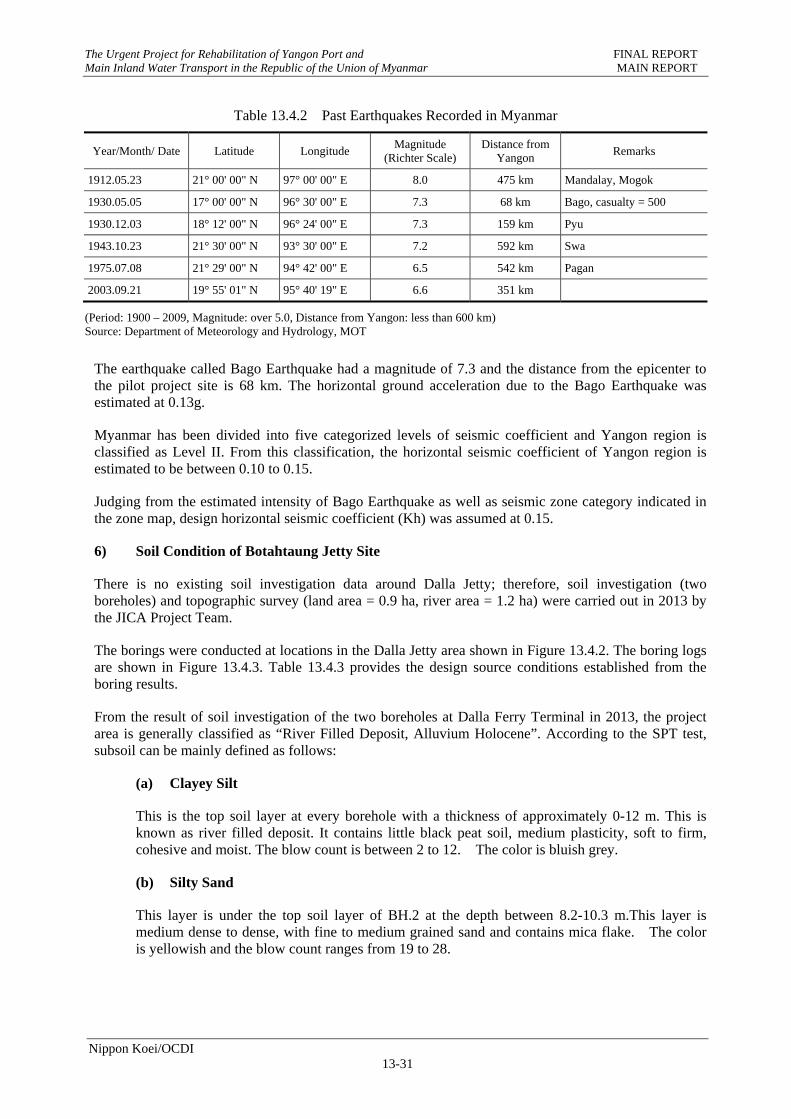
The Urgent Project for Rehabilitation of Yangon Port and FINAL REPORT Main Inland Water Transport in the Republic of the Union of Myanmar MAIN REPORT
Nippon Koei/OCDI 13-31
Table 13.4.2 Past Earthquakes Recorded in Myanmar
Year/Month/ Date Latitude Longitude Magnitude
(Richter Scale) Distance from
Yangon Remarks
1912.05.23 21° 00' 00" N 97° 00' 00" E 8.0 475 km Mandalay, Mogok
1930.05.05 17° 00' 00" N 96° 30' 00" E 7.3 68 km Bago, casualty = 500
1930.12.03 18° 12' 00" N 96° 24' 00" E 7.3 159 km Pyu
1943.10.23 21° 30' 00" N 93° 30' 00" E 7.2 592 km Swa
1975.07.08 21° 29' 00" N 94° 42' 00" E 6.5 542 km Pagan
2003.09.21 19° 55' 01" N 95° 40' 19" E 6.6 351 km
(Period: 1900 – 2009, Magnitude: over 5.0, Distance from Yangon: less than 600 km) Source: Department of Meteorology and Hydrology, MOT
The earthquake called Bago Earthquake had a magnitude of 7.3 and the distance from the epicenter to the pilot project site is 68 km. The horizontal ground acceleration due to the Bago Earthquake was estimated at 0.13g.
Myanmar has been divided into five categorized levels of seismic coefficient and Yangon region is classified as Level II. From this classification, the horizontal seismic coefficient of Yangon region is estimated to be between 0.10 to 0.15.
Judging from the estimated intensity of Bago Earthquake as well as seismic zone category indicated in the zone map, design horizontal seismic coefficient (Kh) was assumed at 0.15.
6) Soil Condition of Botahtaung Jetty Site
There is no existing soil investigation data around Dalla Jetty; therefore, soil investigation (two boreholes) and topographic survey (land area = 0.9 ha, river area = 1.2 ha) were carried out in 2013 by the JICA Project Team.
The borings were conducted at locations in the Dalla Jetty area shown in Figure 13.4.2. The boring logs are shown in Figure 13.4.3. Table 13.4.3 provides the design source conditions established from the boring results.
From the result of soil investigation of the two boreholes at Dalla Ferry Terminal in 2013, the project area is generally classified as “River Filled Deposit, Alluvium Holocene”. According to the SPT test, subsoil can be mainly defined as follows:
(a) Clayey Silt
This is the top soil layer at every borehole with a thickness of approximately 0-12 m. This is known as river filled deposit. It contains little black peat soil, medium plasticity, soft to firm, cohesive and moist. The blow count is between 2 to 12. The color is bluish grey.
(b) Silty Sand
This layer is under the top soil layer of BH.2 at the depth between 8.2-10.3 m.This layer is medium dense to dense, with fine to medium grained sand and contains mica flake. The color is yellowish and the blow count ranges from 19 to 28.
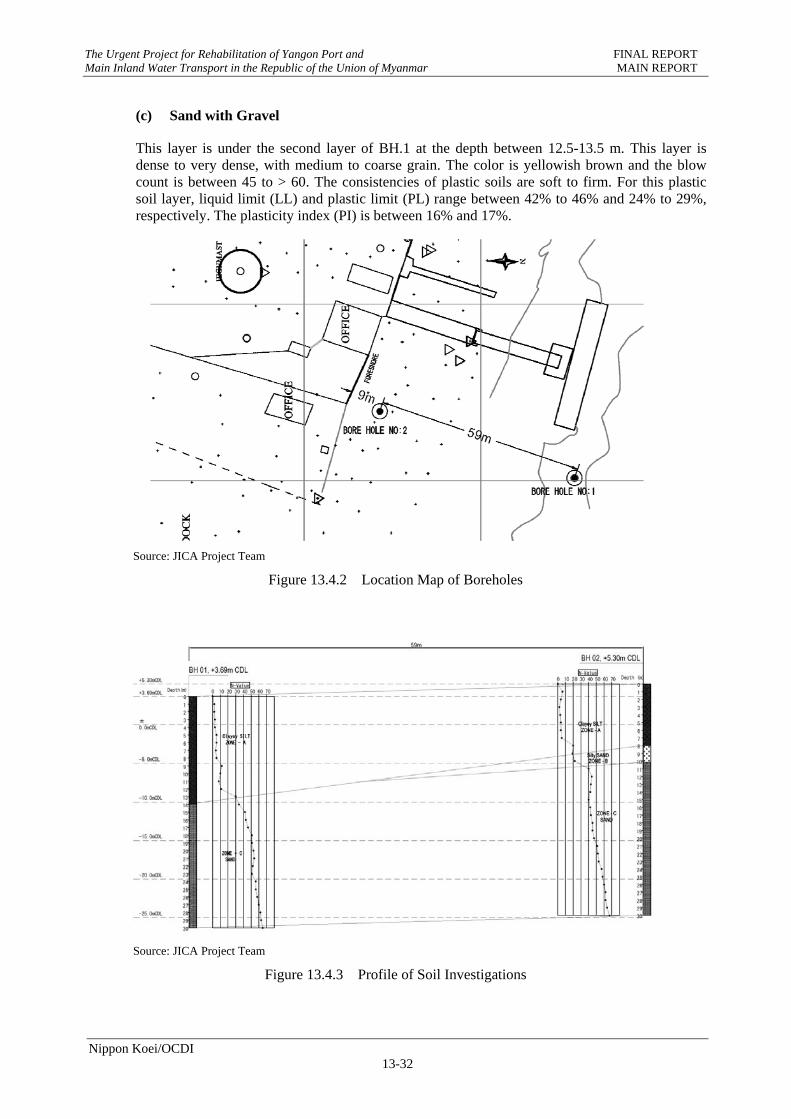
The Urgent Project for Rehabilitation of Yangon Port and FINAL REPORT Main Inland Water Transport in the Republic of the Union of Myanmar MAIN REPORT
Nippon Koei/OCDI 13-32
(c) Sand with Gravel
This layer is under the second layer of BH.1 at the depth between 12.5-13.5 m. This layer is dense to very dense, with medium to coarse grain. The color is yellowish brown and the blow count is between 45 to > 60. The consistencies of plastic soils are soft to firm. For this plastic soil layer, liquid limit (LL) and plastic limit (PL) range between 42% to 46% and 24% to 29%, respectively. The plasticity index (PI) is between 16% and 17%.
Source: JICA Project Team
Figure 13.4.2 Location Map of Boreholes
Source: JICA Project Team
Figure 13.4.3 Profile of Soil Investigations
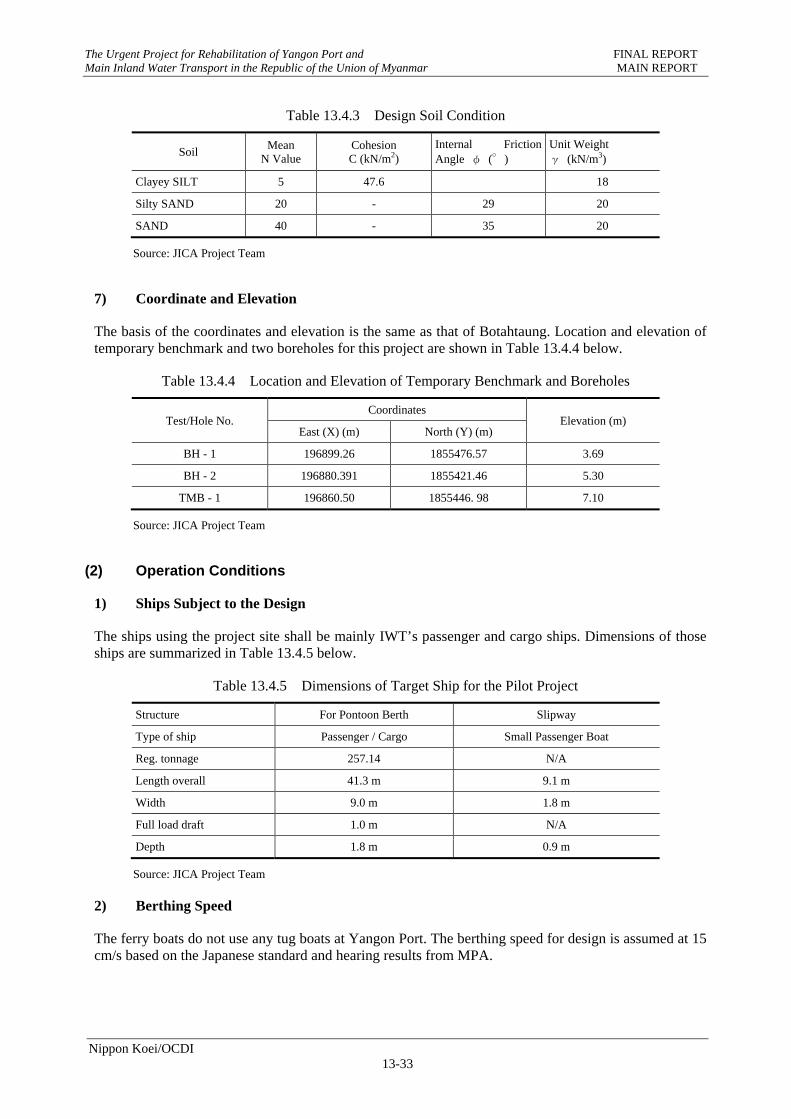
The Urgent Project for Rehabilitation of Yangon Port and FINAL REPORT Main Inland Water Transport in the Republic of the Union of Myanmar MAIN REPORT
Nippon Koei/OCDI 13-33
Table 13.4.3 Design Soil Condition
Soil Mean
N Value Cohesion C (kN/m2)
Internal Friction Angle φ (°)
Unit Weight γ (kN/m3)
Clayey SILT 5 47.6 18
Silty SAND 20 - 29 20
SAND 40 - 35 20
Source: JICA Project Team
7) Coordinate and Elevation
The basis of the coordinates and elevation is the same as that of Botahtaung. Location and elevation of temporary benchmark and two boreholes for this project are shown in Table 13.4.4 below.
Table 13.4.4 Location and Elevation of Temporary Benchmark and Boreholes
Test/Hole No. Coordinates
Elevation (m) East (X) (m) North (Y) (m)
BH - 1 196899.26 1855476.57 3.69
BH - 2 196880.391 1855421.46 5.30
TMB - 1 196860.50 1855446. 98 7.10
Source: JICA Project Team
(2) Operation Conditions
1) Ships Subject to the Design
The ships using the project site shall be mainly IWT’s passenger and cargo ships. Dimensions of those ships are summarized in Table 13.4.5 below.
Table 13.4.5 Dimensions of Target Ship for the Pilot Project
Structure For Pontoon Berth Slipway
Type of ship Passenger / Cargo Small Passenger Boat
Reg. tonnage 257.14 N/A
Length overall 41.3 m 9.1 m
Width 9.0 m 1.8 m
Full load draft 1.0 m N/A
Depth 1.8 m 0.9 m
Source: JICA Project Team
2) Berthing Speed
The ferry boats do not use any tug boats at Yangon Port. The berthing speed for design is assumed at 15 cm/s based on the Japanese standard and hearing results from MPA.
The Urgent Project for Rehabilitation of Yangon Port and FINAL REPORT Main Inland Water Transport in the Republic of the Union of Myanmar MAIN REPORT
Nippon Koei/OCDI 13-34
Private Note: Ships, especially ferries, do not follow standards. You should assume berthing speeds will be 2-3 times the standard at adverse conditions.
3) Live Load
Design live load is not considered for the porter way. The design live load of the movable steel bridge and pontoon are 5.0 kN/m2.
4) Surcharge
Design surcharge load is assumed at 5 kN/m2 under normal conditions and 0.0 tons under seismic conditions.
(3) Material Conditions
1) Steel
Steel material constants
Modulus of elasticity E 2.0 x 10⁵ N/mm2
Shear modulus G 7.7 x 10⁴ N/mm2
Poisson’s ratio v 0.3
Coefficient of linear thermal elongation α 12 x 10-6 m/m°C
2) Structural Steel
Type of steel: SS400, SM400, SMA400
Tensile, compressive stress 140 N/mm2
Shearing stress 80 N/mm2
Bearing stress 210 N/mm2
3) Allowable Tensile Stresses of Steel Reinforcements
Table 13.4.6 Allowable Tensile Stresses of Steel Reinforcement
(Unit: N/mm2)
Type of steel reinforcement (available material) SD295 A,B
(a) Allowable stress in normal cases 176
(b) Allowable stress determined by figure strength 157
(c) Allowable stress determined by yield strength 176
SD345 is not popular in Myanmar Source: JICA Project Team
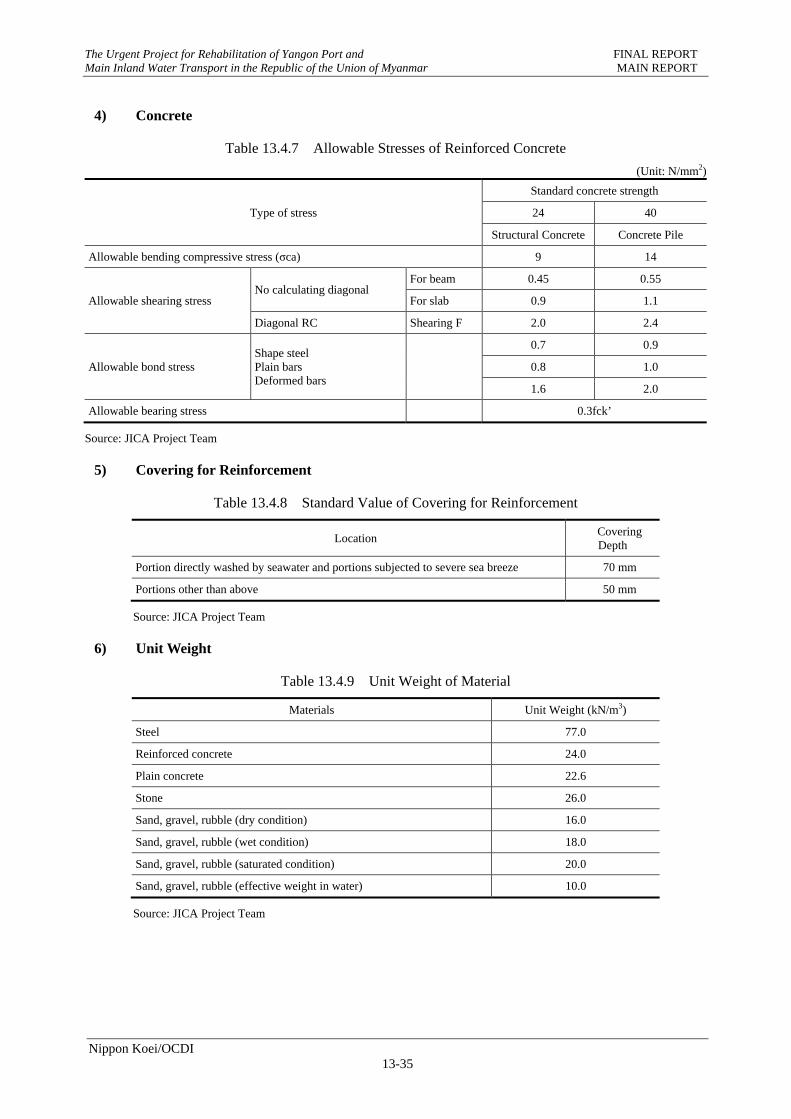
The Urgent Project for Rehabilitation of Yangon Port and FINAL REPORT Main Inland Water Transport in the Republic of the Union of Myanmar MAIN REPORT
Nippon Koei/OCDI 13-35
4) Concrete
Table 13.4.7 Allowable Stresses of Reinforced Concrete
(Unit: N/mm2)
Type of stress
Standard concrete strength
24 40
Structural Concrete Concrete Pile
Allowable bending compressive stress (σca) 9 14
Allowable shearing stress No calculating diagonal
For beam 0.45 0.55
For slab 0.9 1.1
Diagonal RC Shearing F 2.0 2.4
Allowable bond stress Shape steel Plain bars Deformed bars
0.7 0.9
0.8 1.0
1.6 2.0
Allowable bearing stress 0.3fck’
Source: JICA Project Team
5) Covering for Reinforcement
Table 13.4.8 Standard Value of Covering for Reinforcement
Location Covering Depth
Portion directly washed by seawater and portions subjected to severe sea breeze 70 mm
Portions other than above 50 mm
Source: JICA Project Team
6) Unit Weight
Table 13.4.9 Unit Weight of Material
Materials Unit Weight (kN/m3)
Steel 77.0
Reinforced concrete 24.0
Plain concrete 22.6
Stone 26.0
Sand, gravel, rubble (dry condition) 16.0
Sand, gravel, rubble (wet condition) 18.0
Sand, gravel, rubble (saturated condition) 20.0
Sand, gravel, rubble (effective weight in water) 10.0
Source: JICA Project Team
The Urgent Project for Rehabilitation of Yangon Port and FINAL REPORT Main Inland Water Transport in the Republic of the Union of Myanmar MAIN REPORT
Nippon Koei/OCDI 13-36
13.4.4 SOUNDNESS OF THE EXISTING PORTER WAY
(1) General
The existing porter way of Dalla Ferry Terminal Jetty was very old and seems without sufficient maintenance. The damage to the structure was apparent. It may be dangerous to use the existing porter way without repair and/or reconstruction. The JICA Project Team implemented the study of the soundness of the porter way and the recoverability.
(2) Program
1) On-site investigation (October 2013): Japanese experts inspected the jetties. 2) Laboratory test in Japan (November 2013): Core samples were taken from the jetties.
Laboratory test was carried out in Japan.
(3) Test Items
Visual test (cracking, corrosion of rebar)
Hammering test (spalling and delamination)
Strength of concrete
Location of rebar (covering concrete thickness)
CO2 attack (carbonation )
Salt attack (chloride )
Corrosion of rebar
(4) Survey Result
1) Visual Test (Cracking, Corrosion of Rebar)
Visual test for jetty
(How to find, measure and record damages to concrete and rebar)
(a) Whole View of the Jetty
(b) Damages (Deterioration) to Structural Members
Cracks
Spalling of concrete cover
Delamination of concrete cover
Rebar corrosion
(c) Record
(5) Whole View of the Jetty
Check obvious settlement, leaning and deformation of concrete structure by taking a whole view of the jetty.
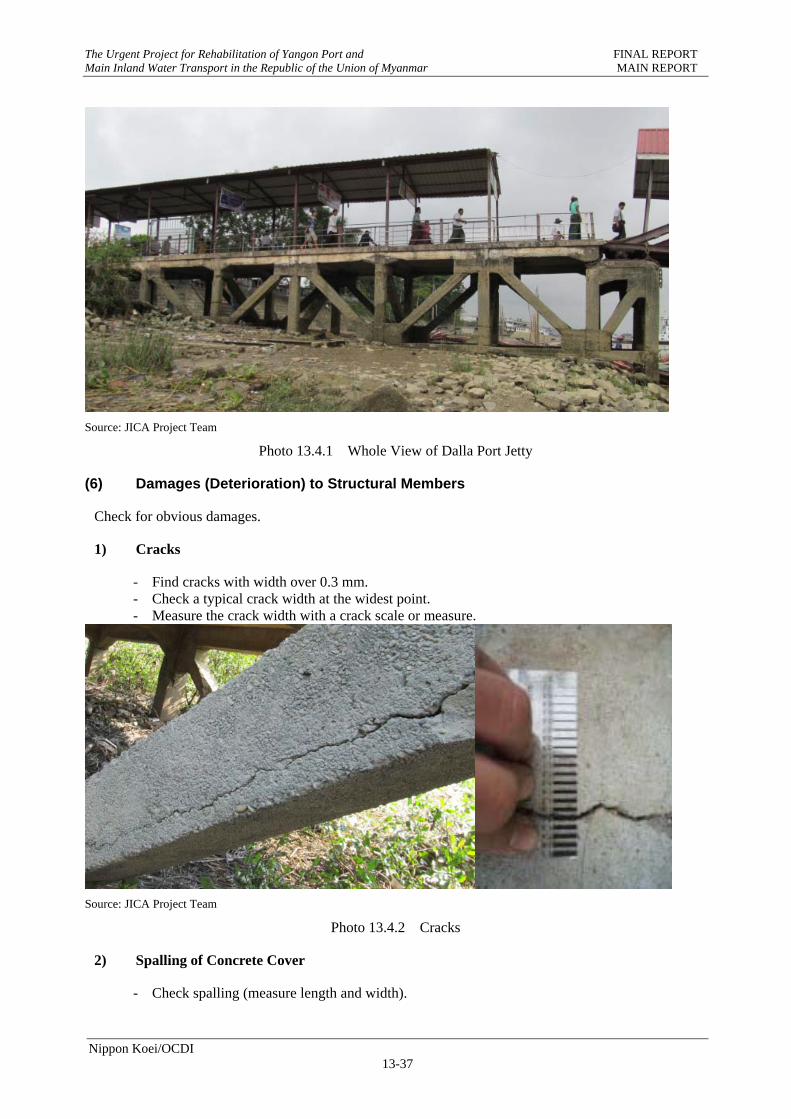
The Urgent Project for Rehabilitation of Yangon Port and FINAL REPORT Main Inland Water Transport in the Republic of the Union of Myanmar MAIN REPORT
Nippon Koei/OCDI 13-37
Source: JICA Project Team
Photo 13.4.1 Whole View of Dalla Port Jetty
(6) Damages (Deterioration) to Structural Members
Check for obvious damages.
1) Cracks
- Find cracks with width over 0.3 mm. - Check a typical crack width at the widest point. - Measure the crack width with a crack scale or measure.
Source: JICA Project Team
Photo 13.4.2 Cracks
2) Spalling of Concrete Cover
- Check spalling (measure length and width).
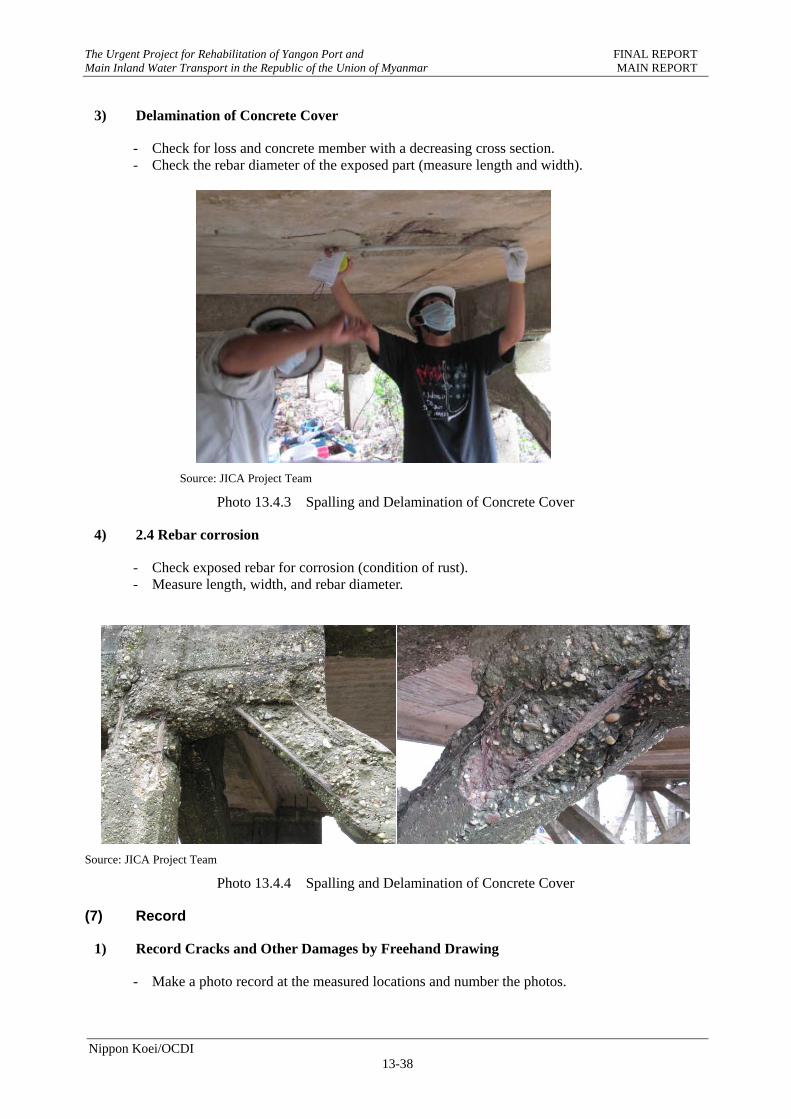
The Urgent Project for Rehabilitation of Yangon Port and FINAL REPORT Main Inland Water Transport in the Republic of the Union of Myanmar MAIN REPORT
Nippon Koei/OCDI 13-38
3) Delamination of Concrete Cover
- Check for loss and concrete member with a decreasing cross section. - Check the rebar diameter of the exposed part (measure length and width).
Source: JICA Project Team
Photo 13.4.3 Spalling and Delamination of Concrete Cover
4) 2.4 Rebar corrosion
- Check exposed rebar for corrosion (condition of rust). - Measure length, width, and rebar diameter.
Source: JICA Project Team
Photo 13.4.4 Spalling and Delamination of Concrete Cover
(7) Record
1) Record Cracks and Other Damages by Freehand Drawing
- Make a photo record at the measured locations and number the photos.
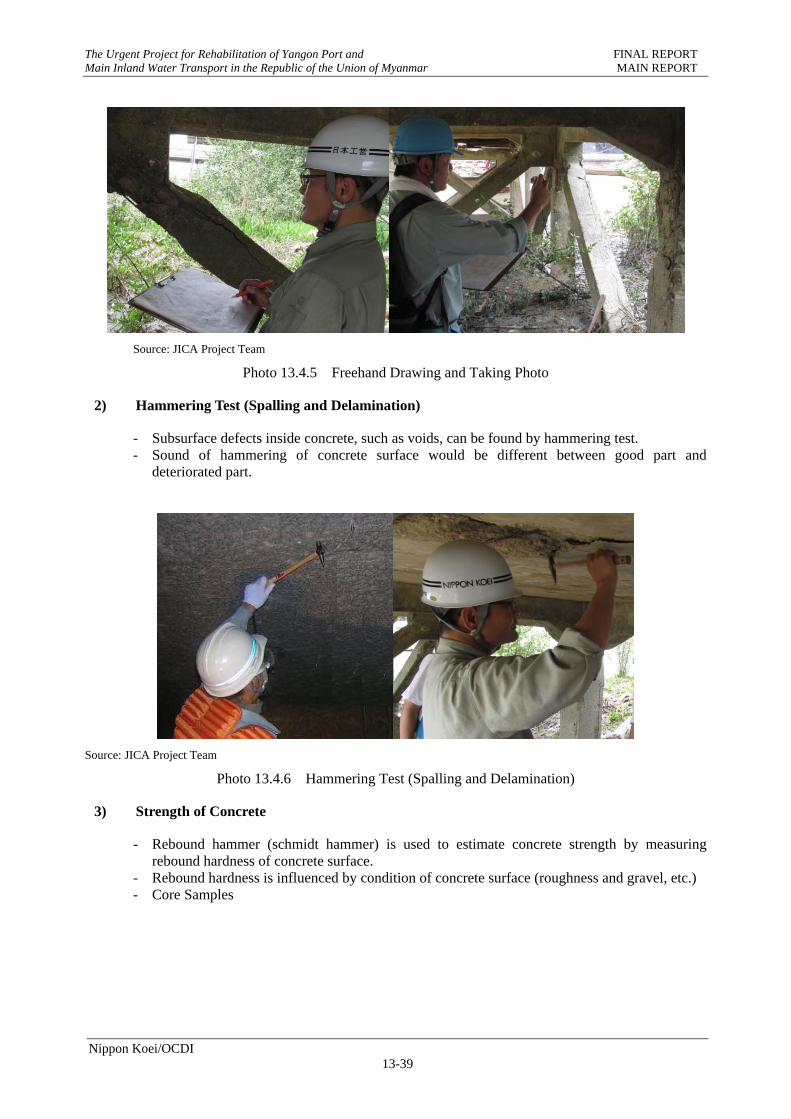
The Urgent Project for Rehabilitation of Yangon Port and FINAL REPORT Main Inland Water Transport in the Republic of the Union of Myanmar MAIN REPORT
Nippon Koei/OCDI 13-39
Source: JICA Project Team
Photo 13.4.5 Freehand Drawing and Taking Photo
2) Hammering Test (Spalling and Delamination)
- Subsurface defects inside concrete, such as voids, can be found by hammering test. - Sound of hammering of concrete surface would be different between good part and
deteriorated part.
Source: JICA Project Team
Photo 13.4.6 Hammering Test (Spalling and Delamination)
3) Strength of Concrete
- Rebound hammer (schmidt hammer) is used to estimate concrete strength by measuring rebound hardness of concrete surface.
- Rebound hardness is influenced by condition of concrete surface (roughness and gravel, etc.) - Core Samples
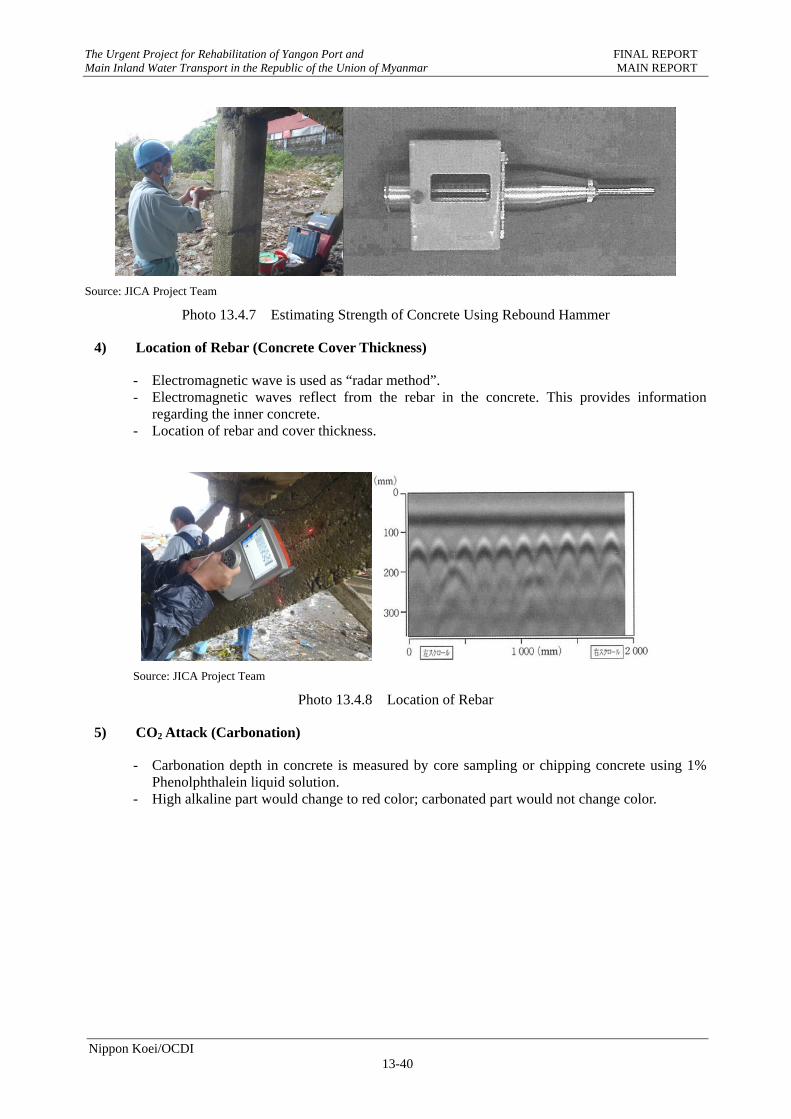
The Urgent Project for Rehabilitation of Yangon Port and FINAL REPORT Main Inland Water Transport in the Republic of the Union of Myanmar MAIN REPORT
Nippon Koei/OCDI 13-40
Source: JICA Project Team
Photo 13.4.7 Estimating Strength of Concrete Using Rebound Hammer
4) Location of Rebar (Concrete Cover Thickness)
- Electromagnetic wave is used as “radar method”. - Electromagnetic waves reflect from the rebar in the concrete. This provides information
regarding the inner concrete. - Location of rebar and cover thickness.
Source: JICA Project Team
Photo 13.4.8 Location of Rebar
5) CO2 Attack (Carbonation)
- Carbonation depth in concrete is measured by core sampling or chipping concrete using 1% Phenolphthalein liquid solution.
- High alkaline part would change to red color; carbonated part would not change color.
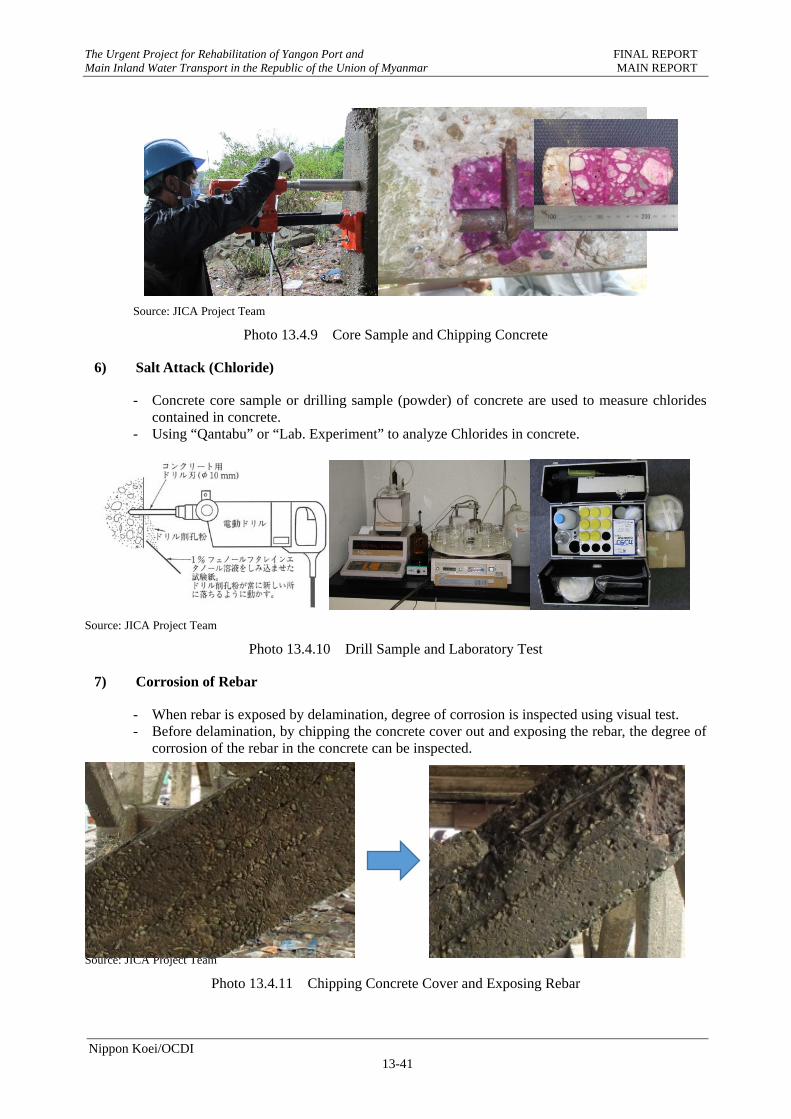
The Urgent Project for Rehabilitation of Yangon Port and FINAL REPORT Main Inland Water Transport in the Republic of the Union of Myanmar MAIN REPORT
Nippon Koei/OCDI 13-41
Source: JICA Project Team
Photo 13.4.9 Core Sample and Chipping Concrete
6) Salt Attack (Chloride)
- Concrete core sample or drilling sample (powder) of concrete are used to measure chlorides contained in concrete.
- Using “Qantabu” or “Lab. Experiment” to analyze Chlorides in concrete.
Source: JICA Project Team
Photo 13.4.10 Drill Sample and Laboratory Test
7) Corrosion of Rebar
- When rebar is exposed by delamination, degree of corrosion is inspected using visual test. - Before delamination, by chipping the concrete cover out and exposing the rebar, the degree of
corrosion of the rebar in the concrete can be inspected.
Source: JICA Project Team
Photo 13.4.11 Chipping Concrete Cover and Exposing Rebar
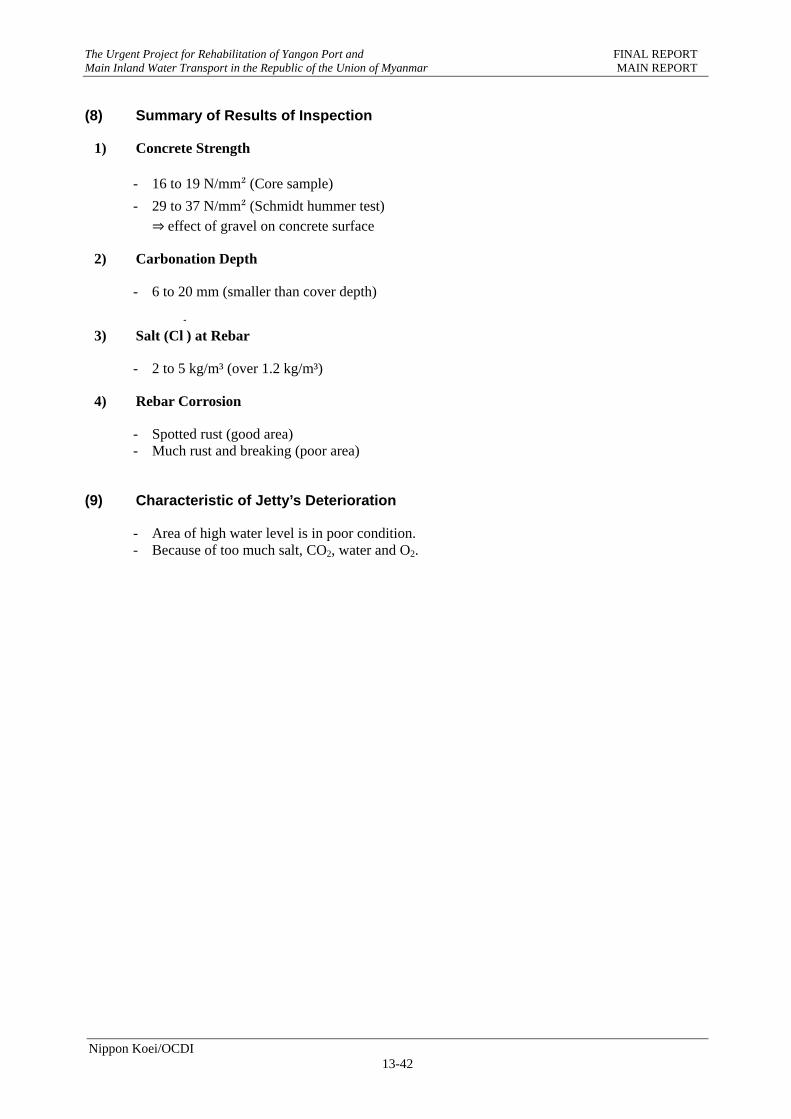
The Urgent Project for Rehabilitation of Yangon Port and FINAL REPORT Main Inland Water Transport in the Republic of the Union of Myanmar MAIN REPORT
Nippon Koei/OCDI 13-42
(8) Summary of Results of Inspection
1) Concrete Strength
- 16 to 19 N/mm² (Core sample)
- 29 to 37 N/mm² (Schmidt hummer test) ⇒effect of gravel on concrete surface
2) Carbonation Depth
- 6 to 20 mm (smaller than cover depth)
3) Salt (Cl-
) at Rebar
- 2 to 5 kg/m³ (over 1.2 kg/m³)
4) Rebar Corrosion
- Spotted rust (good area) - Much rust and breaking (poor area)
(9) Characteristic of Jetty’s Deterioration
- Area of high water level is in poor condition. - Because of too much salt, CO2, water and O2.
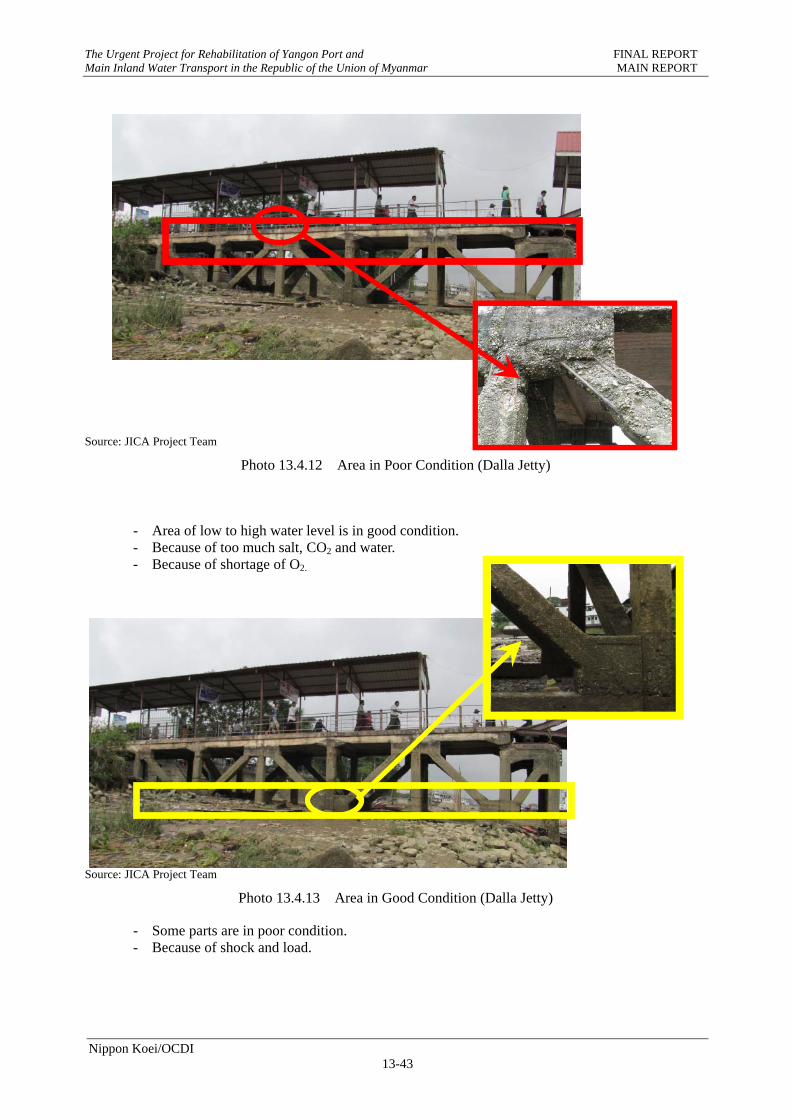
The Urgent Project for Rehabilitation of Yangon Port and FINAL REPORT Main Inland Water Transport in the Republic of the Union of Myanmar MAIN REPORT
Nippon Koei/OCDI 13-43
Source: JICA Project Team
Photo 13.4.12 Area in Poor Condition (Dalla Jetty)
- Area of low to high water level is in good condition. - Because of too much salt, CO2 and water. - Because of shortage of O2.
Source: JICA Project Team
Photo 13.4.13 Area in Good Condition (Dalla Jetty)
- Some parts are in poor condition. - Because of shock and load.
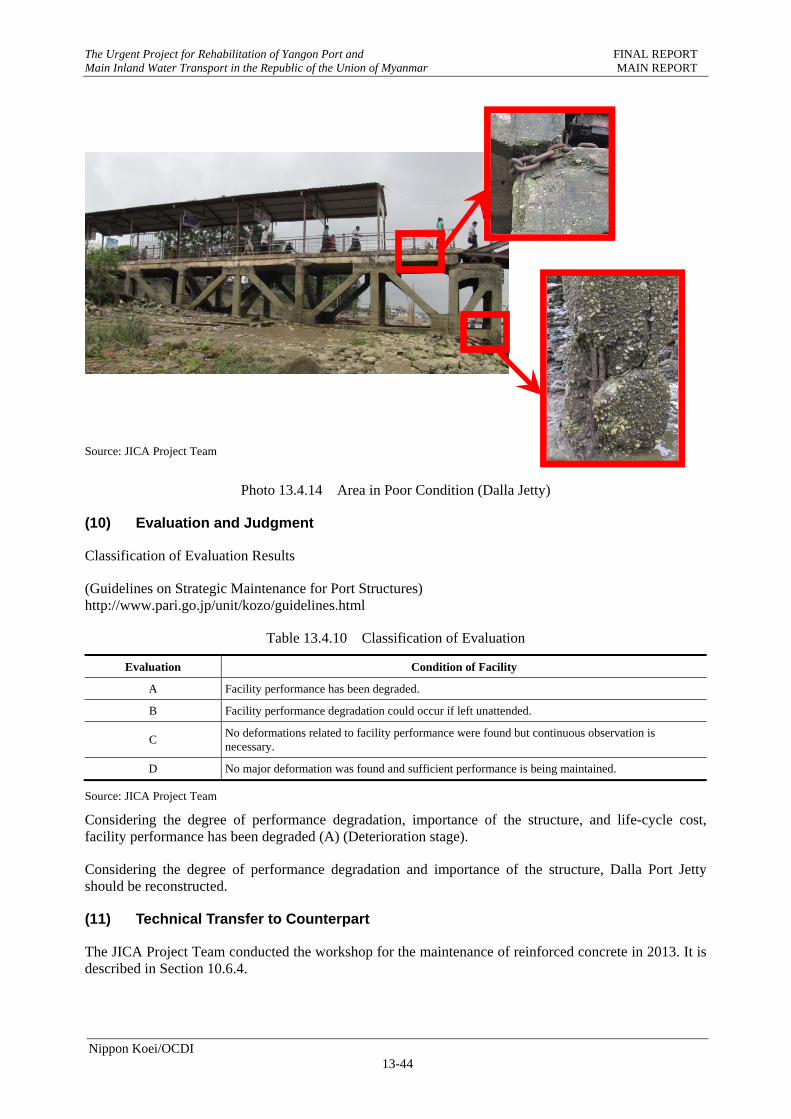
The Urgent Project for Rehabilitation of Yangon Port and FINAL REPORT Main Inland Water Transport in the Republic of the Union of Myanmar MAIN REPORT
Nippon Koei/OCDI 13-44
Source: JICA Project Team
Photo 13.4.14 Area in Poor Condition (Dalla Jetty)
(10) Evaluation and Judgment
Classification of Evaluation Results
(Guidelines on Strategic Maintenance for Port Structures) http://www.pari.go.jp/unit/kozo/guidelines.html
Table 13.4.10 Classification of Evaluation
Evaluation Condition of Facility
A Facility performance has been degraded.
B Facility performance degradation could occur if left unattended.
C No deformations related to facility performance were found but continuous observation is necessary.
D No major deformation was found and sufficient performance is being maintained.
Source: JICA Project Team
Considering the degree of performance degradation, importance of the structure, and life-cycle cost, facility performance has been degraded (A) (Deterioration stage).
Considering the degree of performance degradation and importance of the structure, Dalla Port Jetty should be reconstructed.
(11) Technical Transfer to Counterpart
The JICA Project Team conducted the workshop for the maintenance of reinforced concrete in 2013. It is described in Section 10.6.4.
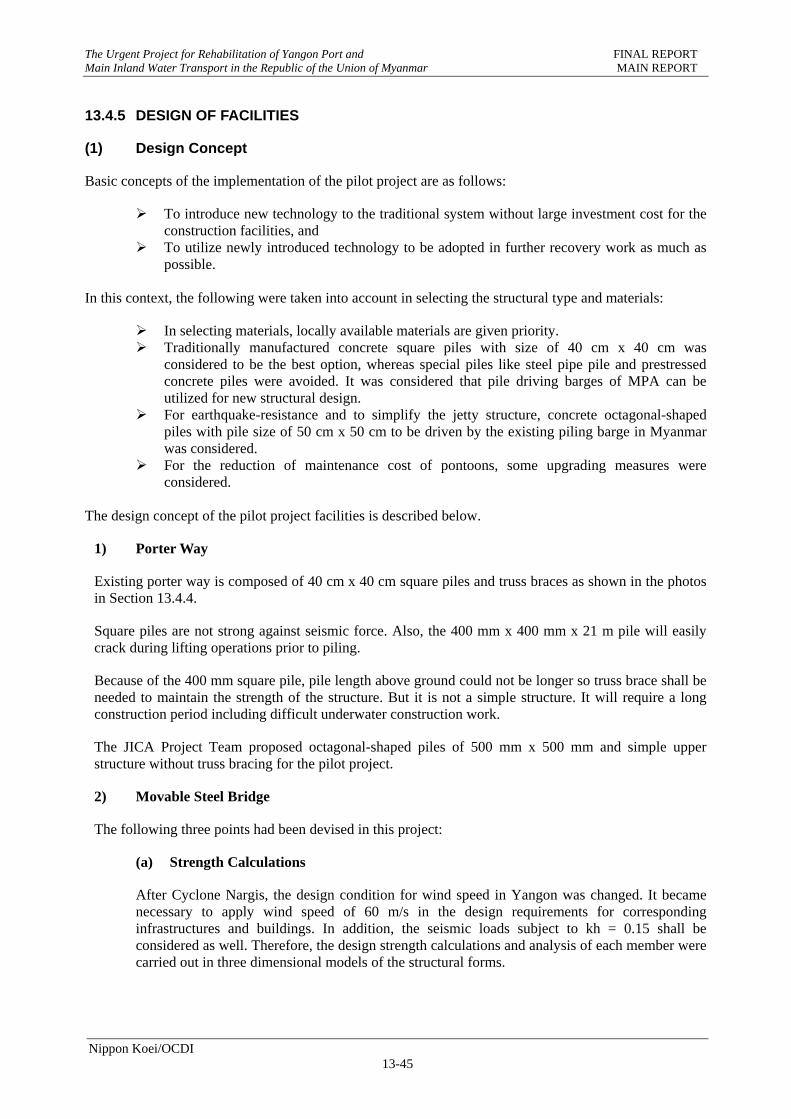
The Urgent Project for Rehabilitation of Yangon Port and FINAL REPORT Main Inland Water Transport in the Republic of the Union of Myanmar MAIN REPORT
Nippon Koei/OCDI 13-45
13.4.5 DESIGN OF FACILITIES
(1) Design Concept
Basic concepts of the implementation of the pilot project are as follows:
To introduce new technology to the traditional system without large investment cost for the construction facilities, and
To utilize newly introduced technology to be adopted in further recovery work as much as possible.
In this context, the following were taken into account in selecting the structural type and materials:
In selecting materials, locally available materials are given priority. Traditionally manufactured concrete square piles with size of 40 cm x 40 cm was
considered to be the best option, whereas special piles like steel pipe pile and prestressed concrete piles were avoided. It was considered that pile driving barges of MPA can be utilized for new structural design.
For earthquake-resistance and to simplify the jetty structure, concrete octagonal-shaped piles with pile size of 50 cm x 50 cm to be driven by the existing piling barge in Myanmar was considered.
For the reduction of maintenance cost of pontoons, some upgrading measures were considered.
The design concept of the pilot project facilities is described below.
1) Porter Way
Existing porter way is composed of 40 cm x 40 cm square piles and truss braces as shown in the photos in Section 13.4.4.
Square piles are not strong against seismic force. Also, the 400 mm x 400 mm x 21 m pile will easily crack during lifting operations prior to piling.
Because of the 400 mm square pile, pile length above ground could not be longer so truss brace shall be needed to maintain the strength of the structure. But it is not a simple structure. It will require a long construction period including difficult underwater construction work.
The JICA Project Team proposed octagonal-shaped piles of 500 mm x 500 mm and simple upper structure without truss bracing for the pilot project.
2) Movable Steel Bridge
The following three points had been devised in this project:
(a) Strength Calculations
After Cyclone Nargis, the design condition for wind speed in Yangon was changed. It became necessary to apply wind speed of 60 m/s in the design requirements for corresponding infrastructures and buildings. In addition, the seismic loads subject to kh = 0.15 shall be considered as well. Therefore, the design strength calculations and analysis of each member were carried out in three dimensional models of the structural forms.
The Urgent Project for Rehabilitation of Yangon Port and FINAL REPORT Main Inland Water Transport in the Republic of the Union of Myanmar MAIN REPORT
Nippon Koei/OCDI 13-46
(b) Change of Structure Type
The roof coverage is required for this movable steel bridge. If an arch type like the existing is used, roof construction cannot be simplified due to different distances to the roof. Therefore, considering the construction simplification and precision improvement, the roof had to be a linear structure.
(c) Installation of Center Pin
By placing the center pin on the pontoon side, the curvature of the saucer of the roller and chain will not be required, and the structure was simplified. In addition, it is possible to reduce the misalignment towards the normal parallel direction. However - as with the existing pontoon, pin or the like - in order to reduce the impact to the joints of the pontoon side and porter way side, it is important to regularly check the tension in the anchor chains of the pontoon.
3) Pontoon
The pontoon was constructed at IWT Dalla Dockyard to accomplish the technical transfer of the design and construction by the JICA Project Team. The following new technologies were selected. The details are shown in Section 11.7.
The pontoon structure type was studied. The characteristics of each type of pontoon structure are shown in Table 13.4.11. Because it is difficult to construct prestressed concrete for pontoons in Myanmar, RC hybrid type was selected. Almost all pontoons in Myanmar are of the steel type. The initial cost for steel pontoons in Myanmar is cheap because they are built with thin steel plates and have poor paint application. However, frequency of maintenance is as little as two years and the cost is high. On the other hand, in Japan, steel type pontoons have thick steel plates, good quality marine paint and furthermore, are provided with anode protection, where the initial cost is expensive but the maintenance frequency and cost are low.
Table 13.4.11 Characteristics of Pontoon Structure Type
Type Anti -corrosion Anchor Size Draft Possibility of Big Size Cost
(in Japan)
Steel poor small small Best 1.3
RC concrete good big big Poor 1.0
PC concrete good middle big Good 1.2
PC hybrid (PC concrete + steel beam) good small middle Good 1.0
RC hybrid (RC concrete + steel plate) good small middle Poor 1.2
Source: JICA Project Team
The mooring type for the pontoons was studied. The characteristics of each type of anchor are shown in Table 13.4.12. Based on the site conditions, cost, and impact on passengers, the anchor chain (taut) type was selected. The anchor chain (taut) type is commonly used in Myanmar.
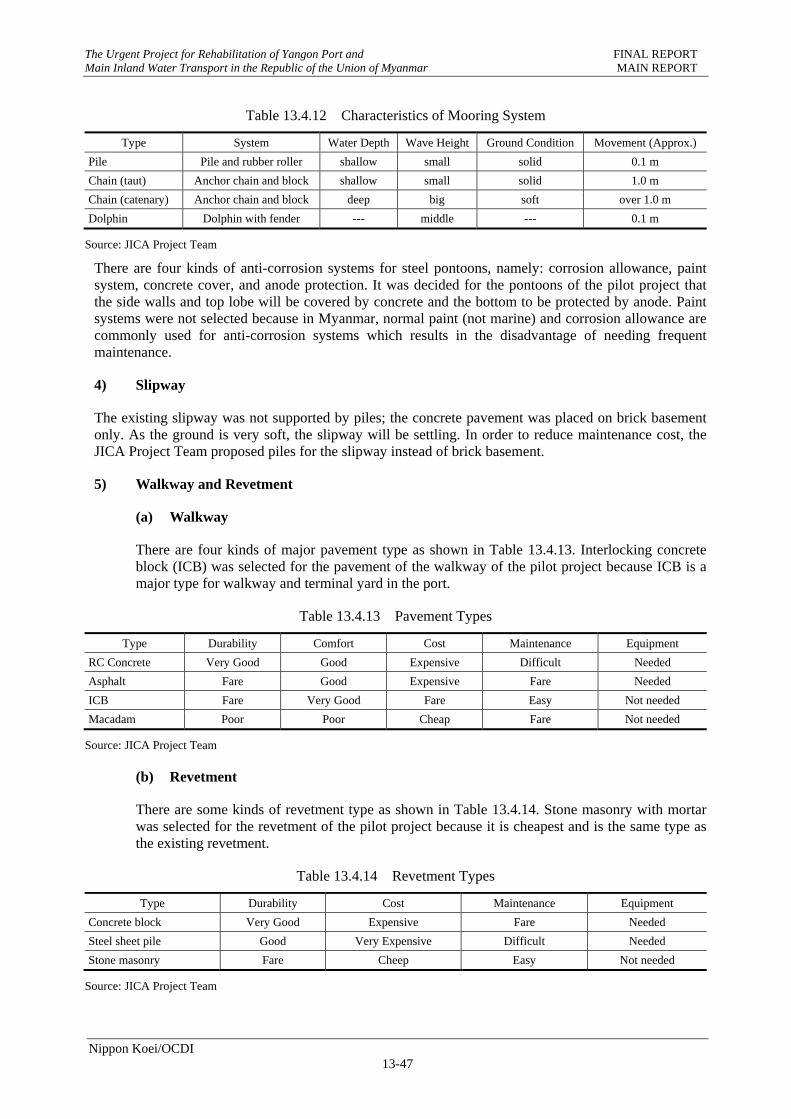
The Urgent Project for Rehabilitation of Yangon Port and FINAL REPORT Main Inland Water Transport in the Republic of the Union of Myanmar MAIN REPORT
Nippon Koei/OCDI 13-47
Table 13.4.12 Characteristics of Mooring System
Type System Water Depth Wave Height Ground Condition Movement (Approx.)
Pile Pile and rubber roller shallow small solid 0.1 m
Chain (taut) Anchor chain and block shallow small solid 1.0 m
Chain (catenary) Anchor chain and block deep big soft over 1.0 m
Dolphin Dolphin with fender --- middle --- 0.1 m
Source: JICA Project Team
There are four kinds of anti-corrosion systems for steel pontoons, namely: corrosion allowance, paint system, concrete cover, and anode protection. It was decided for the pontoons of the pilot project that the side walls and top lobe will be covered by concrete and the bottom to be protected by anode. Paint systems were not selected because in Myanmar, normal paint (not marine) and corrosion allowance are commonly used for anti-corrosion systems which results in the disadvantage of needing frequent maintenance.
4) Slipway
The existing slipway was not supported by piles; the concrete pavement was placed on brick basement only. As the ground is very soft, the slipway will be settling. In order to reduce maintenance cost, the JICA Project Team proposed piles for the slipway instead of brick basement.
5) Walkway and Revetment
(a) Walkway
There are four kinds of major pavement type as shown in Table 13.4.13. Interlocking concrete block (ICB) was selected for the pavement of the walkway of the pilot project because ICB is a major type for walkway and terminal yard in the port.
Table 13.4.13 Pavement Types
Type Durability Comfort Cost Maintenance Equipment
RC Concrete Very Good Good Expensive Difficult Needed
Asphalt Fare Good Expensive Fare Needed
ICB Fare Very Good Fare Easy Not needed
Macadam Poor Poor Cheap Fare Not needed
Source: JICA Project Team
(b) Revetment
There are some kinds of revetment type as shown in Table 13.4.14. Stone masonry with mortar was selected for the revetment of the pilot project because it is cheapest and is the same type as the existing revetment.
Table 13.4.14 Revetment Types
Type Durability Cost Maintenance Equipment
Concrete block Very Good Expensive Fare Needed
Steel sheet pile Good Very Expensive Difficult Needed
Stone masonry Fare Cheep Easy Not needed
Source: JICA Project Team
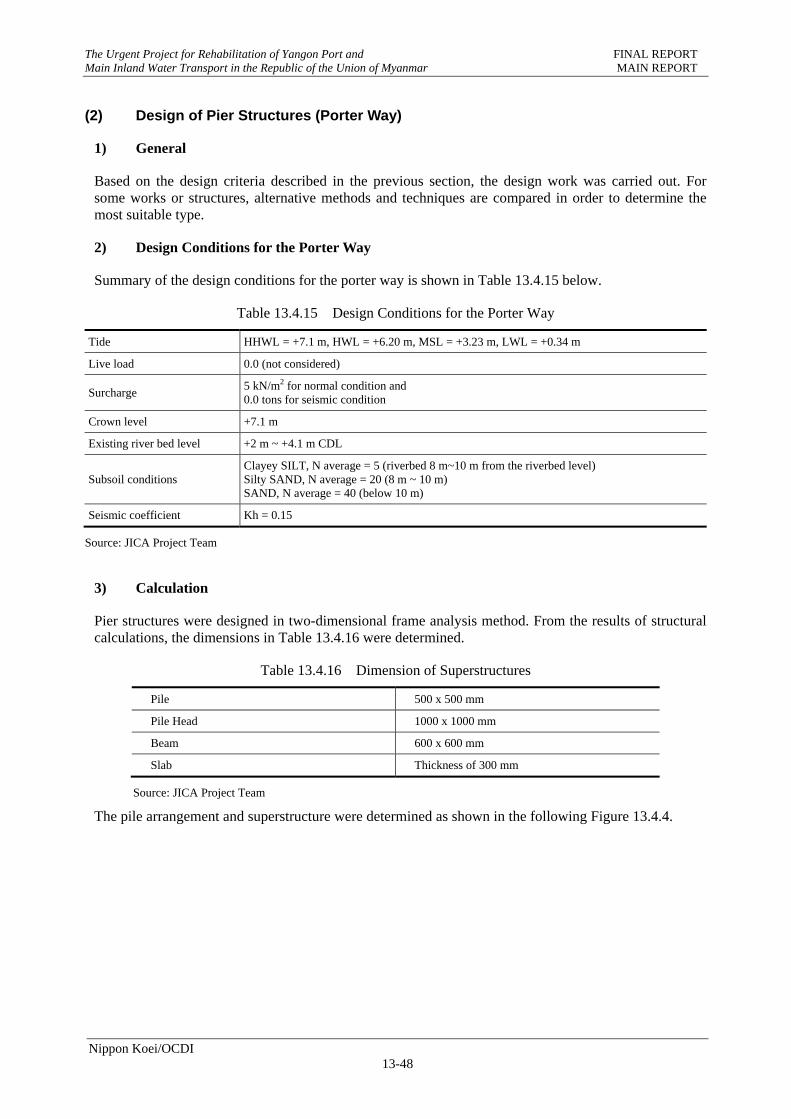
The Urgent Project for Rehabilitation of Yangon Port and FINAL REPORT Main Inland Water Transport in the Republic of the Union of Myanmar MAIN REPORT
Nippon Koei/OCDI 13-48
(2) Design of Pier Structures (Porter Way)
1) General
Based on the design criteria described in the previous section, the design work was carried out. For some works or structures, alternative methods and techniques are compared in order to determine the most suitable type.
2) Design Conditions for the Porter Way
Summary of the design conditions for the porter way is shown in Table 13.4.15 below.
Table 13.4.15 Design Conditions for the Porter Way
Tide HHWL = +7.1 m, HWL = +6.20 m, MSL = +3.23 m, LWL = +0.34 m
Live load 0.0 (not considered)
Surcharge 5 kN/m2 for normal condition and 0.0 tons for seismic condition
Crown level +7.1 m
Existing river bed level +2 m ~ +4.1 m CDL
Subsoil conditions Clayey SILT, N average = 5 (riverbed 8 m~10 m from the riverbed level) Silty SAND, N average = 20 (8 m ~ 10 m) SAND, N average = 40 (below 10 m)
Seismic coefficient Kh = 0.15
Source: JICA Project Team
3) Calculation
Pier structures were designed in two-dimensional frame analysis method. From the results of structural calculations, the dimensions in Table 13.4.16 were determined.
Table 13.4.16 Dimension of Superstructures
Pile 500 x 500 mm
Pile Head 1000 x 1000 mm
Beam 600 x 600 mm
Slab Thickness of 300 mm
Source: JICA Project Team
The pile arrangement and superstructure were determined as shown in the following Figure 13.4.4.
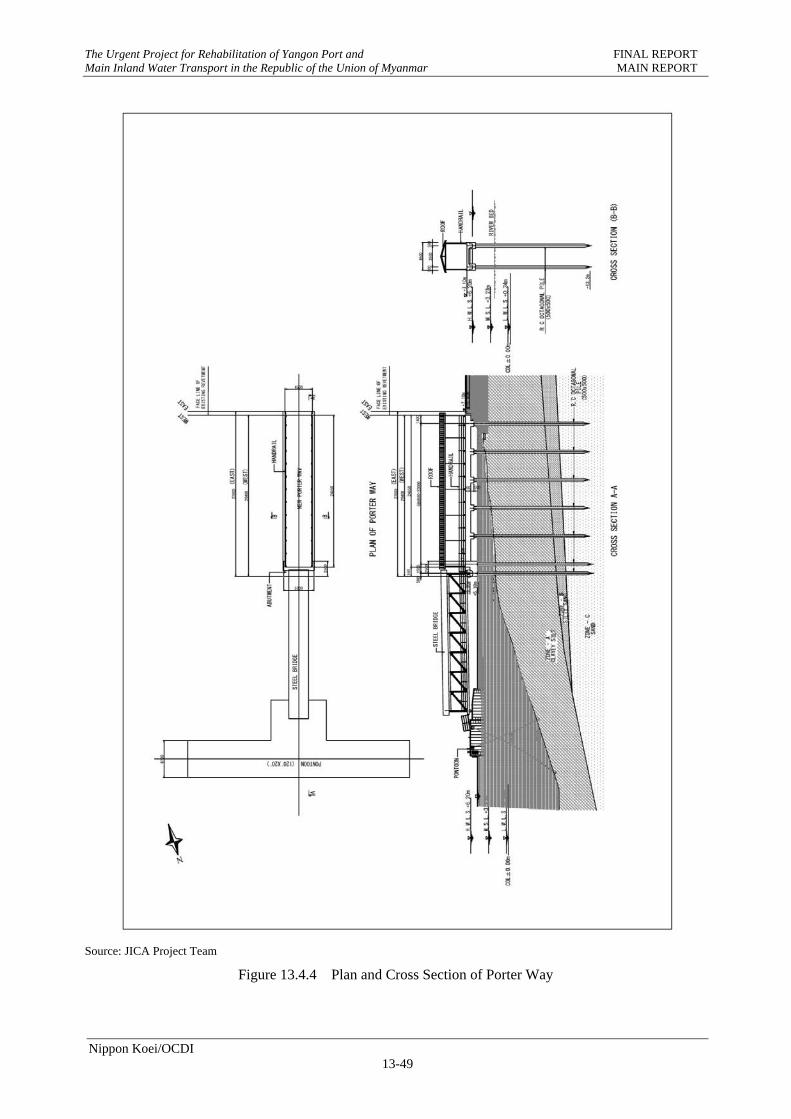
The Urgent Project for Rehabilitation of Yangon Port and FINAL REPORT Main Inland Water Transport in the Republic of the Union of Myanmar MAIN REPORT
Nippon Koei/OCDI 13-49
Source: JICA Project Team
Figure 13.4.4 Plan and Cross Section of Porter Way
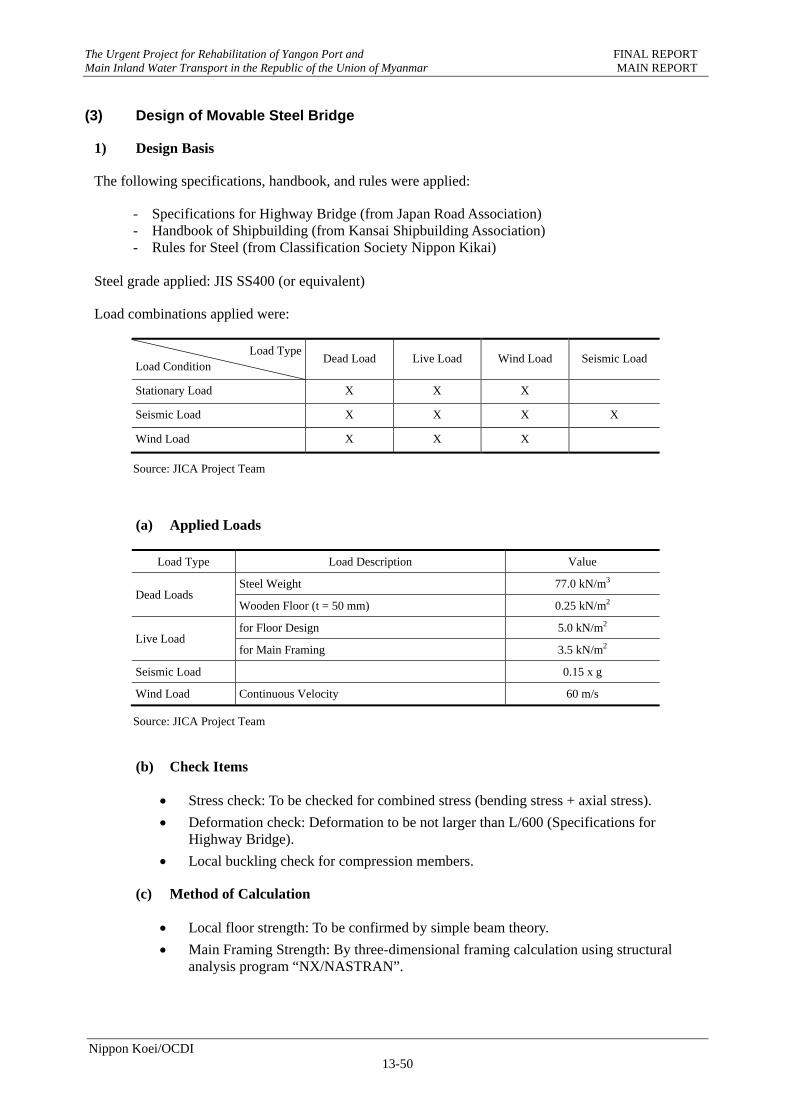
The Urgent Project for Rehabilitation of Yangon Port and FINAL REPORT Main Inland Water Transport in the Republic of the Union of Myanmar MAIN REPORT
Nippon Koei/OCDI 13-50
(3) Design of Movable Steel Bridge
1) Design Basis
The following specifications, handbook, and rules were applied:
- Specifications for Highway Bridge (from Japan Road Association) - Handbook of Shipbuilding (from Kansai Shipbuilding Association) - Rules for Steel (from Classification Society Nippon Kikai)
Steel grade applied: JIS SS400 (or equivalent)
Load combinations applied were:
Load Type Load Condition
Dead Load Live Load Wind Load Seismic Load
Stationary Load X X X
Seismic Load X X X X
Wind Load X X X
Source: JICA Project Team
(a) Applied Loads
Load Type Load Description Value
Dead Loads Steel Weight 77.0 kN/m3
Wooden Floor (t = 50 mm) 0.25 kN/m2
Live Load for Floor Design 5.0 kN/m2
for Main Framing 3.5 kN/m2
Seismic Load 0.15 x g
Wind Load Continuous Velocity 60 m/s
Source: JICA Project Team
(b) Check Items
Stress check: To be checked for combined stress (bending stress + axial stress).
Deformation check: Deformation to be not larger than L/600 (Specifications for Highway Bridge).
Local buckling check for compression members.
(c) Method of Calculation
Local floor strength: To be confirmed by simple beam theory.
Main Framing Strength: By three-dimensional framing calculation using structural analysis program “NX/NASTRAN”.
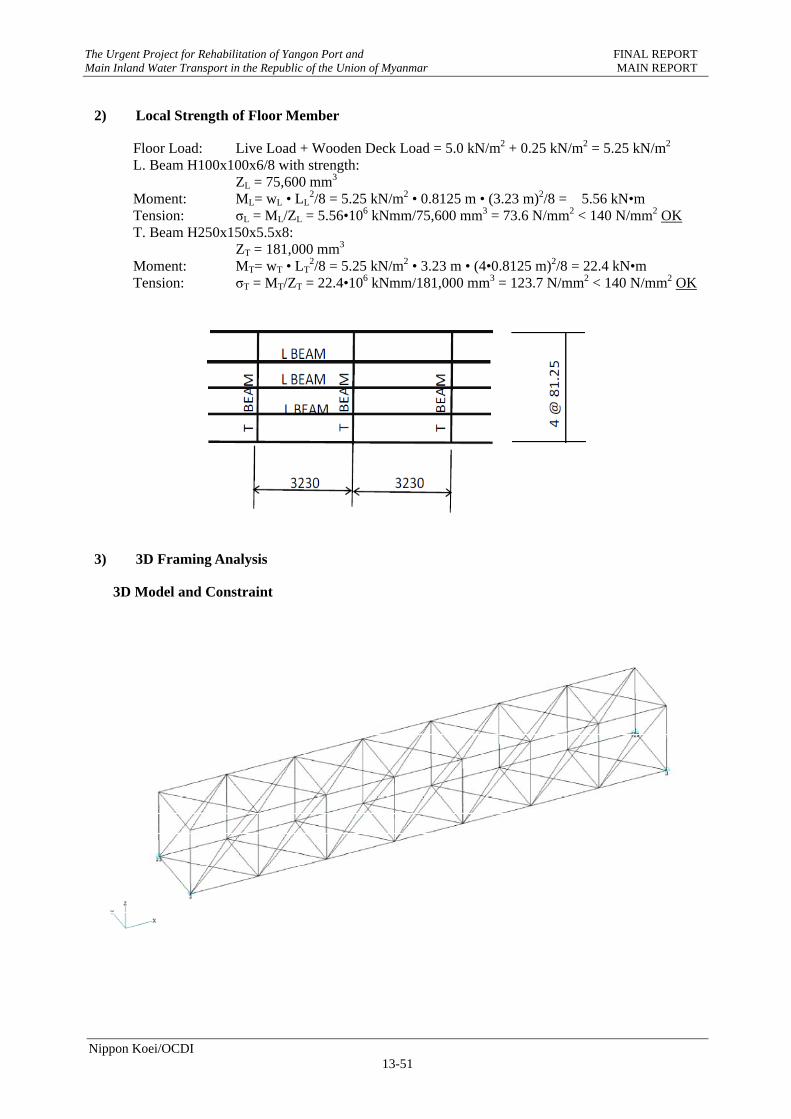
The Urgent Project for Rehabilitation of Yangon Port and FINAL REPORT Main Inland Water Transport in the Republic of the Union of Myanmar MAIN REPORT
Nippon Koei/OCDI 13-51
2) Local Strength of Floor Member
Floor Load: Live Load + Wooden Deck Load = 5.0 kN/m2 + 0.25 kN/m2 = 5.25 kN/m2 L. Beam H100x100x6/8 with strength:
ZL = 75,600 mm3 Moment: ML= wL • LL
2/8 = 5.25 kN/m2 • 0.8125 m • (3.23 m)2/8 = 5.56 kN•m Tension: σL = ML/ZL = 5.56•106 kNmm/75,600 mm3 = 73.6 N/mm2 < 140 N/mm2 OK T. Beam H250x150x5.5x8:
ZT = 181,000 mm3 Moment: MT= wT • LT
2/8 = 5.25 kN/m2 • 3.23 m • (4•0.8125 m)2/8 = 22.4 kN•m Tension: σT = MT/ZT = 22.4•106 kNmm/181,000 mm3 = 123.7 N/mm2 < 140 N/mm2 OK
3) 3D Framing Analysis
3D Model and Constraint
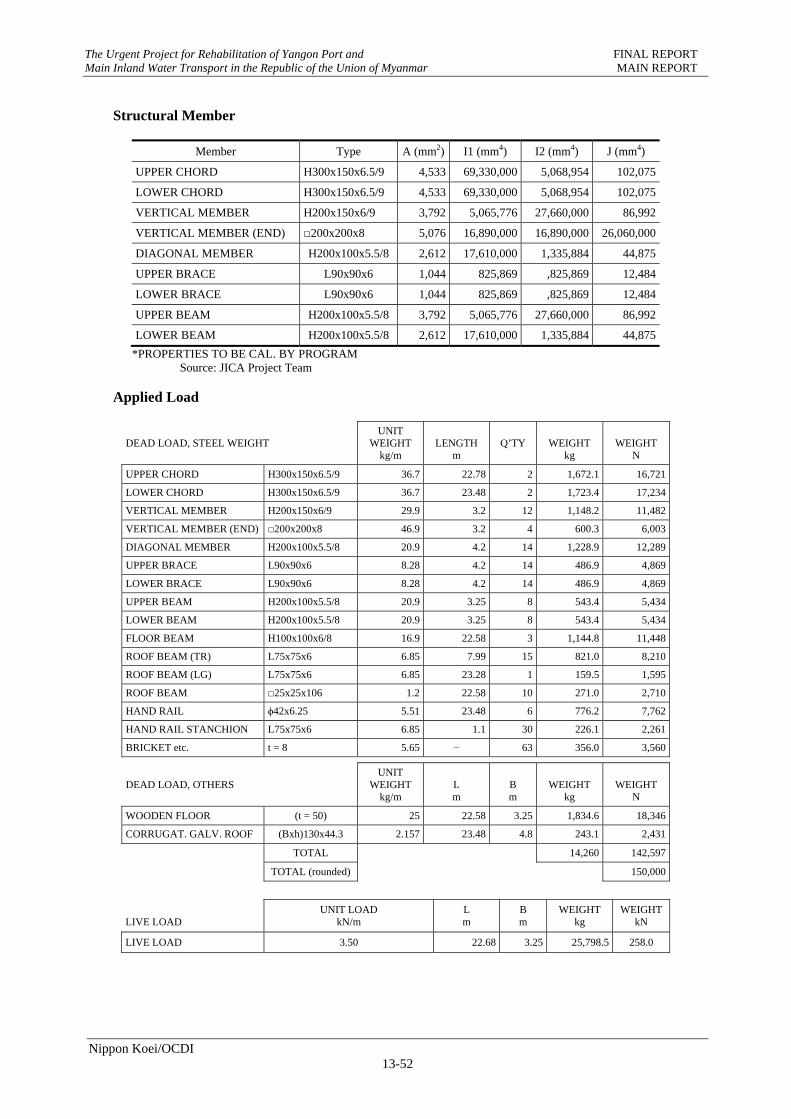
The Urgent Project for Rehabilitation of Yangon Port and FINAL REPORT Main Inland Water Transport in the Republic of the Union of Myanmar MAIN REPORT
Nippon Koei/OCDI 13-52
Structural Member
Member Type A (mm2) I1 (mm4) I2 (mm4) J (mm4)
UPPER CHORD H300x150x6.5/9 4,533 69,330,000 5,068,954 102,075
LOWER CHORD H300x150x6.5/9 4,533 69,330,000 5,068,954 102,075
VERTICAL MEMBER H200x150x6/9 3,792 5,065,776 27,660,000 86,992
VERTICAL MEMBER (END) □200x200x8 5,076 16,890,000 16,890,000 26,060,000
DIAGONAL MEMBER H200x100x5.5/8 2,612 17,610,000 1,335,884 44,875
UPPER BRACE L90x90x6 1,044 825,869 ,825,869 12,484
LOWER BRACE L90x90x6 1,044 825,869 ,825,869 12,484
UPPER BEAM H200x100x5.5/8 3,792 5,065,776 27,660,000 86,992
LOWER BEAM H200x100x5.5/8 2,612 17,610,000 1,335,884 44,875
*PROPERTIES TO BE CAL. BY PROGRAM Source: JICA Project Team
Applied Load
DEAD LOAD, STEEL WEIGHT UNIT
WEIGHT kg/m
LENGTH m
Q’TY
WEIGHT kg
WEIGHT N
UPPER CHORD H300x150x6.5/9 36.7 22.78 2 1,672.1 16,721
LOWER CHORD H300x150x6.5/9 36.7 23.48 2 1,723.4 17,234
VERTICAL MEMBER H200x150x6/9 29.9 3.2 12 1,148.2 11,482
VERTICAL MEMBER (END) □200x200x8 46.9 3.2 4 600.3 6,003
DIAGONAL MEMBER H200x100x5.5/8 20.9 4.2 14 1,228.9 12,289
UPPER BRACE L90x90x6 8.28 4.2 14 486.9 4,869
LOWER BRACE L90x90x6 8.28 4.2 14 486.9 4,869
UPPER BEAM H200x100x5.5/8 20.9 3.25 8 543.4 5,434
LOWER BEAM H200x100x5.5/8 20.9 3.25 8 543.4 5,434
FLOOR BEAM H100x100x6/8 16.9 22.58 3 1,144.8 11,448
ROOF BEAM (TR) L75x75x6 6.85 7.99 15 821.0 8,210
ROOF BEAM (LG) L75x75x6 6.85 23.28 1 159.5 1,595
ROOF BEAM □25x25x106 1.2 22.58 10 271.0 2,710
HAND RAIL ϕ42x6.25 5.51 23.48 6 776.2 7,762
HAND RAIL STANCHION L75x75x6 6.85 1.1 30 226.1 2,261
BRICKET etc. t = 8 5.65 − 63 356.0 3,560
DEAD LOAD, OTHERS UNIT
WEIGHT kg/m
L m
B m
WEIGHT kg
WEIGHT N
WOODEN FLOOR (t = 50) 25 22.58 3.25 1,834.6 18,346
CORRUGAT. GALV. ROOF (Bxh)130x44.3 2.157 23.48 4.8 243.1 2,431
TOTAL 14,260 142,597
TOTAL (rounded) 150,000
LIVE LOAD UNIT LOAD
kN/m L m
B m
WEIGHT kg
WEIGHTkN
LIVE LOAD 3.50 22.68 3.25 25,798.5 258.0
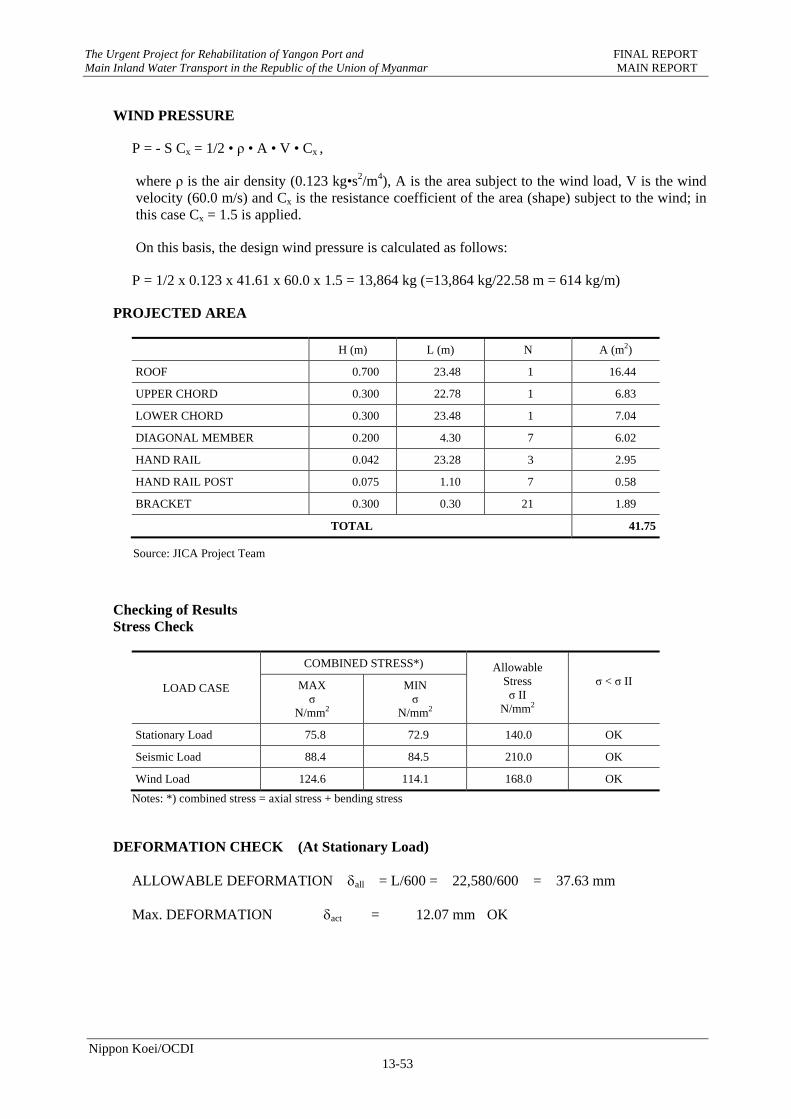
The Urgent Project for Rehabilitation of Yangon Port and FINAL REPORT Main Inland Water Transport in the Republic of the Union of Myanmar MAIN REPORT
Nippon Koei/OCDI 13-53
WIND PRESSURE
P = - S Cx = 1/2 • ρ • A • V • Cx ,
where ρ is the air density (0.123 kg•s2/m4), A is the area subject to the wind load, V is the wind velocity (60.0 m/s) and Cx is the resistance coefficient of the area (shape) subject to the wind; in this case Cx = 1.5 is applied.
On this basis, the design wind pressure is calculated as follows:
P = 1/2 x 0.123 x 41.61 x 60.0 x 1.5 = 13,864 kg (=13,864 kg/22.58 m = 614 kg/m)
PROJECTED AREA
H (m) L (m) N A (m2)
ROOF 0.700 23.48 1 16.44
UPPER CHORD 0.300 22.78 1 6.83
LOWER CHORD 0.300 23.48 1 7.04
DIAGONAL MEMBER 0.200 4.30 7 6.02
HAND RAIL 0.042 23.28 3 2.95
HAND RAIL POST 0.075 1.10 7 0.58
BRACKET 0.300 0.30 21 1.89
TOTAL 41.75
Source: JICA Project Team
Checking of Results Stress Check
LOAD CASE
COMBINED STRESS*) Allowable Stress σ II
N/mm2
σ < σ II
MAX σ
N/mm2
MIN σ
N/mm2
Stationary Load 75.8 72.9 140.0 OK
Seismic Load 88.4 84.5 210.0 OK
Wind Load 124.6 114.1 168.0 OK
Notes: *) combined stress = axial stress + bending stress
DEFORMATION CHECK (At Stationary Load)
ALLOWABLE DEFORMATION all = L/600 = 22,580/600 = 37.63 mm
Max. DEFORMATION act = 12.07 mm OK
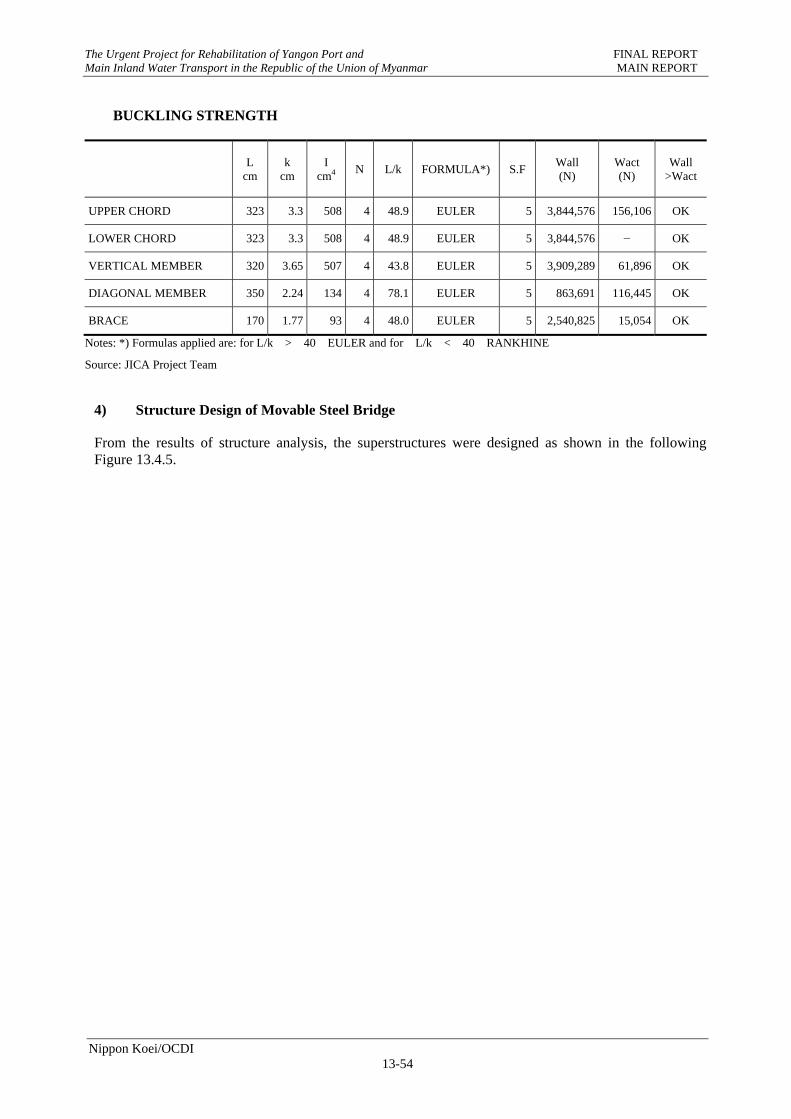
The Urgent Project for Rehabilitation of Yangon Port and FINAL REPORT Main Inland Water Transport in the Republic of the Union of Myanmar MAIN REPORT
Nippon Koei/OCDI 13-54
BUCKLING STRENGTH
L
cm k
cm I
cm4 N L/k FORMULA*) S.FWall (N)
Wact (N)
Wall >Wact
UPPER CHORD 323 3.3 508 4 48.9 EULER 5 3,844,576 156,106 OK
LOWER CHORD 323 3.3 508 4 48.9 EULER 5 3,844,576 − OK
VERTICAL MEMBER 320 3.65 507 4 43.8 EULER 5 3,909,289 61,896 OK
DIAGONAL MEMBER 350 2.24 134 4 78.1 EULER 5 863,691 116,445 OK
BRACE 170 1.77 93 4 48.0 EULER 5 2,540,825 15,054 OK
Notes: *) Formulas applied are: for L/k > 40 EULER and for L/k < 40 RANKHINE
Source: JICA Project Team
4) Structure Design of Movable Steel Bridge
From the results of structure analysis, the superstructures were designed as shown in the following Figure 13.4.5.
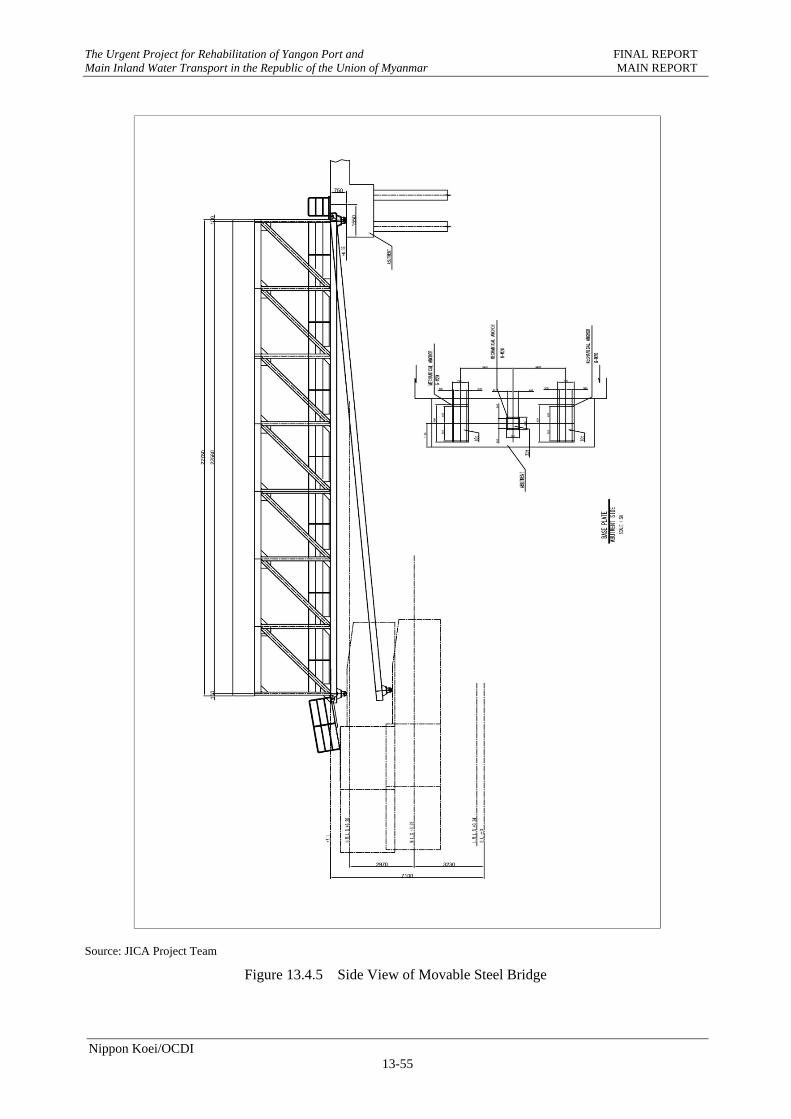
The Urgent Project for Rehabilitation of Yangon Port and FINAL REPORT Main Inland Water Transport in the Republic of the Union of Myanmar MAIN REPORT
Nippon Koei/OCDI 13-55
Source: JICA Project Team
Figure 13.4.5 Side View of Movable Steel Bridge
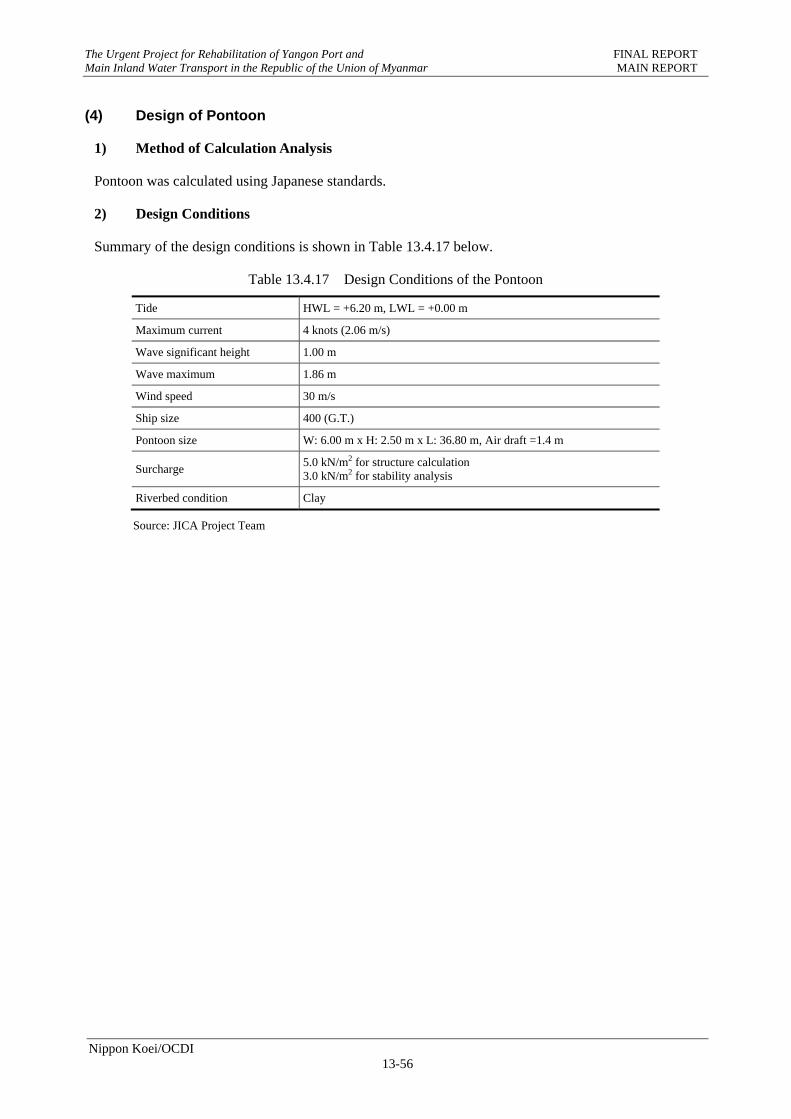
The Urgent Project for Rehabilitation of Yangon Port and FINAL REPORT Main Inland Water Transport in the Republic of the Union of Myanmar MAIN REPORT
Nippon Koei/OCDI 13-56
(4) Design of Pontoon
1) Method of Calculation Analysis
Pontoon was calculated using Japanese standards.
2) Design Conditions
Summary of the design conditions is shown in Table 13.4.17 below.
Table 13.4.17 Design Conditions of the Pontoon
Tide HWL = +6.20 m, LWL = +0.00 m
Maximum current 4 knots (2.06 m/s)
Wave significant height 1.00 m
Wave maximum 1.86 m
Wind speed 30 m/s
Ship size 400 (G.T.)
Pontoon size W: 6.00 m x H: 2.50 m x L: 36.80 m, Air draft =1.4 m
Surcharge 5.0 kN/m2 for structure calculation 3.0 kN/m2 for stability analysis
Riverbed condition Clay
Source: JICA Project Team
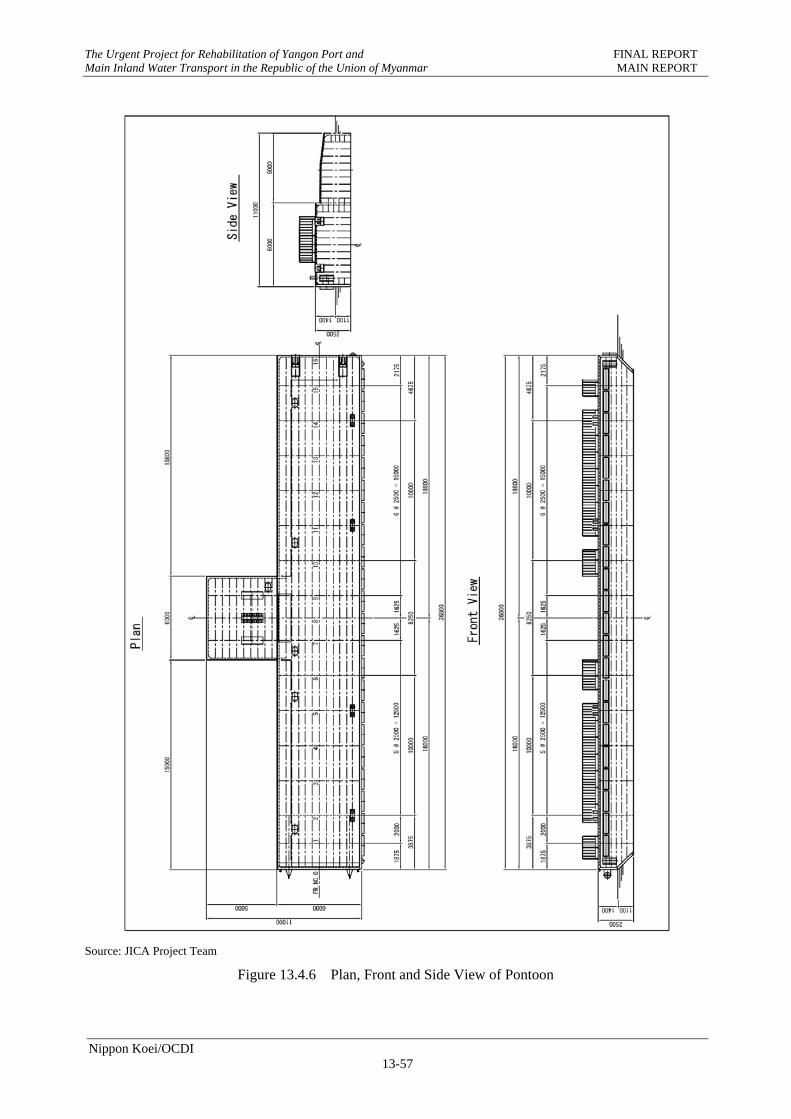
The Urgent Project for Rehabilitation of Yangon Port and FINAL REPORT Main Inland Water Transport in the Republic of the Union of Myanmar MAIN REPORT
Nippon Koei/OCDI 13-57
Source: JICA Project Team
Figure 13.4.6 Plan, Front and Side View of Pontoon
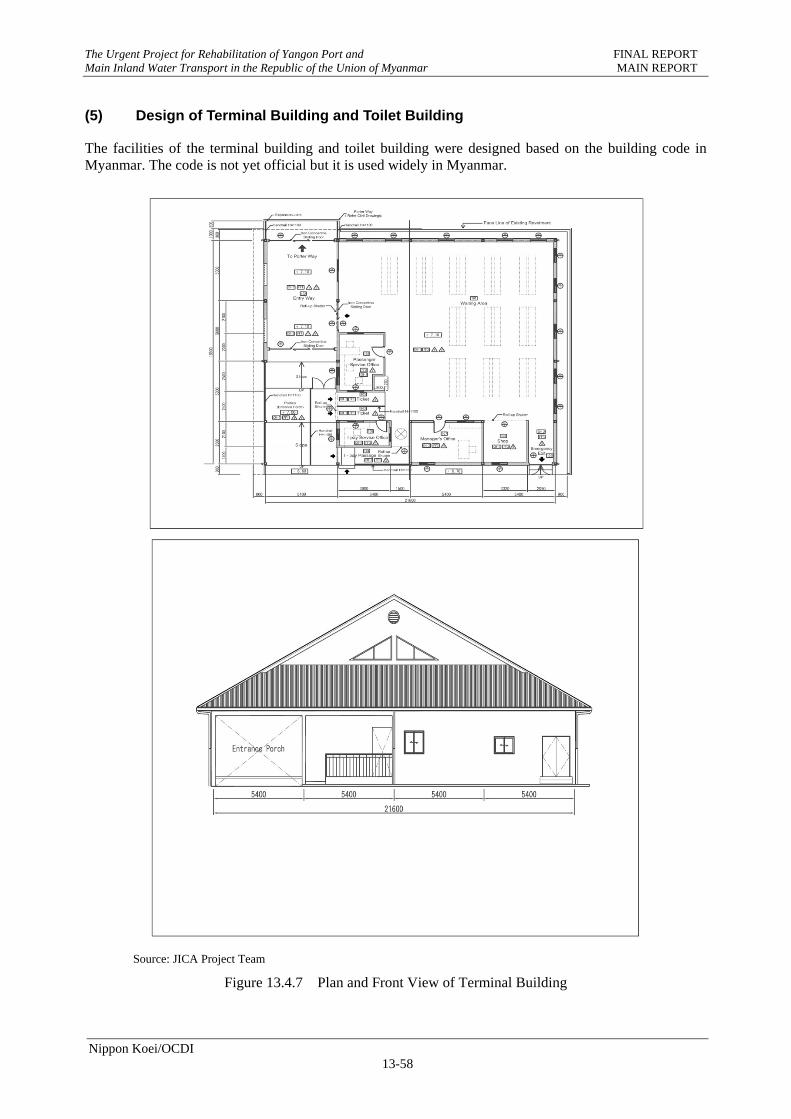
The Urgent Project for Rehabilitation of Yangon Port and FINAL REPORT Main Inland Water Transport in the Republic of the Union of Myanmar MAIN REPORT
Nippon Koei/OCDI 13-58
(5) Design of Terminal Building and Toilet Building
The facilities of the terminal building and toilet building were designed based on the building code in Myanmar. The code is not yet official but it is used widely in Myanmar.
Source: JICA Project Team
Figure 13.4.7 Plan and Front View of Terminal Building
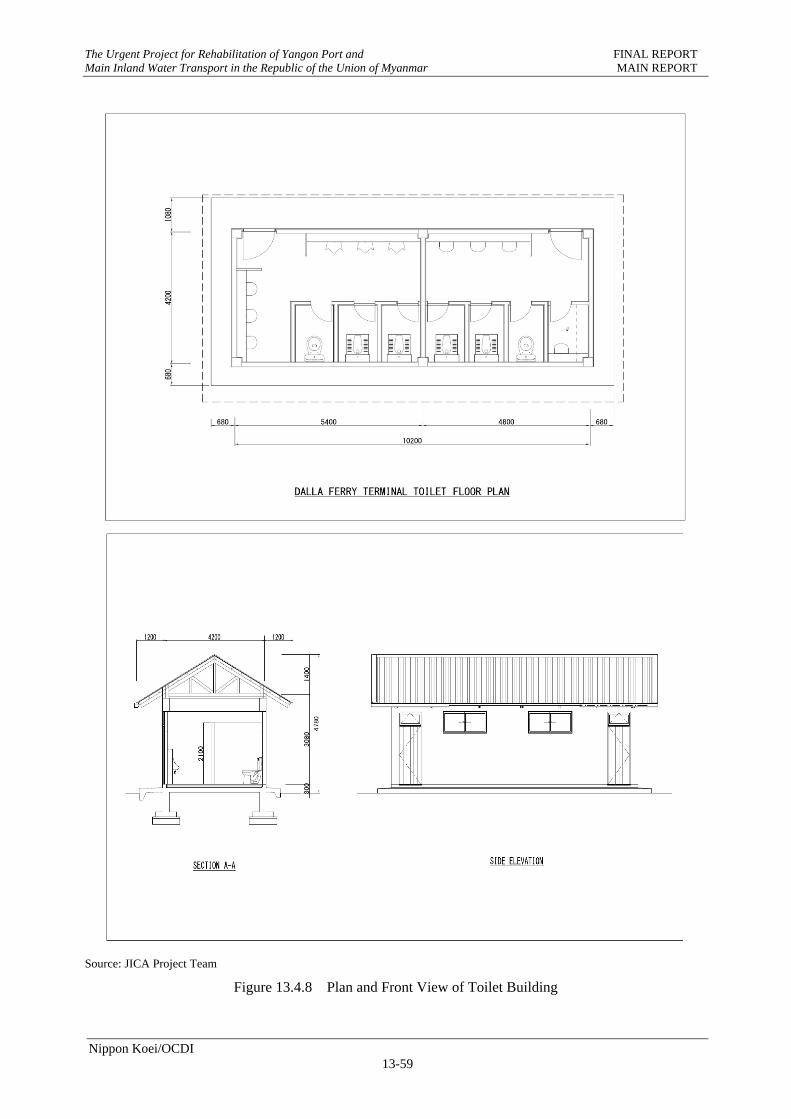
The Urgent Project for Rehabilitation of Yangon Port and FINAL REPORT Main Inland Water Transport in the Republic of the Union of Myanmar MAIN REPORT
Nippon Koei/OCDI 13-59
Source: JICA Project Team
Figure 13.4.8 Plan and Front View of Toilet Building
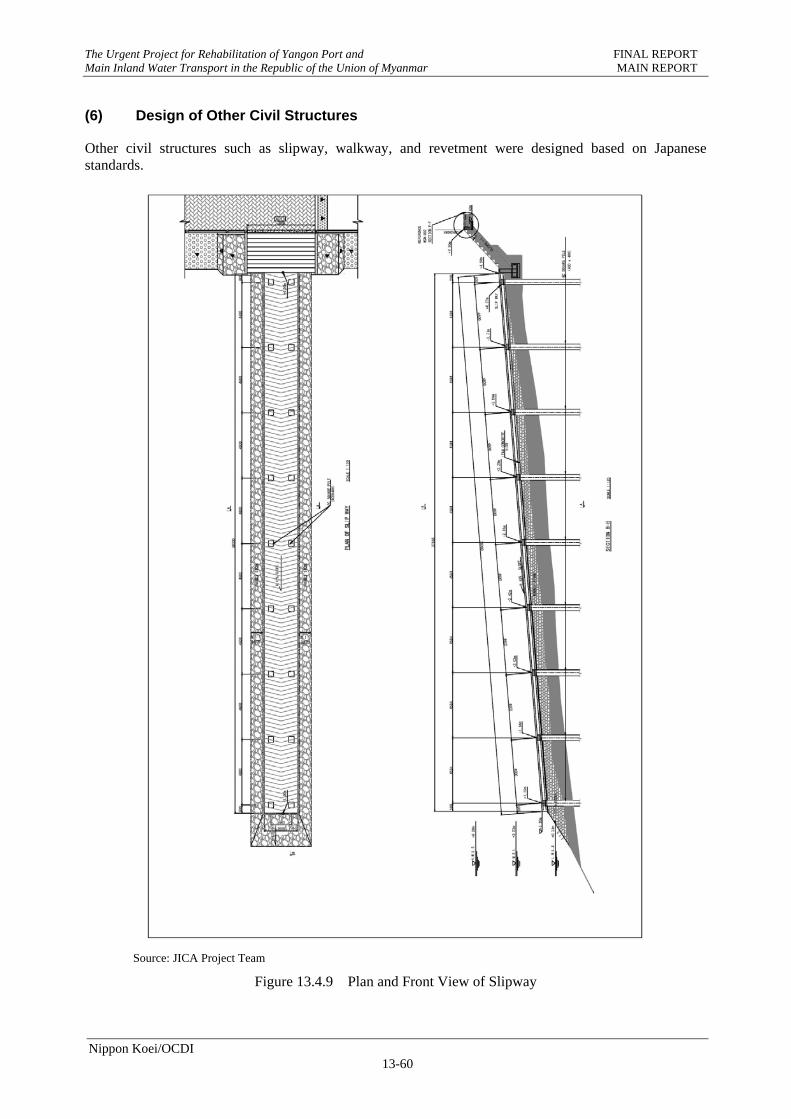
The Urgent Project for Rehabilitation of Yangon Port and FINAL REPORT Main Inland Water Transport in the Republic of the Union of Myanmar MAIN REPORT
Nippon Koei/OCDI 13-60
(6) Design of Other Civil Structures
Other civil structures such as slipway, walkway, and revetment were designed based on Japanese standards.
Source: JICA Project Team
Figure 13.4.9 Plan and Front View of Slipway
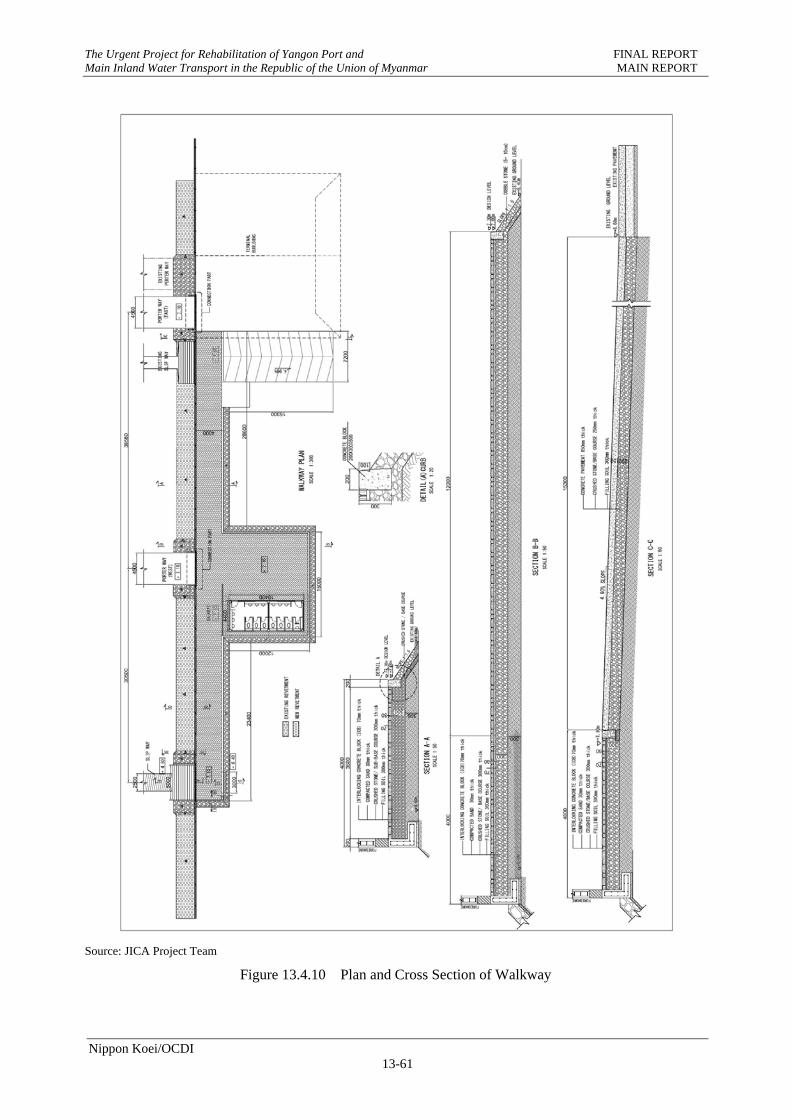
The Urgent Project for Rehabilitation of Yangon Port and FINAL REPORT Main Inland Water Transport in the Republic of the Union of Myanmar MAIN REPORT
Nippon Koei/OCDI 13-61
Source: JICA Project Team
Figure 13.4.10 Plan and Cross Section of Walkway
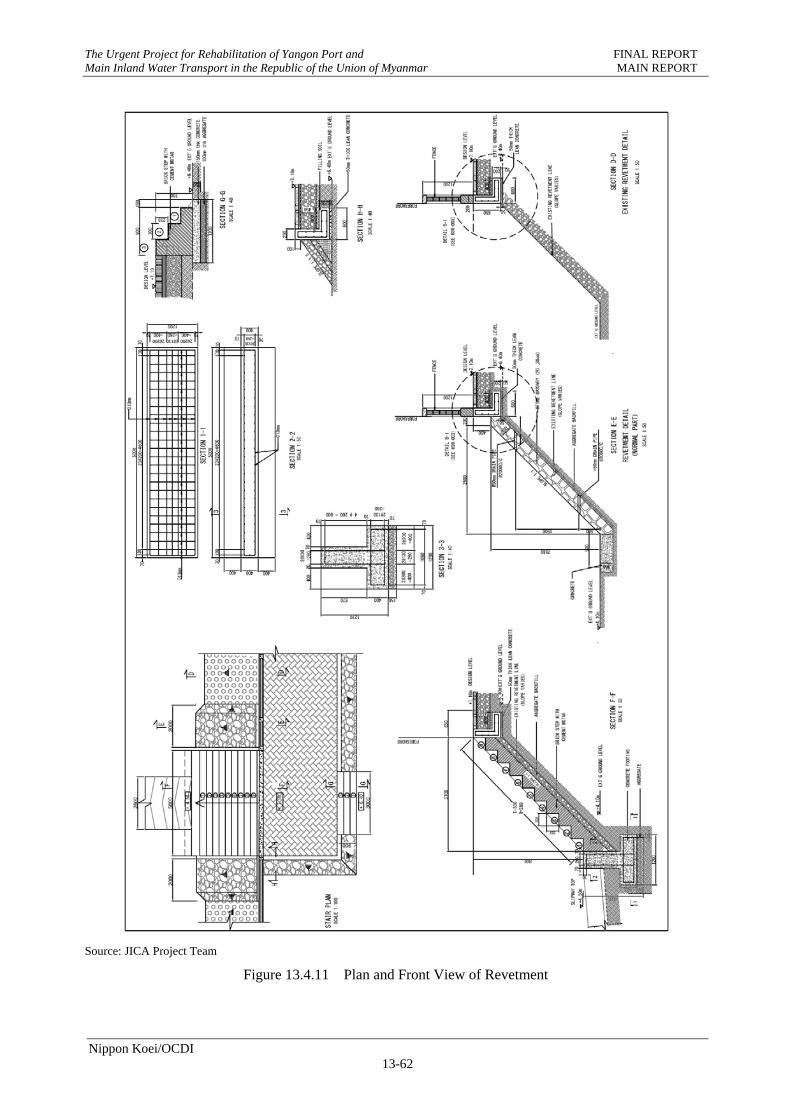
The Urgent Project for Rehabilitation of Yangon Port and FINAL REPORT Main Inland Water Transport in the Republic of the Union of Myanmar MAIN REPORT
Nippon Koei/OCDI 13-62
Source: JICA Project Team
Figure 13.4.11 Plan and Front View of Revetment
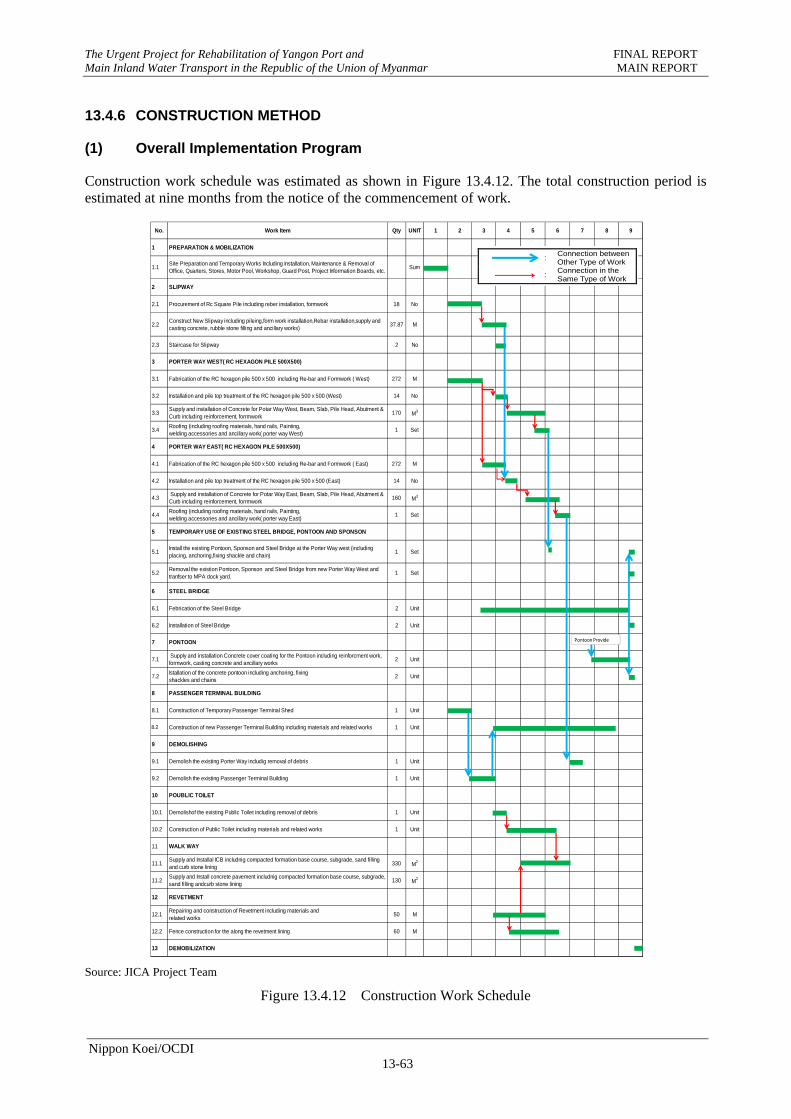
The Urgent Project for Rehabilitation of Yangon Port and FINAL REPORT Main Inland Water Transport in the Republic of the Union of Myanmar MAIN REPORT
Nippon Koei/OCDI 13-63
13.4.6 CONSTRUCTION METHOD
(1) Overall Implementation Program
Construction work schedule was estimated as shown in Figure 13.4.12. The total construction period is estimated at nine months from the notice of the commencement of work.
Source: JICA Project Team
Figure 13.4.12 Construction Work Schedule
No. Work Item Qty UNIT 1 2 3 4 5 6 7 8 9
1 PREPARATION & MOBILIZATION
1.1Site Preparation and Temporary Works Including Installation, Maintenance & Removal ofOffice, Quarters, Stores, Motor Pool, Workshop, Guard Post, Project Information Boards, etc.
Sum
2 SLIPWAY
2.1 Procurement of Rc Square Pile including reber installation, formwork 18 No
2.2Construct New Slipway including pileing,form work installation,Rebar installation,supply andcasting concrete, rubble stone filling and ancillary works)
37.87 M
2.3 Staircase for Slipway 2 No
3 PORTER WAY WEST( RC HEXAGON PILE 500X500)
3.1 Fabrication of the RC hexagon pile 500 x 500 including Re-bar and Formwork ( West) 272 M
3.2 Installation and pile top treatment of the RC hexagon pile 500 x 500 (West) 14 No
3.3Supply and installation of Concrete for Potar Way West, Beam, Slab, Pile Head, Abutment &Curb including reinforcement, forrmwork
170 M3
3.4Roofing (including roofing materials, hand rails, Painting,welding accessories and ancillary work( porter way West)
1 Set
4 PORTER WAY EAST( RC HEXAGON PILE 500X500)
4.1 Fabrication of the RC hexagon pile 500 x 500 including Re-bar and Formwork ( East) 272 M
4.2 Installation and pile top treatment of the RC hexagon pile 500 x 500 (East) 14 No
4.3 Supply and installation of Concrete for Potar Way East, Beam, Slab, Pile Head, Abutment &Curb including reinforcement, forrmwork
160 M3
4.4Roofing (including roofing materials, hand rails, Painting,welding accessories and ancillary work( porter way East)
1 Set
5 TEMPORARY USE OF EXISTING STEEL BRIDGE, PONTOON AND SPONSON
5.1Install the existing Pontoon, Sponson and Steel Bridge at the Porter Way west (includingplacing, anchoring,fixing shackle and chain)
1 Set
5.2Removal the existion Pontoon, Sponson and Steel Bridge from new Porter Way West andtranfser to MPA dock yard.
1 Set
6 STEEL BRIDGE
6.1 Febrication of the Steel Bridge 2 Unit
6.2 Installation of Steel Bridge 2 Unit
7 PONTOON
7.1 Supply and installation Concrete cover coating for the Pontoon including reinforcment work,formwork, casting concrete and ancillary works
2 Unit
7.2Istallation of the concrete pontoon including anchoring, fixingshackles and chains
2 Unit
8 PASSENGER TERMINAL BUILDING
8.1 Construction of Temporary Passenger Terminal Shed 1 Unit
8.2 Construction of new Passenger Terminal Building including materials and related works 1 Unit
9 DEMOLISHING
9.1 Demolish the existing Porter Way includig removal of debris 1 Unit
9.2 Demolish the existing Passenger Terminal Building 1 Unit
10 POUBLIC TOILET
10.1 Demolishof the existing Public Toilet including removal of debris 1 Unit
10.2 Construction of Public Toilet including materials and related works 1 Unit
11 WALK WAY
11.1Supply and Installal ICB includnig compacted formation base course, subgrade, sand fillingand curb stone lining
330 M2
11.2Supply and Install concrete pavement includnig compacted formation base course, subgrade,sand filling andcurb stone lining
130 M2
12 REVETMENT
12.1Repairing and construction of Revetment including materials andrelated works
50 M
12.2 Fence construction for the along the revetment lining 60 M
13 DEMOBILIZATION
PontoonProvide
:
Connection between Other Type of Work
:
Connection in the Same Type of Work
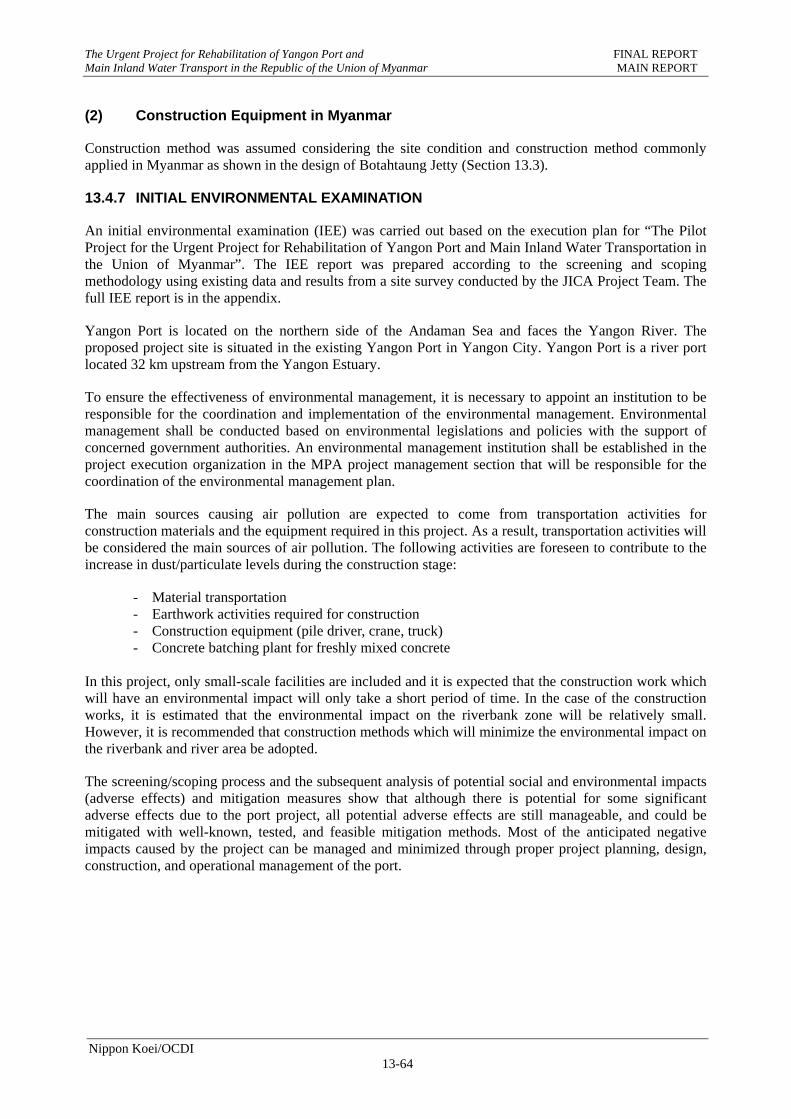
The Urgent Project for Rehabilitation of Yangon Port and FINAL REPORT Main Inland Water Transport in the Republic of the Union of Myanmar MAIN REPORT
Nippon Koei/OCDI 13-64
(2) Construction Equipment in Myanmar
Construction method was assumed considering the site condition and construction method commonly applied in Myanmar as shown in the design of Botahtaung Jetty (Section 13.3).
13.4.7 INITIAL ENVIRONMENTAL EXAMINATION
An initial environmental examination (IEE) was carried out based on the execution plan for “The Pilot Project for the Urgent Project for Rehabilitation of Yangon Port and Main Inland Water Transportation in the Union of Myanmar”. The IEE report was prepared according to the screening and scoping methodology using existing data and results from a site survey conducted by the JICA Project Team. The full IEE report is in the appendix.
Yangon Port is located on the northern side of the Andaman Sea and faces the Yangon River. The proposed project site is situated in the existing Yangon Port in Yangon City. Yangon Port is a river port located 32 km upstream from the Yangon Estuary.
To ensure the effectiveness of environmental management, it is necessary to appoint an institution to be responsible for the coordination and implementation of the environmental management. Environmental management shall be conducted based on environmental legislations and policies with the support of concerned government authorities. An environmental management institution shall be established in the project execution organization in the MPA project management section that will be responsible for the coordination of the environmental management plan.
The main sources causing air pollution are expected to come from transportation activities for construction materials and the equipment required in this project. As a result, transportation activities will be considered the main sources of air pollution. The following activities are foreseen to contribute to the increase in dust/particulate levels during the construction stage:
- Material transportation - Earthwork activities required for construction - Construction equipment (pile driver, crane, truck) - Concrete batching plant for freshly mixed concrete
In this project, only small-scale facilities are included and it is expected that the construction work which will have an environmental impact will only take a short period of time. In the case of the construction works, it is estimated that the environmental impact on the riverbank zone will be relatively small. However, it is recommended that construction methods which will minimize the environmental impact on the riverbank and river area be adopted.
The screening/scoping process and the subsequent analysis of potential social and environmental impacts (adverse effects) and mitigation measures show that although there is potential for some significant adverse effects due to the port project, all potential adverse effects are still manageable, and could be mitigated with well-known, tested, and feasible mitigation methods. Most of the anticipated negative impacts caused by the project can be managed and minimized through proper project planning, design, construction, and operational management of the port.
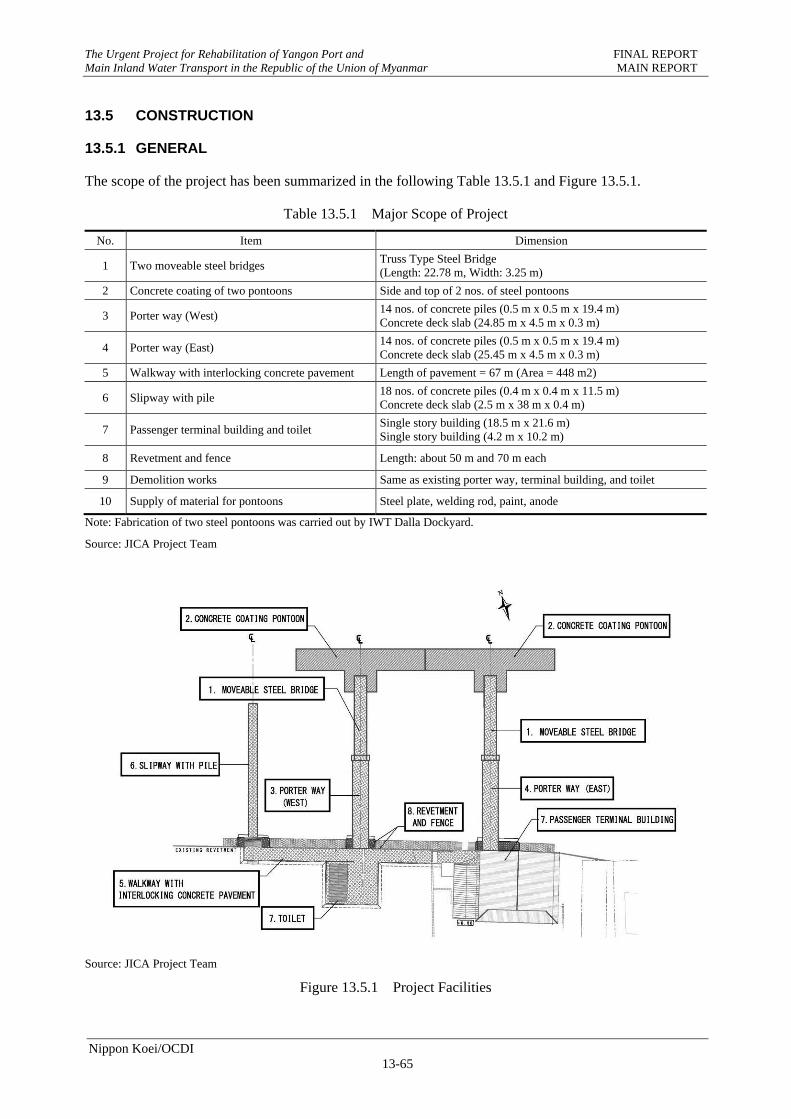
The Urgent Project for Rehabilitation of Yangon Port and FINAL REPORT Main Inland Water Transport in the Republic of the Union of Myanmar MAIN REPORT
Nippon Koei/OCDI 13-65
13.5 CONSTRUCTION
13.5.1 GENERAL
The scope of the project has been summarized in the following Table 13.5.1 and Figure 13.5.1.
Table 13.5.1 Major Scope of Project
No. Item Dimension
1 Two moveable steel bridges Truss Type Steel Bridge (Length: 22.78 m, Width: 3.25 m)
2 Concrete coating of two pontoons Side and top of 2 nos. of steel pontoons
3 Porter way (West) 14 nos. of concrete piles (0.5 m x 0.5 m x 19.4 m) Concrete deck slab (24.85 m x 4.5 m x 0.3 m)
4 Porter way (East) 14 nos. of concrete piles (0.5 m x 0.5 m x 19.4 m) Concrete deck slab (25.45 m x 4.5 m x 0.3 m)
5 Walkway with interlocking concrete pavement Length of pavement = 67 m (Area = 448 m2)
6 Slipway with pile 18 nos. of concrete piles (0.4 m x 0.4 m x 11.5 m) Concrete deck slab (2.5 m x 38 m x 0.4 m)
7 Passenger terminal building and toilet Single story building (18.5 m x 21.6 m) Single story building (4.2 m x 10.2 m)
8 Revetment and fence Length: about 50 m and 70 m each
9 Demolition works Same as existing porter way, terminal building, and toilet
10 Supply of material for pontoons Steel plate, welding rod, paint, anode
Note: Fabrication of two steel pontoons was carried out by IWT Dalla Dockyard.
Source: JICA Project Team
Source: JICA Project Team
Figure 13.5.1 Project Facilities
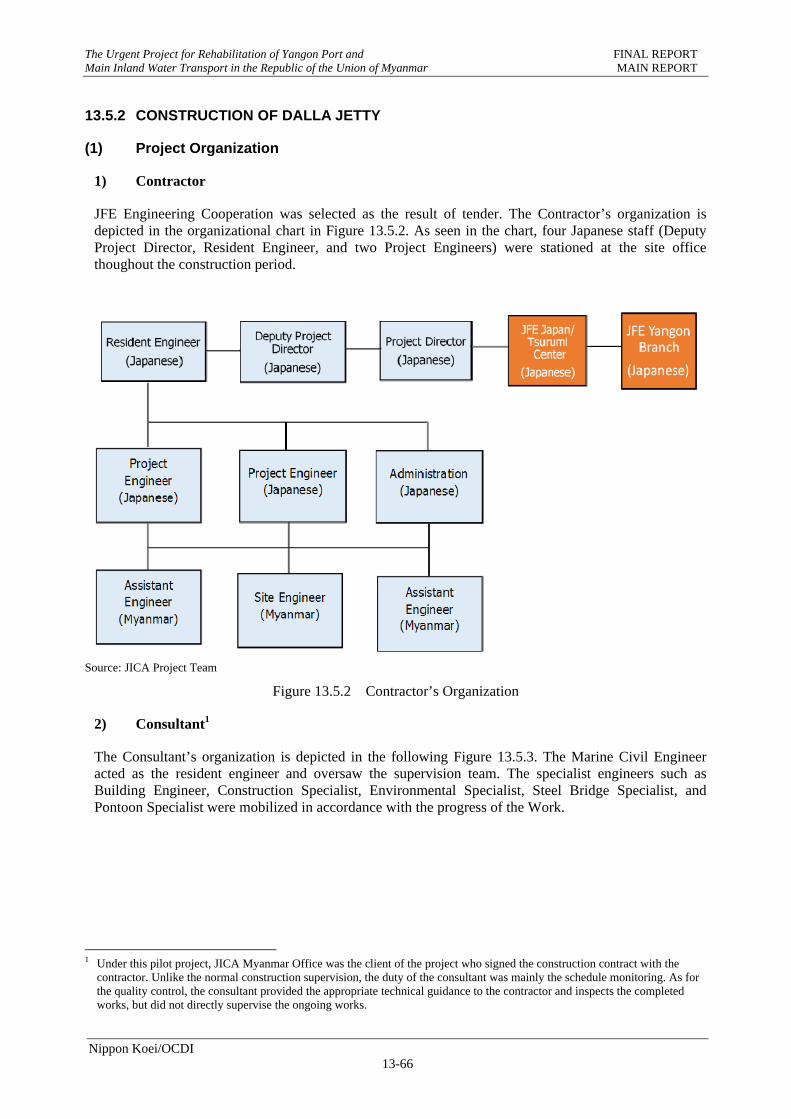
The Urgent Project for Rehabilitation of Yangon Port and FINAL REPORT Main Inland Water Transport in the Republic of the Union of Myanmar MAIN REPORT
Nippon Koei/OCDI 13-66
13.5.2 CONSTRUCTION OF DALLA JETTY
(1) Project Organization
1) Contractor
JFE Engineering Cooperation was selected as the result of tender. The Contractor’s organization is depicted in the organizational chart in Figure 13.5.2. As seen in the chart, four Japanese staff (Deputy Project Director, Resident Engineer, and two Project Engineers) were stationed at the site office thoughout the construction period.
Source: JICA Project Team
Figure 13.5.2 Contractor’s Organization
2) Consultant1
The Consultant’s organization is depicted in the following Figure 13.5.3. The Marine Civil Engineer acted as the resident engineer and oversaw the supervision team. The specialist engineers such as Building Engineer, Construction Specialist, Environmental Specialist, Steel Bridge Specialist, and Pontoon Specialist were mobilized in accordance with the progress of the Work.
1 Under this pilot project, JICA Myanmar Office was the client of the project who signed the construction contract with the
contractor. Unlike the normal construction supervision, the duty of the consultant was mainly the schedule monitoring. As for the quality control, the consultant provided the appropriate technical guidance to the contractor and inspects the completed works, but did not directly supervise the ongoing works.
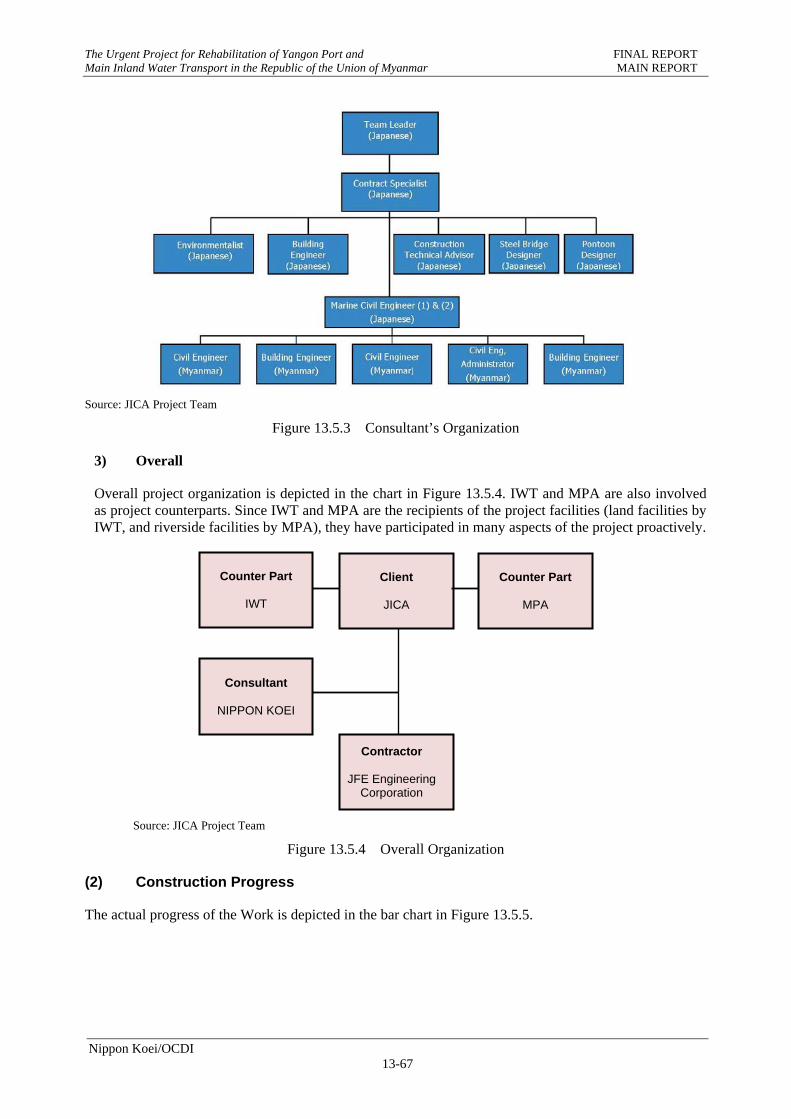
The Urgent Project for Rehabilitation of Yangon Port and FINAL REPORT Main Inland Water Transport in the Republic of the Union of Myanmar MAIN REPORT
Nippon Koei/OCDI 13-67
Source: JICA Project Team
Figure 13.5.3 Consultant’s Organization
3) Overall
Overall project organization is depicted in the chart in Figure 13.5.4. IWT and MPA are also involved as project counterparts. Since IWT and MPA are the recipients of the project facilities (land facilities by IWT, and riverside facilities by MPA), they have participated in many aspects of the project proactively.
Source: JICA Project Team
Figure 13.5.4 Overall Organization
(2) Construction Progress
The actual progress of the Work is depicted in the bar chart in Figure 13.5.5.
Consultant
NIPPON KOEI
Contractor
JFE Engineering Corporation
Client
JICA
Counter Part
MPA
Counter Part
IWT
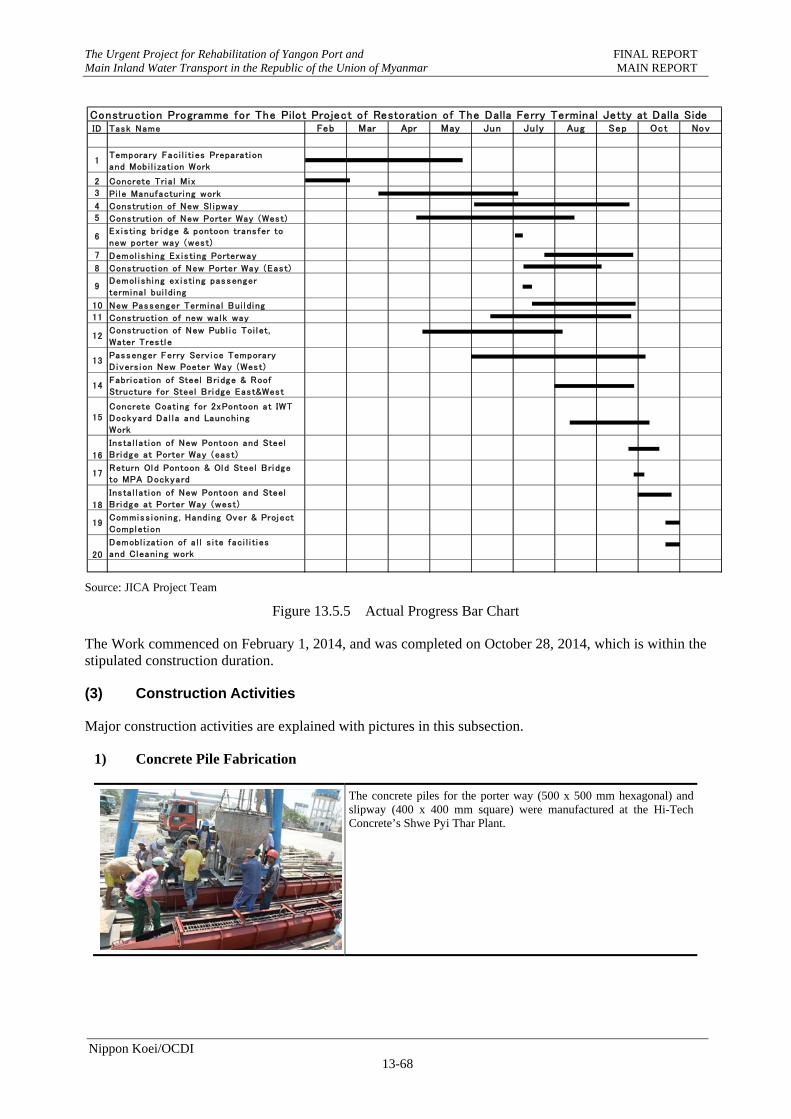
The Urgent Project for Rehabilitation of Yangon Port and FINAL REPORT Main Inland Water Transport in the Republic of the Union of Myanmar MAIN REPORT
Nippon Koei/OCDI 13-68
Source: JICA Project Team
Figure 13.5.5 Actual Progress Bar Chart
The Work commenced on February 1, 2014, and was completed on October 28, 2014, which is within the stipulated construction duration.
(3) Construction Activities
Major construction activities are explained with pictures in this subsection.
1) Concrete Pile Fabrication
The concrete piles for the porter way (500 x 500 mm hexagonal) and slipway (400 x 400 mm square) were manufactured at the Hi-Tech Concrete’s Shwe Pyi Thar Plant.
ID Task Name
1
2
3 Pi l e Manufacturi ng work
4 Construti on of New Sl i pway
5
6
7
8
9
10
11
12
13
14
15
16
17
18
19
20
Insta l l ation of New Pontoon and Steel
Bridge at Porter Way (eas t)
Return Old Pontoon & Old Steel Bri dgeto MPA Dockyard
Insta l l ation of New Pontoon and Steel
Bridge at Porter Way (west)
Commiss ioning , Handing Over & Project
Completi on
Demobl i zation of a l l s i te faci l i ti es
and Cleaning work
Construction Programme for The Pilot Project of Restoration of The Dalla Ferry Terminal Jetty at Dalla Side
New Passenger Termina l Bui ld i ng
Constructi on of new wa l k way
Constructi on of New Publ i c Toi l et,
Water Tres tl e
Passenger Ferry Serv i ce Temporary
Divers i on New Poeter Way (West)
Jun Ju ly Aug Sep Oct NovFeb Mar Apr May
Temporary Faci l i ti es Preparati on
and Mobi l i zati on Work
Fabri cation of Steel Bri dge & Roof
Structure for Steel Bri dge Eas t&West
Concrete Coating for 2xPontoon at IWT
Dockyard Da l l a and Launching
Work
Concrete Tria l Mix
Ex i s ti ng bridge & pontoon trans fer to
new porter way (wes t)
Demol i shi ng Ex is ti ng Porterway
Construti on of New Porter Way (West)
Constructi on of New Porter Way (Eas t)
Demol i shi ng ex i s ting passenger
termina l bui l d i ng
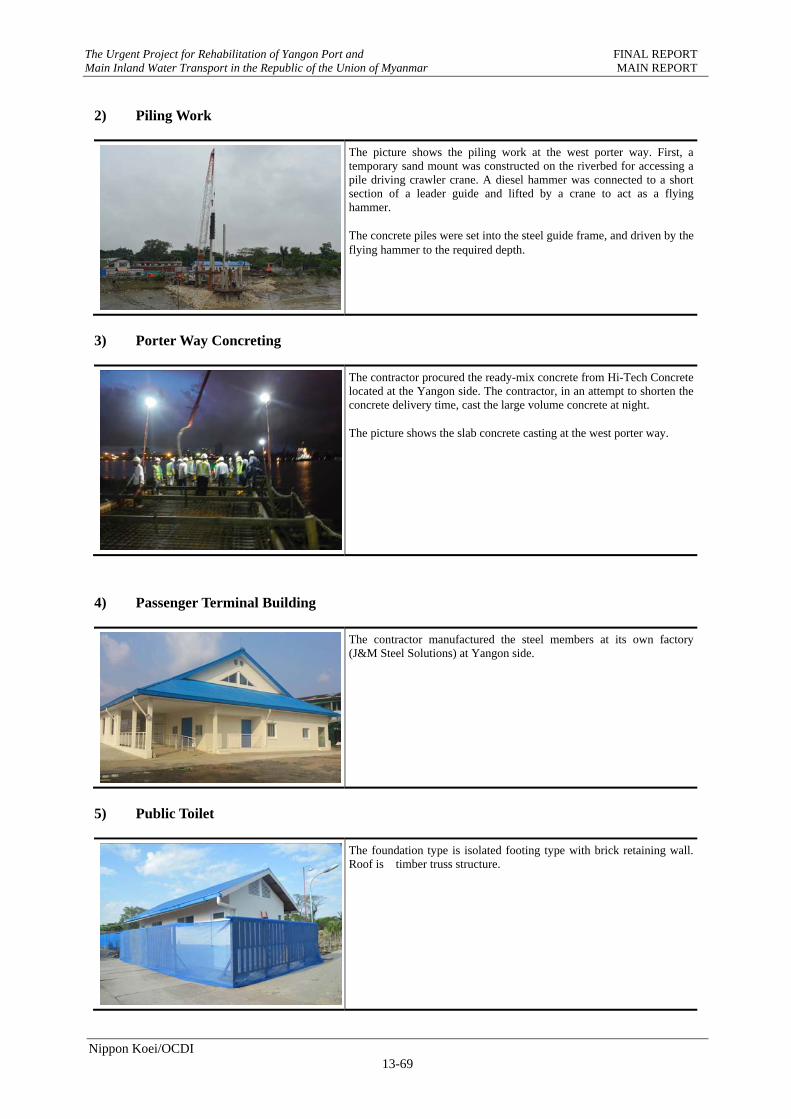
The Urgent Project for Rehabilitation of Yangon Port and FINAL REPORT Main Inland Water Transport in the Republic of the Union of Myanmar MAIN REPORT
Nippon Koei/OCDI 13-69
2) Piling Work
The picture shows the piling work at the west porter way. First, a temporary sand mount was constructed on the riverbed for accessing a pile driving crawler crane. A diesel hammer was connected to a short section of a leader guide and lifted by a crane to act as a flying hammer. The concrete piles were set into the steel guide frame, and driven by the flying hammer to the required depth.
3) Porter Way Concreting
The contractor procured the ready-mix concrete from Hi-Tech Concrete located at the Yangon side. The contractor, in an attempt to shorten the concrete delivery time, cast the large volume concrete at night. The picture shows the slab concrete casting at the west porter way.
4) Passenger Terminal Building
The contractor manufactured the steel members at its own factory (J&M Steel Solutions) at Yangon side.
5) Public Toilet
The foundation type is isolated footing type with brick retaining wall. Roof is timber truss structure.
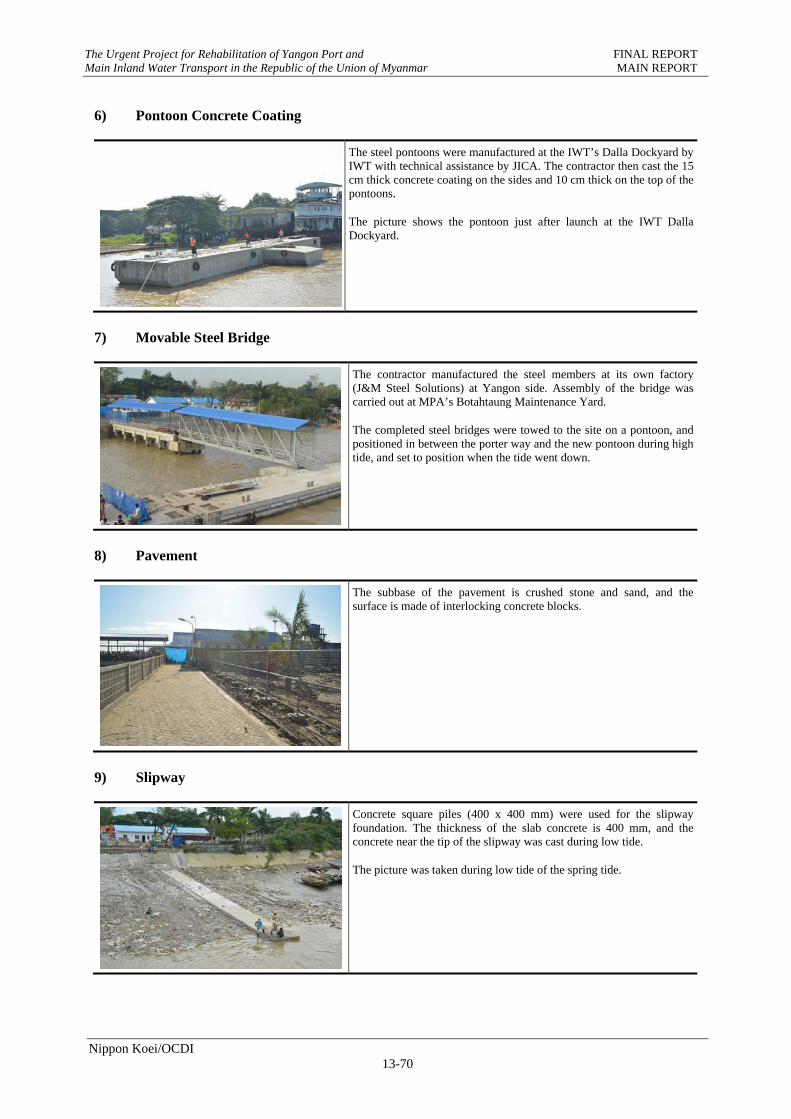
The Urgent Project for Rehabilitation of Yangon Port and FINAL REPORT Main Inland Water Transport in the Republic of the Union of Myanmar MAIN REPORT
Nippon Koei/OCDI 13-70
6) Pontoon Concrete Coating
The steel pontoons were manufactured at the IWT’s Dalla Dockyard by IWT with technical assistance by JICA. The contractor then cast the 15 cm thick concrete coating on the sides and 10 cm thick on the top of the pontoons. The picture shows the pontoon just after launch at the IWT Dalla Dockyard.
7) Movable Steel Bridge
The contractor manufactured the steel members at its own factory (J&M Steel Solutions) at Yangon side. Assembly of the bridge was carried out at MPA’s Botahtaung Maintenance Yard. The completed steel bridges were towed to the site on a pontoon, and positioned in between the porter way and the new pontoon during high tide, and set to position when the tide went down.
8) Pavement
The subbase of the pavement is crushed stone and sand, and the surface is made of interlocking concrete blocks.
9) Slipway
Concrete square piles (400 x 400 mm) were used for the slipway foundation. The thickness of the slab concrete is 400 mm, and the concrete near the tip of the slipway was cast during low tide. The picture was taken during low tide of the spring tide.
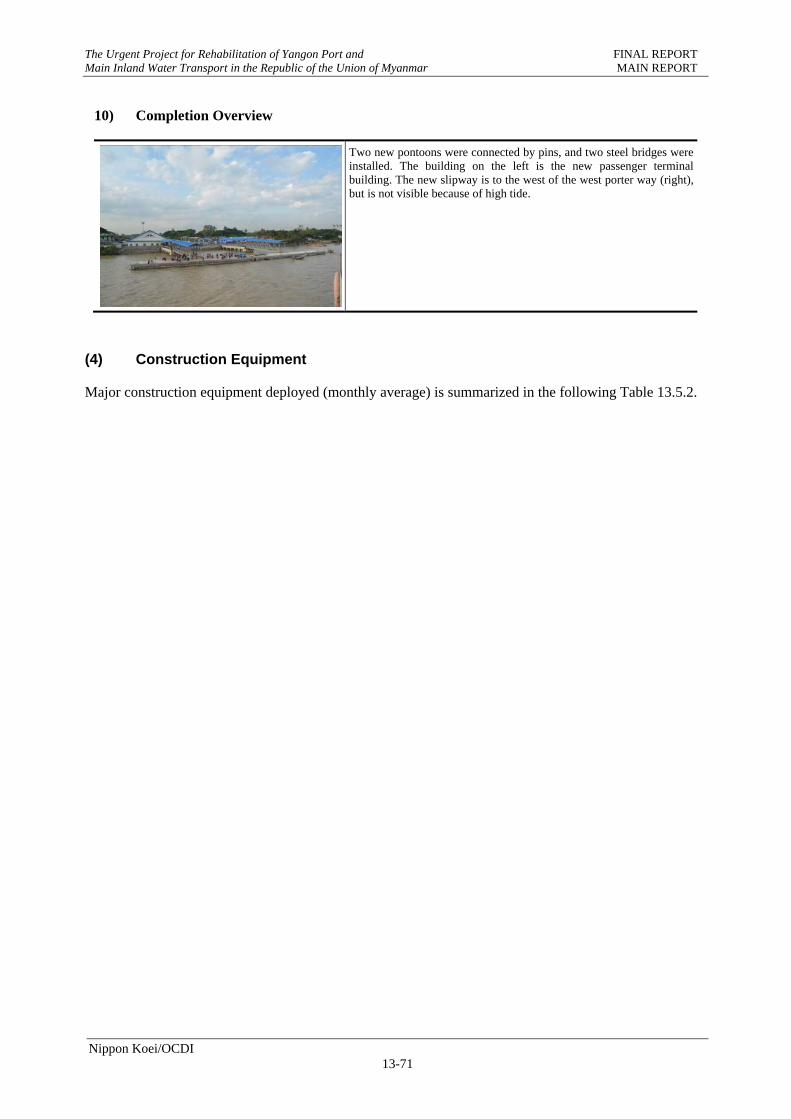
The Urgent Project for Rehabilitation of Yangon Port and FINAL REPORT Main Inland Water Transport in the Republic of the Union of Myanmar MAIN REPORT
Nippon Koei/OCDI 13-71
10) Completion Overview
Two new pontoons were connected by pins, and two steel bridges were installed. The building on the left is the new passenger terminal building. The new slipway is to the west of the west porter way (right), but is not visible because of high tide.
(4) Construction Equipment
Major construction equipment deployed (monthly average) is summarized in the following Table 13.5.2.
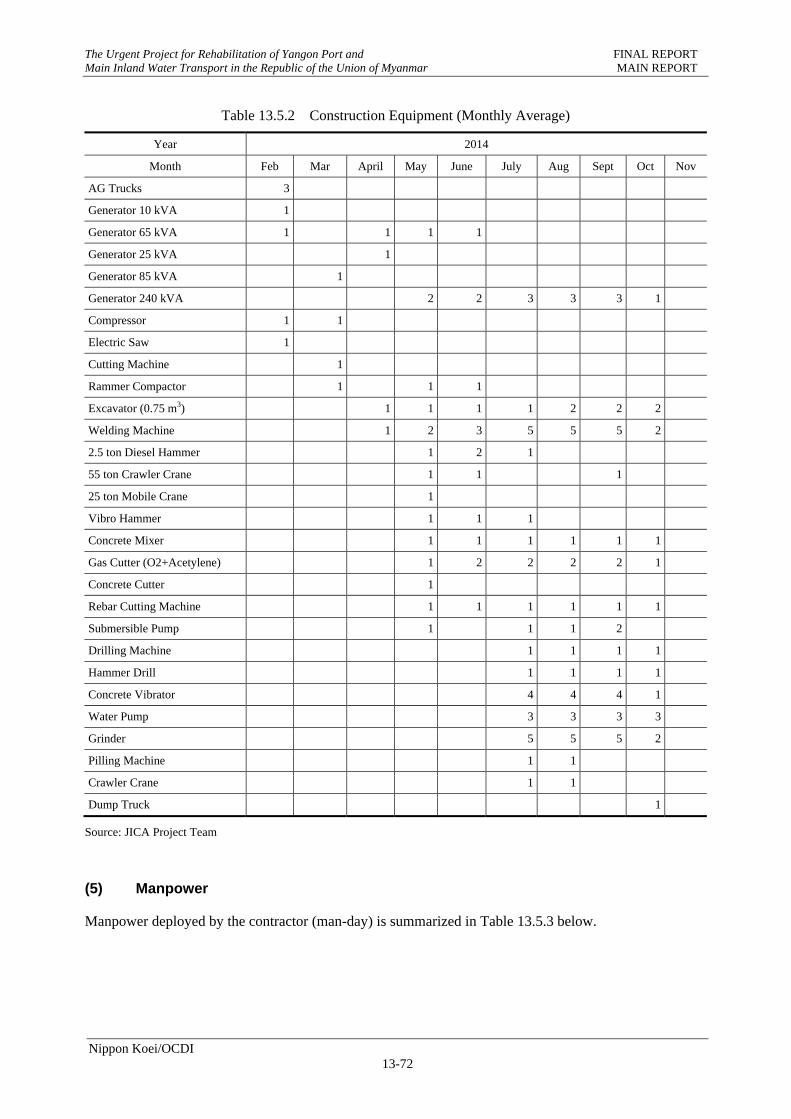
The Urgent Project for Rehabilitation of Yangon Port and FINAL REPORT Main Inland Water Transport in the Republic of the Union of Myanmar MAIN REPORT
Nippon Koei/OCDI 13-72
Table 13.5.2 Construction Equipment (Monthly Average)
Year 2014
Month Feb Mar April May June July Aug Sept Oct Nov
AG Trucks 3
Generator 10 kVA 1
Generator 65 kVA 1 1 1 1
Generator 25 kVA 1
Generator 85 kVA 1
Generator 240 kVA 2 2 3 3 3 1
Compressor 1 1
Electric Saw 1
Cutting Machine 1
Rammer Compactor 1 1 1
Excavator (0.75 m3) 1 1 1 1 2 2 2
Welding Machine 1 2 3 5 5 5 2
2.5 ton Diesel Hammer 1 2 1
55 ton Crawler Crane 1 1 1
25 ton Mobile Crane 1
Vibro Hammer 1 1 1
Concrete Mixer 1 1 1 1 1 1
Gas Cutter (O2+Acetylene) 1 2 2 2 2 1
Concrete Cutter 1
Rebar Cutting Machine 1 1 1 1 1 1
Submersible Pump 1 1 1 2
Drilling Machine 1 1 1 1
Hammer Drill 1 1 1 1
Concrete Vibrator 4 4 4 1
Water Pump 3 3 3 3
Grinder 5 5 5 2
Pilling Machine 1 1
Crawler Crane 1 1
Dump Truck 1
Source: JICA Project Team
(5) Manpower
Manpower deployed by the contractor (man-day) is summarized in Table 13.5.3 below.
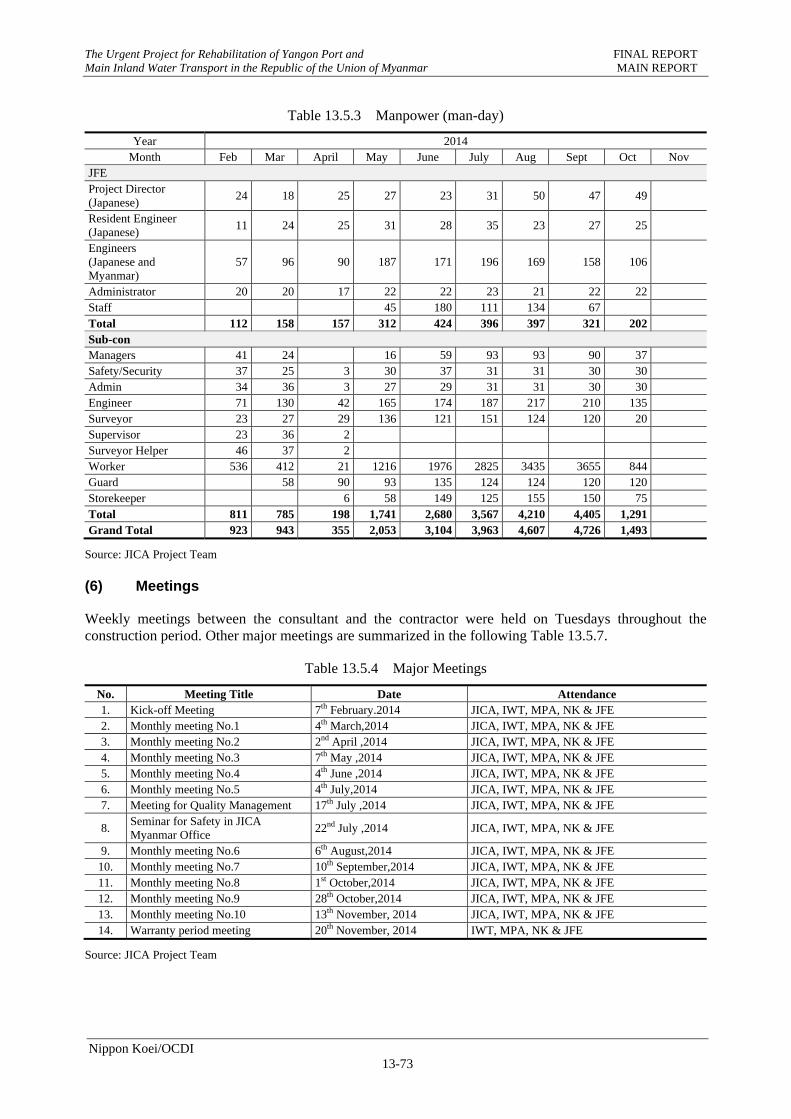
The Urgent Project for Rehabilitation of Yangon Port and FINAL REPORT Main Inland Water Transport in the Republic of the Union of Myanmar MAIN REPORT
Nippon Koei/OCDI 13-73
Table 13.5.3 Manpower (man-day)
Year 2014 Month Feb Mar April May June July Aug Sept Oct Nov
JFE Project Director (Japanese)
24 18 25 27 23 31 50 47 49
Resident Engineer (Japanese)
11 24 25 31 28 35 23 27 25
Engineers (Japanese and Myanmar)
57 96 90 187 171 196 169 158 106
Administrator 20 20 17 22 22 23 21 22 22 Staff 45 180 111 134 67 Total 112 158 157 312 424 396 397 321 202 Sub-con Managers 41 24 16 59 93 93 90 37 Safety/Security 37 25 3 30 37 31 31 30 30 Admin 34 36 3 27 29 31 31 30 30 Engineer 71 130 42 165 174 187 217 210 135 Surveyor 23 27 29 136 121 151 124 120 20 Supervisor 23 36 2Surveyor Helper 46 37 2Worker 536 412 21 1216 1976 2825 3435 3655 844 Guard 58 90 93 135 124 124 120 120 Storekeeper 6 58 149 125 155 150 75 Total 811 785 198 1,741 2,680 3,567 4,210 4,405 1,291 Grand Total 923 943 355 2,053 3,104 3,963 4,607 4,726 1,493
Source: JICA Project Team
(6) Meetings
Weekly meetings between the consultant and the contractor were held on Tuesdays throughout the construction period. Other major meetings are summarized in the following Table 13.5.7.
Table 13.5.4 Major Meetings
No. Meeting Title Date Attendance 1. Kick-off Meeting 7th February.2014 JICA, IWT, MPA, NK & JFE 2. Monthly meeting No.1 4th March,2014 JICA, IWT, MPA, NK & JFE 3. Monthly meeting No.2 2nd April ,2014 JICA, IWT, MPA, NK & JFE 4. Monthly meeting No.3 7th May ,2014 JICA, IWT, MPA, NK & JFE 5. Monthly meeting No.4 4th June ,2014 JICA, IWT, MPA, NK & JFE 6. Monthly meeting No.5 4th July,2014 JICA, IWT, MPA, NK & JFE 7. Meeting for Quality Management 17th July ,2014 JICA, IWT, MPA, NK & JFE
8. Seminar for Safety in JICA Myanmar Office
22nd July ,2014 JICA, IWT, MPA, NK & JFE
9. Monthly meeting No.6 6th August,2014 JICA, IWT, MPA, NK & JFE 10. Monthly meeting No.7 10th September,2014 JICA, IWT, MPA, NK & JFE 11. Monthly meeting No.8 1st October,2014 JICA, IWT, MPA, NK & JFE 12. Monthly meeting No.9 28th October,2014 JICA, IWT, MPA, NK & JFE 13. Monthly meeting No.10 13th November, 2014 JICA, IWT, MPA, NK & JFE 14. Warranty period meeting 20th November, 2014 IWT, MPA, NK & JFE
Source: JICA Project Team
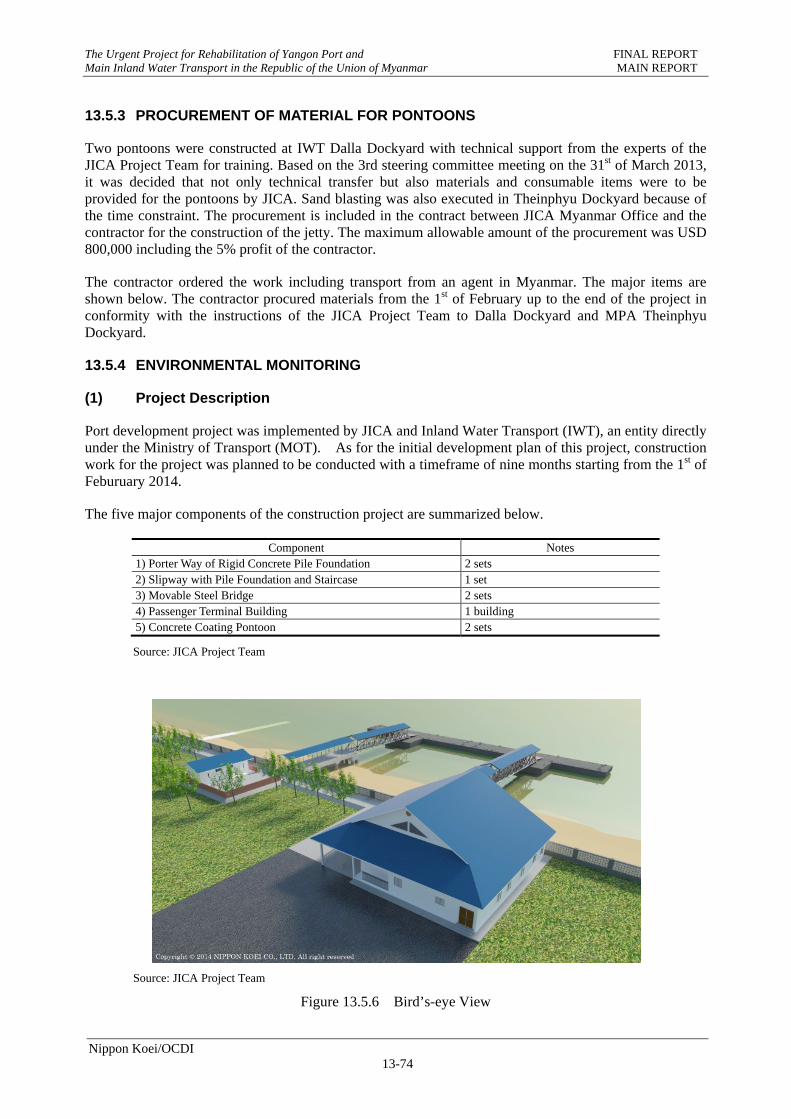
The Urgent Project for Rehabilitation of Yangon Port and FINAL REPORT Main Inland Water Transport in the Republic of the Union of Myanmar MAIN REPORT
Nippon Koei/OCDI 13-74
13.5.3 PROCUREMENT OF MATERIAL FOR PONTOONS
Two pontoons were constructed at IWT Dalla Dockyard with technical support from the experts of the JICA Project Team for training. Based on the 3rd steering committee meeting on the 31st of March 2013, it was decided that not only technical transfer but also materials and consumable items were to be provided for the pontoons by JICA. Sand blasting was also executed in Theinphyu Dockyard because of the time constraint. The procurement is included in the contract between JICA Myanmar Office and the contractor for the construction of the jetty. The maximum allowable amount of the procurement was USD 800,000 including the 5% profit of the contractor.
The contractor ordered the work including transport from an agent in Myanmar. The major items are shown below. The contractor procured materials from the 1st of February up to the end of the project in conformity with the instructions of the JICA Project Team to Dalla Dockyard and MPA Theinphyu Dockyard.
13.5.4 ENVIRONMENTAL MONITORING
(1) Project Description
Port development project was implemented by JICA and Inland Water Transport (IWT), an entity directly under the Ministry of Transport (MOT). As for the initial development plan of this project, construction work for the project was planned to be conducted with a timeframe of nine months starting from the 1st of Feburuary 2014.
The five major components of the construction project are summarized below.
Component Notes 1) Porter Way of Rigid Concrete Pile Foundation 2 sets 2) Slipway with Pile Foundation and Staircase 1 set 3) Movable Steel Bridge 2 sets 4) Passenger Terminal Building 1 building 5) Concrete Coating Pontoon 2 sets
Source: JICA Project Team
Source: JICA Project Team
Figure 13.5.6 Bird’s-eye View
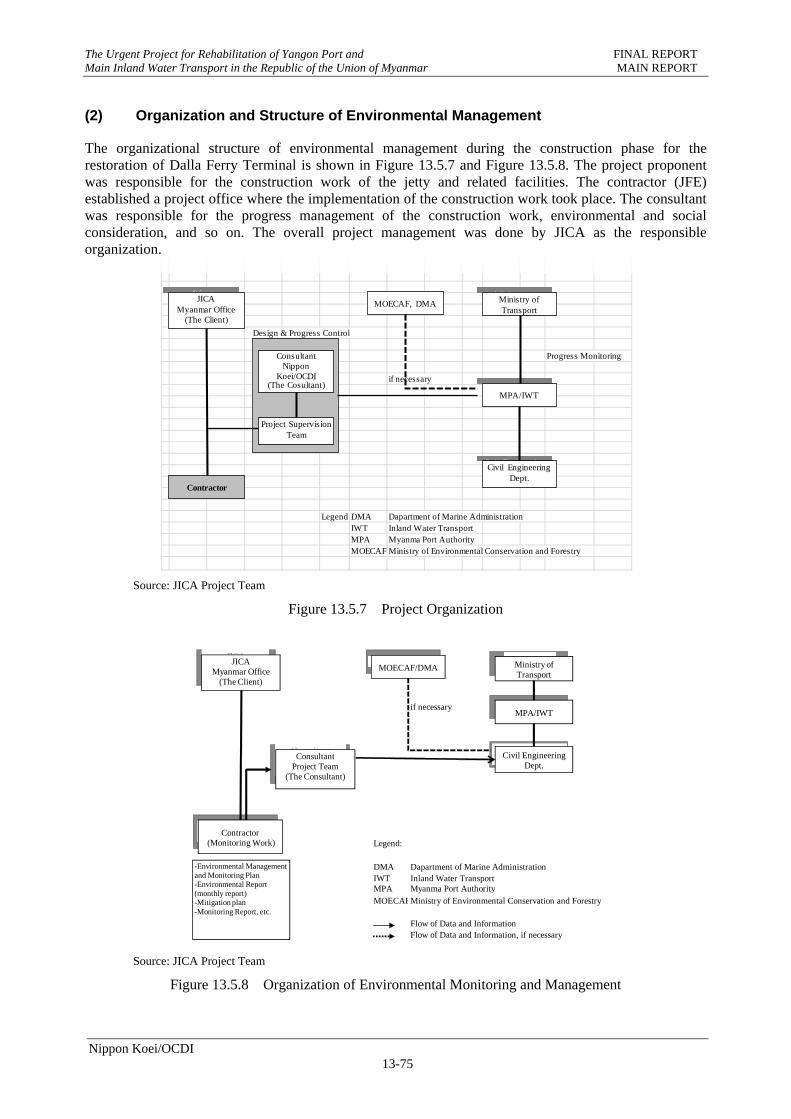
The Urgent Project for Rehabilitation of Yangon Port and FINAL REPORT Main Inland Water Transport in the Republic of the Union of Myanmar MAIN REPORT
Nippon Koei/OCDI 13-75
(2) Organization and Structure of Environmental Management
The organizational structure of environmental management during the construction phase for the restoration of Dalla Ferry Terminal is shown in Figure 13.5.7 and Figure 13.5.8. The project proponent was responsible for the construction work of the jetty and related facilities. The contractor (JFE) established a project office where the implementation of the construction work took place. The consultant was responsible for the progress management of the construction work, environmental and social consideration, and so on. The overall project management was done by JICA as the responsible organization.
Source: JICA Project Team
Figure 13.5.7 Project Organization
if necessary
Legend:
DMA Dapartment of Marine AdministrationIWT Inland Water TransportMPA Myanma Port AuthorityMOECAFMinistry of Environmental Conservation and Forestry
Flow of Data and InformationFlow of Data and Information, if necessary
ConsultantProject Team
(The Consultant)
Civil Engineering Dept.
Contractor(Monitoring Work)
Ministry of Transport
-Environmental Managementand Monitoring Plan-Environmental Report (monthly report)-Mitigation plan-Monitoring Report, etc.
MOECAF/DMA
MPA/IWT
JICA Myanmar Office
(The Client)
Source: JICA Project Team
Figure 13.5.8 Organization of Environmental Monitoring and Management
Design & Progress Control
Progress Monitoring
if necessary
Legend DMA Dapartment of Marine AdministrationIWT Inland Water TransportMPA Myanma Port AuthorityMOECAF Ministry of Environmental Conservation and Forestry
Contractor
ConsultantNippon
Koei/OCDI(The Cosultant)
Project Supervision Team
Ministry of Transport
MPA/IWT
Civil Engineering Dept.
MOECAF, DMAJICA
Myanmar Office(The Client)
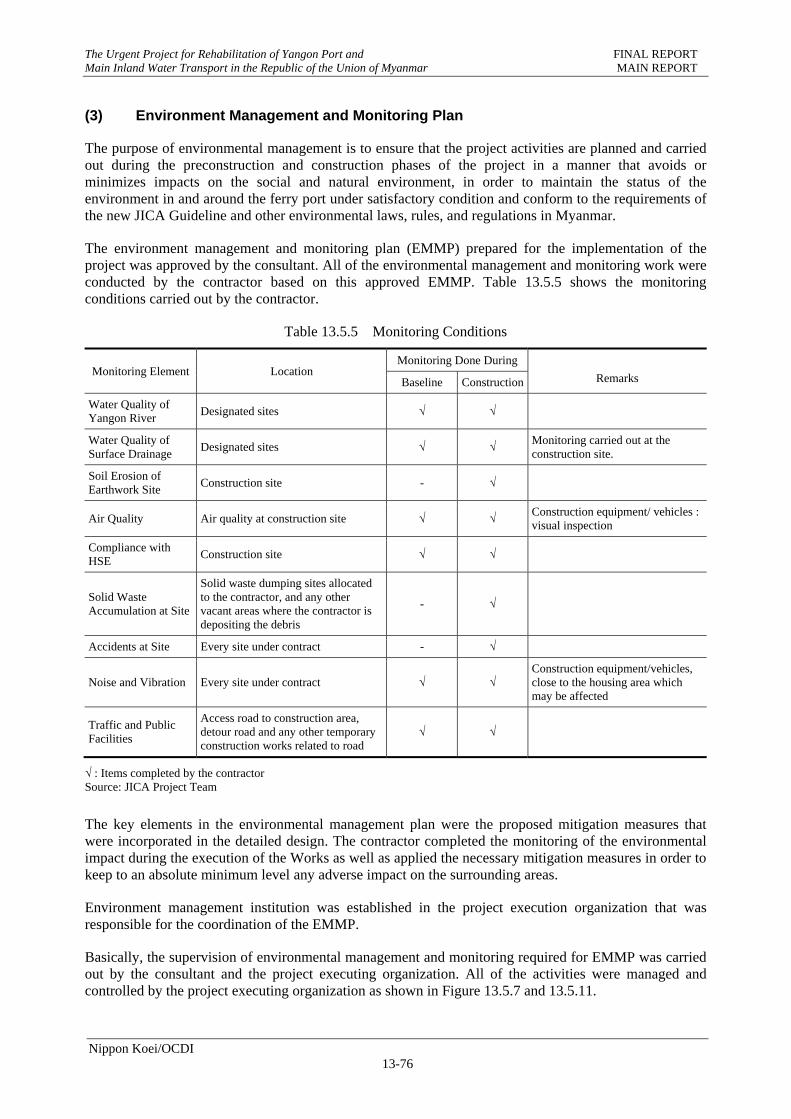
The Urgent Project for Rehabilitation of Yangon Port and FINAL REPORT Main Inland Water Transport in the Republic of the Union of Myanmar MAIN REPORT
Nippon Koei/OCDI 13-76
(3) Environment Management and Monitoring Plan
The purpose of environmental management is to ensure that the project activities are planned and carried out during the preconstruction and construction phases of the project in a manner that avoids or minimizes impacts on the social and natural environment, in order to maintain the status of the environment in and around the ferry port under satisfactory condition and conform to the requirements of the new JICA Guideline and other environmental laws, rules, and regulations in Myanmar.
The environment management and monitoring plan (EMMP) prepared for the implementation of the project was approved by the consultant. All of the environmental management and monitoring work were conducted by the contractor based on this approved EMMP. Table 13.5.5 shows the monitoring conditions carried out by the contractor.
Table 13.5.5 Monitoring Conditions
Monitoring Element Location Monitoring Done During
Remarks Baseline Construction
Water Quality of Yangon River
Designated sites √ √
Water Quality of Surface Drainage
Designated sites √ √ Monitoring carried out at the construction site.
Soil Erosion of Earthwork Site
Construction site - √
Air Quality Air quality at construction site √ √ Construction equipment/ vehicles : visual inspection
Compliance with HSE
Construction site √ √
Solid Waste Accumulation at Site
Solid waste dumping sites allocated to the contractor, and any other vacant areas where the contractor is depositing the debris
- √
Accidents at Site Every site under contract - √
Noise and Vibration Every site under contract √ √ Construction equipment/vehicles, close to the housing area which may be affected
Traffic and Public Facilities
Access road to construction area, detour road and any other temporary construction works related to road
√ √
√ : Items completed by the contractor Source: JICA Project Team
The key elements in the environmental management plan were the proposed mitigation measures that were incorporated in the detailed design. The contractor completed the monitoring of the environmental impact during the execution of the Works as well as applied the necessary mitigation measures in order to keep to an absolute minimum level any adverse impact on the surrounding areas.
Environment management institution was established in the project execution organization that was responsible for the coordination of the EMMP.
Basically, the supervision of environmental management and monitoring required for EMMP was carried out by the consultant and the project executing organization. All of the activities were managed and controlled by the project executing organization as shown in Figure 13.5.7 and 13.5.11.
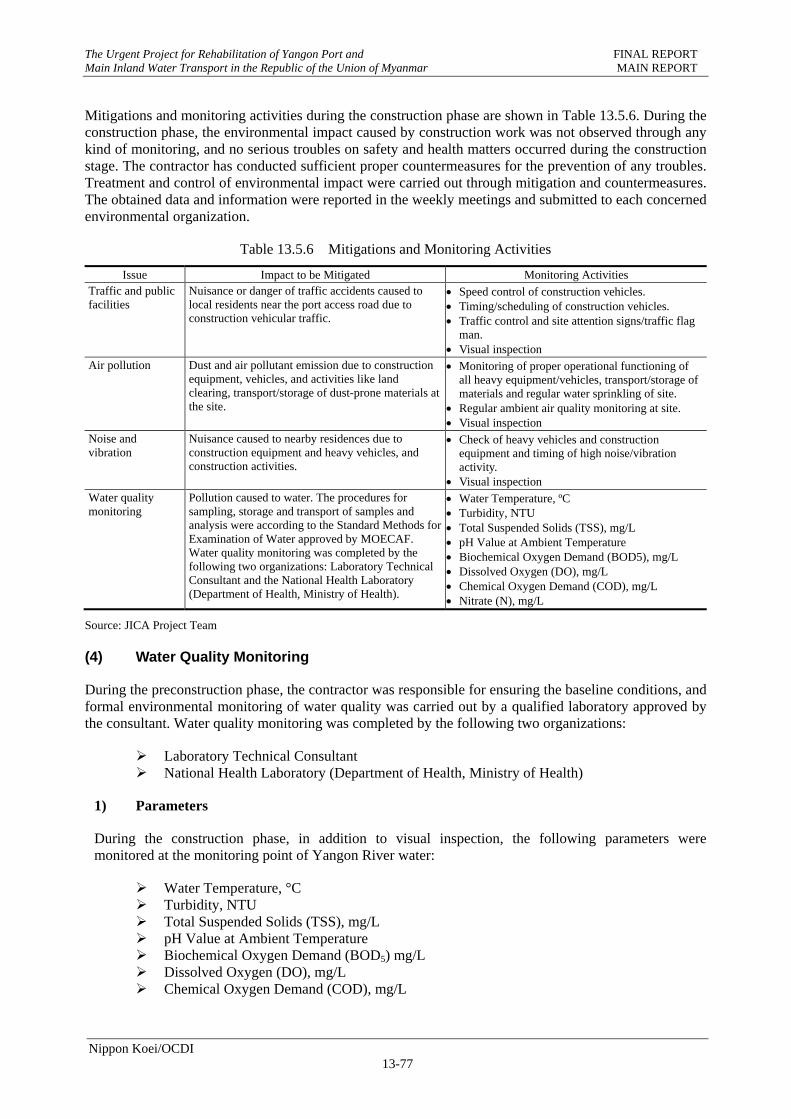
The Urgent Project for Rehabilitation of Yangon Port and FINAL REPORT Main Inland Water Transport in the Republic of the Union of Myanmar MAIN REPORT
Nippon Koei/OCDI 13-77
Mitigations and monitoring activities during the construction phase are shown in Table 13.5.6. During the construction phase, the environmental impact caused by construction work was not observed through any kind of monitoring, and no serious troubles on safety and health matters occurred during the construction stage. The contractor has conducted sufficient proper countermeasures for the prevention of any troubles. Treatment and control of environmental impact were carried out through mitigation and countermeasures. The obtained data and information were reported in the weekly meetings and submitted to each concerned environmental organization.
Table 13.5.6 Mitigations and Monitoring Activities
Issue Impact to be Mitigated Monitoring Activities Traffic and public facilities
Nuisance or danger of traffic accidents caused to local residents near the port access road due to construction vehicular traffic.
Speed control of construction vehicles. Timing/scheduling of construction vehicles. Traffic control and site attention signs/traffic flag
man. Visual inspection
Air pollution Dust and air pollutant emission due to construction equipment, vehicles, and activities like land clearing, transport/storage of dust-prone materials at the site.
Monitoring of proper operational functioning of all heavy equipment/vehicles, transport/storage of materials and regular water sprinkling of site.
Regular ambient air quality monitoring at site. Visual inspection
Noise and vibration
Nuisance caused to nearby residences due to construction equipment and heavy vehicles, and construction activities.
Check of heavy vehicles and construction equipment and timing of high noise/vibration activity.
Visual inspection Water quality monitoring
Pollution caused to water. The procedures for sampling, storage and transport of samples and analysis were according to the Standard Methods for Examination of Water approved by MOECAF. Water quality monitoring was completed by the following two organizations: Laboratory Technical Consultant and the National Health Laboratory (Department of Health, Ministry of Health).
Water Temperature, ºC Turbidity, NTU Total Suspended Solids (TSS), mg/L pH Value at Ambient Temperature Biochemical Oxygen Demand (BOD5), mg/L Dissolved Oxygen (DO), mg/L Chemical Oxygen Demand (COD), mg/L Nitrate (N), mg/L
Source: JICA Project Team
(4) Water Quality Monitoring
During the preconstruction phase, the contractor was responsible for ensuring the baseline conditions, and formal environmental monitoring of water quality was carried out by a qualified laboratory approved by the consultant. Water quality monitoring was completed by the following two organizations:
Laboratory Technical Consultant National Health Laboratory (Department of Health, Ministry of Health)
1) Parameters
During the construction phase, in addition to visual inspection, the following parameters were monitored at the monitoring point of Yangon River water:
Water Temperature, °C Turbidity, NTU Total Suspended Solids (TSS), mg/L pH Value at Ambient Temperature Biochemical Oxygen Demand (BOD5) mg/L Dissolved Oxygen (DO), mg/L Chemical Oxygen Demand (COD), mg/L
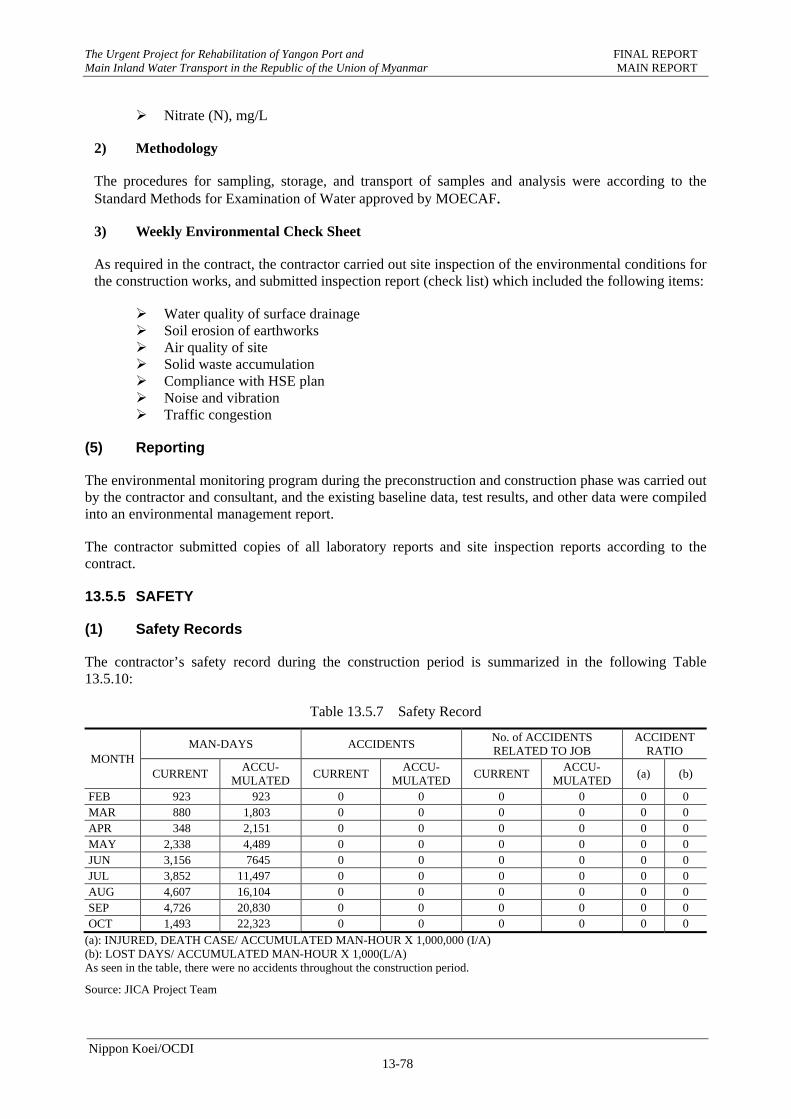
The Urgent Project for Rehabilitation of Yangon Port and FINAL REPORT Main Inland Water Transport in the Republic of the Union of Myanmar MAIN REPORT
Nippon Koei/OCDI 13-78
Nitrate (N), mg/L
2) Methodology
The procedures for sampling, storage, and transport of samples and analysis were according to the Standard Methods for Examination of Water approved by MOECAF.
3) Weekly Environmental Check Sheet
As required in the contract, the contractor carried out site inspection of the environmental conditions for the construction works, and submitted inspection report (check list) which included the following items:
Water quality of surface drainage Soil erosion of earthworks Air quality of site Solid waste accumulation Compliance with HSE plan Noise and vibration Traffic congestion
(5) Reporting
The environmental monitoring program during the preconstruction and construction phase was carried out by the contractor and consultant, and the existing baseline data, test results, and other data were compiled into an environmental management report.
The contractor submitted copies of all laboratory reports and site inspection reports according to the contract.
13.5.5 SAFETY
(1) Safety Records
The contractor’s safety record during the construction period is summarized in the following Table 13.5.10:
Table 13.5.7 Safety Record
MONTH MAN-DAYS ACCIDENTS
No. of ACCIDENTS RELATED TO JOB
ACCIDENT RATIO
CURRENT ACCU-
MULATED CURRENT
ACCU- MULATED
CURRENTACCU-
MULATED (a) (b)
FEB 923 923 0 0 0 0 0 0 MAR 880 1,803 0 0 0 0 0 0 APR 348 2,151 0 0 0 0 0 0 MAY 2,338 4,489 0 0 0 0 0 0 JUN 3,156 7645 0 0 0 0 0 0 JUL 3,852 11,497 0 0 0 0 0 0 AUG 4,607 16,104 0 0 0 0 0 0 SEP 4,726 20,830 0 0 0 0 0 0 OCT 1,493 22,323 0 0 0 0 0 0
(a): INJURED, DEATH CASE/ ACCUMULATED MAN-HOUR X 1,000,000 (I/A) (b): LOST DAYS/ ACCUMULATED MAN-HOUR X 1,000(L/A) As seen in the table, there were no accidents throughout the construction period.
Source: JICA Project Team
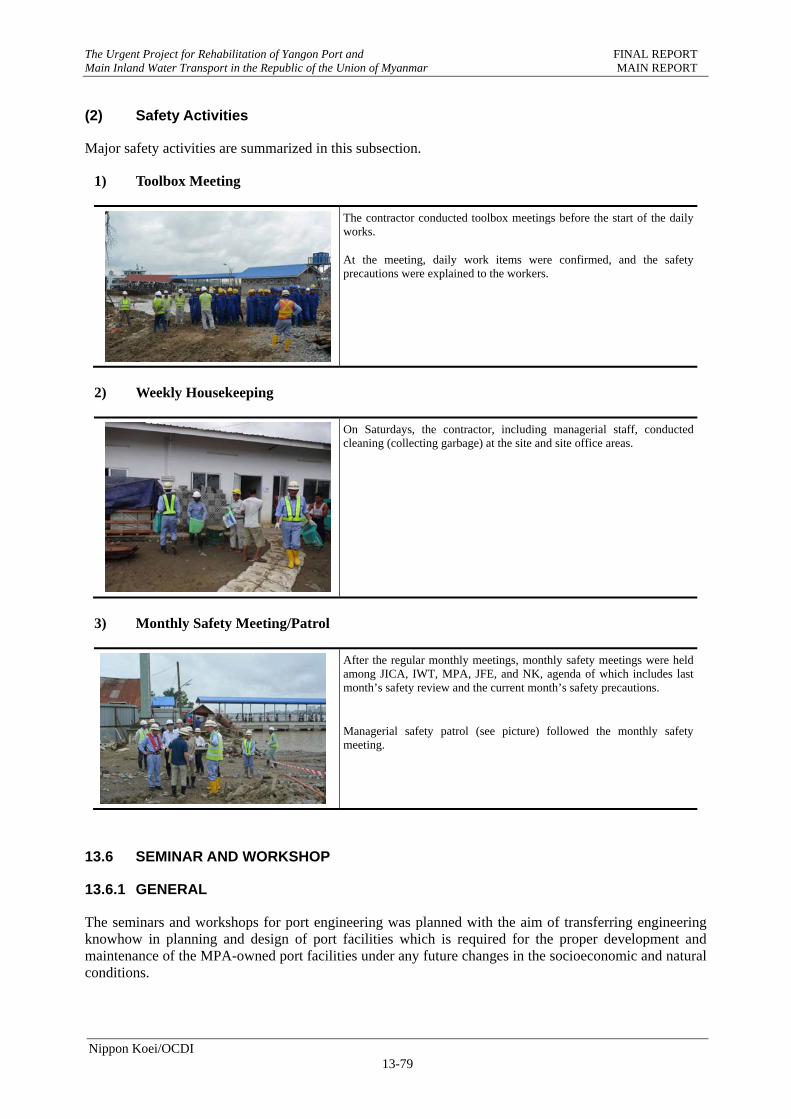
The Urgent Project for Rehabilitation of Yangon Port and FINAL REPORT Main Inland Water Transport in the Republic of the Union of Myanmar MAIN REPORT
Nippon Koei/OCDI 13-79
(2) Safety Activities
Major safety activities are summarized in this subsection.
1) Toolbox Meeting
The contractor conducted toolbox meetings before the start of the daily works. At the meeting, daily work items were confirmed, and the safety precautions were explained to the workers.
2) Weekly Housekeeping
On Saturdays, the contractor, including managerial staff, conducted cleaning (collecting garbage) at the site and site office areas.
3) Monthly Safety Meeting/Patrol
After the regular monthly meetings, monthly safety meetings were held among JICA, IWT, MPA, JFE, and NK, agenda of which includes last month’s safety review and the current month’s safety precautions.
Managerial safety patrol (see picture) followed the monthly safety meeting.
13.6 SEMINAR AND WORKSHOP
13.6.1 GENERAL
The seminars and workshops for port engineering was planned with the aim of transferring engineering knowhow in planning and design of port facilities which is required for the proper development and maintenance of the MPA-owned port facilities under any future changes in the socioeconomic and natural conditions.
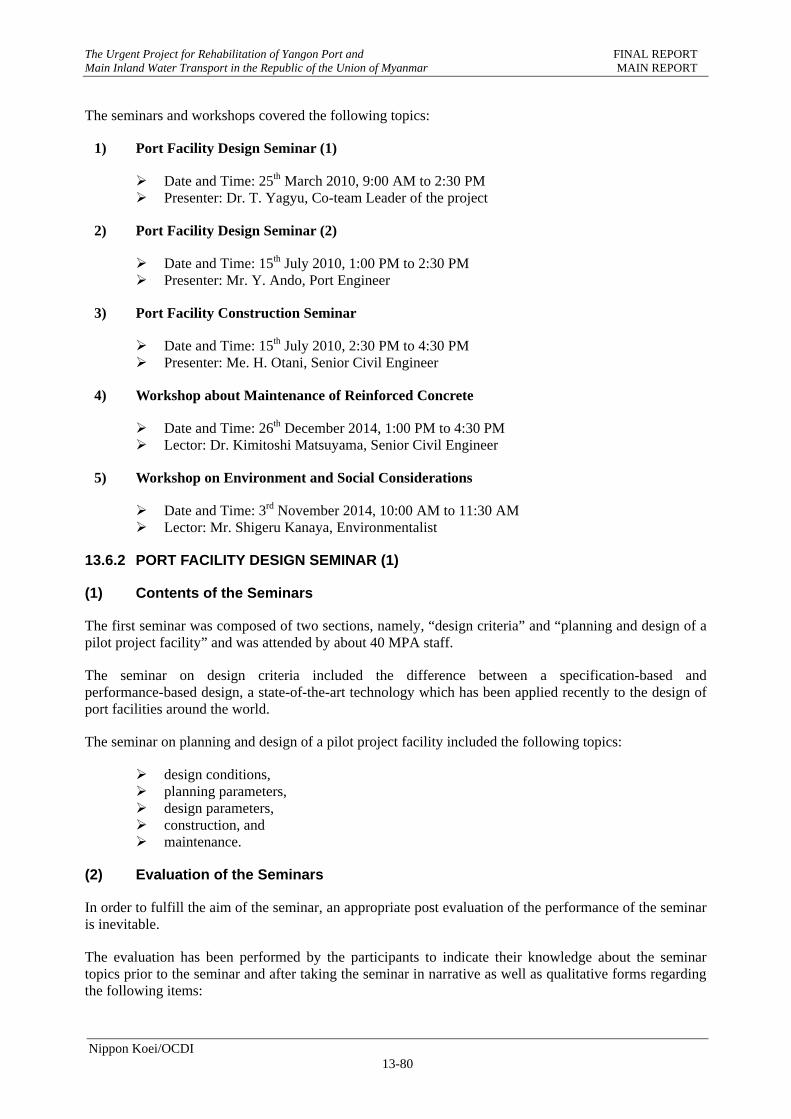
The Urgent Project for Rehabilitation of Yangon Port and FINAL REPORT Main Inland Water Transport in the Republic of the Union of Myanmar MAIN REPORT
Nippon Koei/OCDI 13-80
The seminars and workshops covered the following topics:
1) Port Facility Design Seminar (1)
Date and Time: 25th March 2010, 9:00 AM to 2:30 PM Presenter: Dr. T. Yagyu, Co-team Leader of the project
2) Port Facility Design Seminar (2)
Date and Time: 15th July 2010, 1:00 PM to 2:30 PM Presenter: Mr. Y. Ando, Port Engineer
3) Port Facility Construction Seminar
Date and Time: 15th July 2010, 2:30 PM to 4:30 PM Presenter: Me. H. Otani, Senior Civil Engineer
4) Workshop about Maintenance of Reinforced Concrete
Date and Time: 26th December 2014, 1:00 PM to 4:30 PM Lector: Dr. Kimitoshi Matsuyama, Senior Civil Engineer
5) Workshop on Environment and Social Considerations
Date and Time: 3rd November 2014, 10:00 AM to 11:30 AM Lector: Mr. Shigeru Kanaya, Environmentalist
13.6.2 PORT FACILITY DESIGN SEMINAR (1)
(1) Contents of the Seminars
The first seminar was composed of two sections, namely, “design criteria” and “planning and design of a pilot project facility” and was attended by about 40 MPA staff.
The seminar on design criteria included the difference between a specification-based and performance-based design, a state-of-the-art technology which has been applied recently to the design of port facilities around the world.
The seminar on planning and design of a pilot project facility included the following topics:
design conditions, planning parameters, design parameters, construction, and maintenance.
(2) Evaluation of the Seminars
In order to fulfill the aim of the seminar, an appropriate post evaluation of the performance of the seminar is inevitable.
The evaluation has been performed by the participants to indicate their knowledge about the seminar topics prior to the seminar and after taking the seminar in narrative as well as qualitative forms regarding the following items:

The Urgent Project for Rehabilitation of Yangon Port and FINAL REPORT Main Inland Water Transport in the Republic of the Union of Myanmar MAIN REPORT
Nippon Koei/OCDI 13-81
“Please answer the following questions in English.”
1) What kind of items shall be determined in planning and design of port facilities? 2) What is the difference between a specification-based design and a performance-based
design? 3) What interesting topics have you learned during the seminar? 4) Any other comments on the seminar or others?
Twenty one participants submitted the response forms after the seminar. Particular points to be noted are as follows:
1) Understanding of the Design Criteria
Eleven participants among the 21 who responded seem to understand the concept of the performance-based design criteria although they still need some time to understand it completely because a performance-based design criteria is a new and difficult technology adopted only starting from 2008, even in Japan.
2) Understanding of the Planning and Design of the Pilot Project Facility
Most participants were interested in the seminar and understood the design conditions and the planning and design parameters of the facility quite well as well as the concept of construction and maintenance of the facility which were the most important part of the seminar.
3) Other Comments
Participants appreciated the seminar given to them which enabled them to learn about new technology in port engineering. Some participants indicated that they want to have more opportunities like taking seminars on planning and design of port facilities or similar topics in the future.
(3) Overall Evaluation
A six-hour seminar seems not enough to provide complete understanding of the whole subject of the seminar. However, the trainees were only supposed to understand the new concept of performance-based design criteria and the planning and design of the pilot project facility which was the main subject of the seminar aiming at transfer of technology.
For further improvement of MPA engineers’ knowledge, it can be suggested to give more specific engineering seminars in connection with the construction of the pilot project facility before and during the construction period.
13.6.3 PORT FACILITY DESIGN SEMINAR (2)
(1) Purpose of the Seminar
The purpose of the seminar is to make Myanmar engineers understand "the general work procedure and content of quay design" and "the content of the design of pilot project facility.
(2) Contents of the Seminar
In the seminar, the design process of a pilot project facility was explained as an example to understand the procedure and the content of general quay design.
The seminar covered the following topics:
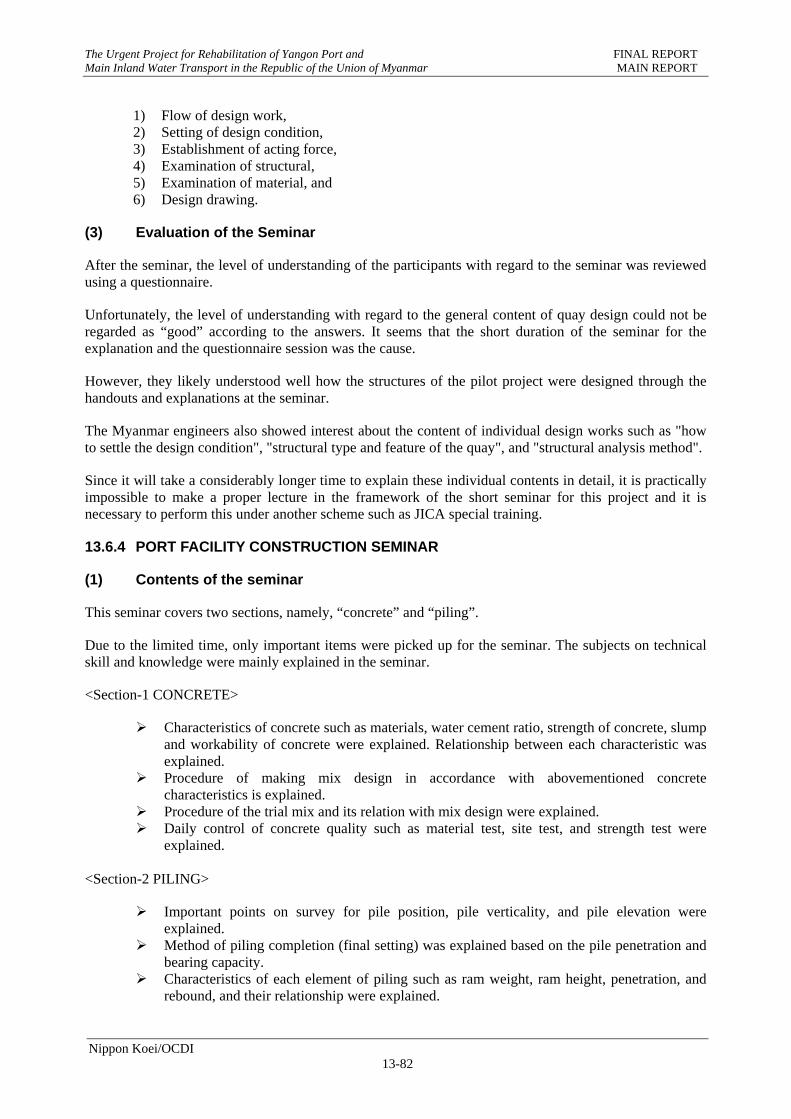
The Urgent Project for Rehabilitation of Yangon Port and FINAL REPORT Main Inland Water Transport in the Republic of the Union of Myanmar MAIN REPORT
Nippon Koei/OCDI 13-82
1) Flow of design work, 2) Setting of design condition, 3) Establishment of acting force, 4) Examination of structural, 5) Examination of material, and 6) Design drawing.
(3) Evaluation of the Seminar
After the seminar, the level of understanding of the participants with regard to the seminar was reviewed using a questionnaire.
Unfortunately, the level of understanding with regard to the general content of quay design could not be regarded as “good” according to the answers. It seems that the short duration of the seminar for the explanation and the questionnaire session was the cause.
However, they likely understood well how the structures of the pilot project were designed through the handouts and explanations at the seminar.
The Myanmar engineers also showed interest about the content of individual design works such as "how to settle the design condition", "structural type and feature of the quay", and "structural analysis method".
Since it will take a considerably longer time to explain these individual contents in detail, it is practically impossible to make a proper lecture in the framework of the short seminar for this project and it is necessary to perform this under another scheme such as JICA special training.
13.6.4 PORT FACILITY CONSTRUCTION SEMINAR
(1) Contents of the seminar
This seminar covers two sections, namely, “concrete” and “piling”.
Due to the limited time, only important items were picked up for the seminar. The subjects on technical skill and knowledge were mainly explained in the seminar.
<Section-1 CONCRETE>
Characteristics of concrete such as materials, water cement ratio, strength of concrete, slump and workability of concrete were explained. Relationship between each characteristic was explained.
Procedure of making mix design in accordance with abovementioned concrete characteristics is explained.
Procedure of the trial mix and its relation with mix design were explained. Daily control of concrete quality such as material test, site test, and strength test were
explained.
<Section-2 PILING>
Important points on survey for pile position, pile verticality, and pile elevation were explained.
Method of piling completion (final setting) was explained based on the pile penetration and bearing capacity.
Characteristics of each element of piling such as ram weight, ram height, penetration, and rebound, and their relationship were explained.
The Urgent Project for Rehabilitation of Yangon Port and FINAL REPORT Main Inland Water Transport in the Republic of the Union of Myanmar MAIN REPORT
Nippon Koei/OCDI 13-83
Mechanism, procedure and important points on the PDA test were explained.
(2) Evaluation of the Seminar
In order to evaluate the effectiveness of the seminar, an evaluation was performed among the participants to indicate their understanding of the seminar contents. Questions were prepared in the form of “Is the following sentence correct or not correct?” and answers are to be shown as ○ or X. The evaluation results of the participants’ level of understanding of each content are as follows:
<Section-1 CONCRETE>
Participants understood about concrete generally. However, many participants did not understand about the relationship between the water content (W/C) and concrete strength.
<Section-2 PILING>
Participants understood piling work comparatively well. They are interested in final setting and PDA test more because the final setting method is still not popular in Myanmar.
(3) Conclusion of the Seminar
Many participants attended the lecture with high interest and concentration. Many questions were raised during the lecture which shows that they require more technical knowledge.
On the other hand, their technical knowledge is not sufficient according to the evaluation of the seminar mentioned above and technical discussion during the study. In particular, knowledge about quality control on site is necessary for them in properly controlling the construction project.
It is recommended to give a more specific engineering seminar on the basic technical skill of construction supervision.
13.6.5 WORKSHOP ABOUT MAINTENANCE OF REINFORCED CONCRETE
(1) Purpose
In Yangon Port, many jetties are made of reinforced concrete and have been used for a long time. Some of the jetties need maintenance because they have deteriorated. Japanese experts investigated them and enhanced Myanmar engineer’s technologies of investigation, evaluation, repair, and maintenance for reinforced concrete jetties through training.
(2) Effects
On-site investigation and lecture will enhance Myanmar engineer’s technologies regarding deterioration of reinforced concrete as follows:
How to investigate them, How to evaluate the deterioration, How to repair them, and How to maintain them.
(3) Schedule
On-site investigation: October 2013
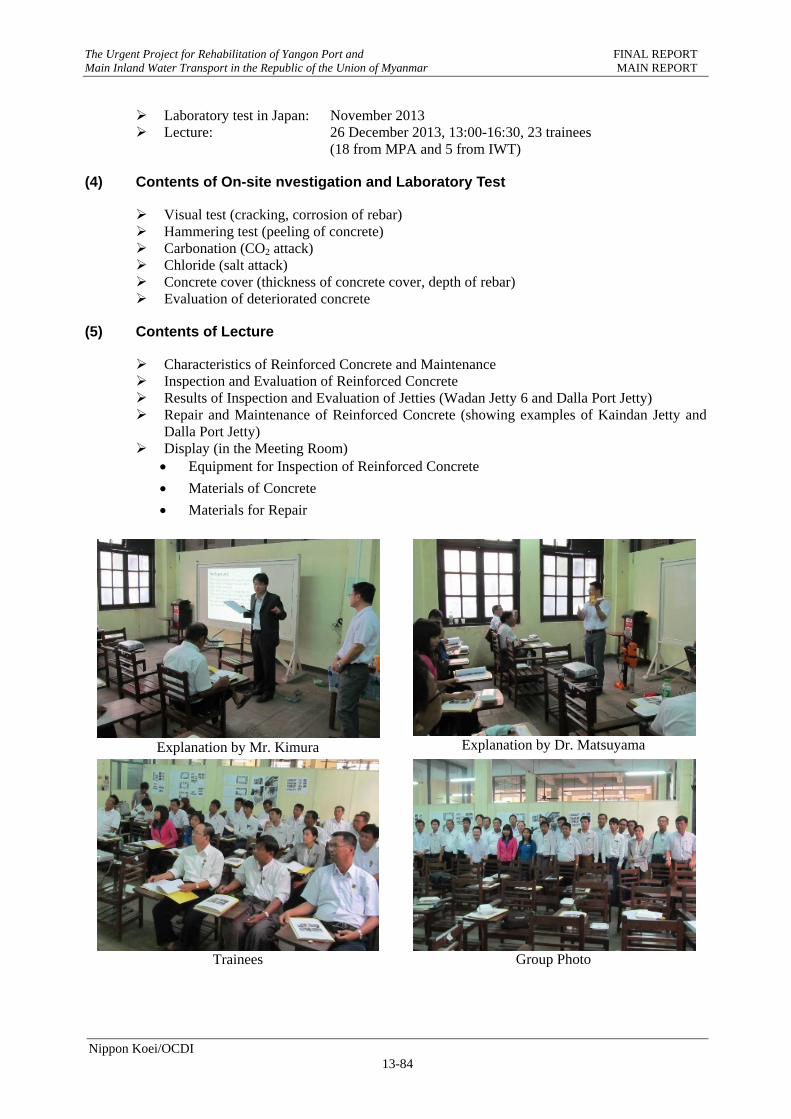
The Urgent Project for Rehabilitation of Yangon Port and FINAL REPORT Main Inland Water Transport in the Republic of the Union of Myanmar MAIN REPORT
Nippon Koei/OCDI 13-84
Laboratory test in Japan: November 2013 Lecture: 26 December 2013, 13:00-16:30, 23 trainees
(18 from MPA and 5 from IWT)
(4) Contents of On-site nvestigation and Laboratory Test
Visual test (cracking, corrosion of rebar) Hammering test (peeling of concrete) Carbonation (CO2 attack) Chloride (salt attack) Concrete cover (thickness of concrete cover, depth of rebar) Evaluation of deteriorated concrete
(5) Contents of Lecture
Characteristics of Reinforced Concrete and Maintenance Inspection and Evaluation of Reinforced Concrete Results of Inspection and Evaluation of Jetties (Wadan Jetty 6 and Dalla Port Jetty) Repair and Maintenance of Reinforced Concrete (showing examples of Kaindan Jetty and
Dalla Port Jetty) Display (in the Meeting Room)
Equipment for Inspection of Reinforced Concrete
Materials of Concrete
Materials for Repair
Explanation by Mr. Kimura
Explanation by Dr. Matsuyama
Trainees
Group Photo
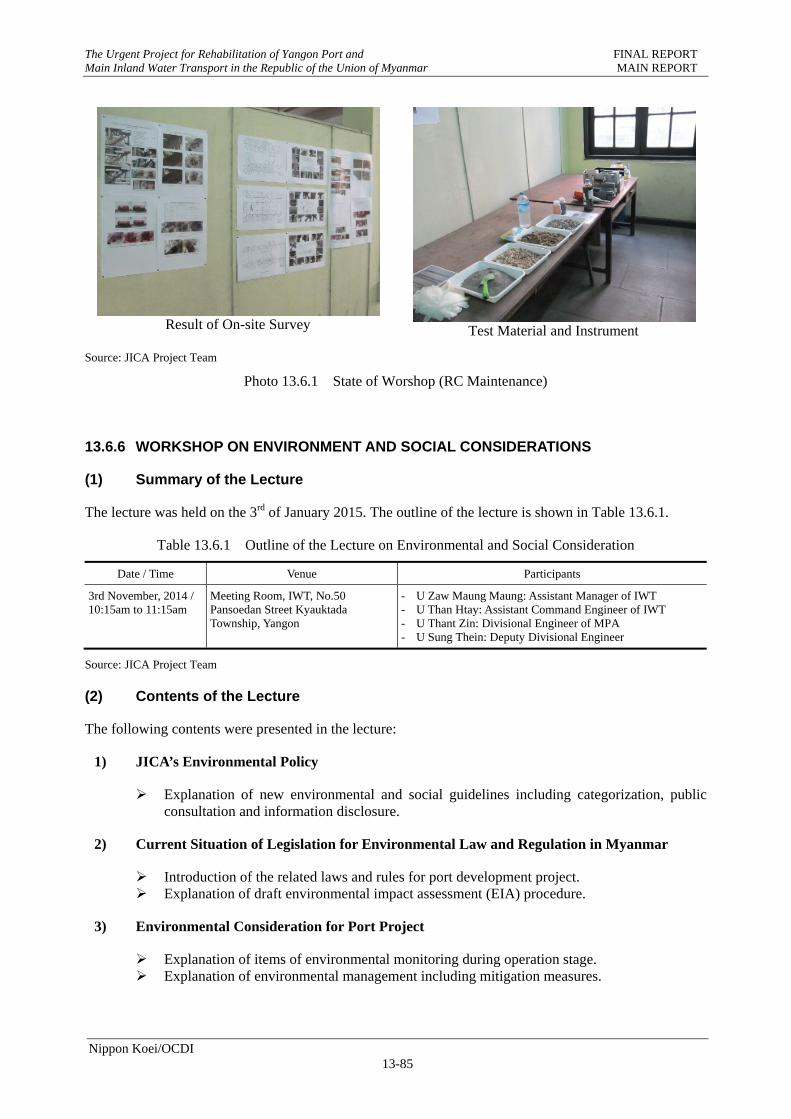
The Urgent Project for Rehabilitation of Yangon Port and FINAL REPORT Main Inland Water Transport in the Republic of the Union of Myanmar MAIN REPORT
Nippon Koei/OCDI 13-85
Result of On-site Survey
Test Material and Instrument
Source: JICA Project Team
Photo 13.6.1 State of Worshop (RC Maintenance)
13.6.6 WORKSHOP ON ENVIRONMENT AND SOCIAL CONSIDERATIONS
(1) Summary of the Lecture
The lecture was held on the 3rd of January 2015. The outline of the lecture is shown in Table 13.6.1.
Table 13.6.1 Outline of the Lecture on Environmental and Social Consideration
Date / Time Venue Participants
3rd November, 2014 / 10:15am to 11:15am
Meeting Room, IWT, No.50 Pansoedan Street Kyauktada Township, Yangon
- U Zaw Maung Maung: Assistant Manager of IWT - U Than Htay: Assistant Command Engineer of IWT - U Thant Zin: Divisional Engineer of MPA - U Sung Thein: Deputy Divisional Engineer
Source: JICA Project Team
(2) Contents of the Lecture
The following contents were presented in the lecture:
1) JICA’s Environmental Policy
Explanation of new environmental and social guidelines including categorization, public consultation and information disclosure.
2) Current Situation of Legislation for Environmental Law and Regulation in Myanmar
Introduction of the related laws and rules for port development project. Explanation of draft environmental impact assessment (EIA) procedure.
3) Environmental Consideration for Port Project
Explanation of items of environmental monitoring during operation stage. Explanation of environmental management including mitigation measures.
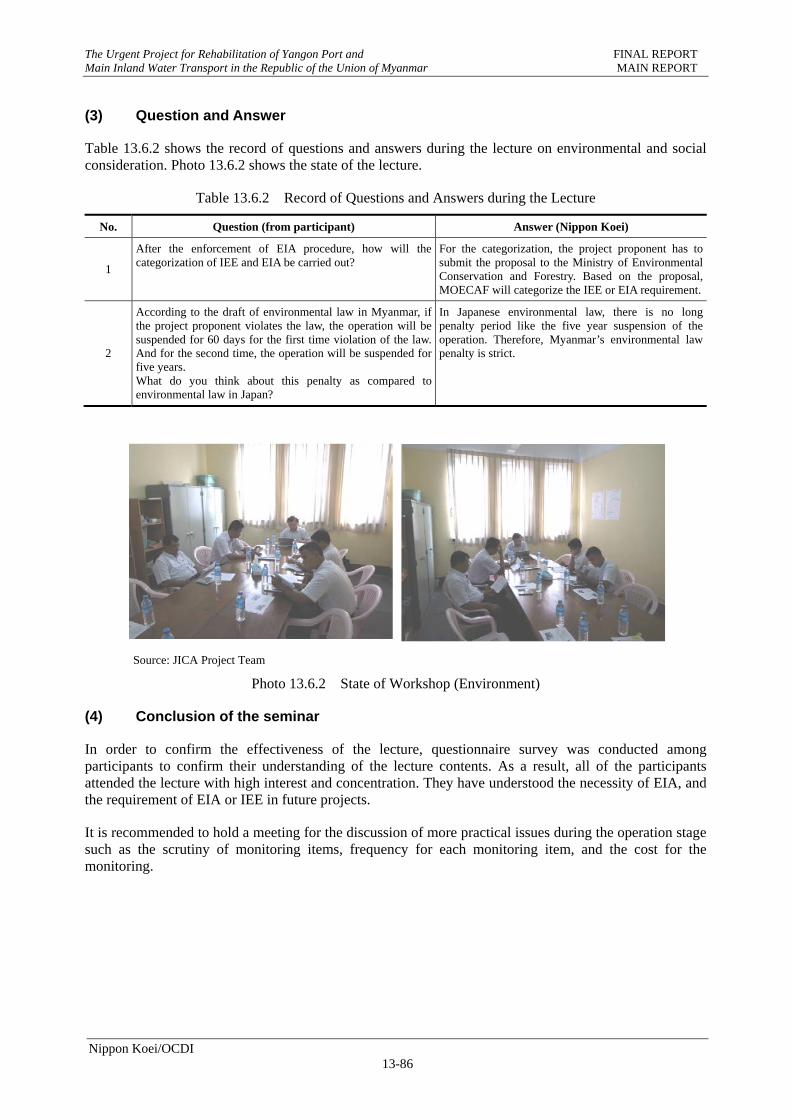
The Urgent Project for Rehabilitation of Yangon Port and FINAL REPORT Main Inland Water Transport in the Republic of the Union of Myanmar MAIN REPORT
Nippon Koei/OCDI 13-86
(3) Question and Answer
Table 13.6.2 shows the record of questions and answers during the lecture on environmental and social consideration. Photo 13.6.2 shows the state of the lecture.
Table 13.6.2 Record of Questions and Answers during the Lecture
No. Question (from participant) Answer (Nippon Koei)
1
After the enforcement of EIA procedure, how will the categorization of IEE and EIA be carried out?
For the categorization, the project proponent has to submit the proposal to the Ministry of Environmental Conservation and Forestry. Based on the proposal, MOECAF will categorize the IEE or EIA requirement.
2
According to the draft of environmental law in Myanmar, if the project proponent violates the law, the operation will be suspended for 60 days for the first time violation of the law. And for the second time, the operation will be suspended for five years. What do you think about this penalty as compared to environmental law in Japan?
In Japanese environmental law, there is no long penalty period like the five year suspension of the operation. Therefore, Myanmar’s environmental law penalty is strict.
Source: JICA Project Team
Photo 13.6.2 State of Workshop (Environment)
(4) Conclusion of the seminar
In order to confirm the effectiveness of the lecture, questionnaire survey was conducted among participants to confirm their understanding of the lecture contents. As a result, all of the participants attended the lecture with high interest and concentration. They have understood the necessity of EIA, and the requirement of EIA or IEE in future projects.
It is recommended to hold a meeting for the discussion of more practical issues during the operation stage such as the scrutiny of monitoring items, frequency for each monitoring item, and the cost for the monitoring.

CHAPTER 14
SUMMARY (OUTPUT AND EVALUATION)
The Urgent Project for Rehabilitation of Yangon Port and FINAL REPORT Main Inland Water Transport in the Republic of the Union of Myanmar MAIN REPORT
Nippon Koei/OCDI 14-1
CHAPTER 14 SUMMARY (OUTPUT AND EVALUATION)
14.1 REPORT OUTLINE
This Project consists of two parts: Establishment of recovery plan from the damages caused by Cyclone Nargis (Part 1) and Capacity development of counterparts through the recovery measures (Part 2). This chapter delineates the output and evaluation of the capacity development.
14.1.1 PART 1
The organizations that are involved in the waterway transport in Myanmar and the services were explained in Chapter 2. Characteristics of Cyclone Nargis were indicated in Chapter 3. Details of the facilities operated by MPA and IWT, and the damages caused by Nargis were explained in Chapter 4 to 6. In each chapter, present state analysis, definition of problems, listing of recovery plan, and prioritization of recovery projects (urgent, short-term, and long-term) were listed.
Chapter 4: Measure for Safe Navigation in Yangon Port Chapter 5: Recovery Plan for Yangon Port Chapter 6: Recovery Plan of Main Inland Waterway Transport
14.1.2 PART 2
In Chapter 7, procedures for selecting the project packages depending on the urgency and the necessity by the counterpart for capacity development were depicted in Chapter 7. At the second steering committee, the following five packages (two trainings, and one pilot project) were decided, shown below. In Chapter 8, environmental consideration investigation was summarized, which was carried out in accordance with the Myanmar laws.
Chapter 9: Capacity Development for Ship Crew and Navigation Chapter 10: Capacity Development for Repairing Ships and Metal Structures Chapter 11: Study on Maritime Disaster Risk Management Chapter 12: Study of Tide Observation System
14.2 ENVIRONMENTAL AND SOCIAL CONSIDERATION (CHAPTER 8)
When JICA study team commenced the services in 2009, there was no environmental law and the public perception of environmental and social consideration was scarce. During the course of implementation of the investigation and the preparation of the interim report, the counterparts had acquired such knowledge. Furthermore, during the execution of the pilot project, which started after the Myanmar environmental law had been introduced in 2014, environmental issues including Myanmar law and JICA’s guidelines were lectured in the seminar. Judging from the interests that the counterparts showed in the regular progress meetings of the pilot project, the perception of environmental and social consideration seems to have increased.
14.3 CAPACITY DEVELOPMENT FOR SHIP CREW AND NAVIGATION (CHAPTER 9)
Trainings for safety navigation include Capacity Development for Ship Crew of IWT Ships, Capacity Development on Ship Navigation Training, and Capacity Development of Ship Crew of IWT Ships. Through these trainings, the safety of inland waterway transport was improved. Also it is believed that the perception of importance of statistical data such as tidal elevations has increased.
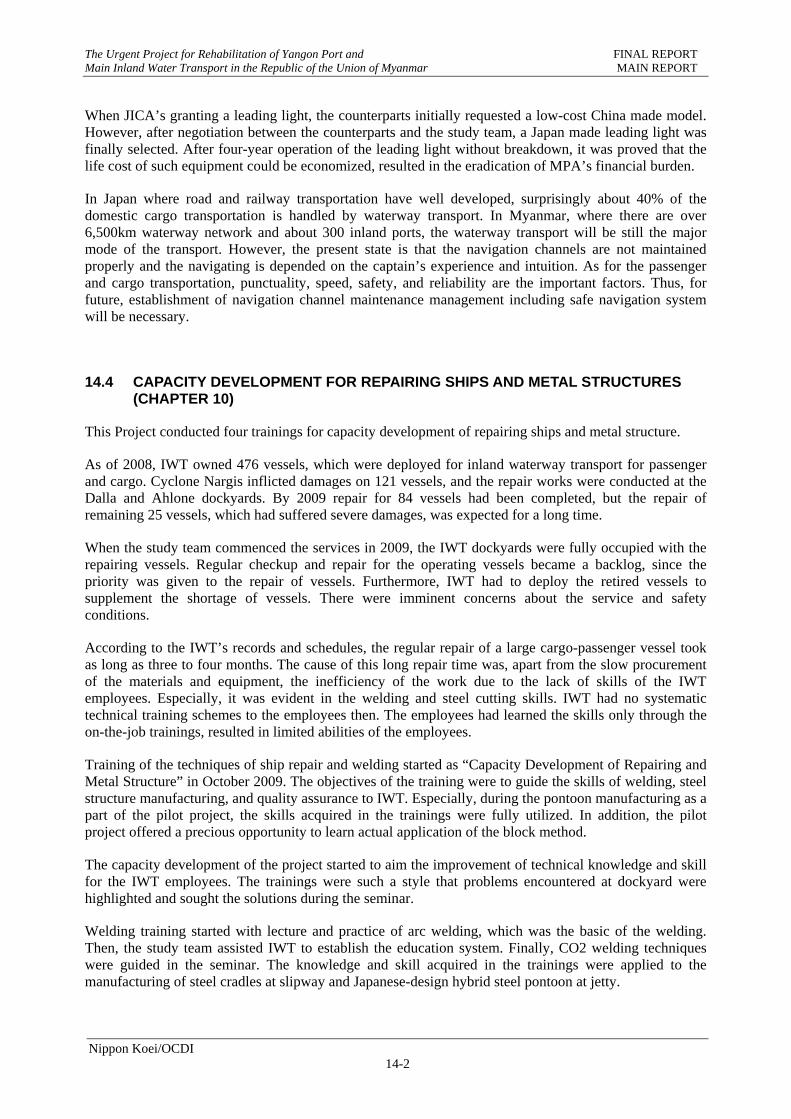
The Urgent Project for Rehabilitation of Yangon Port and FINAL REPORT Main Inland Water Transport in the Republic of the Union of Myanmar MAIN REPORT
Nippon Koei/OCDI 14-2
When JICA’s granting a leading light, the counterparts initially requested a low-cost China made model. However, after negotiation between the counterparts and the study team, a Japan made leading light was finally selected. After four-year operation of the leading light without breakdown, it was proved that the life cost of such equipment could be economized, resulted in the eradication of MPA’s financial burden.
In Japan where road and railway transportation have well developed, surprisingly about 40% of the domestic cargo transportation is handled by waterway transport. In Myanmar, where there are over 6,500km waterway network and about 300 inland ports, the waterway transport will be still the major mode of the transport. However, the present state is that the navigation channels are not maintained properly and the navigating is depended on the captain’s experience and intuition. As for the passenger and cargo transportation, punctuality, speed, safety, and reliability are the important factors. Thus, for future, establishment of navigation channel maintenance management including safe navigation system will be necessary.
14.4 CAPACITY DEVELOPMENT FOR REPAIRING SHIPS AND METAL STRUCTURES (CHAPTER 10)
This Project conducted four trainings for capacity development of repairing ships and metal structure.
As of 2008, IWT owned 476 vessels, which were deployed for inland waterway transport for passenger and cargo. Cyclone Nargis inflicted damages on 121 vessels, and the repair works were conducted at the Dalla and Ahlone dockyards. By 2009 repair for 84 vessels had been completed, but the repair of remaining 25 vessels, which had suffered severe damages, was expected for a long time.
When the study team commenced the services in 2009, the IWT dockyards were fully occupied with the repairing vessels. Regular checkup and repair for the operating vessels became a backlog, since the priority was given to the repair of vessels. Furthermore, IWT had to deploy the retired vessels to supplement the shortage of vessels. There were imminent concerns about the service and safety conditions.
According to the IWT’s records and schedules, the regular repair of a large cargo-passenger vessel took as long as three to four months. The cause of this long repair time was, apart from the slow procurement of the materials and equipment, the inefficiency of the work due to the lack of skills of the IWT employees. Especially, it was evident in the welding and steel cutting skills. IWT had no systematic technical training schemes to the employees then. The employees had learned the skills only through the on-the-job trainings, resulted in limited abilities of the employees.
Training of the techniques of ship repair and welding started as “Capacity Development of Repairing and Metal Structure” in October 2009. The objectives of the training were to guide the skills of welding, steel structure manufacturing, and quality assurance to IWT. Especially, during the pontoon manufacturing as a part of the pilot project, the skills acquired in the trainings were fully utilized. In addition, the pilot project offered a precious opportunity to learn actual application of the block method.
The capacity development of the project started to aim the improvement of technical knowledge and skill for the IWT employees. The trainings were such a style that problems encountered at dockyard were highlighted and sought the solutions during the seminar.
Welding training started with lecture and practice of arc welding, which was the basic of the welding. Then, the study team assisted IWT to establish the education system. Finally, CO2 welding techniques were guided in the seminar. The knowledge and skill acquired in the trainings were applied to the manufacturing of steel cradles at slipway and Japanese-design hybrid steel pontoon at jetty.
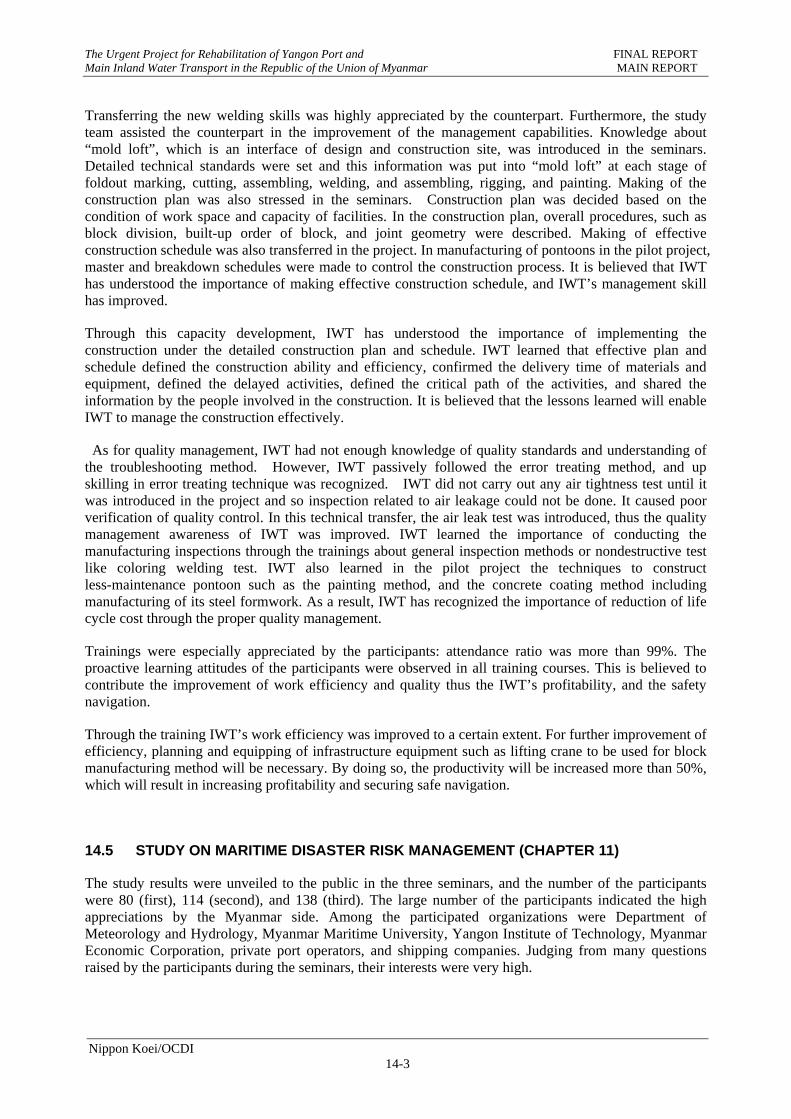
The Urgent Project for Rehabilitation of Yangon Port and FINAL REPORT Main Inland Water Transport in the Republic of the Union of Myanmar MAIN REPORT
Nippon Koei/OCDI 14-3
Transferring the new welding skills was highly appreciated by the counterpart. Furthermore, the study team assisted the counterpart in the improvement of the management capabilities. Knowledge about “mold loft”, which is an interface of design and construction site, was introduced in the seminars. Detailed technical standards were set and this information was put into “mold loft” at each stage of foldout marking, cutting, assembling, welding, and assembling, rigging, and painting. Making of the construction plan was also stressed in the seminars. Construction plan was decided based on the condition of work space and capacity of facilities. In the construction plan, overall procedures, such as block division, built-up order of block, and joint geometry were described. Making of effective construction schedule was also transferred in the project. In manufacturing of pontoons in the pilot project, master and breakdown schedules were made to control the construction process. It is believed that IWT has understood the importance of making effective construction schedule, and IWT’s management skill has improved.
Through this capacity development, IWT has understood the importance of implementing the construction under the detailed construction plan and schedule. IWT learned that effective plan and schedule defined the construction ability and efficiency, confirmed the delivery time of materials and equipment, defined the delayed activities, defined the critical path of the activities, and shared the information by the people involved in the construction. It is believed that the lessons learned will enable IWT to manage the construction effectively.
As for quality management, IWT had not enough knowledge of quality standards and understanding of the troubleshooting method. However, IWT passively followed the error treating method, and up skilling in error treating technique was recognized. IWT did not carry out any air tightness test until it was introduced in the project and so inspection related to air leakage could not be done. It caused poor verification of quality control. In this technical transfer, the air leak test was introduced, thus the quality management awareness of IWT was improved. IWT learned the importance of conducting the manufacturing inspections through the trainings about general inspection methods or nondestructive test like coloring welding test. IWT also learned in the pilot project the techniques to construct less-maintenance pontoon such as the painting method, and the concrete coating method including manufacturing of its steel formwork. As a result, IWT has recognized the importance of reduction of life cycle cost through the proper quality management.
Trainings were especially appreciated by the participants: attendance ratio was more than 99%. The proactive learning attitudes of the participants were observed in all training courses. This is believed to contribute the improvement of work efficiency and quality thus the IWT’s profitability, and the safety navigation.
Through the training IWT’s work efficiency was improved to a certain extent. For further improvement of efficiency, planning and equipping of infrastructure equipment such as lifting crane to be used for block manufacturing method will be necessary. By doing so, the productivity will be increased more than 50%, which will result in increasing profitability and securing safe navigation.
14.5 STUDY ON MARITIME DISASTER RISK MANAGEMENT (CHAPTER 11)
The study results were unveiled to the public in the three seminars, and the number of the participants were 80 (first), 114 (second), and 138 (third). The large number of the participants indicated the high appreciations by the Myanmar side. Among the participated organizations were Department of Meteorology and Hydrology, Myanmar Maritime University, Yangon Institute of Technology, Myanmar Economic Corporation, private port operators, and shipping companies. Judging from many questions raised by the participants during the seminars, their interests were very high.
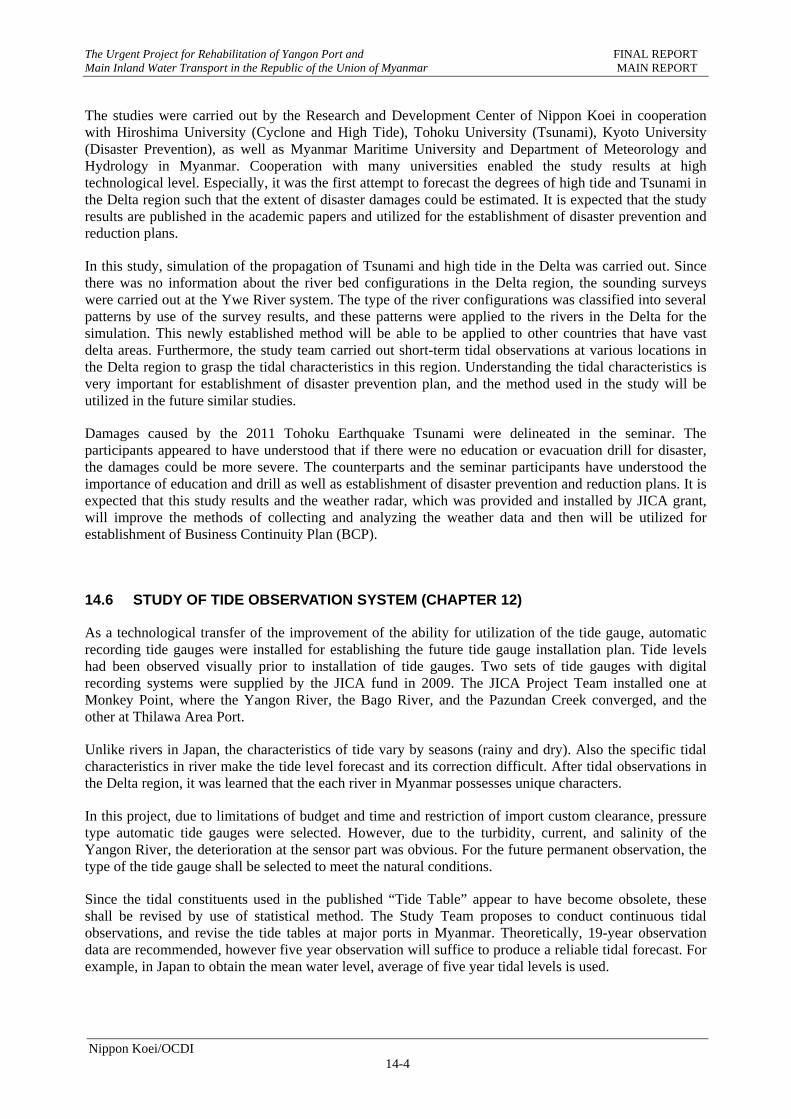
The Urgent Project for Rehabilitation of Yangon Port and FINAL REPORT Main Inland Water Transport in the Republic of the Union of Myanmar MAIN REPORT
Nippon Koei/OCDI 14-4
The studies were carried out by the Research and Development Center of Nippon Koei in cooperation with Hiroshima University (Cyclone and High Tide), Tohoku University (Tsunami), Kyoto University (Disaster Prevention), as well as Myanmar Maritime University and Department of Meteorology and Hydrology in Myanmar. Cooperation with many universities enabled the study results at high technological level. Especially, it was the first attempt to forecast the degrees of high tide and Tsunami in the Delta region such that the extent of disaster damages could be estimated. It is expected that the study results are published in the academic papers and utilized for the establishment of disaster prevention and reduction plans.
In this study, simulation of the propagation of Tsunami and high tide in the Delta was carried out. Since there was no information about the river bed configurations in the Delta region, the sounding surveys were carried out at the Ywe River system. The type of the river configurations was classified into several patterns by use of the survey results, and these patterns were applied to the rivers in the Delta for the simulation. This newly established method will be able to be applied to other countries that have vast delta areas. Furthermore, the study team carried out short-term tidal observations at various locations in the Delta region to grasp the tidal characteristics in this region. Understanding the tidal characteristics is very important for establishment of disaster prevention plan, and the method used in the study will be utilized in the future similar studies.
Damages caused by the 2011 Tohoku Earthquake Tsunami were delineated in the seminar. The participants appeared to have understood that if there were no education or evacuation drill for disaster, the damages could be more severe. The counterparts and the seminar participants have understood the importance of education and drill as well as establishment of disaster prevention and reduction plans. It is expected that this study results and the weather radar, which was provided and installed by JICA grant, will improve the methods of collecting and analyzing the weather data and then will be utilized for establishment of Business Continuity Plan (BCP).
14.6 STUDY OF TIDE OBSERVATION SYSTEM (CHAPTER 12)
As a technological transfer of the improvement of the ability for utilization of the tide gauge, automatic recording tide gauges were installed for establishing the future tide gauge installation plan. Tide levels had been observed visually prior to installation of tide gauges. Two sets of tide gauges with digital recording systems were supplied by the JICA fund in 2009. The JICA Project Team installed one at Monkey Point, where the Yangon River, the Bago River, and the Pazundan Creek converged, and the other at Thilawa Area Port.
Unlike rivers in Japan, the characteristics of tide vary by seasons (rainy and dry). Also the specific tidal characteristics in river make the tide level forecast and its correction difficult. After tidal observations in the Delta region, it was learned that the each river in Myanmar possesses unique characters.
In this project, due to limitations of budget and time and restriction of import custom clearance, pressure type automatic tide gauges were selected. However, due to the turbidity, current, and salinity of the Yangon River, the deterioration at the sensor part was obvious. For the future permanent observation, the type of the tide gauge shall be selected to meet the natural conditions.
Since the tidal constituents used in the published “Tide Table” appear to have become obsolete, these shall be revised by use of statistical method. The Study Team proposes to conduct continuous tidal observations, and revise the tide tables at major ports in Myanmar. Theoretically, 19-year observation data are recommended, however five year observation will suffice to produce a reliable tidal forecast. For example, in Japan to obtain the mean water level, average of five year tidal levels is used.
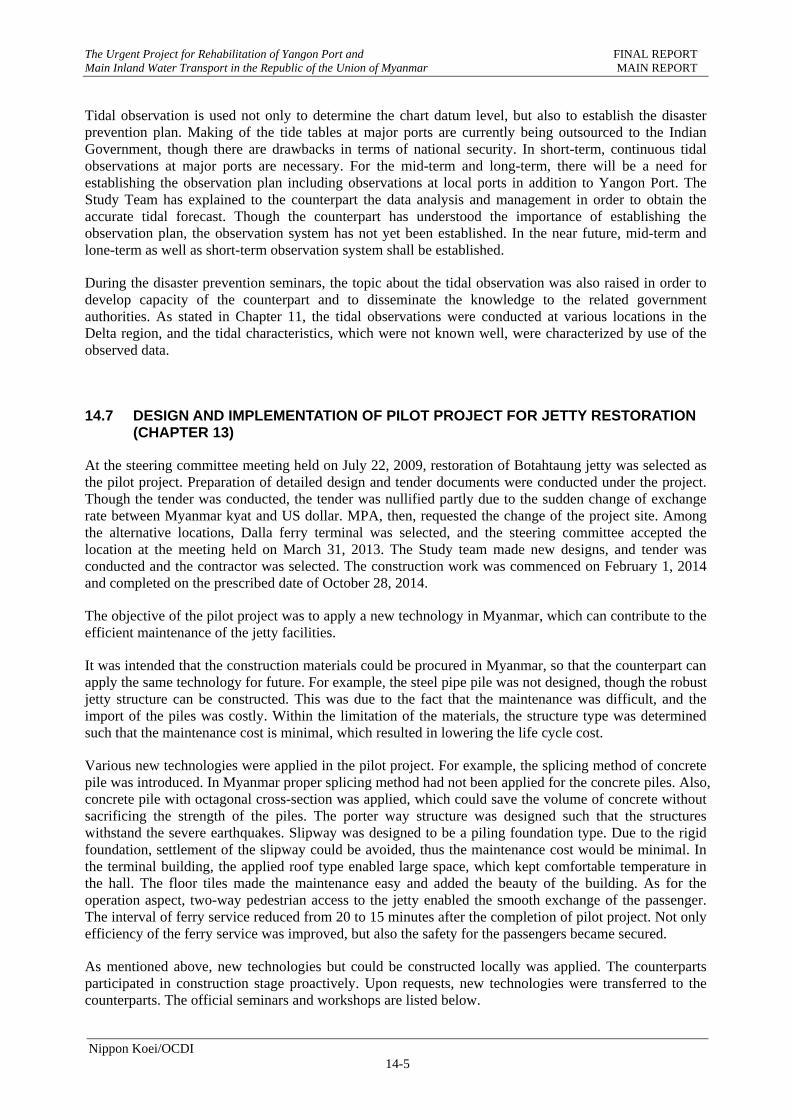
The Urgent Project for Rehabilitation of Yangon Port and FINAL REPORT Main Inland Water Transport in the Republic of the Union of Myanmar MAIN REPORT
Nippon Koei/OCDI 14-5
Tidal observation is used not only to determine the chart datum level, but also to establish the disaster prevention plan. Making of the tide tables at major ports are currently being outsourced to the Indian Government, though there are drawbacks in terms of national security. In short-term, continuous tidal observations at major ports are necessary. For the mid-term and long-term, there will be a need for establishing the observation plan including observations at local ports in addition to Yangon Port. The Study Team has explained to the counterpart the data analysis and management in order to obtain the accurate tidal forecast. Though the counterpart has understood the importance of establishing the observation plan, the observation system has not yet been established. In the near future, mid-term and lone-term as well as short-term observation system shall be established.
During the disaster prevention seminars, the topic about the tidal observation was also raised in order to develop capacity of the counterpart and to disseminate the knowledge to the related government authorities. As stated in Chapter 11, the tidal observations were conducted at various locations in the Delta region, and the tidal characteristics, which were not known well, were characterized by use of the observed data.
14.7 DESIGN AND IMPLEMENTATION OF PILOT PROJECT FOR JETTY RESTORATION (CHAPTER 13)
At the steering committee meeting held on July 22, 2009, restoration of Botahtaung jetty was selected as the pilot project. Preparation of detailed design and tender documents were conducted under the project. Though the tender was conducted, the tender was nullified partly due to the sudden change of exchange rate between Myanmar kyat and US dollar. MPA, then, requested the change of the project site. Among the alternative locations, Dalla ferry terminal was selected, and the steering committee accepted the location at the meeting held on March 31, 2013. The Study team made new designs, and tender was conducted and the contractor was selected. The construction work was commenced on February 1, 2014 and completed on the prescribed date of October 28, 2014.
The objective of the pilot project was to apply a new technology in Myanmar, which can contribute to the efficient maintenance of the jetty facilities.
It was intended that the construction materials could be procured in Myanmar, so that the counterpart can apply the same technology for future. For example, the steel pipe pile was not designed, though the robust jetty structure can be constructed. This was due to the fact that the maintenance was difficult, and the import of the piles was costly. Within the limitation of the materials, the structure type was determined such that the maintenance cost is minimal, which resulted in lowering the life cycle cost.
Various new technologies were applied in the pilot project. For example, the splicing method of concrete pile was introduced. In Myanmar proper splicing method had not been applied for the concrete piles. Also, concrete pile with octagonal cross-section was applied, which could save the volume of concrete without sacrificing the strength of the piles. The porter way structure was designed such that the structures withstand the severe earthquakes. Slipway was designed to be a piling foundation type. Due to the rigid foundation, settlement of the slipway could be avoided, thus the maintenance cost would be minimal. In the terminal building, the applied roof type enabled large space, which kept comfortable temperature in the hall. The floor tiles made the maintenance easy and added the beauty of the building. As for the operation aspect, two-way pedestrian access to the jetty enabled the smooth exchange of the passenger. The interval of ferry service reduced from 20 to 15 minutes after the completion of pilot project. Not only efficiency of the ferry service was improved, but also the safety for the passengers became secured.
As mentioned above, new technologies but could be constructed locally was applied. The counterparts participated in construction stage proactively. Upon requests, new technologies were transferred to the counterparts. The official seminars and workshops are listed below.
The Urgent Project for Rehabilitation of Yangon Port and FINAL REPORT Main Inland Water Transport in the Republic of the Union of Myanmar MAIN REPORT
Nippon Koei/OCDI 14-6
1) Port Facility Design Seminar
In order to improve the design capability, by using the Japan’s port design standard, the seminars for design of port facilities were conducted. The content of the seminar included design flow, determination of design conditions, determination of external forces, structure inspection, material inspection, making and reading of drawings. The design calculations of the jetty design were provided to MPA for future use.
2) Port Facility Construction Seminar
In order to improve the construction supervision skills, seminar about the port facility construction was conducted. Major supervision items for concreting, such as characteristics and mix design of concrete, trail concrete mix, and quality control, were lectured in the seminars. As for the piling, which required high technical skills, lecture items included piling method, pile penetration confirmation, and piling monitoring.
3) Workshop about Maintenance of Reinforced Concrete
Most jetties in Yangon Port were made of reinforced concrete, which had been made as old as 70 years ago. Deterioration of the structure is at the critical stage, and most jetties need urgent rehabilitation. The Study Team conducted the jetty soundness investigation. In the workshop, trainings to MPA staff were made on the subject of inspections (appearance, hammer knocking, carbonation, chloride, thickness of concrete cover), evaluation method of deteriorated concrete, characteristics and repairs of reinforced concrete, and maintenance method.
4) Workshop on Environment and Social Conditions
Topics of environmental seminars conducted during the pilot project contained (i) JICA’s environmental policy, (ii) Current situation of legislation for environmental law and regulation in Myanmar, and (iii) Environmental consideration for the port project.
The counterparts have increased the understandings in various aspects through the abovementioned seminars and workshops.
As for the construction safety, the counterparts have learned the safety management skills thorough the weekly and monthly safety meetings and the safety patrols. The safety awareness had gradually been increased during the course of the project: wearing ratio of PPE (Personal Protective Equipment) was satisfactory level at the end.
Through this project it was found out that Yangon Port was susceptible to disaster. Since the Yangon Port handles 90% of import and export cargos in Myanmar, it is imminent to reinforce the deteriorating facilities. It would be desirable that the port facility soundness investigations would be carried out, and targeted facilities be selected. Selection of the targeted facilities would be utilized for MPA’s Business Continuity Plan (BCP). Japanese assistance to establish BCP is highly expected.