Chapter 12 Services and Settlements -...
47
© 2017 Pearson Education, Inc. Chapter 12 Services and Settlements Tim Scharks Green River College Chapter 12 Lecture
-
Upload
phungxuyen -
Category
Documents
-
view
253 -
download
3
Transcript of Chapter 12 Services and Settlements -...
© 2017 Pearson Education, Inc.
Chapter 12
Services and
Settlements
Tim Scharks
Green River College
Chapter 12 Lecture

© 2017 Pearson Education, Inc.
1. Where Are Services Distributed?
2. Where Are Consumer Services Distributed?
3. Where are Business Services Distributed?
4. Why Do Services Cluster in Settlements?
Services and Settlements: Key Issues
© 2017 Pearson Education, Inc.
• Service: activity to fulfill human want or
need for sale
• Settlement: permanent collection of
buildings where people reside
• Services cluster in settlements, especially in
developed countries.
• Three types of services
– consumer
– business
– public
Key Issue 1: Where Are Services
Distributed?
© 2017 Pearson Education, Inc.
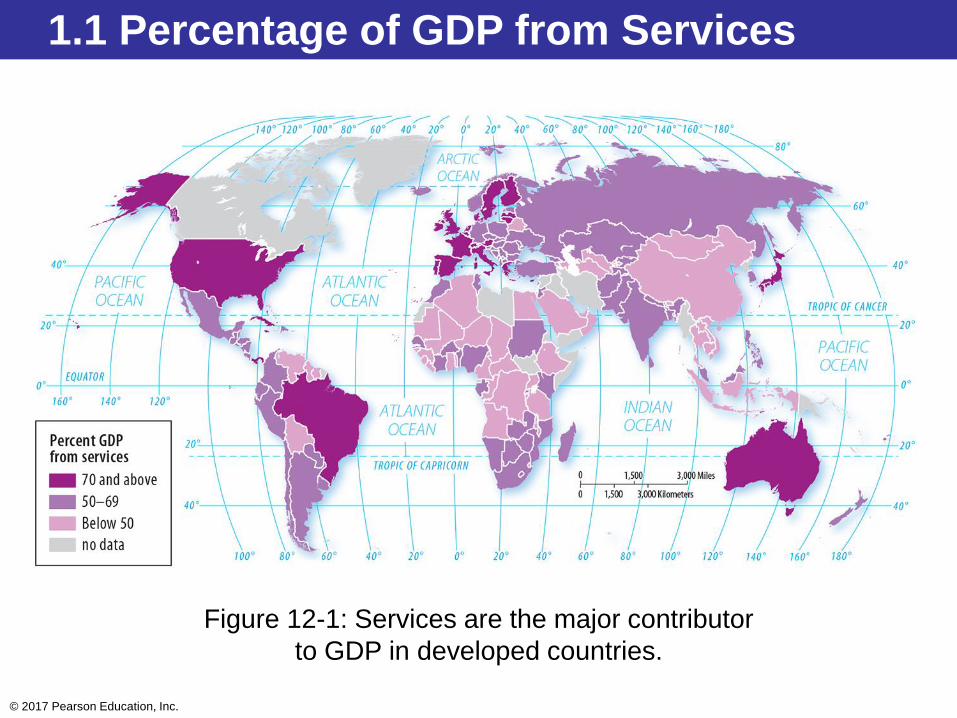
1.1 Percentage of GDP from Services
Figure 12-1: Services are the major contributor
to GDP in developed countries.

© 2017 Pearson Education, Inc.
1.1 U.S. Employment
Figure 12-2: More than 85 percent of
all jobs in the United States are some
form of service. Half are consumer
services, and one quarter are
business services.
© 2017 Pearson Education, Inc.
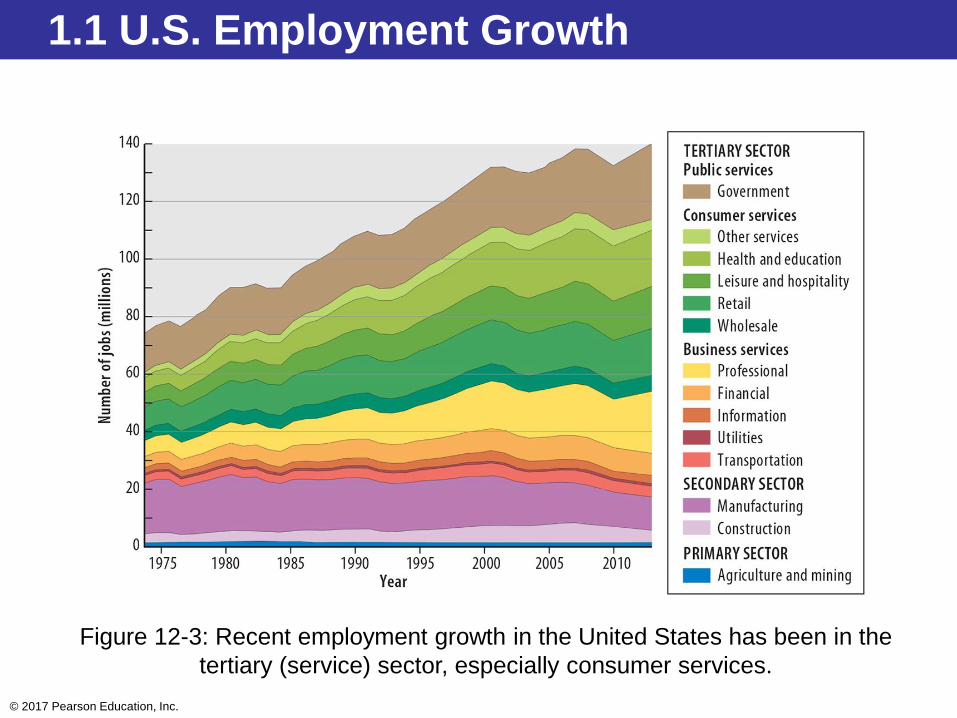
1.1 U.S. Employment Growth
Figure 12-3: Recent employment growth in the United States has been in the
tertiary (service) sector, especially consumer services.

© 2017 Pearson Education, Inc.
2.1 Central Place Theory
2.2 Hierarchy of Consumer Services
2.3 Market Area Analysis
2.4 Periodic Markets
Key Issue 2: Where Are Consumer Services
Distributed?
© 2017 Pearson Education, Inc.
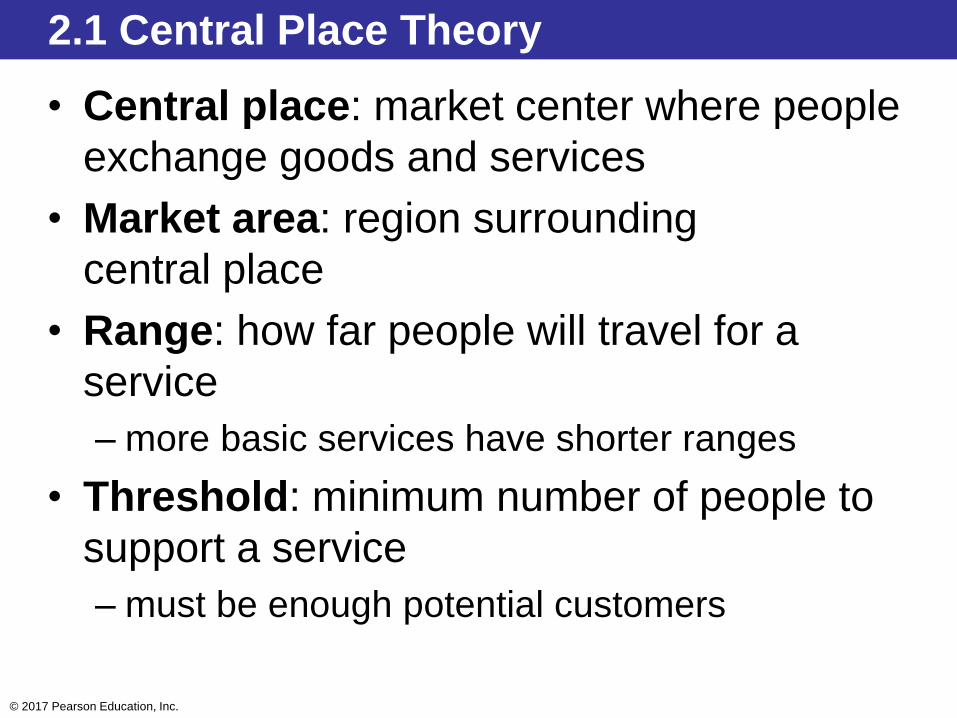
2.1 Central Place Theory
• Central place: market center where people
exchange goods and services
• Market area: region surrounding
central place
• Range: how far people will travel for a
service
– more basic services have shorter ranges
• Threshold: minimum number of people to
support a service
– must be enough potential customers

© 2017 Pearson Education, Inc.
2.1 Market Areas as Hexagons
Figure 12-4: Hexagons approximate a circle without leaving gaps, so are
used to symbolize market areas in central place theory.

© 2017 Pearson Education, Inc.
2.1 Daily Urban Systems
Figure 12-5: Daily urban systems regions represent functional ties, which
can be considered market areas for some services.
© 2017 Pearson Education, Inc.
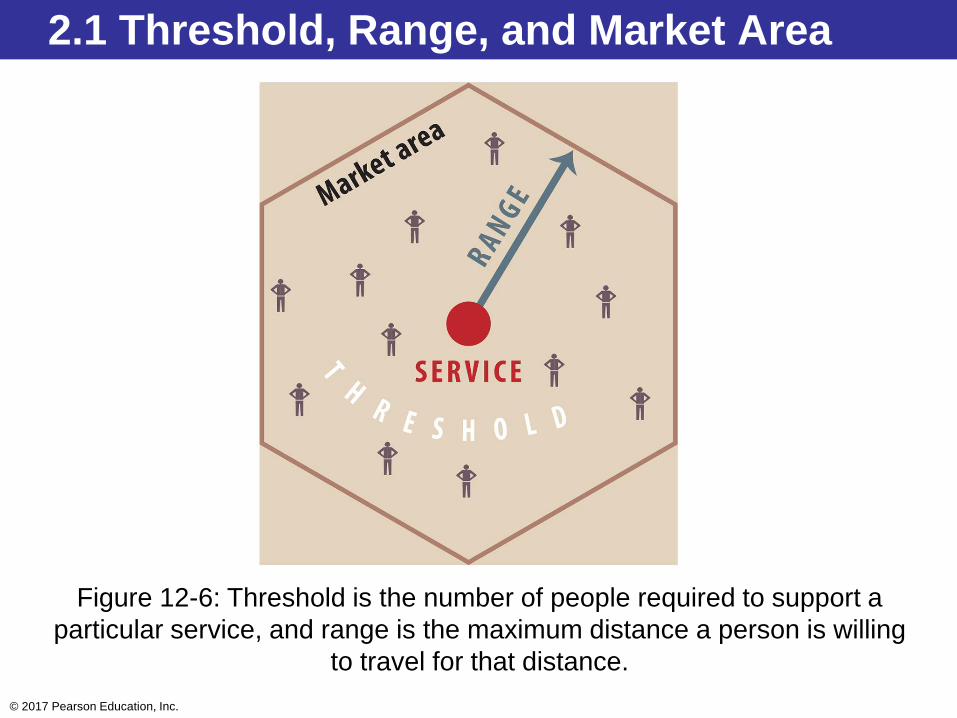
Figure 12-6: Threshold is the number of people required to support a
particular service, and range is the maximum distance a person is willing
to travel for that distance.
2.1 Threshold, Range, and Market Area
© 2017 Pearson Education, Inc.
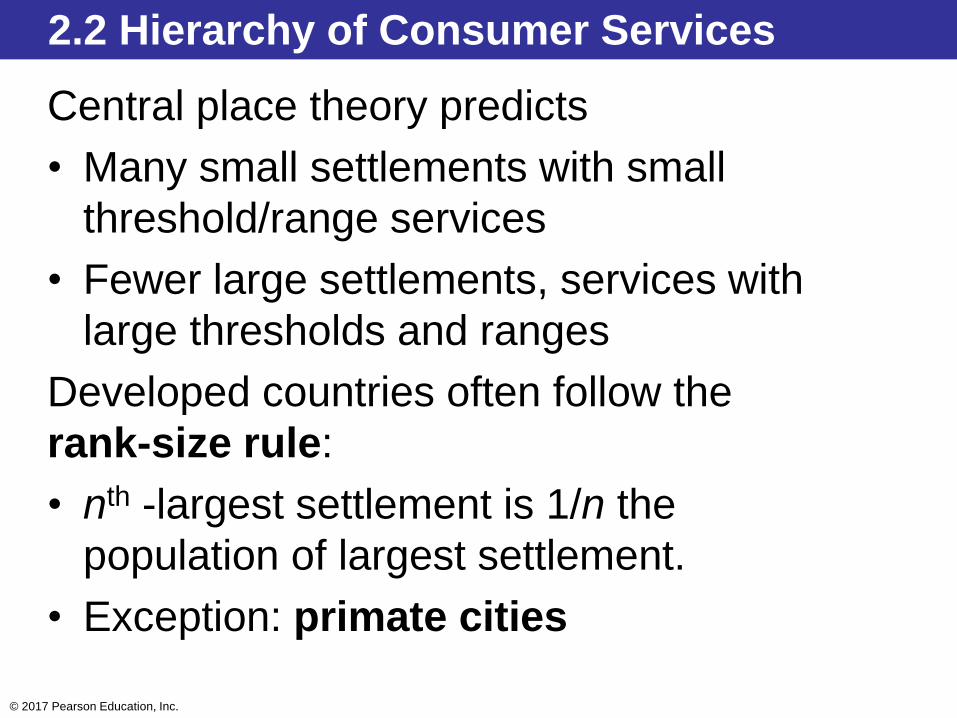
2.2 Hierarchy of Consumer Services
Central place theory predicts
• Many small settlements with small
threshold/range services
• Fewer large settlements, services with
large thresholds and ranges
Developed countries often follow the
rank-size rule:
• nth -largest settlement is 1/n the
population of largest settlement.
• Exception: primate cities
© 2017 Pearson Education, Inc.
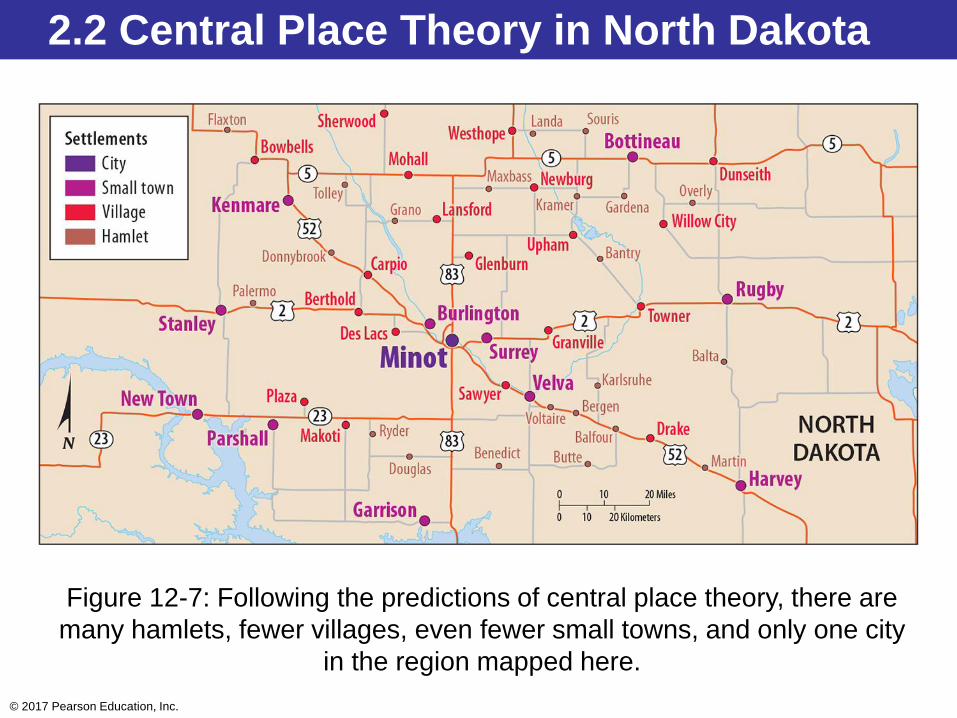
Figure 12-7: Following the predictions of central place theory, there are
many hamlets, fewer villages, even fewer small towns, and only one city
in the region mapped here.
2.2 Central Place Theory in North Dakota

© 2017 Pearson Education, Inc.
Figure 12-9: An abstract model of central place theory shows the market
areas of small settlements are nested within the market areas of larger
settlements, and so on.
2.2 Central Place Theory in North Dakota

© 2017 Pearson Education, Inc.
Figure 12-10: Rank-size rule predicts the 10th largest city should have
about 1/10th the population of the largest city. This is observed in the
United States, but not as closely in Mexico.
2.2 Rank-size Distribution of Settlements

© 2017 Pearson Education, Inc.
Benefits
• Lower prices
• Employment to low-skill
workers
• Locations often in areas
with few other options
2.3 Debate It!: Walmart and Settlements
Harms
• Wages too low for workers
to prosper
• Imported products hurt
American industry.
• Locally owned shops forced
out of business
Figures 12-13 and 12-14: Walmart provides jobs, but its business practices are
controversial.

© 2017 Pearson Education, Inc.
Figure 12-15: Supermarkets tend to be located near high-income
neighborhoods. Food deserts are defined as areas with low-income residents
and poor access to groceries.
2.3 Market Area Analysis: Food Deserts

© 2017 Pearson Education, Inc.
Figures 12-16 and 12-17: Periodic markets allow small settlements to
have access to more services a few days per week or month, like in
Ethiopia (left). Merchants travel to another village in China for a
periodic market (right).
2.4 Periodic Markets

© 2017 Pearson Education, Inc.
Key Issue 3: Where are Business Services
Distributed?
3.1 Hierarchy of Business Services
3.2 Business Services in Developing Countries
3.3 Economic Specialization of Settlements

© 2017 Pearson Education, Inc.
3.1 Hierarchy of Business Services
Business services cluster in global cities:
• Financial institutions
• Corporate headquarters
• Law, accounting, and other professional
services
Global cities defined by combination of
factors on their importance (not just size)
• Commonly centers of large
threshold/range consumer and public
services

© 2017 Pearson Education, Inc.
3.1 Global Cities
Figure 12-20: Global cities follow a hierarchy where the most globally
influential world cities, London and New York, are ranked highest.

© 2017 Pearson Education, Inc.
3.1 Global Cities in North America
Figure 12-21: As with central place theory, there are more lower-order
global cities and few higher-order global cities.

© 2017 Pearson Education, Inc.
3.2 Business Services in Developing
Countries
Offshore financial services for:
• Taxes
• Privacy
Business-process outsourcing locations
selected for:
• Low wages
• English-speaking ability
© 2017 Pearson Education, Inc.
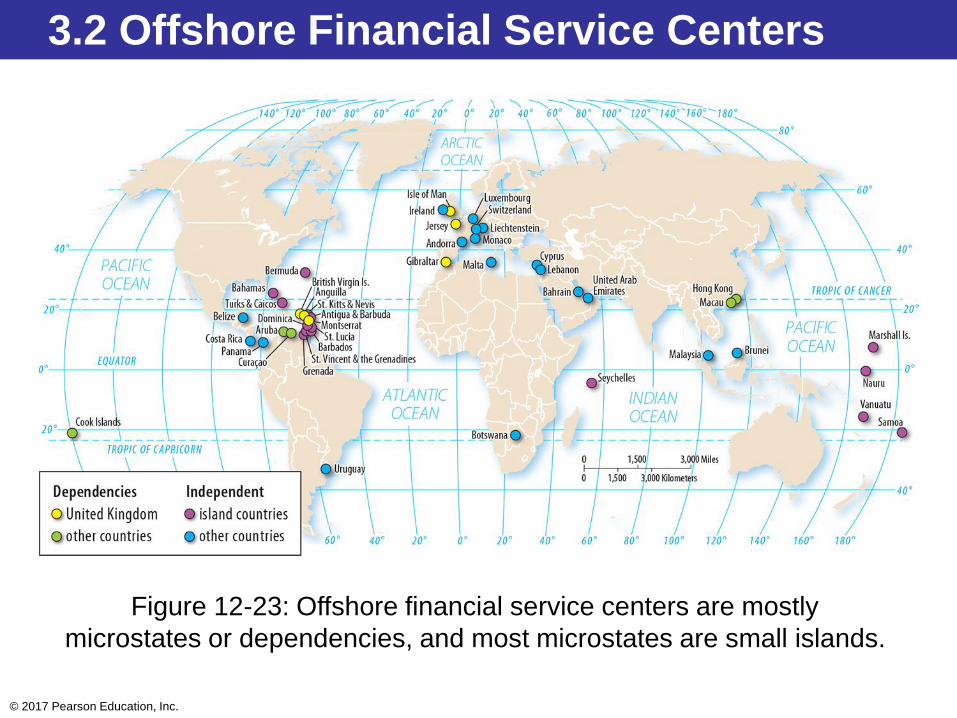
3.2 Offshore Financial Service Centers
Figure 12-23: Offshore financial service centers are mostly
microstates or dependencies, and most microstates are small islands.
© 2017 Pearson Education, Inc.
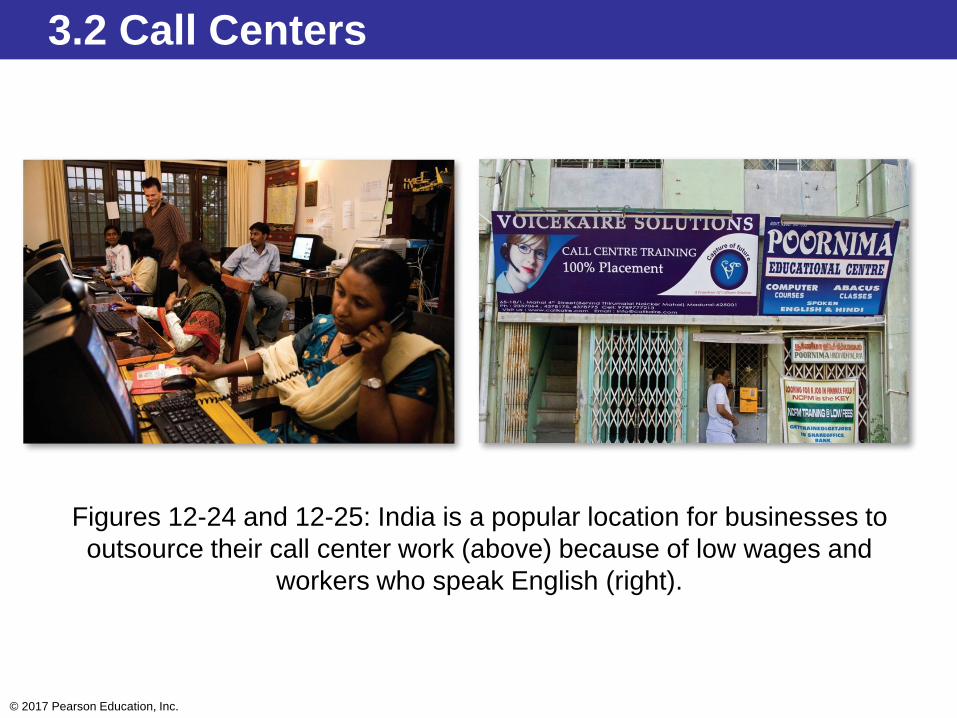
3.2 Call Centers
Figures 12-24 and 12-25: India is a popular location for businesses to
outsource their call center work (above) because of low wages and
workers who speak English (right).
© 2017 Pearson Education, Inc.
3.3 Economic Specialization of Settlements
Settlements specialize in economic activities:
• Basic business: exports outside settlement
• Nonbasic business: serves customers in
settlement
Talented workers not randomly distributed:
• Attracted to job opportunities
• Cultural factors most important

© 2017 Pearson Education, Inc.
3.3 Economic Base of U.S. Settlements
Figure 12-26: Settlements specialize in different economic activities.

© 2017 Pearson Education, Inc.
3.3 Economic Base of Boston
Figure 12-28: Boston’s economic base of biotechnology leads to
returns for other businesses.

© 2017 Pearson Education, Inc.
3.3 Scientists and Professionals in the U.S.
Figure 12-29: Scientists and professionals cluster in some
U.S. cities more than others.
© 2017 Pearson Education, Inc.
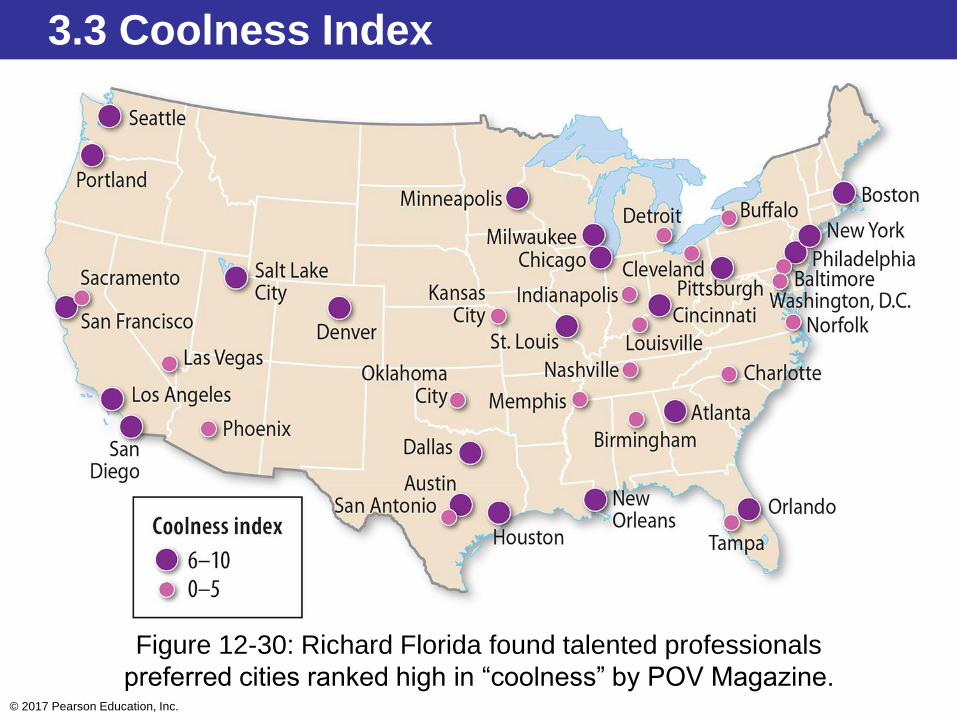
3.3 Coolness Index
Figure 12-30: Richard Florida found talented professionals
preferred cities ranked high in “coolness” by POV Magazine.

© 2017 Pearson Education, Inc.
Key Issue 4: Why Do Services Cluster in
Settlements?
4.1 Services in Rural Settlements
4.2 Services in Early Urban Settlements
4.3 Percent Urban
4.4 Size of Urban Settlements
© 2017 Pearson Education, Inc.
4.1 Services in Rural Settlements
Two types of rural settlements:
• Clustered: families live in close proximity,
fields surround settlement
– circular clustered
– linear clustered
• Dispersed: isolated farms, especially in the
United States

© 2017 Pearson Education, Inc.
4.1 Circular Rural Settlement
Figure 12-31: A small circular rural settlement in Tanzania is called a boma.

© 2017 Pearson Education, Inc.
4.1 Linear Rural Settlement
Figure 12-32: a linear rural settlement in Quebec,
which follows the French long-lot tradition

© 2017 Pearson Education, Inc.
4.1 Clustered U.S. Rural Settlement
Figure 12-33: a clustered rural settlement in Newfane, Vermont

© 2017 Pearson Education, Inc.
4.1 Dispersed U.S. Rural Settlement
Figure 12-34: an isolated farm in New Jersey
© 2017 Pearson Education, Inc.
4.2 Services in Early Urban Settlements
• Prehistoric urban settlements:
– consumer services: likely religious
– business services: trade of foods, clothing, tools
– public services: political leaders, defense
• Ancient urban settlements: trading, public,
and consumer services
– peak Roman Empire
• Medieval urban settlements
– renewed emphasis on trade and public services
© 2017 Pearson Education, Inc.
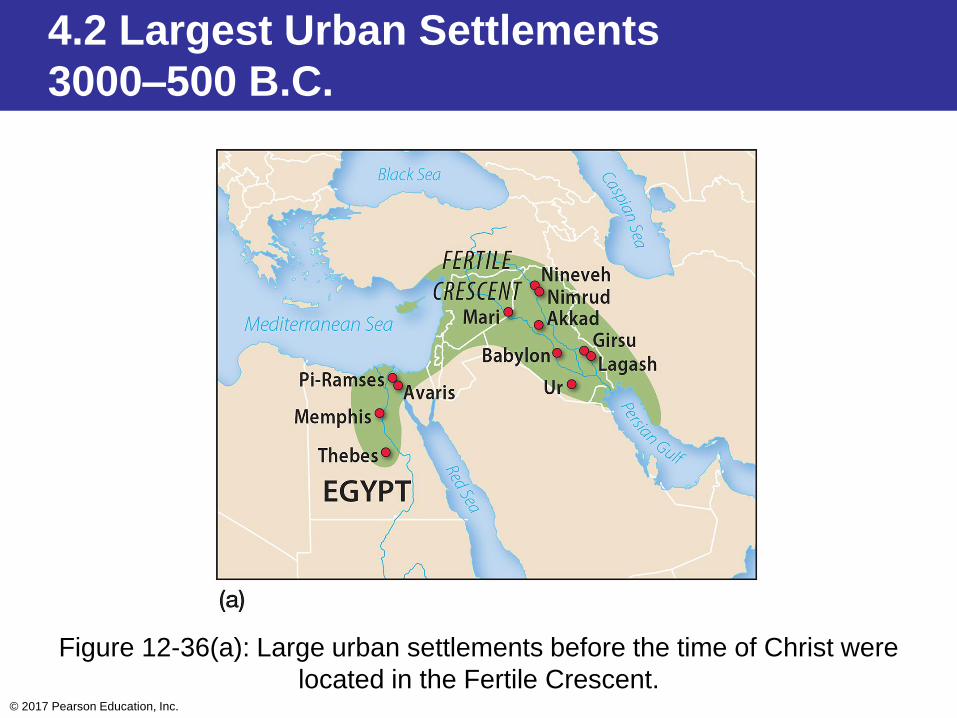
4.2 Largest Urban Settlements
3000–500 B.C.
Figure 12-36(a): Large urban settlements before the time of Christ were
located in the Fertile Crescent.

© 2017 Pearson Education, Inc.
4.2 Largest Urban Settlements
500 B.C.–A.D. 1800
Figure 12-36(b)
© 2017 Pearson Education, Inc.
4.3 Percent Urban
• Urbanization has two dimensions:
– number of people living in urban settlements
– percentage of population living in urban
settlements
• Urban settlements differ from rural:
– large size
– high density
– social heterogeneity
• Percent urban has increased and continues

© 2017 Pearson Education, Inc.
4.3 Percent Urban by Country
Figure 12-40: The world is on average more than half urbanized; developed
countries are generally more urbanized than developing countries.

© 2017 Pearson Education, Inc.
4.3 Urbanization Trends
Figure 12-41: Urbanization has increased in both
developed and developing countries.
© 2017 Pearson Education, Inc.
4.4 Size of Urban Settlements
• Urban settlements growing larger
• More of world’s largest cities in developing
countries
• Fastest-growing urban settlements in
developing countries
© 2017 Pearson Education, Inc.
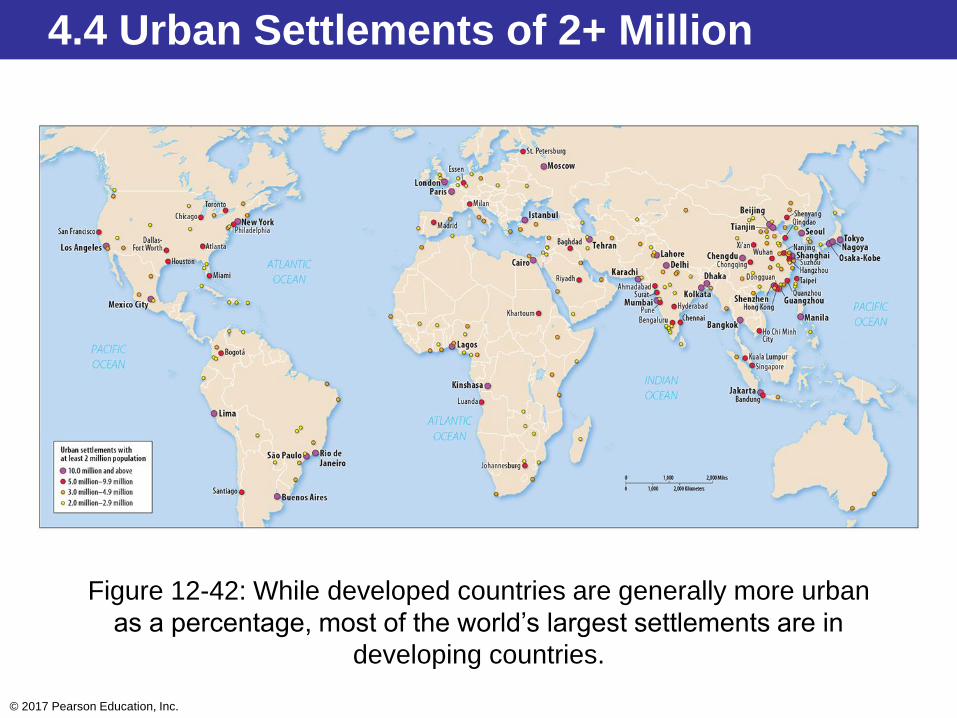
4.4 Urban Settlements of 2+ Million
Figure 12-42: While developed countries are generally more urban
as a percentage, most of the world’s largest settlements are in
developing countries.

© 2017 Pearson Education, Inc.
4.4 World’s 100 Fastest Growing Cities
Figure 12-43: Nearly all are in developing countries.

© 2017 Pearson Education, Inc.
4.4 World’s Largest City: Tokyo
Figure 12-44: Toyko-Yokohama has about 38 million inhabitants.

© 2017 Pearson Education, Inc.
Chapter End