Chapter 12: Part D Prescription Drug Coverage in Patients ... · 2016 USRDS ANNUAL DATA REPORT |...
14
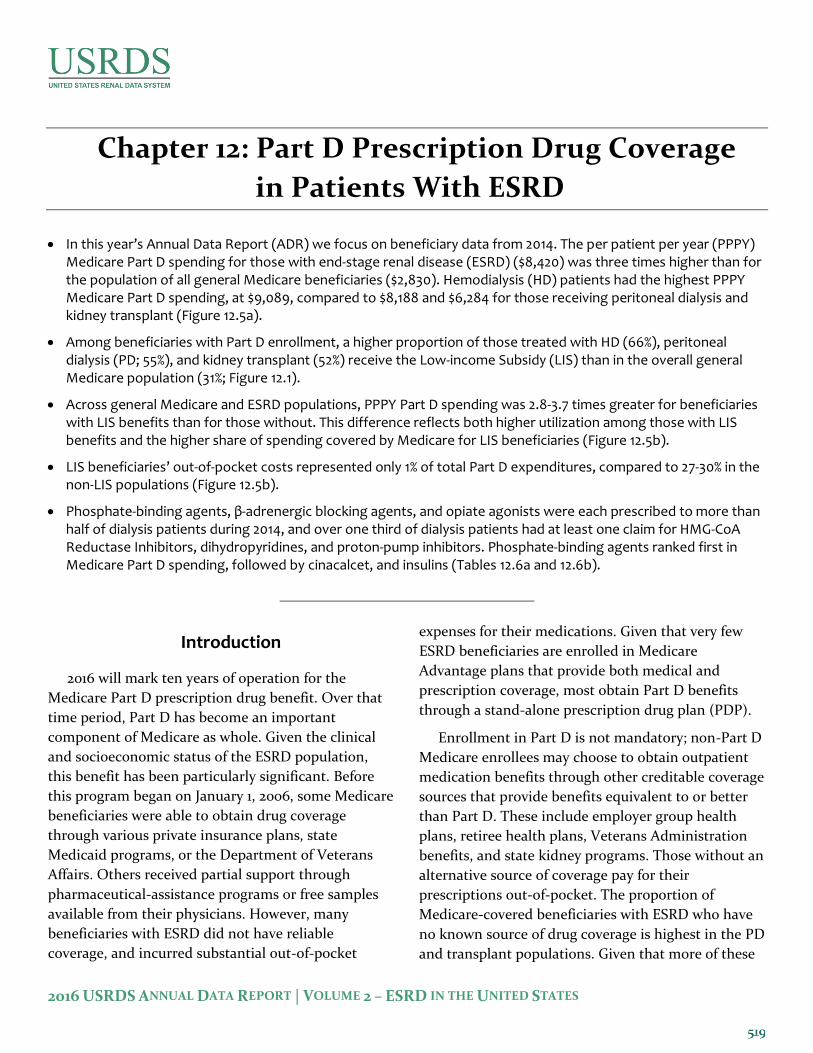
2016 USRDS ANNUAL DATA REPORT | VOLUME 2 – ESRD IN THE UNITED STATES Chapter 12: Part D Prescription Drug Coverage in Patients With ESRD In this year’s Annual Data Report (ADR) we focus on beneficiary data from 2014. The per patient per year (PPPY) Medicare Part D spending for those with end-stage renal disease (ESRD) ($8,420) was three times higher than for the population of all general Medicare beneficiaries ($2,830). Hemodialysis (HD) patients had the highest PPPY Medicare Part D spending, at $9,089, compared to $8,188 and $6,284 for those receiving peritoneal dialysis and kidney transplant (Figure 12.5a). Among beneficiaries with Part D enrollment, a higher proportion of those treated with HD (66%), peritoneal dialysis (PD; 55%), and kidney transplant (52%) receive the Low-income Subsidy (LIS) than in the overall general Medicare population (31%; Figure 12.1). Across general Medicare and ESRD populations, PPPY Part D spending was 2.8-3.7 times greater for beneficiaries with LIS benefits than for those without. This difference reflects both higher utilization among those with LIS benefits and the higher share of spending covered by Medicare for LIS beneficiaries (Figure 12.5b). LIS beneficiaries’ out-of-pocket costs represented only 1% of total Part D expenditures, compared to 27-30% in the non-LIS populations (Figure 12.5b). Phosphate-binding agents, β-adrenergic blocking agents, and opiate agonists were each prescribed to more than half of dialysis patients during 2014, and over one third of dialysis patients had at least one claim for HMG-CoA Reductase Inhibitors, dihydropyridines, and proton-pump inhibitors. Phosphate-binding agents ranked first in Medicare Part D spending, followed by cinacalcet, and insulins (Tables 12.6a and 12.6b). Introduction 2016 will mark ten years of operation for the Medicare Part D prescription drug benefit. Over that time period, Part D has become an important component of Medicare as whole. Given the clinical and socioeconomic status of the ESRD population, this benefit has been particularly significant. Before this program began on January 1, 2006, some Medicare beneficiaries were able to obtain drug coverage through various private insurance plans, state Medicaid programs, or the Department of Veterans Affairs. Others received partial support through pharmaceutical-assistance programs or free samples available from their physicians. However, many beneficiaries with ESRD did not have reliable coverage, and incurred substantial out-of-pocket expenses for their medications. Given that very few ESRD beneficiaries are enrolled in Medicare Advantage plans that provide both medical and prescription coverage, most obtain Part D benefits through a stand-alone prescription drug plan (PDP). Enrollment in Part D is not mandatory; non-Part D Medicare enrollees may choose to obtain outpatient medication benefits through other creditable coverage sources that provide benefits equivalent to or better than Part D. These include employer group health plans, retiree health plans, Veterans Administration benefits, and state kidney programs. Those without an alternative source of coverage pay for their prescriptions out-of-pocket. The proportion of Medicare-covered beneficiaries with ESRD who have no known source of drug coverage is highest in the PD and transplant populations. Given that more of these
Transcript of Chapter 12: Part D Prescription Drug Coverage in Patients ... · 2016 USRDS ANNUAL DATA REPORT |...
2016 USRDS ANNUAL DATA REPORT | VOLUME 2 – ESRD IN THE UNITED STATES
Chapter 12: Part D Prescription Drug Coverage
in Patients With ESRD
In this year’s Annual Data Report (ADR) we focus on beneficiary data from 2014. The per patient per year (PPPY)Medicare Part D spending for those with end-stage renal disease (ESRD) ($8,420) was three times higher than forthe population of all general Medicare beneficiaries ($2,830). Hemodialysis (HD) patients had the highest PPPYMedicare Part D spending, at $9,089, compared to $8,188 and $6,284 for those receiving peritoneal dialysis andkidney transplant (Figure 12.5a).
Among beneficiaries with Part D enrollment, a higher proportion of those treated with HD (66%), peritonealdialysis (PD; 55%), and kidney transplant (52%) receive the Low-income Subsidy (LIS) than in the overall generalMedicare population (31%; Figure 12.1).
Across general Medicare and ESRD populations, PPPY Part D spending was 2.8-3.7 times greater for beneficiarieswith LIS benefits than for those without. This difference reflects both higher utilization among those with LISbenefits and the higher share of spending covered by Medicare for LIS beneficiaries (Figure 12.5b).
LIS beneficiaries’ out-of-pocket costs represented only 1% of total Part D expenditures, compared to 27-30% in thenon-LIS populations (Figure 12.5b).
Phosphate-binding agents, β-adrenergic blocking agents, and opiate agonists were each prescribed to more thanhalf of dialysis patients during 2014, and over one third of dialysis patients had at least one claim for HMG-CoAReductase Inhibitors, dihydropyridines, and proton-pump inhibitors. Phosphate-binding agents ranked first inMedicare Part D spending, followed by cinacalcet, and insulins (Tables 12.6a and 12.6b).
Introduction
2016 will mark ten years of operation for the
Medicare Part D prescription drug benefit. Over that
time period, Part D has become an important
component of Medicare as whole. Given the clinical
and socioeconomic status of the ESRD population,
this benefit has been particularly significant. Before
this program began on January 1, 2006, some Medicare
beneficiaries were able to obtain drug coverage
through various private insurance plans, state
Medicaid programs, or the Department of Veterans
Affairs. Others received partial support through
pharmaceutical-assistance programs or free samples
available from their physicians. However, many
beneficiaries with ESRD did not have reliable
coverage, and incurred substantial out-of-pocket
expenses for their medications. Given that very few
ESRD beneficiaries are enrolled in Medicare
Advantage plans that provide both medical and
prescription coverage, most obtain Part D benefits
through a stand-alone prescription drug plan (PDP).
Enrollment in Part D is not mandatory; non-Part D
Medicare enrollees may choose to obtain outpatient
medication benefits through other creditable coverage
sources that provide benefits equivalent to or better
than Part D. These include employer group health
plans, retiree health plans, Veterans Administration
benefits, and state kidney programs. Those without an
alternative source of coverage pay for their
prescriptions out-of-pocket. The proportion of
Medicare-covered beneficiaries with ESRD who have
no known source of drug coverage is highest in the PD
and transplant populations. Given that more of these

2016 USRDS ANNUAL DATA REPORT | VOLUME 2 – ESRD IN THE UNITED STATES patients are employed (relative to HD patients), it is
likely that some have sources of prescription drug
coverage not currently tracked by Medicare.
Beneficiaries dually-enrolled in Medicare and
Medicaid are automatically eligible for Part D under
the Low-income Subsidy (LIS) benefit. Non-Medicaid
eligible beneficiaries can also qualify for the LIS based
on limited assets and income. The LIS provides full or
partial waivers for many out-of-pocket cost-sharing
requirements, including premiums, deductibles, and
copayments, and provides full or partial coverage
during the coverage gap (“donut hole”). The LIS also
provides assistance for the premiums, deductibles,
and co-payments of the Medicare Part D program.
Some Medicare enrollees are automatically deemed
eligible for LIS and do not need to file an application
(referred to as “deemed LIS beneficiaries”). Such
beneficiaries include persons dually eligible for both
Medicaid and Medicare, those receiving supplemental
security income, and those participating in Medicare
savings programs (e.g., Qualified Medicare
Beneficiaries (QMB) and Qualified Individuals (QI)).
Other Medicare beneficiaries with limited incomes
and resources who do not automatically qualify for LIS
(non-deemed beneficiaries) can apply for the LIS and
have their eligibility determined by their state
Medicaid agency or the Social Security
Administration.
In 2014, 62% of Medicare-covered beneficiaries
with ESRD enrolled in Part D received the LIS benefit,
compared to 31% of the general Medicare Part D
population. By modality, 66%, 55%, and 52% of
enrolled HD, PD, and transplant patients qualified for
the LIS. By race, White dialysis patients were the least
likely to qualify for LIS benefits.
Phosphate-removing agents comprise the most
common Part D medication class taken by dialysis
patients (by percentage of beneficiaries with at least
one prescription filled), while cardiovascular agents
(β-adrenergic blocking agents, HMG-CoA reductase
inhibitors, and dihydropyridines) account for three of
the top five. The list of medications by total Medicare
Part D spending1 is topped by phosphate-removing
agents and and cinacalcet.
In 2014, total estimated Medicare Part D
expenditures for ESRD and general Medicare Part D
enrollees were $2.7 billion and $58.1 billion. Between
2011 and 2014, total Part D spending increased by 63%
and 91% for HD and PD patients, compared to 26% for
general Medicare beneficiaries; for transplant patients,
total Part D spending rose by 63%. In 2014, regardless
of LIS status, Medicare Part D spending for HD, PD,
and transplant patients averaged $9,089, $8,188, and
$6,284 PPPY, compared to only $2,830 for general
Medicare beneficiaries. Out-of-pocket Part D costs for
beneficiaries with ESRD were slightly higher than for
general Medicare beneficiaries, at $441 versus $423.
The Medicare Part D program functions in concert
with Medicare Part B. Part B covers medications
administered in physician offices, including some of
those administered during hemodialysis (e.g.
intravenous antibiotics that are not associated with
dialysis-related infections), and most
immunosuppressant medications required following a
kidney transplant. Immunosuppression coverage
continues as long as the transplant recipient
maintains Medicare eligibility. Entitlement may end
three years post-transplant or be continued due to
disability or age. Beneficiaries whose kidney
transplant is not covered by Medicare, but who
become Medicare-eligible due to age or disability can
enroll in and receive their immunosuppressant
medications through Part D. Prescription drugs not
covered for beneficiaries under Part B may be covered
by Part D, depending upon whether the drug is
included on the plan formulary. Until January 2011,
costs of erythropoietin stimulating agents, IV vitamin
D, iron, and antibiotic agents administered during
dialysis were separately reimbursable under Medicare
Part B. Since 2011, coverage for these products has
been included in the monthly bundled payment to
dialysis providers. Part B costs are thus not displayed
1 In this chapter, Medicare Part D spending represents the sum
of the Medicare covered amount and the Low- income Subsidy amount.
520

CHAPTER 12: PART D PRESCRIPTION DRUG COVERAGE IN PATIENTS WITH ESRD
in chapter figures, as they have been in previous
ADRs.
Part D Coverage Plans
CMS provides participating prescription drug plans
(PDPs) with guidance on structuring a ‘‘standard’’ Part
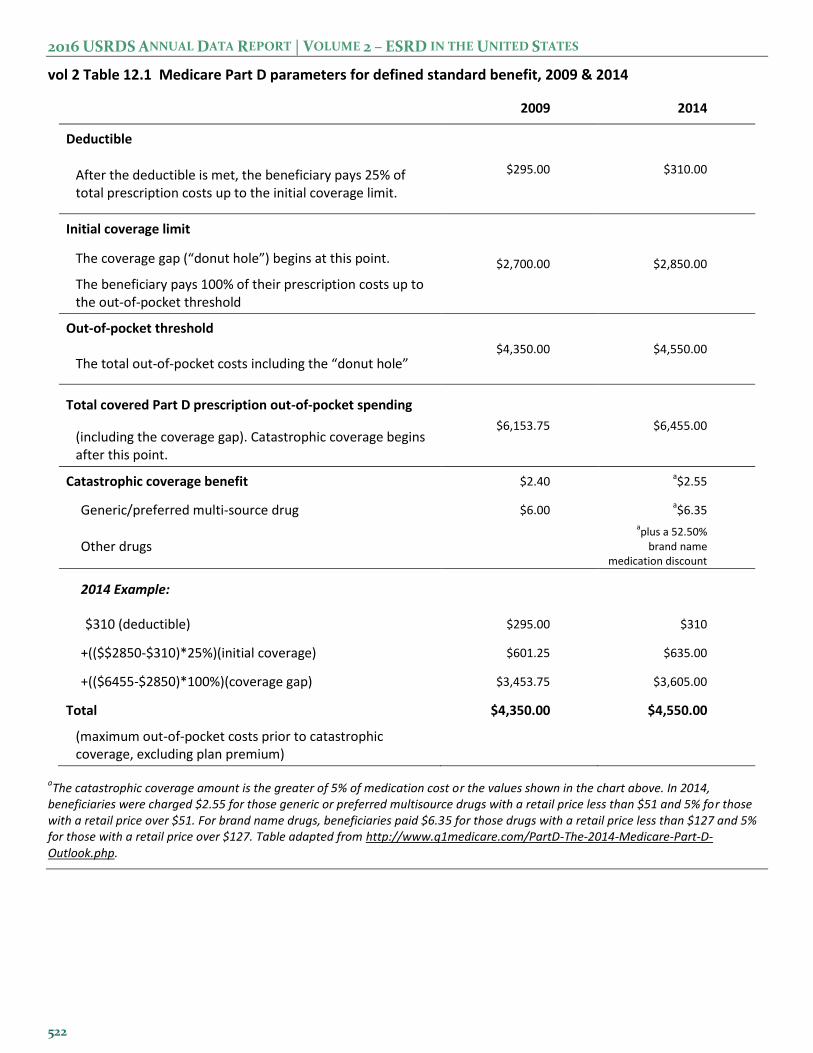
D PDP. The upper portion of Table 12.1 illustrates the
standard benefit design for PDPs in 2009 and 2014. In
2014, for example, beneficiaries shared costs with the
PDP through co-insurance or copayments until the
combined total during the initial coverage period
reached $2,850. After reaching this threshold,
beneficiaries entered a coverage gap, or “donut hole,”
where they were then required to pay 100% of their
prescription costs.
In each year since 2010, the U.S. government has
been providing increasing assistance to those reaching
this coverage gap. In 2014, beneficiaries received a
52.5% discount on brand name medications from drug
manufacturers, and Part D plans paid 28% of generic
drug costs for those in the gap (Q1 Medicare, 2014).
Beneficiaries who reached annual out-of-pocket drug
costs of $4,550 entered the catastrophic coverage
phase, in which they then paid only a small
copayment for any additional prescriptions until the
end of that year (Table 12.1).
PDPs have the latitude to structure their plans
differently from the example presented, but
companies offering non-standard plans must
demonstrate that their coverage is at least actuarially
equivalent to the standard plan. Many have developed
plans featuring no deductibles, or with drug
copayments instead of the 25% co-insurance, and
some plans provide generic and/or brand name drug
coverage during the coverage gap (Table 12.1; Q1
Medicare, 2014).
2016 USRDS ANNUAL DATA REPORT | VOLUME 2 – ESRD IN THE UNITED STATES
vol 2 Table 12.1 Medicare Part D parameters for defined standard benefit, 2009 & 2014
2009 2014
Deductible
$295.00 $310.00 After the deductible is met, the beneficiary pays 25% of total prescription costs up to the initial coverage limit.
Initial coverage limit
$2,700.00 $2,850.00 The coverage gap (“donut hole”) begins at this point.
The beneficiary pays 100% of their prescription costs up to the out-of-pocket threshold
Out-of-pocket threshold
$4,350.00 $4,550.00 The total out-of-pocket costs including the “donut hole”
Total covered Part D prescription out-of-pocket spending
$6,153.75 $6,455.00 (including the coverage gap). Catastrophic coverage begins after this point.
Catastrophic coverage benefit $2.40 a$2.55
Generic/preferred multi-source drug $6.00 a$6.35
Other drugs
aplus a 52.50%
brand name medication discount
2014 Example:
$310 (deductible) $295.00 $310
+(($$2850-$310)*25%)(initial coverage) $601.25 $635.00
+(($6455-$2850)*100%)(coverage gap) $3,453.75 $3,605.00
Total $4,350.00 $4,550.00
(maximum out-of-pocket costs prior to catastrophic coverage, excluding plan premium)
aThe catastrophic coverage amount is the greater of 5% of medication cost or the values shown in the chart above. In 2014,
beneficiaries were charged $2.55 for those generic or preferred multisource drugs with a retail price less than $51 and 5% for those with a retail price over $51. For brand name drugs, beneficiaries paid $6.35 for those drugs with a retail price less than $127 and 5% for those with a retail price over $127. Table adapted from http://www.q1medicare.com/PartD-The-2014-Medicare-Part-D-Outlook.php.
522
CHAPTER 12: PART D PRESCRIPTION DRUG COVERAGE IN PATIENTS WITH ESRD
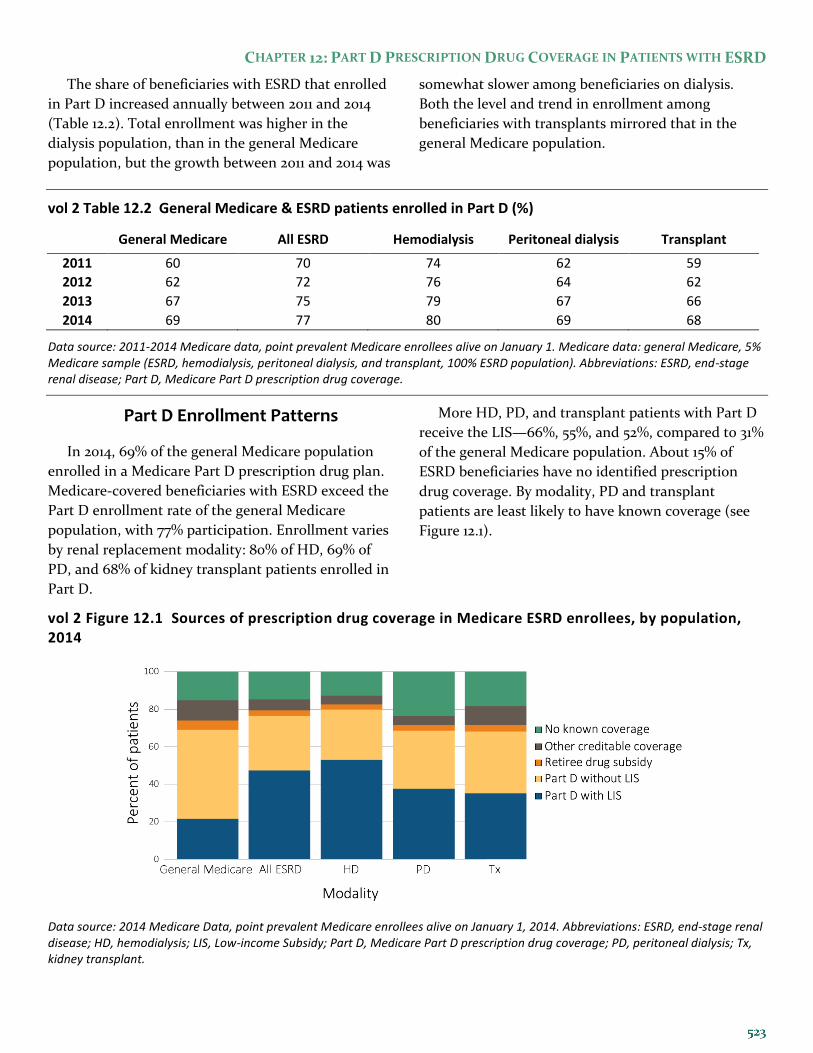
The share of beneficiaries with ESRD that enrolled
in Part D increased annually between 2011 and 2014
(Table 12.2). Total enrollment was higher in the
dialysis population, than in the general Medicare
population, but the growth between 2011 and 2014 was
somewhat slower among beneficiaries on dialysis.
Both the level and trend in enrollment among
beneficiaries with transplants mirrored that in the
general Medicare population.
vol 2 Table 12.2 General Medicare & ESRD patients enrolled in Part D (%)
General Medicare All ESRD Hemodialysis Peritoneal dialysis Transplant
2011 60 70 74 62 59
2012 62 72 76 64 62
2013 67 75 79 67 66
2014 69 77 80 69 68
Data source: 2011-2014 Medicare data, point prevalent Medicare enrollees alive on January 1. Medicare data: general Medicare, 5% Medicare sample (ESRD, hemodialysis, peritoneal dialysis, and transplant, 100% ESRD population). Abbreviations: ESRD, end-stage renal disease; Part D, Medicare Part D prescription drug coverage.
Part D Enrollment Patterns
In 2014, 69% of the general Medicare population
enrolled in a Medicare Part D prescription drug plan.
Medicare-covered beneficiaries with ESRD exceed the
Part D enrollment rate of the general Medicare
population, with 77% participation. Enrollment varies
by renal replacement modality: 80% of HD, 69% of
PD, and 68% of kidney transplant patients enrolled in
Part D.
More HD, PD, and transplant patients with Part D
receive the LIS—66%, 55%, and 52%, compared to 31%
of the general Medicare population. About 15% of
ESRD beneficiaries have no identified prescription
drug coverage. By modality, PD and transplant
patients are least likely to have known coverage (see
Figure 12.1).
vol 2 Figure 12.1 Sources of prescription drug coverage in Medicare ESRD enrollees, by population, 2014
Data source: 2014 Medicare Data, point prevalent Medicare enrollees alive on January 1, 2014. Abbreviations: ESRD, end-stage renal disease; HD, hemodialysis; LIS, Low-income Subsidy; Part D, Medicare Part D prescription drug coverage; PD, peritoneal dialysis; Tx, kidney transplant.
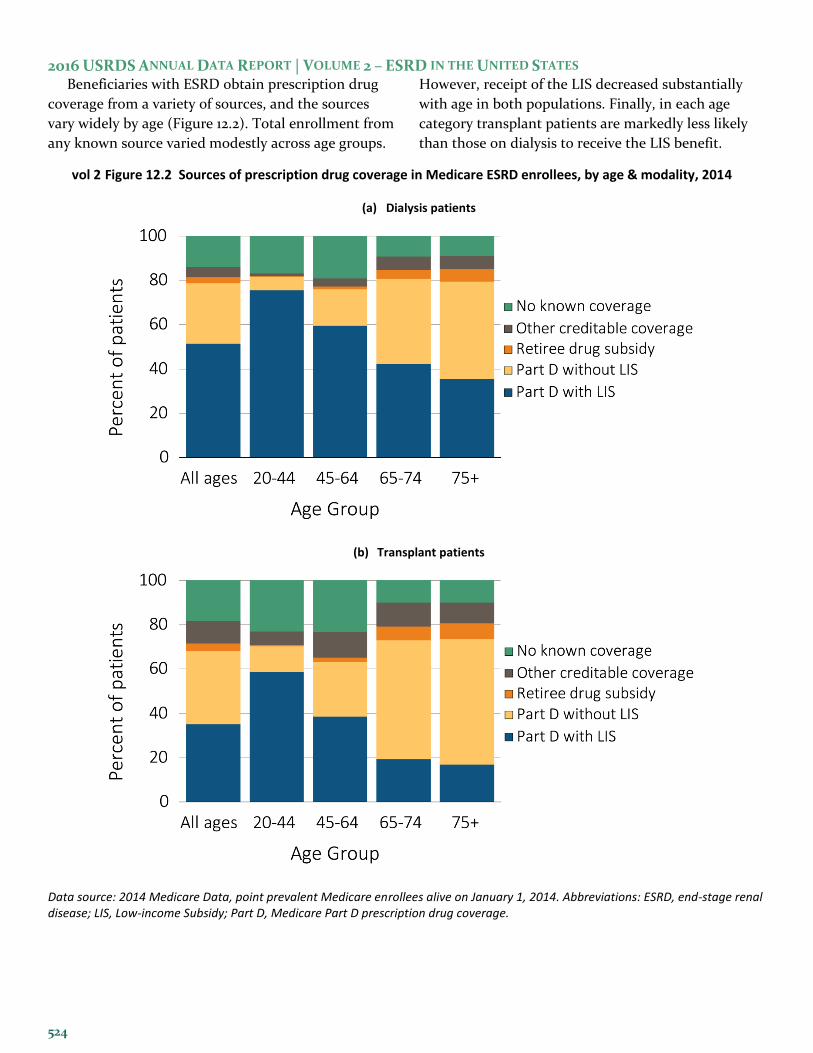
2016 USRDS ANNUAL DATA REPORT | VOLUME 2 – ESRD IN THE UNITED STATES Beneficiaries with ESRD obtain prescription drug
coverage from a variety of sources, and the sources
vary widely by age (Figure 12.2). Total enrollment from
any known source varied modestly across age groups.
However, receipt of the LIS decreased substantially
with age in both populations. Finally, in each age
category transplant patients are markedly less likely
than those on dialysis to receive the LIS benefit.
vol 2 Figure 12.2 Sources of prescription drug coverage in Medicare ESRD enrollees, by age & modality, 2014
(a) Dialysis patients
(b) Transplant patients
Data source: 2014 Medicare Data, point prevalent Medicare enrollees alive on January 1, 2014. Abbreviations: ESRD, end-stage renal disease; LIS, Low-income Subsidy; Part D, Medicare Part D prescription drug coverage.
524

CHAPTER 12: PART D PRESCRIPTION DRUG COVERAGE IN PATIENTS WITH ESRD
Overall, approximately 79% of dialysis patients were
enrolled in Part D. A higher percentage of dialysis
patients who identified as Black/African American
enrolled in Part D (82%) compared to those who
identified as White (77%) or Asian (77%; Figure 12.3a).
Seventy-six percent of Blacks and 71% of Asians with
Part D coverage qualified for the LIS benefit,
compared to 58% of Whites; Blacks were the least
likely to have no known prescription drug coverage.
Sixty-eight percent of transplant patients enrolled in
Part D. By race, 67% of Whites, 74% of Blacks, and
70% of Asian transplant patients enrolled. A larger
share of Black (65%) and Asian (59%) transplant
patients with Part D coverage have the LIS, compared
to 46% of White transplant patients (Figure 12.3b).
vol 2 Figure 12.3 Sources of prescription drug coverage in Medicare ESRD enrollees, by race/ethnicity & modality, 2014
(a) Dialysis patients
(b) Transplant patients
Data source: 2014 Medicare Data, point prevalent Medicare enrollees alive on January 1, 2014. Abbreviations: Blk/Af Am, Black or African American; ESRD, end-stage renal disease; LIS, Low-income Subsidy; Part D, Medicare Part D prescription drug coverage.
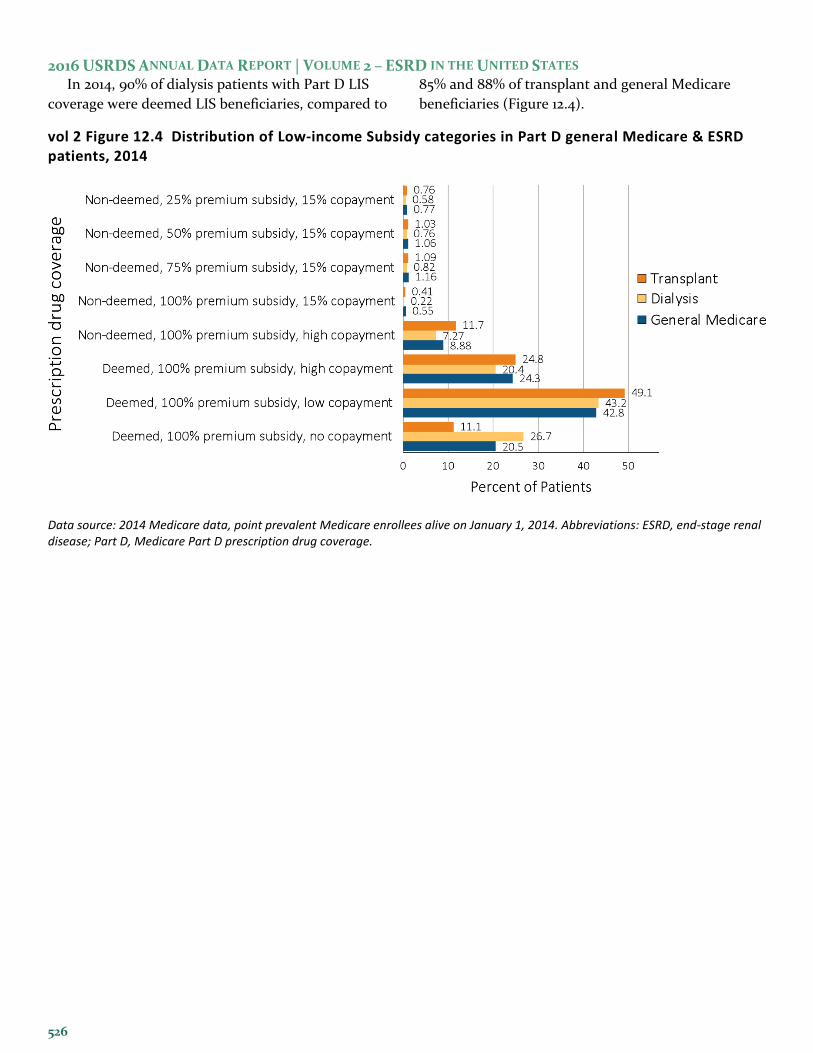
2016 USRDS ANNUAL DATA REPORT | VOLUME 2 – ESRD IN THE UNITED STATES In 2014, 90% of dialysis patients with Part D LIS
coverage were deemed LIS beneficiaries, compared to
85% and 88% of transplant and general Medicare
beneficiaries (Figure 12.4).
vol 2 Figure 12.4 Distribution of Low-income Subsidy categories in Part D general Medicare & ESRD patients, 2014
Data source: 2014 Medicare data, point prevalent Medicare enrollees alive on January 1, 2014. Abbreviations: ESRD, end-stage renal disease; Part D, Medicare Part D prescription drug coverage.
526

CHAPTER 12: PART D PRESCRIPTION DRUG COVERAGE IN PATIENTS WITH ESRD
Within each racial category, the share of general
Medicare beneficiaries who receive the LIS decreases
with age but increases among those aged 75 and older
(see Table 12.3). This increase in receipt of the LIS
among the oldest beneficiaries is not seen in the ESRD
population, except among Asians (note that samples
of Asian patients by age category are relatively small).
vol 2 Table 12.3 Medicare Part D enrollees (%) with the Low-income Subsidy, by age & race, 2014
General
Medicare All ESRD Hemodialysis
Peritoneal dialysis
Transplant
White
All ages 24.7 54.4 58.8 48.1 46.4
20-44 88.2 88.1 91.6 88.3 82.3
45-64 51.7 70.3 76.1 64.4 57.1
65-74 14.7 39.7 48.6 24.7 21.3
75+ 19.0 34.1 37.5 17.5 18.0
Black/African American
All ages 57.9 74.4 76.3 71.2 64.9
20-44 92.8 92.3 94.3 90.3 85.9
45-64 74.5 80.4 82.8 74.6 69.2
65-74 42.2 59.5 63.7 40.6 40.3
75+ 49.7 59.5 61.2 36.1 39.1
Asian
All ages 64.1 68.7 73.2 57.1 58.8
20-44 89.8 87.0 89.5 83.7 83.1
45-64 65.4 73.5 78.3 58.9 66.0
65-74 55.5 58.3 65.2 40.6 45.3
75+ 71.3 66.9 70.7 54.0 41.2
Other race
All ages 37.8 78.6 85.3 78.8 62.2
20-44 88.5 91.2 95.9 96.5 76.4
45-64 56.3 83.2 89.0 82.8 67.9
65-74 25.9 67.9 77.2 54.0 48.8
75+ 38.1 66.5 75.0 37.5 40.4
Data source: 2014 Medicare data, point prevalent Medicare enrollees alive on January 1, 2014. Abbreviations: ESRD, end-stage renal disease; LIS, Low-income Subsidy; Part D, Medicare Part D prescription drug coverage.

2016 USRDS ANNUAL DATA REPORT | VOLUME 2 – ESRD IN THE UNITED STATES
Spending Under Stand-alone Part D Plans
In recent years, total Part D spending for
beneficiaries with ESRD increased by 65%, from $1.64
billion in 2011 to $2.71 billion in 2014 (Table 12.4).
These amounts do not include costs of medications
subsumed under the ESRD prospective payment
system (e.g. ESAs, IV vitamin D, and iron) or billed to
Medicare Part B (e.g. immunosuppressants). Between
2011 and 2014, total estimated Part D spending
increased by 63%, 91%, and 63% for HD, PD, and
kidney transplant patients. These rates of increase far
outpaced the 26% spending growth that occurred in
the general Medicare population.
vol 2 Table 12.4 Total estimated Medicare Part D spending for enrollees, in billions, 2011-2014
General Medicare All ESRD Hemodialysis Peritoneal dialysis Transplant
2011 45.96 1.64 1.29 0.09 0.21
2012 40.08 2.00 1.59 0.12 0.23
2013 52.08 2.27 1.79 0.14 0.27
2014 58.07 2.71 2.10 0.17 0.35
Data source: 2011-2014 Medicare data, period prevalent Medicare enrollees alive on January 1, excluding those in Medicare Advantage Part D plans and Medicare secondary payer, using as-treated model (see ESRD Methods chapter for analytical methods). Part D spending represents the sum of the Medicare covered amount and the Low- income Subsidy amount.
By ESRD modality, HD patients had the highest
PPPY Medicare Part D spending at $9,089, compared
to $8,188 for those with PD and $6,284 for transplant
patients. PPPY Part D spending was three times
greater for beneficiaries with ESRD ($8,420) than for
general Medicare beneficiaries ($2,830). As a
proportion of total costs, however, out-of-pocket costs
were lower for beneficiaries with ESRD, representing
4%, 7%, and 8% percent of PPPY costs for HD, PD,
and transplant patients, compared to 13% in the
general Medicare population (Figure 12.5a). A higher
proportion of beneficiaries with ESRD received the LIS
relative to the general Medicare population, which
substantially reduced out-of-pocket obligations.
Across general Medicare and ESRD populations,
PPPY Part D spending was 2.8-3.7 times greater for
beneficiaries with LIS benefits than for those without.
In the LIS population, however, out-of-pocket costs
represented only 1% of total expenditures, compared
to 27-30% among general Medicare and ESRD
populations that did not receive the subsidy. PPPY
Part D spending was 2.1 and 2.3 times greater for
beneficiaries with ESRD than for general Medicare
beneficiaries in the LIS and non-LIS populations
(Figure 12.5b).
528

CHAPTER 12: PART D PRESCRIPTION DRUG COVERAGE IN PATIENTS WITH ESRD
vol 2 Figure 12.5 Per person per year Medicare Part D spending & out-of-pocket costs for enrollees, 2014
(c) All Part D enrollees
(d) Part D enrollees by Low-income Subsidy status
Data source: 2014 Medicare data, period prevalent Medicare enrollees alive on January 1, 2014, excluding those in Medicare Advantage Part D plans and Medicare secondary payer, using as-treated model (see ESRD Methods chapter for analytical methods). Part D spending represents the sum of the Medicare covered amount and the Low- income Subsidy amount.
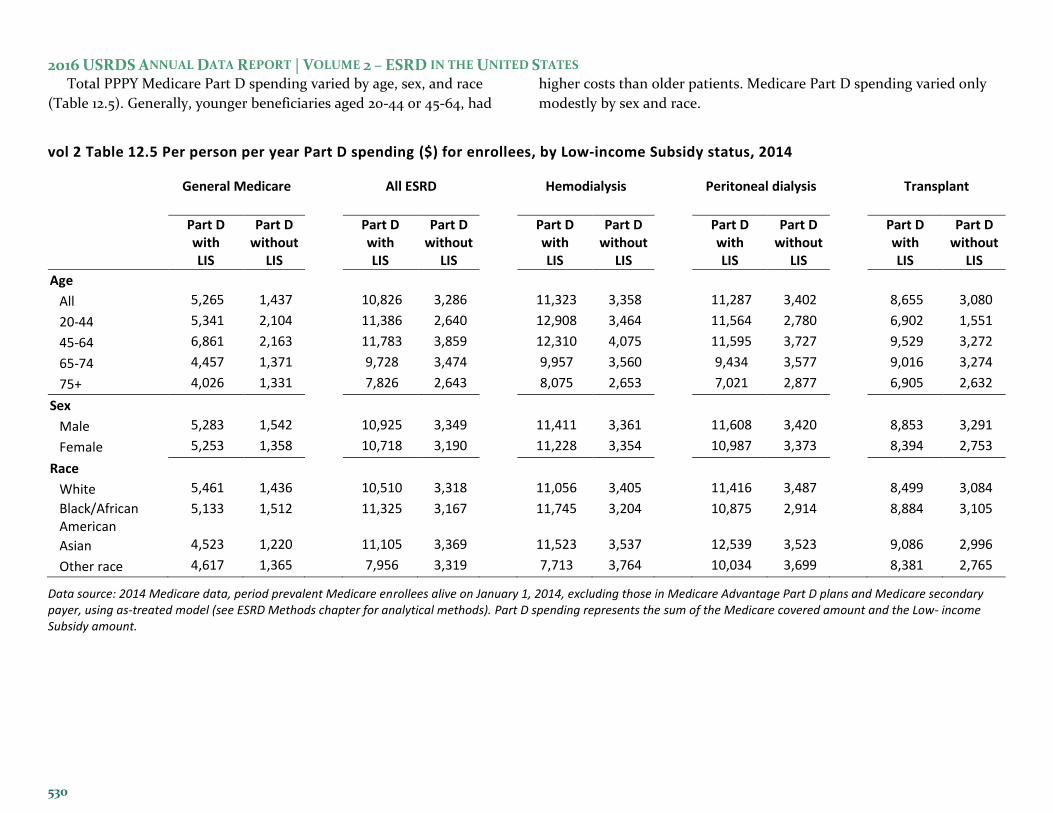
2016 USRDS ANNUAL DATA REPORT | VOLUME 2 – ESRD IN THE UNITED STATES Total PPPY Medicare Part D spending varied by age, sex, and race
(Table 12.5). Generally, younger beneficiaries aged 20-44 or 45-64, had
higher costs than older patients. Medicare Part D spending varied only
modestly by sex and race.
vol 2 Table 12.5 Per person per year Part D spending ($) for enrollees, by Low-income Subsidy status, 2014
General Medicare All ESRD Hemodialysis Peritoneal dialysis Transplant
Part D with LIS
Part D without
LIS
Part D with LIS
Part D without
LIS
Part D with LIS
Part D without
LIS
Part D with LIS
Part D without
LIS
Part D with LIS
Part D without
LIS
Age
All 5,265 1,437 10,826 3,286 11,323 3,358 11,287 3,402 8,655 3,080
20-44 5,341 2,104 11,386 2,640 12,908 3,464 11,564 2,780 6,902 1,551
45-64 6,861 2,163 11,783 3,859 12,310 4,075 11,595 3,727 9,529 3,272
65-74 4,457 1,371 9,728 3,474 9,957 3,560 9,434 3,577 9,016 3,274
75+ 4,026 1,331 7,826 2,643 8,075 2,653 7,021 2,877 6,905 2,632
Sex
Male 5,283 1,542 10,925 3,349 11,411 3,361 11,608 3,420 8,853 3,291
Female 5,253 1,358 10,718 3,190 11,228 3,354 10,987 3,373 8,394 2,753
Race
White 5,461 1,436 10,510 3,318 11,056 3,405 11,416 3,487 8,499 3,084
Black/African American
5,133 1,512 11,325 3,167 11,745 3,204 10,875 2,914 8,884 3,105
Asian 4,523 1,220 11,105 3,369 11,523 3,537 12,539 3,523 9,086 2,996
Other race 4,617 1,365 7,956 3,319 7,713 3,764 10,034 3,699 8,381 2,765
Data source: 2014 Medicare data, period prevalent Medicare enrollees alive on January 1, 2014, excluding those in Medicare Advantage Part D plans and Medicare secondary payer, using as-treated model (see ESRD Methods chapter for analytical methods). Part D spending represents the sum of the Medicare covered amount and the Low- income Subsidy amount.
530
CHAPTER 12: PART D PRESCRIPTION DRUG COVERAGE IN PATIENTS WITH ESRD
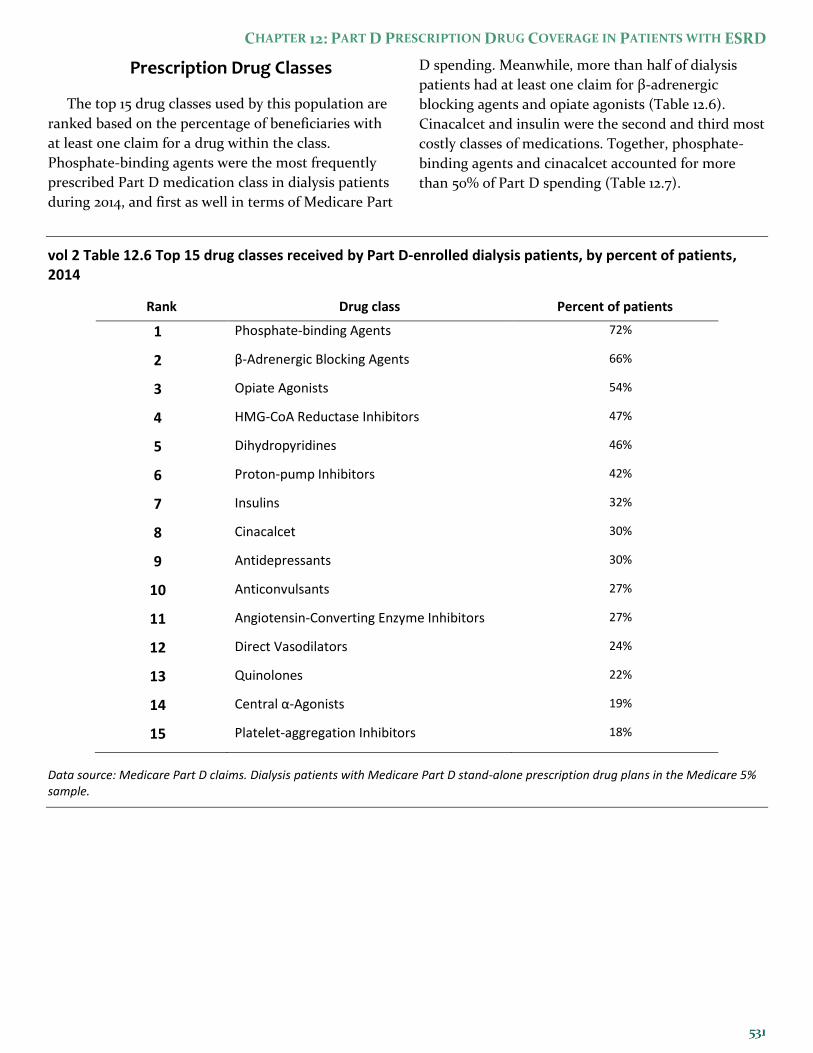
Prescription Drug Classes
The top 15 drug classes used by this population are
ranked based on the percentage of beneficiaries with
at least one claim for a drug within the class.
Phosphate-binding agents were the most frequently
prescribed Part D medication class in dialysis patients
during 2014, and first as well in terms of Medicare Part
D spending. Meanwhile, more than half of dialysis
patients had at least one claim for β-adrenergic
blocking agents and opiate agonists (Table 12.6).
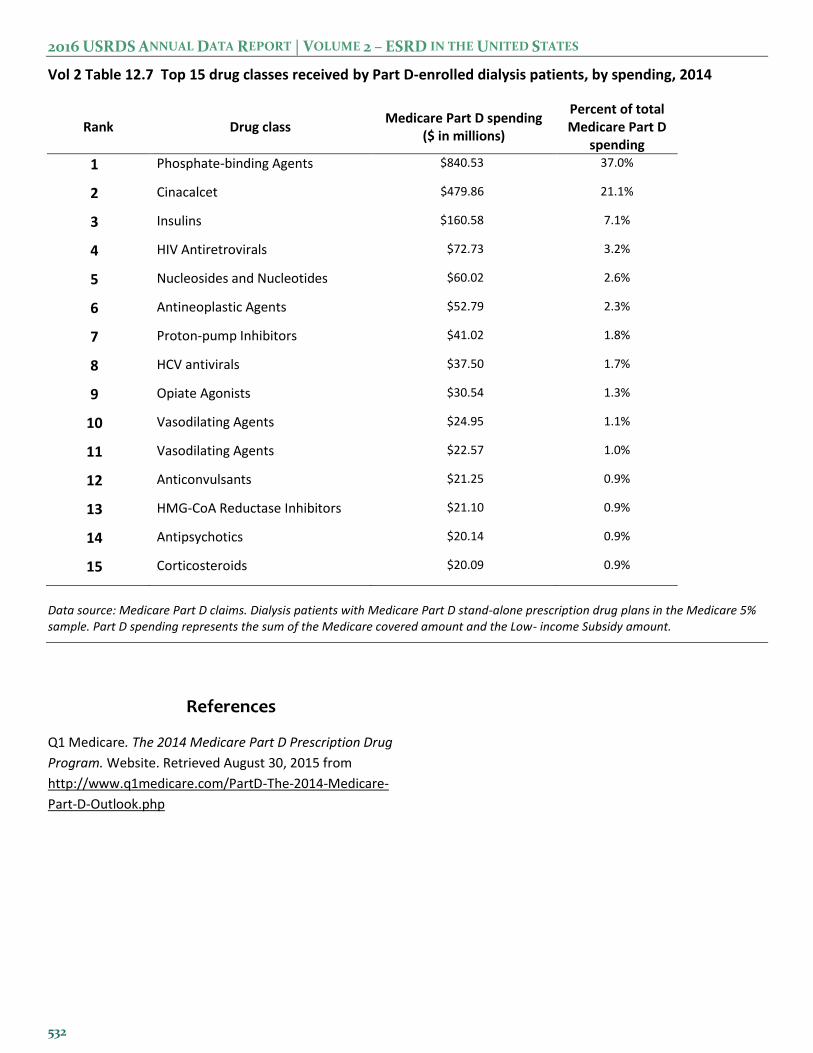
Cinacalcet and insulin were the second and third most
costly classes of medications. Together, phosphate-
binding agents and cinacalcet accounted for more
than 50% of Part D spending (Table 12.7).
vol 2 Table 12.6 Top 15 drug classes received by Part D-enrolled dialysis patients, by percent of patients, 2014
Rank Drug class Percent of patients
1 Phosphate-binding Agents 72%
2 β-Adrenergic Blocking Agents 66%
3 Opiate Agonists 54%
4 HMG-CoA Reductase Inhibitors 47%
5 Dihydropyridines 46%
6 Proton-pump Inhibitors 42%
7 Insulins 32%
8 Cinacalcet 30%
9 Antidepressants 30%
10 Anticonvulsants 27%
11 Angiotensin-Converting Enzyme Inhibitors 27%
12 Direct Vasodilators 24%
13 Quinolones 22%
14 Central α-Agonists 19%
15 Platelet-aggregation Inhibitors 18%
Data source: Medicare Part D claims. Dialysis patients with Medicare Part D stand-alone prescription drug plans in the Medicare 5% sample.
2016 USRDS ANNUAL DATA REPORT | VOLUME 2 – ESRD IN THE UNITED STATES
Vol 2 Table 12.7 Top 15 drug classes received by Part D-enrolled dialysis patients, by spending, 2014
Rank Drug class Medicare Part D spending
($ in millions)
Percent of total Medicare Part D
spending
1 Phosphate-binding Agents $840.53 37.0%
2 Cinacalcet $479.86 21.1%
3 Insulins $160.58 7.1%
4 HIV Antiretrovirals $72.73 3.2%
5 Nucleosides and Nucleotides $60.02 2.6%
6 Antineoplastic Agents $52.79 2.3%
7 Proton-pump Inhibitors $41.02 1.8%
8 HCV antivirals $37.50 1.7%
9 Opiate Agonists $30.54 1.3%
10 Vasodilating Agents $24.95 1.1%
11 Vasodilating Agents $22.57 1.0%
12 Anticonvulsants $21.25 0.9%
13 HMG-CoA Reductase Inhibitors $21.10 0.9%
14 Antipsychotics $20.14 0.9%
15 Corticosteroids $20.09 0.9%
Data source: Medicare Part D claims. Dialysis patients with Medicare Part D stand-alone prescription drug plans in the Medicare 5% sample. Part D spending represents the sum of the Medicare covered amount and the Low- income Subsidy amount.
References
Q1 Medicare. The 2014 Medicare Part D Prescription Drug
Program. Website. Retrieved August 30, 2015 from
http://www.q1medicare.com/PartD-The-2014-Medicare-
Part-D-Outlook.php
532