Section 3.1 Scatterplots & Correlation Mrs. Daniel AP Statistics.
Upload
leo-griffinCategory
view
219download
1
Chapter 11
Correlation
Pt 1: Nov. 6, 2014
Correlation
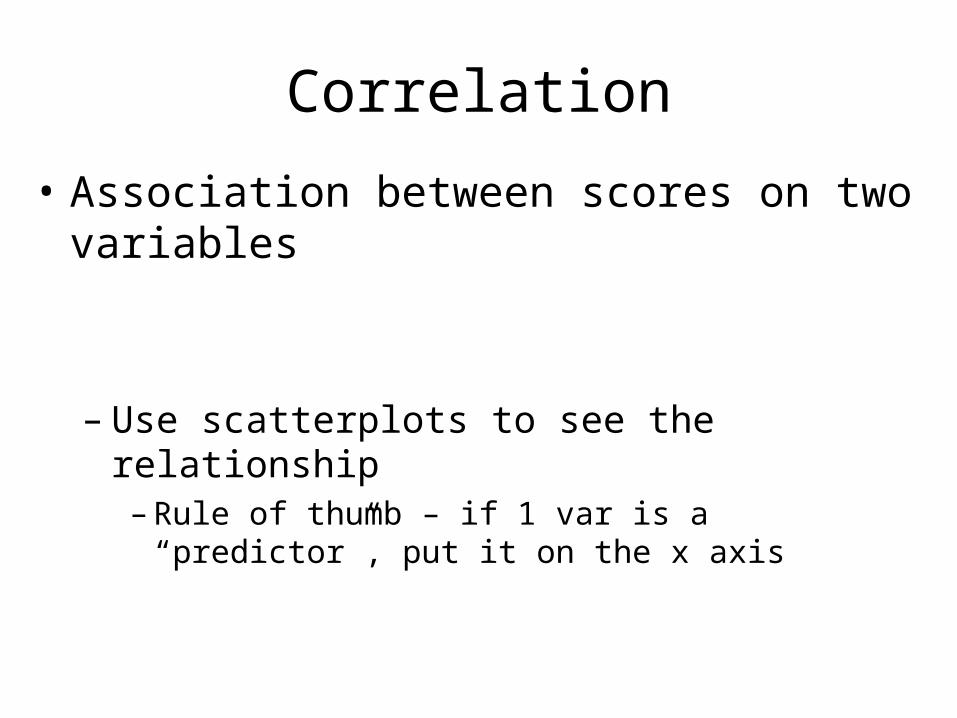
• Association between scores on two variables
– Use scatterplots to see the relationship– Rule of thumb – if 1 var is a “predictor”, put it on the x
axis

Patterns of Correlation
• Linear correlation – straight line relationship (appropriate to compute corr)
• Curvilinear correlation – U or S shaped curves• No correlation – no trend to points in scatterplot
• Positive correlation – points move from lower left to upper right (pos slope)
• Negative correlation – points move from upper left to lower right (neg slope)

Degree of Linear CorrelationThe Correlation Coefficient
• Figure correlation using products of deviation scores• Multiply pos x pos get positive results• Multiply negative x negative get positive results, which we want• Multiply pos x neg get negative results
1) Find means of x variable (Mx) and y variable (My)2) Find deviation scores for each person for x variable (x-Mx)
and y variable (y-My)3) Sum these up across the sample4) divide by sqrt of (SSx)(SSy)
– where SSx=sum of squared deviations for x variable and SSy=sum of squared deviations for y variable

• Formula for the correlation coefficient:
r = Σ [(x – Mx)(y – My)]sqrt [(SSx)(SSy)]
where SSx = Σ (x-Mx)2
where SSy = Σ (y-My)2
• Positive perfect correlation: r = +1• No correlation: r = 0• Negative perfect correlation: r = –1
• Example on board…

Correlation and Causality
• Three possible directions of causality:
1. X Y
2. X Y
3. Z
X Y
Can only determine causality w/longitudinal study or a true experiment (w/random assignment) to rule out 3rd
variables (z)
Examples of 3rd variable explainingthe correlation between x & y?

Issues in Interpreting the Correlation Coefficient
• Statistical significance – for correlation, test is whether true corr in pop = 0.– If corr is statistically signif, means it is highly unlikely
that we’d get this corr if true pop corr = 0.
• Restriction in range– With limited range, corr is different than what it would
be with full range (more variability)– Ex) Correlate job perf with hiring test score – may
have range restriction

Size of r: Cohen’s Guidelines
• What is a large corr?– Cohen’s guidelines:
• > .5 or -.5 = large, .3 or -.3 = moderate, .1 or -.1 = small
• Unusual to have corr above .5 or -.5• Consider average r = .19 for job satisfaction & job
perf…– Interpretation?

Correlation in Research Articles• Scatter diagrams occasionally shown• Correlation matrix presented in table. Notice only lower triangle completed &
corr of variable w/itself represented with dash.– In text: “The correlation between acculturation and assimilation was significant (r = .56, p
< .05).