Chapter 11 - 14 Measurement of Molar Mass
20
Measurement of Molar Mass Chapter 11 - 14
Transcript of Chapter 11 - 14 Measurement of Molar Mass

Measurement of Molar Mass
Chapter 11 - 14
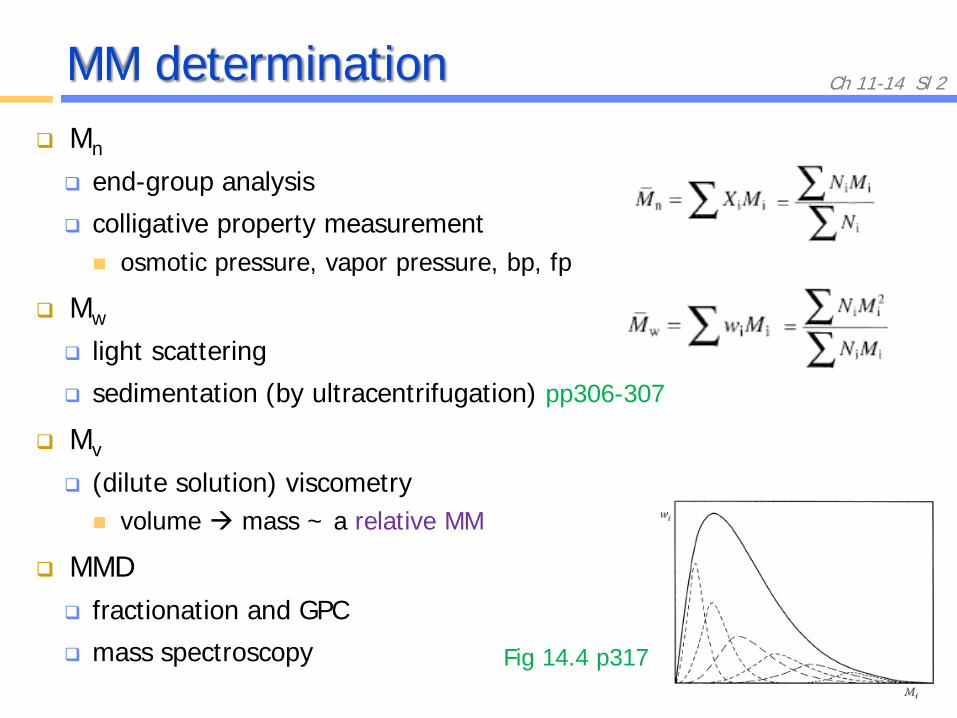
Ch 11-14 Sl 2MM determination Mn
end-group analysis
colligative property measurement osmotic pressure, vapor pressure, bp, fp
Mw
light scattering
sedimentation (by ultracentrifugation) pp306-307
Mv
(dilute solution) viscometry volume mass ~ a relative MM
MMD fractionation and GPC
mass spectroscopy Fig 14.4 p317

Ch 11-14 Sl 3End-group analysis
step polymers
-OH, -COOH, -NH2, ---
titration or spectroscopic methods
chain polymers
RMMMM----- (R=initiator fragment)
spectroscopic methods
accurate but limited
small conc’n of end-group
for Mn < 15000
pp278-279

Ch 11-14 Sl 4Colligative property measurements
colligative (collective) property property that depends only on the number of molecules
osmotic pressure, boiling point, freezing point, etc
counting number & measuring weight Mn
chemical potential in solution, µ partial molar free energy
∆G1 = µ1 – µ1o = RT ln a1 = RT ln γ1n1
For dilute polymer solution (c2 0)
solvent behaves ideally, a1 ≈ n1
µ1 – µ1o = RT ln n1 = RT ln (1 – n2)
= –RT[n2 + n22/2 + n2
3/3 + -----]
a: activityγ: activity coeff.n: mol fractionc: wt conc’n

Ch 11-14 Sl 5
n2 = m2/(m1+m2) ≈ m2/m1 = (m2/L)/(m1/L) = (c2/M2)/(1/V1
0) [(g/L)/(g/mol)]/[(1/(L/mol)]= (c2V1
0)/M2
µ1 – µ1o = –RT[n2 + n2
2/2 + n23/3 + ----]
= –RTV10[(1/M2)c2 + (V1
0/2M22)c2
2 + (V102/3M2
3)c23 --]
–(µ1 – µ1o)/V1
0 = RT [(1/M2) c2 + A2 c22 + A3 c2
3 + ----]
a virial equation A2 ~ 2nd virial coeff, A3 ~ 3rd virial coeff
for dilute polymer soln, c2 0
colligative property (CP)CP/c
c
A2RT/Mn
c: wt conc’nm: # of molesV1
0: molar volM: molar mass
[CP/c]c 0 = RT/Mn

Ch 11-14 Sl 6Membrane osmometry (MO) osmotic pressure, π
virial eqn for π
static or dynamic method
for 5E4 < Mn < 1E6 diffusion of solute; small signal (π)
pp269-275 π = ρgh
Fig 11.1 p270
<cf> also, Fig 11.2 p273

Ch 11-14 Sl 7Vapour pressure osmometry (VPO) lowering of solvent vapor pressure
the virial eqn
for Mn < 15000 small signal (∆R)
complementary to MO
pp275-277
Fig 11.4 p275

Ch 11-14 Sl 8Ebulliometry and Cryoscopy ebulliometry (bp elevation) ∆Tb/c = Ke [(1/Mn) + A2 c + A3 c2 + ----] Ke calibrated with known mol wt
foaming
cryoscopy (fp depression) ∆Tf/c = Kc [(1/Mn) + A2 c + A3 c2 + ----] Kc calibrated with known mol wt
supercooling
limited by precision of temperature measurement useful only for Mn < 5000
not used these days
pp277-278

Ch 11-14 Sl 9Light scattering (LS) light scattering static LS ~ time-averaged intensity of light measured elastic [Rayleigh] scattering ~ same freq ~ Mw
inelastic [Raman] scattering ~ bond vibration energy
dynamic LS ~ movement of particle ~ Doppler effect
LS by small gas molecule
Rayleigh Eqn
α ~ polarizability of molecule
why Mw? intensity ∝ [amplitude]2 ∝ [mass]2 ∝ [polarizability]2
pp281-283
Fig 12.1 p282

Ch 11-14 Sl 10
LS by gas (cont’d)
converting α to refractive index n (measurable)
R ~ Rayleigh ratio ~ measuring

Ch 11-14 Sl 11
LS by (dilute) solution of small molecules pp284-286
by concentration fluctuation
from fluctuation theory, π ~ osmotic pressure
K ~ optical constant (exp’t condition)

Ch 11-14 Sl 12
LS by sol’n of large molecules (D > λ/20 ≈ 20 nm) asymmetry + interference angular dependence of i
Fig 12.2 p283 Fig 12.3 p286
~ scattering factor (angular dependency of ∆R)

Ch 11-14 Sl 13
LS by polymer sol’n (cont’d)
must be dust-free
2E4 < Mw < 5E6 small intensity (iθ); cancelling
<s2> ~ mean-square radius of gyration
s
p253
‘Zimm plot’
Fig 12.3 p286

Ch 11-14 Sl 14Dilute solution viscometry (DSV) viscosity η and MM
intrinsic viscosity [η]
pp263-264
η0 ~ solvent viscosityφ2 ~ vol fraction of solutec ~ conc’n of polymer [g/L]M ~ MM of polymerVh ~ hydrodynamic volume
= vol of equiv. sphereηsp ~ specific viscosity
Einstein eqn
Vh = (4/3) π Rh3
Rh ∝ αη <s2>0½
αη ~ expansion parameterαη ∝ x∆ ∝ M∆
Flory-Fox eqn
Mark-Houwink-Sakurada eqn

Ch 11-14 Sl 15
viscosity-average MM, Mv
0.5 ≤ a ≤ 0.8
0.5 at θ-condition; often > 0.7
Mn < Mv < Mw; close to Mw
a = 1 Mv = Mw
a = –1 Mv = Mn
pp300-301

Ch 11-14 Sl 16
DSV experiment
K, a from handbook Table 13.2 p302 at the same solvent and temp
cautions Temp control < 0.01 ºC
t0 > 100 s (laminar); c < 1 g/dL (Newt)
pp299-304
Fig 13.2 p303
Fig 13.1 p301
Huggins eqn
Kraemer eqn

Ch 11-14 Sl 17Gel permeation chromatography (GPC) a size-exclusion chromatography (SEC) separation by size using porous gel
Larger molecules elute earlier.
elution volume Ve and size Fig 14.9 p323
pp318-325
Fig 14.7 p320
Fig 14.5 p319
L ~ diameter of molecule in sol’n ~ 2 Rh

Ch 11-14 Sl 18
Ve to MM
‘universal calibration curve’
Fig 14.8 p322

Ch 11-14 Sl 19
Ve to MM (cont’d) ‘universal calibration’ With the same instrument, column, and solvent, the same Ve
represents the same Vh, regardless of the polymer.
Many polymers fall on the same curve on log[η]M - Ve plot.
experiment Run GPC with sample and standards (anionic PS). standard with known MM, K, a (sample also with known K, a)
For each fraction (Ve), get M. [η]PSMPS = [η]sampleMsample
KPSMPSa(PS)+1 = KsampleMsample
a(sample)+1
Calculate Mn, Mw, and MMD.
‘fraction’ ~ M ≈ Mn ≈ Mv ≈ Mw

Ch 11-14 Sl 20Mass spectroscopy (MS) MS determines MM by detecting molecular ion, M+
in vapor phase
For polymers; non-volatile ~ ionization
fragmentation
MALDI-ToF technique a soft ionization choice of the matrix critical
still for not-too-high MM incomplete ionization, fragmentation, etc
pp331-340
Fig 14.13 p333
![. 4bm la ma - Katy ISDstaff.katyisd.org/sites/khschem/PublishingImages/Pages/documents... · Molar Mass Molar mass is the mass of ÿ'1ÿ ÿ]t}{ÿ • Other names for molar mass include:.](https://static.fdocuments.in/doc/165x107/5c3b6b0c93f3c37a8156146f/-4bm-la-ma-katy-molar-mass-molar-mass-is-the-mass-of-y1y-yty-.jpg)