Chapter 10 Solar Energy -...
24
AUSTRALIAN ENERGY RESOURCE ASSESSMENT 261 Chapter 10 Solar Energy 10.1.1 World solar energy resources and market • The world’s overall solar energy resource potential is around 5.6 gigajoules (GJ) (1.6 megawatt-hours (MWh)) per square metre per year. The highest solar resource potential is in the Red Sea area, including Egypt and Saudi Arabia. • Solar energy accounted for 0.1 per cent of world total primary energy consumption in 2007, although its use has increased significantly in recent years. • Government policies and falling investment costs and risks are projected to be the main factors underpinning future growth in world solar energy use. • The International Energy Agency (IEA) in its reference case projects the share of solar energy in total electricity generation will increase to 1.2 per cent in 2030 – 1.7 per cent in OECD countries and 0.9 per cent in non-OECD countries. 10.1.2 Australia’s solar energy resources • The annual solar radiation falling on Australia is approximately 58 million petajoules (PJ), approximately 10 000 times Australia’s annual energy consumption. • Solar energy resources are greater in the northwest and centre of Australia, in areas that do not have access to the national electricity grid. Accessing solar energy resources in these areas is likely to require investment in transmission infrastructure (figure 10.1). • There are also significant solar energy resources in areas with access to the electricity grid. The solar energy resource (annual solar radiation) in areas of flat topography within 25 km of existing transmission lines (excluding National Parks), is nearly 500 times greater than the annual energy consumption of Australia. 10.1.3 Key factors in utilising Australia’s solar resources • Solar radiation is intermittent because of daily and seasonal variations. However, the correlation between solar radiation and daytime peak electricity demand means that solar energy has the potential to provide electricity during peak demand times. • Solar thermal technologies can also operate in hybrid systems with fossil fuel power plants, and, with appropriate storage, have the potential to provide base load electricity generation. Solar thermal technologies can also potentially provide electricity to remote townships and mining centres where the cost of alternative electricity sources is high. • Photovoltaic systems are well suited to off-grid electricity generation applications, and where costs of electricity generation from other sources are high (such as in remote communities). 10.1 Summary KEY MESSAGES • Solar energy is a vast and largely untapped resource. Australia has the highest average solar radiation per square metre of any continent in the world. • Solar energy is used mainly in small direct-use applications such as water heating. It accounts for only 0.1 per cent of total primary energy consumption, in Australia as well as globally. • Solar energy use in Australia is projected to increase by 5.9 per cent per year to 24 PJ in 2029–30. • The outlook for electricity generation from solar energy depends critically on the commercialisation of large-scale solar energy technologies that will reduce investment costs and risks. • Government policy settings will continue to be an important factor in the solar energy market outlook. Research, development and demonstration by both the public and private sectors will be crucial in accelerating the development and commercialisation of solar energy in Australia, especially large-scale solar power stations.
-
Upload
duongxuyen -
Category
Documents
-
view
219 -
download
3
Transcript of Chapter 10 Solar Energy -...
AUSTRALIAN ENERGY RESOURCE ASSESSMENT
261
Chapter 10Solar Energy
10.1.1 World solar energy resources and market • Theworld’soverallsolarenergyresourcepotential
isaround5.6gigajoules(GJ)(1.6megawatt-hours(MWh))persquaremetreperyear.ThehighestsolarresourcepotentialisintheRedSeaarea,includingEgyptandSaudiArabia.
• Solarenergyaccountedfor0.1percentofworldtotalprimaryenergyconsumptionin2007,althoughitsusehasincreasedsignificantlyinrecentyears.
• Governmentpoliciesandfallinginvestment costsandrisksareprojectedtobethemainfactorsunderpinningfuturegrowthinworld solar energy use.
• TheInternationalEnergyAgency(IEA)initsreferencecaseprojectstheshareofsolarenergyintotalelectricitygenerationwillincreaseto1.2percentin2030–1.7percentinOECDcountriesand0.9percentinnon-OECDcountries.
10.1.2Australia’ssolarenergyresources• TheannualsolarradiationfallingonAustralia
isapproximately58millionpetajoules(PJ),approximately10000timesAustralia’sannualenergyconsumption.
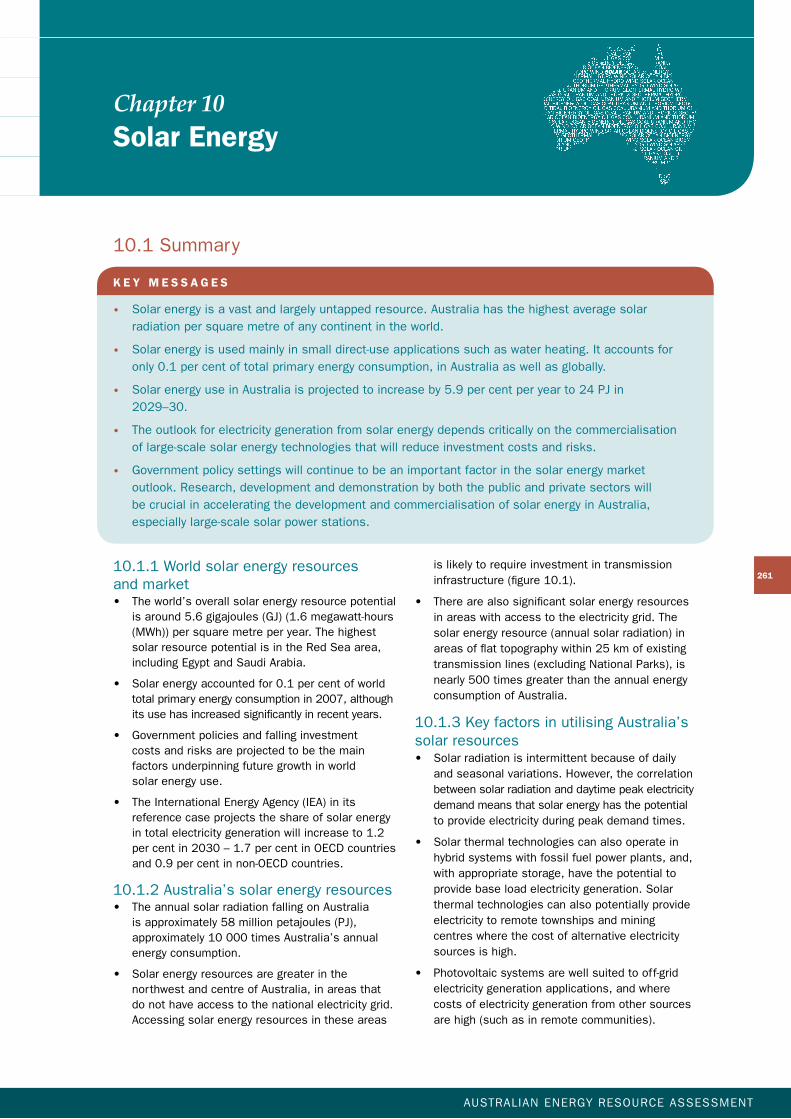
• SolarenergyresourcesaregreaterinthenorthwestandcentreofAustralia,inareasthatdonothaveaccesstothenationalelectricitygrid.Accessingsolarenergyresourcesintheseareas
islikelytorequireinvestmentintransmissioninfrastructure(figure10.1).
• Therearealsosignificantsolarenergyresourcesinareaswithaccesstotheelectricitygrid.Thesolarenergyresource(annualsolarradiation)inareasofflattopographywithin25kmofexistingtransmissionlines(excludingNationalParks),isnearly500timesgreaterthantheannualenergyconsumptionofAustralia.
10.1.3KeyfactorsinutilisingAustralia’s solar resources• Solarradiationisintermittentbecauseofdaily
andseasonalvariations.However,thecorrelationbetweensolarradiationanddaytimepeakelectricitydemandmeansthatsolarenergyhasthepotentialtoprovideelectricityduringpeakdemandtimes.
• Solarthermaltechnologiescanalsooperateinhybridsystemswithfossilfuelpowerplants,and,withappropriatestorage,havethepotentialtoprovidebaseloadelectricitygeneration.Solarthermaltechnologiescanalsopotentiallyprovideelectricitytoremotetownshipsandminingcentreswherethecostofalternativeelectricitysourcesishigh.
• Photovoltaicsystemsarewellsuitedtooff-gridelectricitygenerationapplications,andwherecostsofelectricitygenerationfromothersourcesarehigh(suchasinremotecommunities).
10.1Summary
K E y m E S S a g E S
• Solarenergyisavastandlargelyuntappedresource.Australiahasthehighestaveragesolarradiationpersquaremetreofanycontinentintheworld.
• Solarenergyisusedmainlyinsmalldirect-useapplicationssuchaswaterheating.Itaccountsforonly0.1percentoftotalprimaryenergyconsumption,inAustraliaaswellasglobally.
• SolarenergyuseinAustraliaisprojectedtoincreaseby5.9percentperyearto24PJin 2029–30.
• Theoutlookforelectricitygenerationfromsolarenergydependscriticallyonthecommercialisationoflarge-scalesolarenergytechnologiesthatwillreduceinvestmentcostsandrisks.
• Governmentpolicysettingswillcontinuetobeanimportantfactorinthesolarenergymarketoutlook.Research,developmentanddemonstrationbyboththepublicandprivatesectorswillbecrucialinacceleratingthedevelopmentandcommercialisationofsolarenergyinAustralia,especiallylarge-scalesolarpowerstations.
AUSTRALIAN ENERGY RESOURCE ASSESSMENT
262
andconcentratingsolarthermaltechnologies.
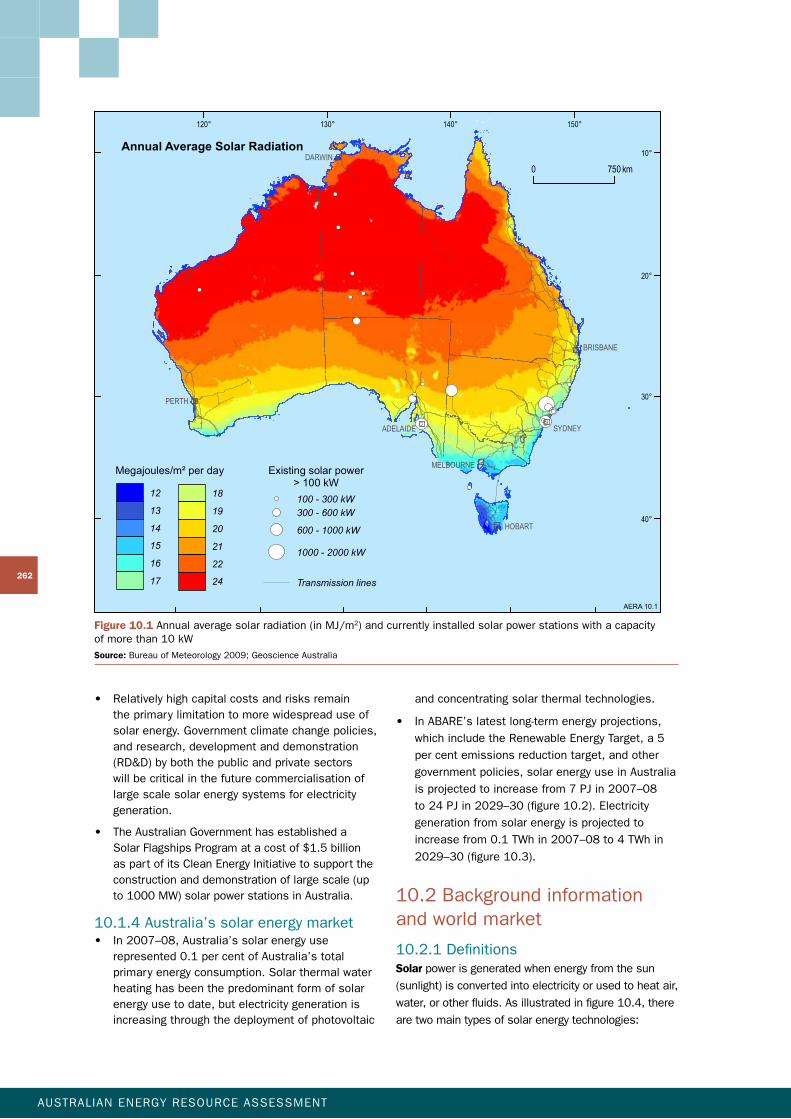
• InABARE’slatestlong-termenergyprojections,
whichincludetheRenewableEnergyTarget,a5
percentemissionsreductiontarget,andother
governmentpolicies,solarenergyuseinAustralia
isprojectedtoincreasefrom7PJin2007–08
to24PJin2029–30(figure10.2).Electricity
generationfromsolarenergyisprojectedto
increasefrom0.1TWhin2007–08to4TWhin
2029–30(figure10.3).
10.2Backgroundinformationandworldmarket
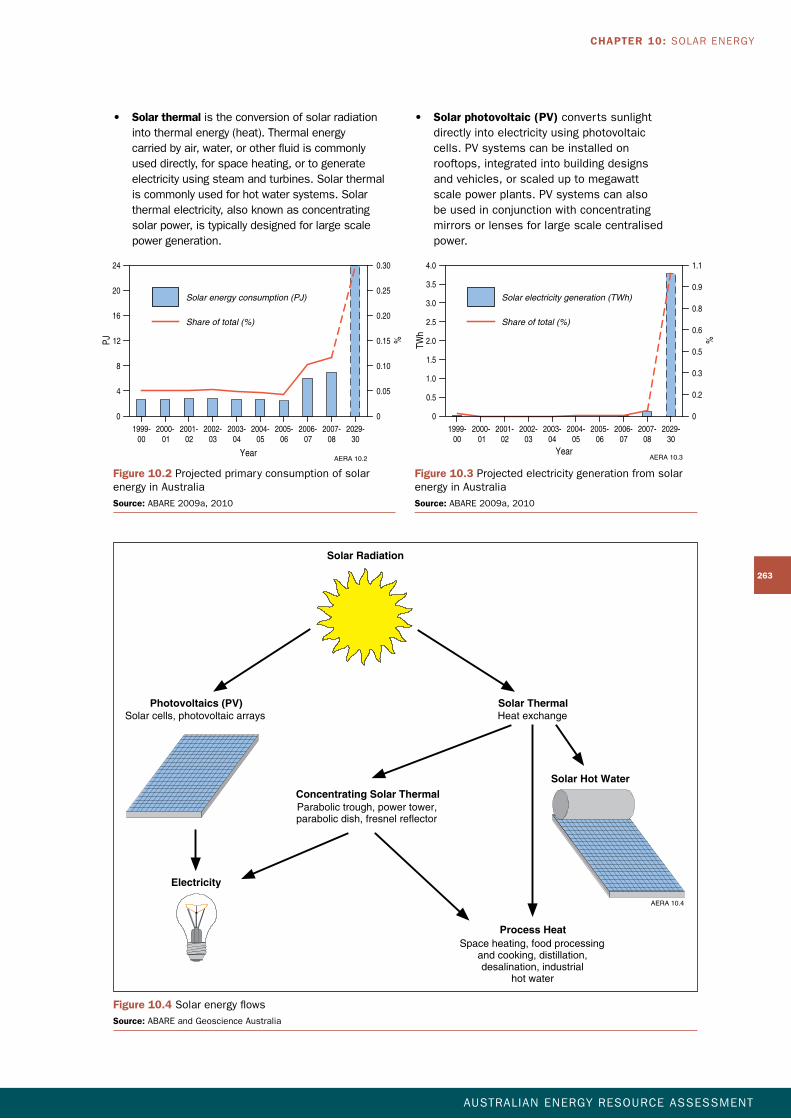
10.2.1DefinitionsSolarpowerisgeneratedwhenenergyfromthesun
(sunlight)isconvertedintoelectricityorusedtoheatair,
water,orotherfluids.Asillustratedinfigure10.4,there
aretwomaintypesofsolarenergytechnologies:
• Relativelyhighcapitalcostsandrisksremaintheprimarylimitationtomorewidespreaduseofsolarenergy.Governmentclimatechangepolicies,andresearch,developmentanddemonstration(RD&D)byboththepublicandprivatesectorswillbecriticalinthefuturecommercialisationoflargescalesolarenergysystemsforelectricitygeneration.
• TheAustralianGovernmenthasestablishedaSolarFlagshipsProgramatacostof$1.5billionaspartofitsCleanEnergyInitiativetosupporttheconstructionanddemonstrationoflargescale(upto1000MW)solarpowerstationsinAustralia.
10.1.4Australia’ssolarenergymarket• In2007–08,Australia’ssolarenergyuse
represented0.1percentofAustralia’stotalprimaryenergyconsumption.Solarthermalwaterheatinghasbeenthepredominantformofsolarenergyusetodate,butelectricitygenerationis increasingthroughthedeploymentofphotovoltaic
PERTH
SYDNEY
DARWIN
HOBART
ADELAIDE
BRISBANE
MELBOURNE
150°140°130°120°
10°
20°
30°
40°
AERA 10.1
0 750 km
Annual Average Solar Radiation
Transmission lines
Existing solar power> 100 kW
1000 - 2000 kW
100 - 300 kW300 - 600 kW
600 - 1000 kW
Megajoules/m² per day
12
13
14
15
16
17
18
19
20
21
22
24
Figure 10.1 Annualaveragesolarradiation(inMJ/m2)andcurrentlyinstalledsolarpowerstationswithacapacity ofmorethan10kW
Source: BureauofMeteorology2009;GeoscienceAustralia
CHAPTER 10: SOLAR ENERGY
AUSTRALIAN ENERGY RESOURCE ASSESSMENT
263
0
4
8
12
16
20
24
PJ
0
0.30
0.25
0.20
0.15
0.10
0.05%
Share of total (%)
Solar energy consumption (PJ)
1999-00
2000-01
2001-02
2002-03
2003-04
2004-05
2005-06
2006-07
2007-08
2029-30
AERA 10.2Year
%
AERA 10.3
0
4.0
3.5
3.0
2.5
2.0
1.5
1.0
0.5
1.1
0.9
0.8
0.6
0.5
0.3
0.2
01999-
002000-
012001-
022002-
032003-
042004-
052005-
062006-
072007-
082029-
30
TWh
Share of total (%)
Solar electricity generation (TWh)
Year
Figure 10.2 ProjectedprimaryconsumptionofsolarenergyinAustralia
Source: ABARE2009a,2010
Figure 10.3 ProjectedelectricitygenerationfromsolarenergyinAustralia
Source: ABARE2009a,2010
Electricity
AERA 10.4
Solar cells, photovoltaic arraysPhotovoltaics (PV)
Parabolic trough, power tower,parabolic dish, fresnel reflector
Concentrating Solar Thermal
Heat exchangeSolar Thermal
Space heating, food processingand cooking, distillation,desalination, industrial
hot water
Process Heat
Solar Radiation
Solar Hot Water
Figure 10.4 SolarenergyflowsSource: ABAREandGeoscienceAustralia
• Solar thermalistheconversionofsolarradiationintothermalenergy(heat).Thermalenergycarriedbyair,water,orotherfluidiscommonlyuseddirectly,forspaceheating,ortogenerateelectricityusingsteamandturbines.Solarthermaliscommonlyusedforhotwatersystems.Solarthermalelectricity,alsoknownasconcentratingsolarpower,istypicallydesignedforlargescalepowergeneration.
• Solar photovoltaic (PV)convertssunlight directlyintoelectricityusingphotovoltaiccells.PVsystemscanbeinstalledonrooftops,integratedintobuildingdesigns andvehicles,orscaleduptomegawatt scalepowerplants.PVsystemscanalsobeusedinconjunctionwithconcentratingmirrorsorlensesforlargescalecentralisedpower.
AUSTRALIAN ENERGY RESOURCE ASSESSMENT
264
ThehighestsolarresourcepotentialperunitlandareaisintheRedSeaarea.Australiaalsohashigherincidentsolarenergyperunitlandareathananyothercontinentintheworld.However,thedistributionofsolarenergyuseamongstcountriesreflectsgovernmentpolicysettingsthatencourageitsuse,ratherthanresourceavailability.
World solar resourcesTheamountofsolarenergyincidentontheworld’slandareafarexceedstotalworldenergydemand.Solarenergythushasthepotentialtomakeamajorcontributiontotheworld’senergyneeds.However,largescalesolarenergyproductioniscurrentlylimitedbyitshighcapitalcost.
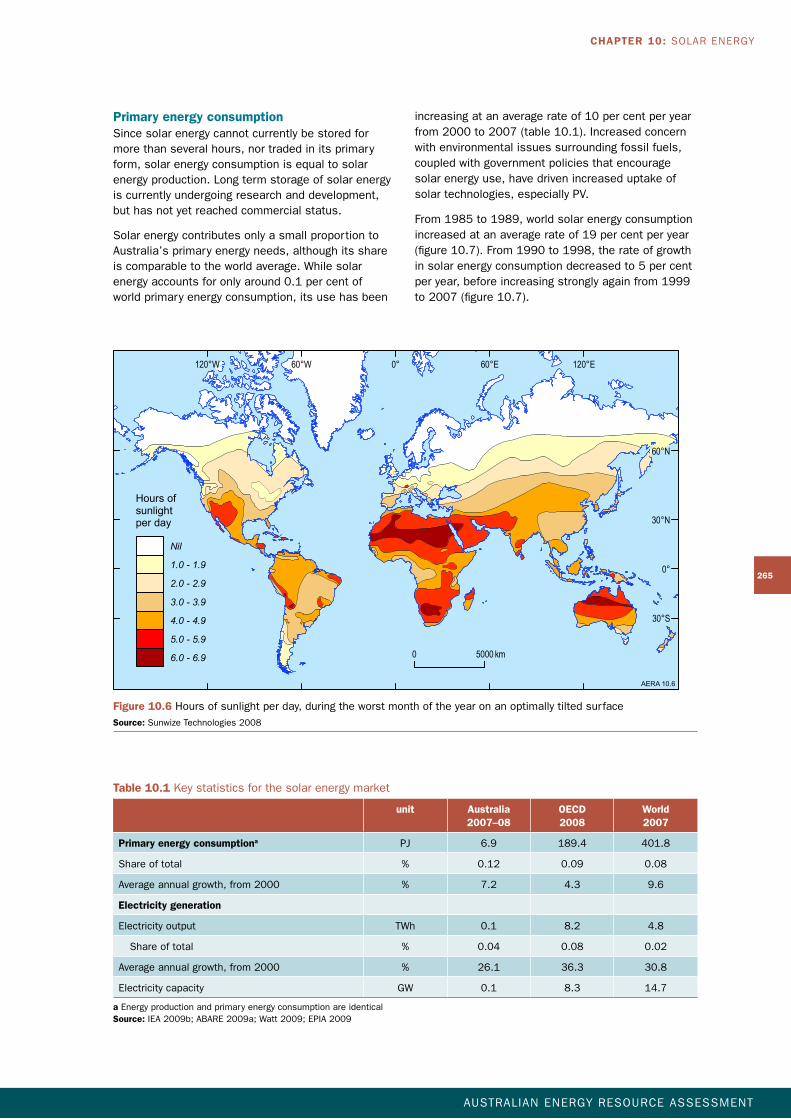
Theannualsolarresourcevariesconsiderably aroundtheworld.Thesevariationsdependon severalfactors,includingproximitytotheequator,cloudcover,andotheratmosphericeffects. Figure10.6illustratesthevariationsinsolar energyavailability.
TheEarth’ssurface,onaverage,hasthepotentialtocapturearound5.4GJ(1.5MWh)ofsolarenergypersquaremetreayear(WEC2007).ThehighestresourcepotentialisintheRedSeaarea,includingEgyptandSaudiArabia(figure10.6).AustraliaandtheUnitedStatesalsohaveagreatersolarresourcepotentialthantheworldaverage.Muchofthispotentialcanbeexplainedbyproximitytotheequatorandaverageannualweatherpatterns.
SolarthermalandPVtechnologycanalsobecombinedintoasinglesystemthatgeneratesbothheatandelectricity.FurtherinformationonsolarthermalandPVtechnologiesisprovidedinboxes10.2and10.3insection10.4.
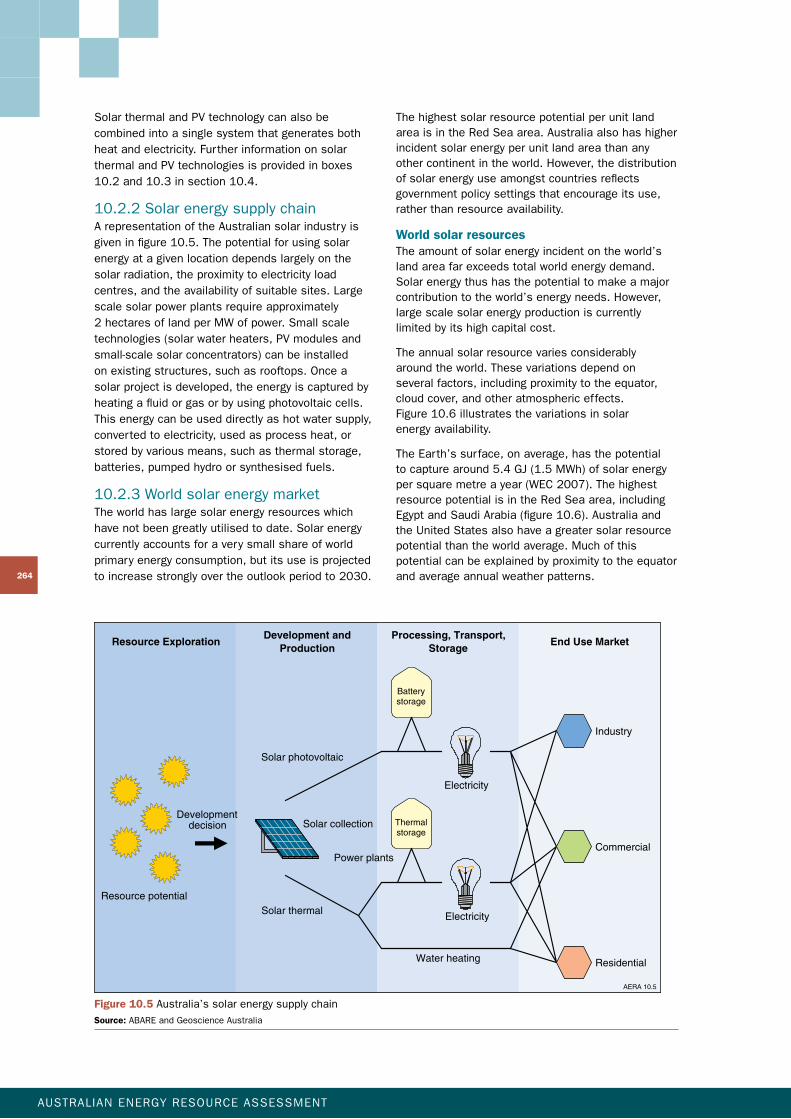
10.2.2SolarenergysupplychainArepresentationoftheAustraliansolarindustryisgiveninfigure10.5.Thepotentialforusingsolarenergyatagivenlocationdependslargelyonthesolarradiation,theproximitytoelectricityloadcentres,andtheavailabilityofsuitablesites.Largescalesolarpowerplantsrequireapproximately2hectaresoflandperMWofpower.Smallscaletechnologies(solarwaterheaters,PVmodulesandsmall-scalesolarconcentrators)canbeinstalledonexistingstructures,suchasrooftops.Onceasolarprojectisdeveloped,theenergyiscapturedbyheatingafluidorgasorbyusingphotovoltaiccells.Thisenergycanbeuseddirectlyashotwatersupply,convertedtoelectricity,usedasprocessheat,orstoredbyvariousmeans,suchasthermalstorage,batteries,pumpedhydroorsynthesisedfuels.
10.2.3WorldsolarenergymarketTheworldhaslargesolarenergyresourceswhichhavenotbeengreatlyutilisedtodate.Solarenergycurrentlyaccountsforaverysmallshareofworldprimaryenergyconsumption,butitsuseisprojectedtoincreasestronglyovertheoutlookperiodto2030.
End Use MarketProcessing, Transport,
StorageDevelopment and
Production
Industry
Commercial
Residential
AERA 10.5
Electricity
Power plants
Solar collection
Electricity
Thermalstorage
Solar photovoltaic
Resource potentialSolar thermal
Resource Exploration
Water heating
Batterystorage
Developmentdecision
Figure 10.5 Australia’ssolarenergysupplychainSource: ABAREandGeoscienceAustralia
CHAPTER 10: SOLAR ENERGY
AUSTRALIAN ENERGY RESOURCE ASSESSMENT
265
increasingatanaveragerateof10percentperyearfrom2000to2007(table10.1).Increasedconcernwithenvironmentalissuessurroundingfossilfuels,coupledwithgovernmentpoliciesthatencouragesolarenergyuse,havedrivenincreaseduptakeofsolartechnologies,especiallyPV.
From1985to1989,worldsolarenergyconsumptionincreasedatanaveragerateof19percentperyear(figure10.7).From1990to1998,therateofgrowthinsolarenergyconsumptiondecreasedto5percentperyear,beforeincreasingstronglyagainfrom1999to2007(figure10.7).
Primary energy consumptionSincesolarenergycannotcurrentlybestoredformorethanseveralhours,nortradedinitsprimaryform,solarenergyconsumptionisequaltosolarenergyproduction.Longtermstorageofsolarenergyiscurrentlyundergoingresearchanddevelopment,buthasnotyetreachedcommercialstatus.
SolarenergycontributesonlyasmallproportiontoAustralia’sprimaryenergyneeds,althoughitsshareiscomparabletotheworldaverage.Whilesolar energyaccountsforonlyaround0.1percentofworldprimaryenergyconsumption,itsusehasbeen
AERA 10.6
0 5000 km
Nil
1.0 - 1.9
2.0 - 2.9
3.0 - 3.9
4.0 - 4.9
5.0 - 5.9
6.0 - 6.9
120°E60°E0°60°W120°W
60°N
30°N
0°
30°S
Hours ofsunlightper day
Figure 10.6 Hoursofsunlightperday,duringtheworstmonthoftheyearonanoptimallytiltedsurfaceSource: SunwizeTechnologies2008
Table 10.1 Keystatisticsforthesolarenergymarket
unit australia 2007–08
OECD 2008
World 2007
Primary energy consumptiona PJ 6.9 189.4 401.8
Shareoftotal % 0.12 0.09 0.08
Averageannualgrowth,from2000 % 7.2 4.3 9.6
Electricity generation
Electricityoutput TWh 0.1 8.2 4.8
Shareoftotal % 0.04 0.08 0.02
Averageannualgrowth,from2000 % 26.1 36.3 30.8
Electricitycapacity GW 0.1 8.3 14.7
a Energyproductionandprimaryenergyconsumptionareidentical Source:IEA2009b;ABARE2009a;Watt2009;EPIA2009
AUSTRALIAN ENERGY RESOURCE ASSESSMENT
266
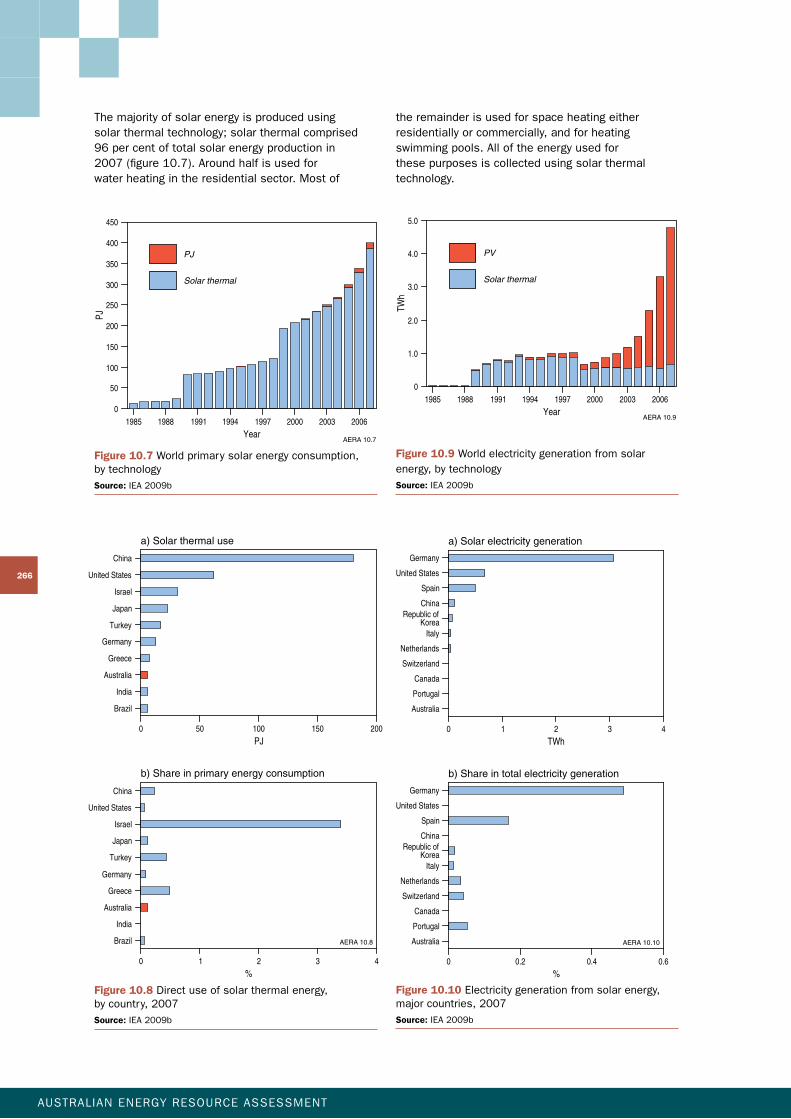
theremainderisusedforspaceheatingeitherresidentiallyorcommercially,andforheatingswimmingpools.Alloftheenergyusedfor thesepurposesiscollectedusingsolarthermaltechnology.
Themajorityofsolarenergyisproducedusing solarthermaltechnology;solarthermalcomprised 96percentoftotalsolarenergyproductionin 2007(figure10.7).Aroundhalfisusedforwaterheatingintheresidentialsector.Mostof
400
350
300
250
0
100
150
200
PJ
50
1985 1988 1991 1994 1997 2000 2003 2006
Year
Solar thermal
PJ
AERA 10.7
450
Figure 10.7 Worldprimarysolarenergyconsumption, bytechnology
Source: IEA2009b
Australia
Japan
Brazil
Israel
China
Turkey
Germany
Greece
India
China
Israel
Japan
Turkey
Germany
Greece
Australia
India
Brazil
0
PJ50 100 150 200
%0
AERA 10.8
1 2 3 4
United States
United States
a) Solar thermal use
b) Share in primary energy consumption
Figure 10.8 Directuseofsolarthermalenergy, bycountry,2007
Source: IEA2009b
1985 1988 1991 1994 1997 2000 2003 2006
YearAERA 10.9
0
1.0
2.0
TWh
3.0
4.0
5.0
Solar thermal
PV
0 1 2 3 4
TWh
0%
0.2 0.4 0.6
AERA 10.10
Germany
United States
Spain
China
Italy
Netherlands
Switzerland
Canada
Portugal
Australia
Germany
United States
Spain
China
Italy
Netherlands
Canada
Switzerland
Portugal
Australia
a) Solar electricity generation
b) Share in total electricity generation
Republic ofKorea
Republic ofKorea
Figure 10.9 Worldelectricitygenerationfromsolarenergy,bytechnology
Source: IEA2009b
Figure 10.10 Electricitygenerationfromsolarenergy,majorcountries,2007
Source: IEA2009b
CHAPTER 10: SOLAR ENERGY
AUSTRALIAN ENERGY RESOURCE ASSESSMENT
267
3percentofsolarthermalenergyisconvertedtoelectricity.Until2003,moresolarthermalenergywasusedtogenerateelectricitythansolarphotovoltaicenergy(figure10.9).
Thelargestproducersofelectricityfromsolar energyin2007wereGermany(3.1TWh),theUnitedStates(0.7TWh)andSpain(0.5TWh),withallothercountrieseachproducing0.1TWhorless(figure10.10).Germanyhadthelargestshareofsolarenergyinelectricitygeneration,at0.5percent.Itisimportanttonotethattheseelectricitygenerationdatadonotincludeoff-gridPVinstallations,whichrepresentalargepartofPVuseinsomecountries.
Solar thermal energy consumptionThelargestusersofsolarthermalenergyin2007wereChina(180PJ),theUnitedStates(62PJ),Israel(31PJ)andJapan(23PJ).However,Israelhasasignificantlylargershareofsolarthermalinitstotalprimaryenergyconsumptionthananyothercountry(figure10.8).Growthinsolarthermalenergyuseinthesecountrieshasbeenlargelydrivenbygovernmentpolicies.
Electricity generationElectricitygenerationaccountsforaround5percentofprimaryconsumptionofsolarenergy.Allsolarphotovoltaicenergyiselectricity,whilearound
8000
7000
6000
5000
1000
2000
3000
4000
Peak
cap
acity
(MW
)
0
% s
hare
of s
olar
PV
mar
ket
1
2
3
4
5
6
7
89000
01992 1993 1994 1995 1996 1997 1998 1999 2000 2001 2002 2003 2004 2005 2006 2007
Year
AERA 10.11
Other
Spain Japan
GermanyUnited States
Australia’s share ofsolar PV market (%)
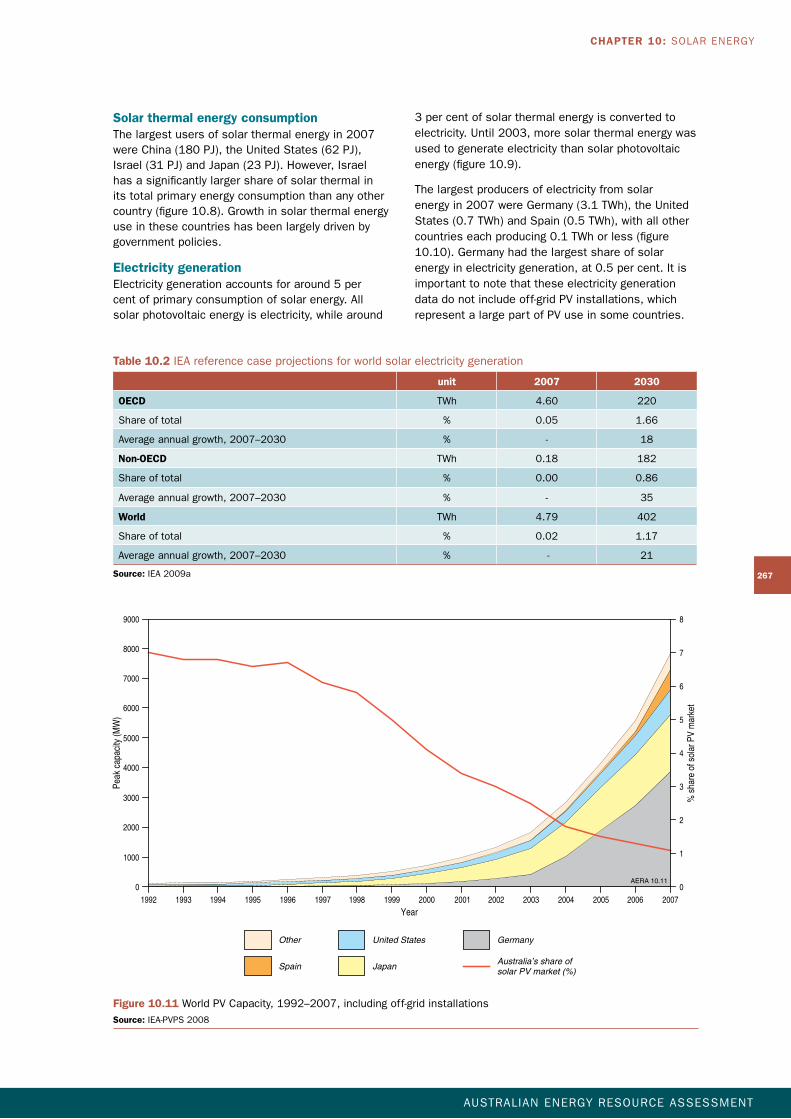
Figure 10.11 WorldPVCapacity,1992–2007,includingoff-gridinstallationsSource: IEA-PVPS2008
Table 10.2 IEAreferencecaseprojectionsforworldsolarelectricitygeneration
unit 2007 2030
OECD TWh 4.60 220
Shareoftotal % 0.05 1.66
Averageannualgrowth,2007–2030 % - 18
Non-OECD TWh 0.18 182
Shareoftotal % 0.00 0.86
Averageannualgrowth,2007–2030 % - 35
World TWh 4.79 402
Shareoftotal % 0.02 1.17
Averageannualgrowth,2007–2030 % - 21
Source: IEA2009a
AUSTRALIAN ENERGY RESOURCE ASSESSMENT
268
PERTH
SYDNEY
DARWIN
HOBART
ADELAIDE
BRISBANE
MELBOURNE
150°140°130°120°
10°
20°
30°
40°
AERA 10.12
0 750 km
Annual Average Solar Radiation
Transmission lines
Megajoules/m² per day
3
4 - 6
7 - 9
10 - 12
13 - 15
16 - 18
19 - 21
22 - 24
25 - 27
28 - 30
31 - 33
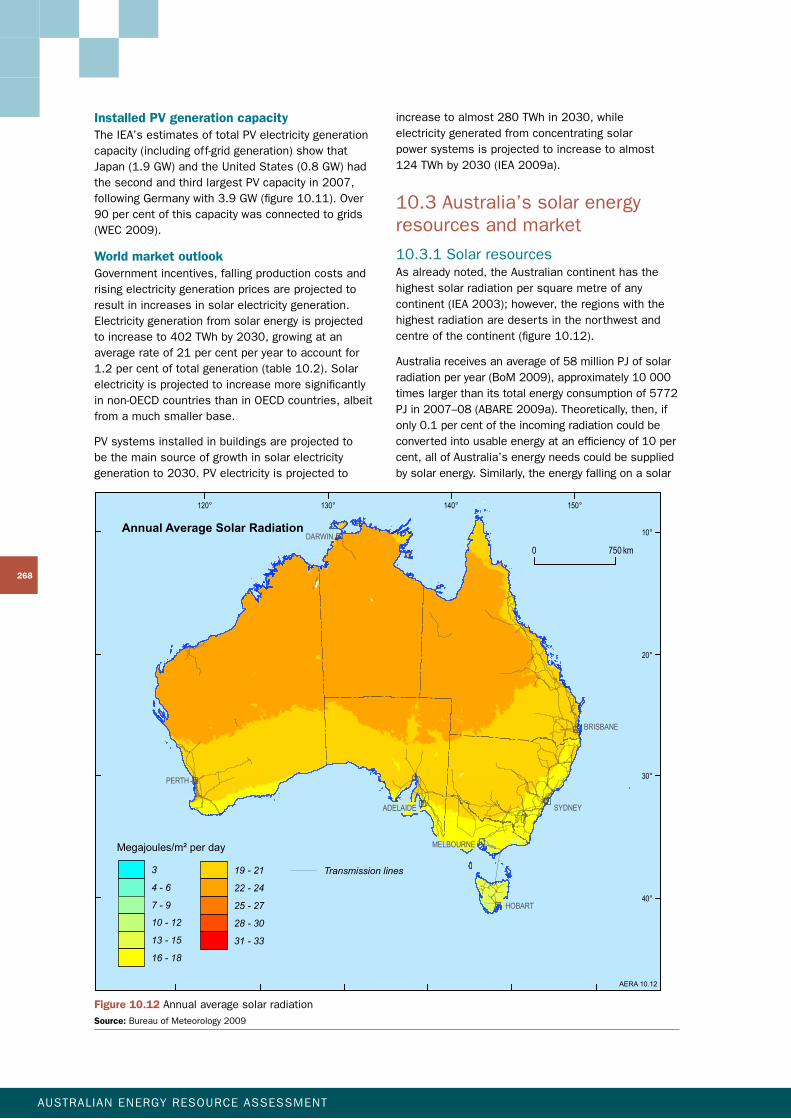
Figure 10.12 AnnualaveragesolarradiationSource: BureauofMeteorology2009
Installed PV generation capacityTheIEA’sestimatesoftotalPVelectricitygenerationcapacity(includingoff-gridgeneration)showthatJapan(1.9GW)andtheUnitedStates(0.8GW)hadthesecondandthirdlargestPVcapacityin2007,followingGermanywith3.9GW(figure10.11).Over90percentofthiscapacitywasconnectedtogrids(WEC2009).
World market outlookGovernmentincentives,fallingproductioncostsandrisingelectricitygenerationpricesareprojectedtoresultinincreasesinsolarelectricitygeneration.Electricitygenerationfromsolarenergyisprojected toincreaseto402TWhby2030,growingatanaveragerateof21percentperyeartoaccountfor1.2percentoftotalgeneration(table10.2).Solarelectricityisprojectedtoincreasemoresignificantlyinnon-OECDcountriesthaninOECDcountries,albeitfromamuchsmallerbase.
PVsystemsinstalledinbuildingsareprojectedtobethemainsourceofgrowthinsolarelectricitygenerationto2030.PVelectricityisprojectedto
increasetoalmost280TWhin2030,while electricitygeneratedfromconcentratingsolar powersystemsisprojectedtoincreasetoalmost124TWhby2030(IEA2009a).
10.3Australia’ssolarenergyresources and market
10.3.1SolarresourcesAsalreadynoted,theAustraliancontinenthasthehighestsolarradiationpersquaremetreofanycontinent(IEA2003);however,theregionswiththehighestradiationaredesertsinthenorthwestandcentreofthecontinent(figure10.12).
Australiareceivesanaverageof58millionPJofsolarradiationperyear(BoM2009),approximately10000timeslargerthanitstotalenergyconsumptionof5772PJin2007–08(ABARE2009a).Theoretically,then,ifonly0.1percentoftheincomingradiationcouldbeconvertedintousableenergyatanefficiencyof10percent,allofAustralia’senergyneedscouldbesuppliedbysolarenergy.Similarly,theenergyfallingonasolar
CHAPTER 10: SOLAR ENERGY
AUSTRALIAN ENERGY RESOURCE ASSESSMENT
269
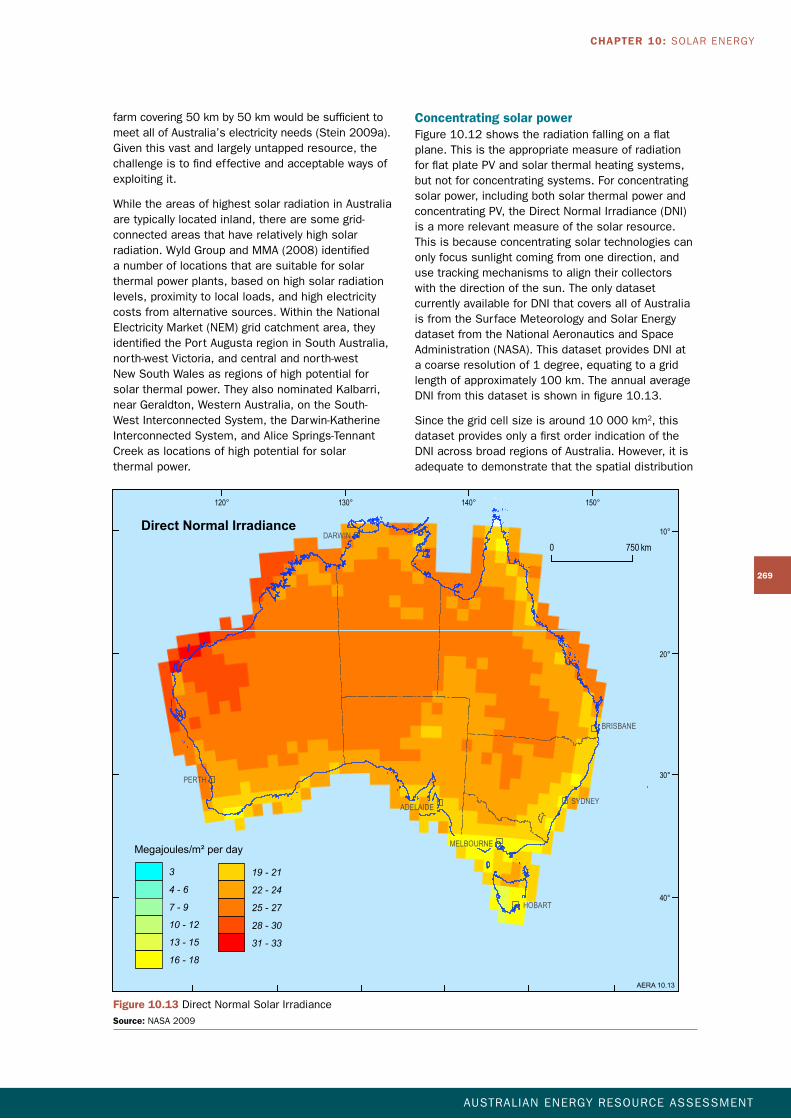
Concentrating solar powerFigure10.12showstheradiationfallingonaflatplane.ThisistheappropriatemeasureofradiationforflatplatePVandsolarthermalheatingsystems,butnotforconcentratingsystems.Forconcentratingsolarpower,includingbothsolarthermalpowerandconcentratingPV,theDirectNormalIrradiance(DNI)isamorerelevantmeasureofthesolarresource.Thisisbecauseconcentratingsolartechnologiescanonlyfocussunlightcomingfromonedirection,andusetrackingmechanismstoaligntheircollectorswiththedirectionofthesun.TheonlydatasetcurrentlyavailableforDNIthatcoversallofAustraliaisfromtheSurfaceMeteorologyandSolarEnergydatasetfromtheNationalAeronauticsandSpaceAdministration(NASA).ThisdatasetprovidesDNIatacoarseresolutionof1degree,equatingtoagridlengthofapproximately100km.TheannualaverageDNIfromthisdatasetisshowninfigure10.13.
Sincethegridcellsizeisaround10000km2,thisdatasetprovidesonlyafirstorderindicationoftheDNIacrossbroadregionsofAustralia.However,itisadequatetodemonstratethatthespatialdistribution
farmcovering50kmby50kmwouldbesufficienttomeetallofAustralia’selectricityneeds(Stein2009a).Giventhisvastandlargelyuntappedresource,thechallengeistofindeffectiveandacceptablewaysofexploitingit.
WhiletheareasofhighestsolarradiationinAustraliaaretypicallylocatedinland,therearesomegrid-connectedareasthathaverelativelyhighsolarradiation.WyldGroupandMMA(2008)identifiedanumberoflocationsthataresuitableforsolarthermalpowerplants,basedonhighsolarradiationlevels,proximitytolocalloads,andhighelectricitycostsfromalternativesources.WithintheNationalElectricityMarket(NEM)gridcatchmentarea,theyidentifiedthePortAugustaregioninSouthAustralia,north-westVictoria,andcentralandnorth-westNewSouthWalesasregionsofhighpotentialforsolarthermalpower.TheyalsonominatedKalbarri,nearGeraldton,WesternAustralia,ontheSouth-WestInterconnectedSystem,theDarwin-KatherineInterconnectedSystem,andAliceSprings-TennantCreekaslocationsofhighpotentialforsolar thermalpower.
PERTH
SYDNEY
DARWIN
HOBART
ADELAIDE
BRISBANE
MELBOURNE
150°140°130°120°
10°
20°
30°
40°
AERA 10.13
0 750 km
Direct Normal Irradiance
Megajoules/m² per day
3
4 - 6
7 - 9
10 - 12
13 - 15
16 - 18
19 - 21
22 - 24
25 - 27
28 - 30
31 - 33
Figure 10.13 DirectNormalSolarIrradianceSource: NASA2009
AUSTRALIAN ENERGY RESOURCE ASSESSMENT
270
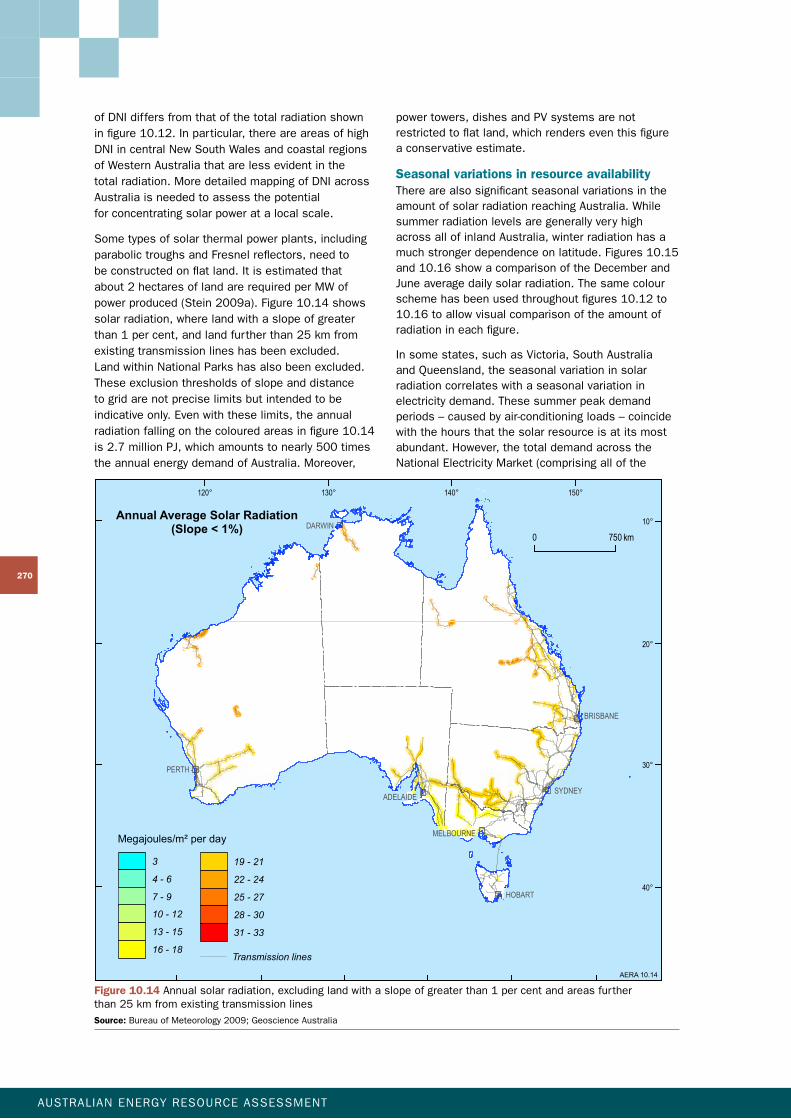
powertowers,dishesandPVsystemsarenotrestrictedtoflatland,whichrenderseventhisfigureaconservativeestimate.
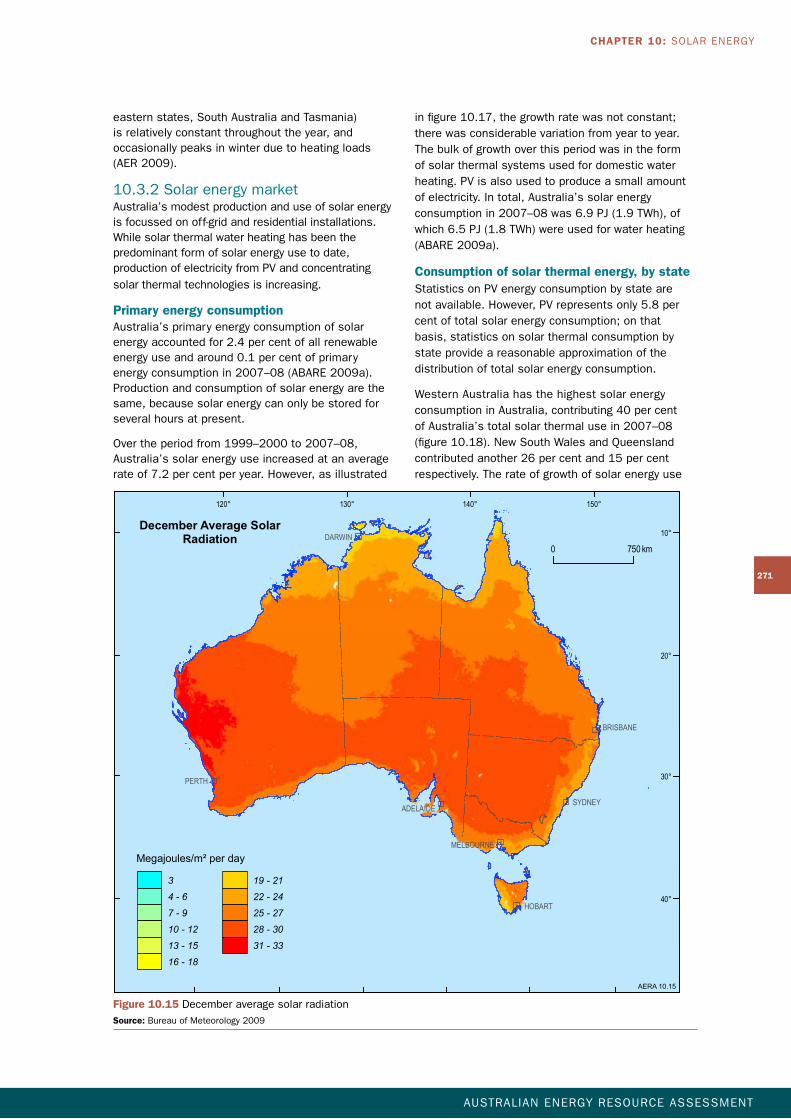
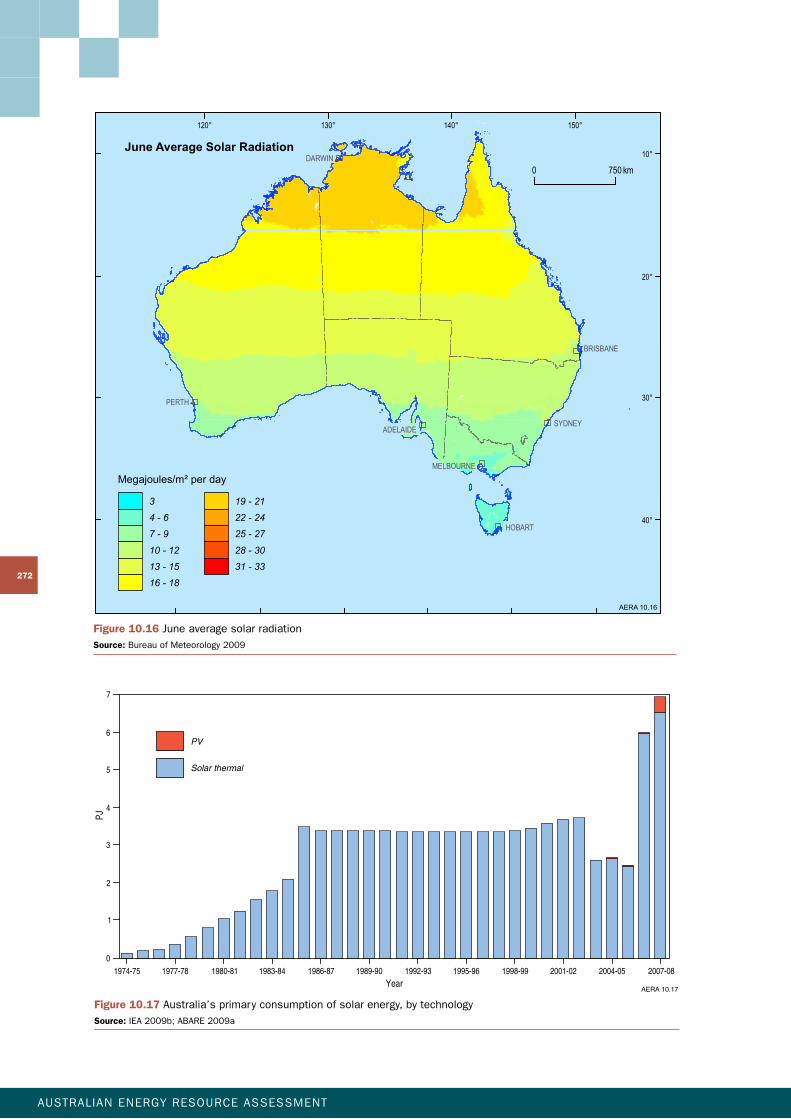
Seasonal variations in resource availabilityTherearealsosignificantseasonalvariationsintheamountofsolarradiationreachingAustralia.WhilesummerradiationlevelsaregenerallyveryhighacrossallofinlandAustralia,winterradiationhasamuchstrongerdependenceonlatitude.Figures10.15and10.16showacomparisonoftheDecemberandJuneaveragedailysolarradiation.Thesamecolourschemehasbeenusedthroughoutfigures10.12to10.16toallowvisualcomparisonoftheamountofradiationineachfigure.
Insomestates,suchasVictoria,SouthAustralia andQueensland,theseasonalvariationinsolarradiationcorrelateswithaseasonalvariationinelectricitydemand.Thesesummerpeakdemandperiods–causedbyair-conditioningloads–coincidewiththehoursthatthesolarresourceisatitsmostabundant.However,thetotaldemandacrosstheNationalElectricityMarket(comprisingallofthe
ofDNIdiffersfromthatofthetotalradiationshowninfigure10.12.Inparticular,thereareareasofhighDNIincentralNewSouthWalesandcoastalregionsofWesternAustraliathatarelessevidentinthetotalradiation.MoredetailedmappingofDNIacrossAustraliaisneededtoassessthepotential forconcentratingsolarpoweratalocalscale.
Sometypesofsolarthermalpowerplants,includingparabolictroughsandFresnelreflectors,needto beconstructedonflatland.Itisestimatedthat about2hectaresoflandarerequiredperMWofpowerproduced(Stein2009a).Figure10.14showssolarradiation,wherelandwithaslopeofgreaterthan1percent,andlandfurtherthan25kmfromexistingtransmissionlineshasbeenexcluded. LandwithinNationalParkshasalsobeenexcluded.Theseexclusionthresholdsofslopeanddistancetogridarenotpreciselimitsbutintendedtobeindicativeonly.Evenwiththeselimits,theannualradiationfallingonthecolouredareasinfigure10.14is2.7millionPJ,whichamountstonearly500timestheannualenergydemandofAustralia.Moreover,
PERTH
SYDNEY
DARWIN
HOBART
ADELAIDE
BRISBANE
MELBOURNE
150°140°130°120°
10°
20°
30°
40°
AERA 10.14
0 750 km
Annual Average Solar Radiation(Slope < 1%)
Transmission lines
Megajoules/m² per day
3
4 - 6
7 - 9
10 - 12
13 - 15
16 - 18
19 - 21
22 - 24
25 - 27
28 - 30
31 - 33
Figure 10.14 Annualsolarradiation,excludinglandwithaslopeofgreaterthan1percentandareasfurther than25kmfromexistingtransmissionlines
Source: BureauofMeteorology2009;GeoscienceAustralia
CHAPTER 10: SOLAR ENERGY
AUSTRALIAN ENERGY RESOURCE ASSESSMENT
271
infigure10.17,thegrowthratewasnotconstant;therewasconsiderablevariationfromyeartoyear.Thebulkofgrowthoverthisperiodwasintheformofsolarthermalsystemsusedfordomesticwaterheating.PVisalsousedtoproduceasmallamountofelectricity.Intotal,Australia’ssolarenergyconsumptionin2007–08was6.9PJ(1.9TWh),ofwhich6.5PJ(1.8TWh)wereusedforwaterheating(ABARE2009a).
Consumption of solar thermal energy, by stateStatisticsonPVenergyconsumptionbystatearenotavailable.However,PVrepresentsonly5.8percentoftotalsolarenergyconsumption;onthatbasis,statisticsonsolarthermalconsumptionbystateprovideareasonableapproximationofthedistributionoftotalsolarenergyconsumption.
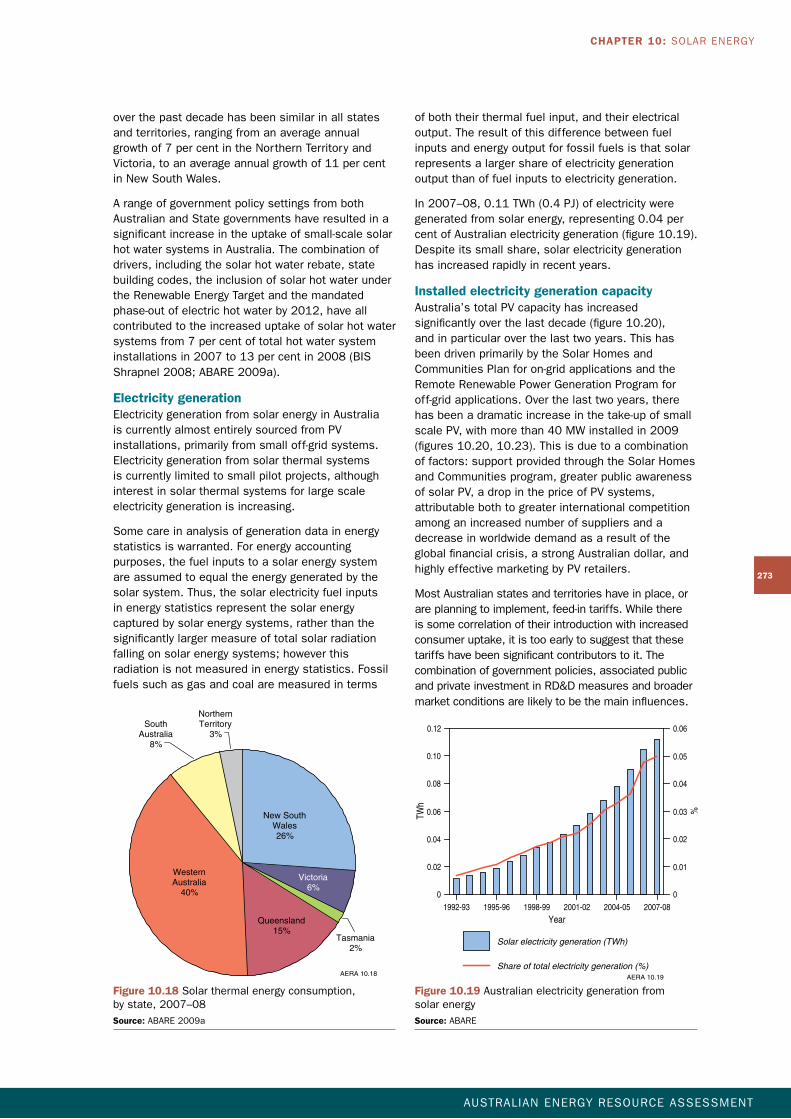
WesternAustraliahasthehighestsolarenergyconsumptioninAustralia,contributing40percentofAustralia’stotalsolarthermalusein2007–08(figure10.18).NewSouthWalesandQueenslandcontributedanother26percentand15percentrespectively.Therateofgrowthofsolarenergyuse
easternstates,SouthAustraliaandTasmania)isrelativelyconstantthroughouttheyear,andoccasionallypeaksinwinterduetoheatingloads(AER2009).
10.3.2SolarenergymarketAustralia’smodestproductionanduseofsolarenergyisfocussedonoff-gridandresidentialinstallations.Whilesolarthermalwaterheatinghasbeenthepredominantformofsolarenergyusetodate,productionofelectricityfromPVandconcentrating
solarthermaltechnologiesisincreasing.
Primary energy consumptionAustralia’sprimaryenergyconsumptionofsolarenergyaccountedfor2.4percentofallrenewableenergyuseandaround0.1percentofprimaryenergyconsumptionin2007–08(ABARE2009a).Productionandconsumptionofsolarenergyarethesame,becausesolarenergycanonlybestoredforseveralhoursatpresent.
Overtheperiodfrom1999–2000to2007–08,Australia’ssolarenergyuseincreasedatanaveragerateof7.2percentperyear.However,asillustrated
PERTH
SYDNEY
DARWIN
HOBART
ADELAIDE
BRISBANE
MELBOURNE
150°140°130°120°
10°
20°
30°
40°
AERA 10.15
0 750 km
December Average SolarRadiation
Megajoules/m² per day
3
4 - 6
7 - 9
10 - 12
13 - 15
16 - 18
19 - 21
22 - 24
25 - 27
28 - 30
31 - 33
Figure 10.15 DecemberaveragesolarradiationSource: BureauofMeteorology2009
AUSTRALIAN ENERGY RESOURCE ASSESSMENT
272
PERTH
SYDNEY
DARWIN
HOBART
ADELAIDE
BRISBANE
MELBOURNE
150°140°130°120°
10°
20°
30°
40°
AERA 10.16
0 750 km
June Average Solar Radiation
Megajoules/m² per day
3
4 - 6
7 - 9
10 - 12
13 - 15
16 - 18
19 - 21
22 - 24
25 - 27
28 - 30
31 - 33
Figure 10.16 JuneaveragesolarradiationSource: BureauofMeteorology2009
0
PJ
1
2
3
4
5
6
7
Solar thermal
PV
YearAERA 10.17
1974-75 1977-78 1980-81 1983-84 1986-87 1989-90 1992-93 1995-96 1998-99 2001-02 2004-05 2007-08
Figure 10.17 Australia’sprimaryconsumptionofsolarenergy,bytechnologySource: IEA2009b;ABARE2009a
CHAPTER 10: SOLAR ENERGY
AUSTRALIAN ENERGY RESOURCE ASSESSMENT
273
ofboththeirthermalfuelinput,andtheirelectricaloutput.Theresultofthisdifferencebetweenfuelinputsandenergyoutputforfossilfuelsisthatsolarrepresentsalargershareofelectricitygenerationoutputthanoffuelinputstoelectricitygeneration.
In2007–08,0.11TWh(0.4PJ)ofelectricityweregeneratedfromsolarenergy,representing0.04percentofAustralianelectricitygeneration(figure10.19).Despiteitssmallshare,solarelectricitygenerationhasincreasedrapidlyinrecentyears.
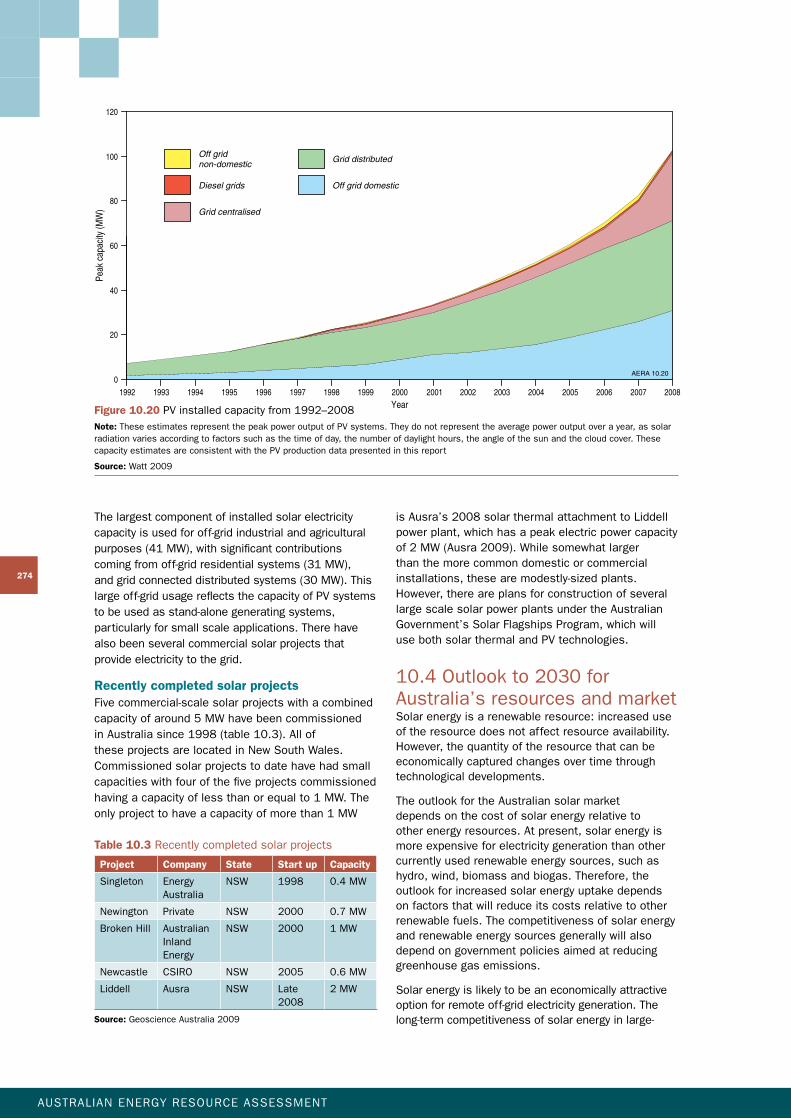
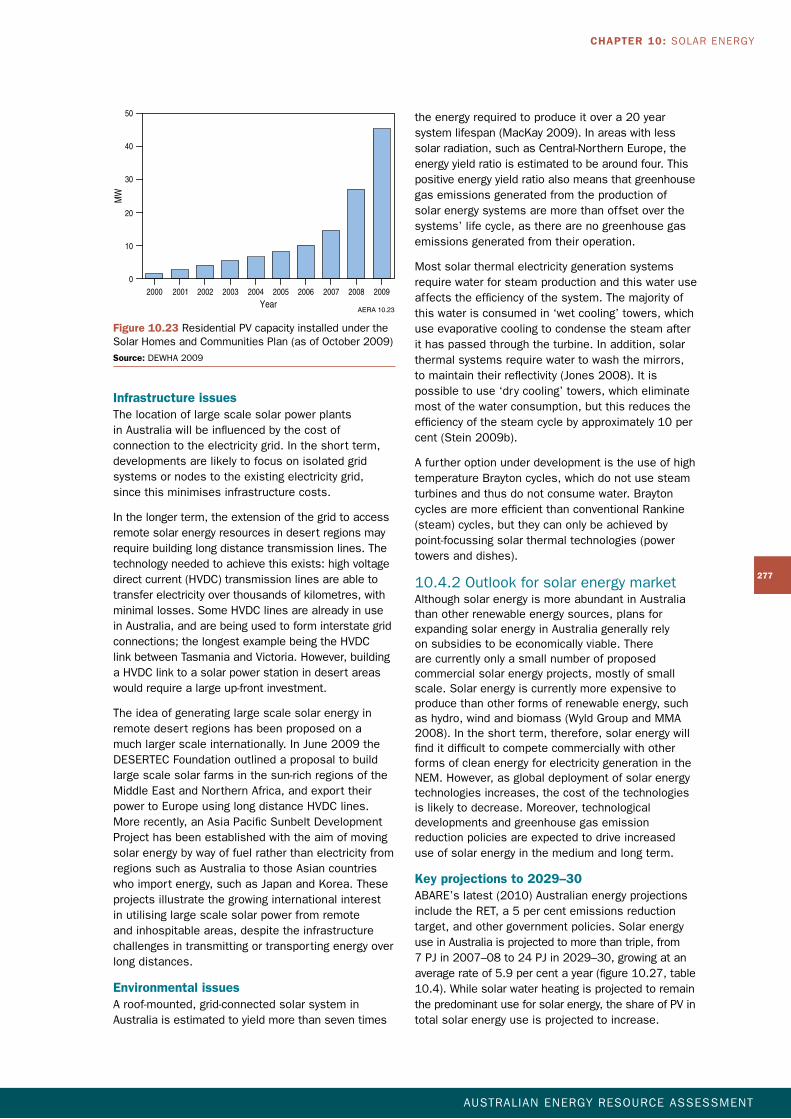
Installed electricity generation capacityAustralia’stotalPVcapacityhasincreasedsignificantlyoverthelastdecade(figure10.20),andinparticularoverthelasttwoyears.ThishasbeendrivenprimarilybytheSolarHomesandCommunitiesPlanforon-gridapplicationsandtheRemoteRenewablePowerGenerationProgramforoff-gridapplications.Overthelasttwoyears,therehasbeenadramaticincreaseinthetake-upofsmallscalePV,withmorethan40MWinstalledin2009(figures10.20,10.23).Thisisduetoacombinationoffactors:supportprovidedthroughtheSolarHomesandCommunitiesprogram,greaterpublicawarenessofsolarPV,adropinthepriceofPVsystems,attributablebothtogreaterinternationalcompetitionamonganincreasednumberofsuppliersandadecreaseinworldwidedemandasaresultoftheglobalfinancialcrisis,astrongAustraliandollar,andhighlyeffectivemarketingbyPVretailers.
MostAustralianstatesandterritorieshaveinplace,orareplanningtoimplement,feed-intariffs.Whilethereissomecorrelationoftheirintroductionwithincreasedconsumeruptake,itistooearlytosuggestthatthesetariffshavebeensignificantcontributorstoit.Thecombinationofgovernmentpolicies,associatedpublicandprivateinvestmentinRD&Dmeasuresandbroadermarketconditionsarelikelytobethemaininfluences.
overthepastdecadehasbeensimilarinallstatesandterritories,rangingfromanaverageannualgrowthof7percentintheNorthernTerritoryandVictoria,toanaverageannualgrowthof11percentinNewSouthWales.
ArangeofgovernmentpolicysettingsfrombothAustralianandStategovernmentshaveresultedinasignificantincreaseintheuptakeofsmall-scalesolarhotwatersystemsinAustralia.Thecombinationofdrivers,includingthesolarhotwaterrebate,statebuildingcodes,theinclusionofsolarhotwaterundertheRenewableEnergyTargetandthemandatedphase-outofelectrichotwaterby2012,haveallcontributedtotheincreaseduptakeofsolarhotwatersystemsfrom7percentoftotalhotwatersysteminstallationsin2007to13percentin2008(BISShrapnel2008;ABARE2009a).
Electricity generationElectricitygenerationfromsolarenergyinAustraliaiscurrentlyalmostentirelysourcedfromPVinstallations,primarilyfromsmalloff-gridsystems.Electricitygenerationfromsolarthermalsystemsiscurrentlylimitedtosmallpilotprojects,althoughinterestinsolarthermalsystemsforlargescaleelectricitygenerationisincreasing.
Somecareinanalysisofgenerationdatainenergystatisticsiswarranted.Forenergyaccountingpurposes,thefuelinputstoasolarenergysystemareassumedtoequaltheenergygeneratedbythesolarsystem.Thus,thesolarelectricityfuelinputs inenergystatisticsrepresentthesolarenergycapturedbysolarenergysystems,ratherthanthesignificantlylargermeasureoftotalsolarradiationfallingonsolarenergysystems;howeverthisradiationisnotmeasuredinenergystatistics.Fossilfuelssuchasgasandcoalaremeasuredinterms
WesternAustralia
40%
Queensland15%
Victoria6%
Tasmania2%
NorthernTerritory
3%South
Australia8%
New SouthWales26%
AERA 10.18
Figure 10.18 Solarthermalenergyconsumption, bystate,2007–08
Source: ABARE2009a
Solar electricity generation (TWh)
TWh
0.12
0.10
0
0.02
0.04
0.06
0.08
%
0.06
0.04
0.03
0.02
0.01
0
0.05
1992-93 1995-96 1998-99 2001-02 2004-05 2007-08
Year
Share of total electricity generation (%)AERA 10.19
Solar electricity generation (TWh)
TWh
0.12
0.10
0
0.02
0.04
0.06
0.08
%
0.06
0.04
0.03
0.02
0.01
0
0.05
1992-93 1995-96 1998-99 2001-02 2004-05 2007-08
Year
Share of total electricity generation (%)AERA 10.19
Figure 10.19 Australianelectricitygenerationfrom solar energy
Source: ABARE
AUSTRALIAN ENERGY RESOURCE ASSESSMENT
274
120
100
Peak
cap
acity
(MW
)
0
20
40
60
80
1992 1993 1994 1995 1996 2006200520042003200220012000199919981997 20082007
AERA 10.20
Year
Diesel grids
Grid centralised
Grid distributedOff gridnon-domestic
Off grid domestic
Thelargestcomponentofinstalledsolarelectricitycapacityisusedforoff-gridindustrialandagriculturalpurposes(41MW),withsignificantcontributionscomingfromoff-gridresidentialsystems(31MW),andgridconnecteddistributedsystems(30MW).Thislargeoff-gridusagereflectsthecapacityofPVsystemstobeusedasstand-alonegeneratingsystems,particularlyforsmallscaleapplications.Therehavealsobeenseveralcommercialsolarprojectsthatprovideelectricitytothegrid.
Recently completed solar projectsFivecommercial-scalesolarprojectswithacombinedcapacityofaround5MWhavebeencommissionedinAustraliasince1998(table10.3).AlloftheseprojectsarelocatedinNewSouthWales.Commissionedsolarprojectstodatehavehadsmallcapacitieswithfourofthefiveprojectscommissionedhavingacapacityoflessthanorequalto1MW.Theonlyprojecttohaveacapacityofmorethan1MW
Figure 10.20 PVinstalledcapacityfrom1992–2008Note: TheseestimatesrepresentthepeakpoweroutputofPVsystems.Theydonotrepresenttheaveragepoweroutputoverayear,assolarradiationvariesaccordingtofactorssuchasthetimeofday,thenumberofdaylighthours,theangleofthesunandthecloudcover.ThesecapacityestimatesareconsistentwiththePVproductiondatapresentedinthisreport
Source: Watt2009
Table 10.3 Recentlycompletedsolarprojects
Project Company State Start up Capacity
Singleton EnergyAustralia
NSW 1998 0.4MW
Newington Private NSW 2000 0.7MW
BrokenHill AustralianInlandEnergy
NSW 2000 1MW
Newcastle CSIRO NSW 2005 0.6MW
Liddell Ausra NSW Late2008
2MW
Source: GeoscienceAustralia2009
isAusra’s2008solarthermalattachmenttoLiddellpowerplant,whichhasapeakelectricpowercapacityof2MW(Ausra2009).Whilesomewhatlargerthanthemorecommondomesticorcommercialinstallations,thesearemodestly-sizedplants.However,thereareplansforconstructionofseverallargescalesolarpowerplantsundertheAustralianGovernment’sSolarFlagshipsProgram,whichwill usebothsolarthermalandPVtechnologies.
10.4Outlookto2030forAustralia’sresourcesandmarketSolarenergyisarenewableresource:increaseduseoftheresourcedoesnotaffectresourceavailability.However,thequantityoftheresourcethatcanbeeconomicallycapturedchangesovertimethroughtechnologicaldevelopments.
TheoutlookfortheAustraliansolarmarket dependsonthecostofsolarenergyrelativetootherenergyresources.Atpresent,solarenergyismoreexpensiveforelectricitygenerationthanothercurrentlyusedrenewableenergysources,suchashydro,wind,biomassandbiogas.Therefore,theoutlookforincreasedsolarenergyuptakedependsonfactorsthatwillreduceitscostsrelativetootherrenewablefuels.Thecompetitivenessofsolarenergyandrenewableenergysourcesgenerallywillalsodependongovernmentpoliciesaimedatreducinggreenhousegasemissions.
Solarenergyislikelytobeaneconomicallyattractiveoptionforremoteoff-gridelectricitygeneration.Thelong-termcompetitivenessofsolarenergyinlarge-
CHAPTER 10: SOLAR ENERGY
AUSTRALIAN ENERGY RESOURCE ASSESSMENT
275
Solarwaterheatersarecontinuingtobedevelopedfurther,andcanalsobeintegrated withPVarrays.Otherdirectusesincludepassivesolarheating,andsolarairconditioning.Informationonsolarenergytechnologiesfordirect-useapplicationsispresentedinbox10.2.
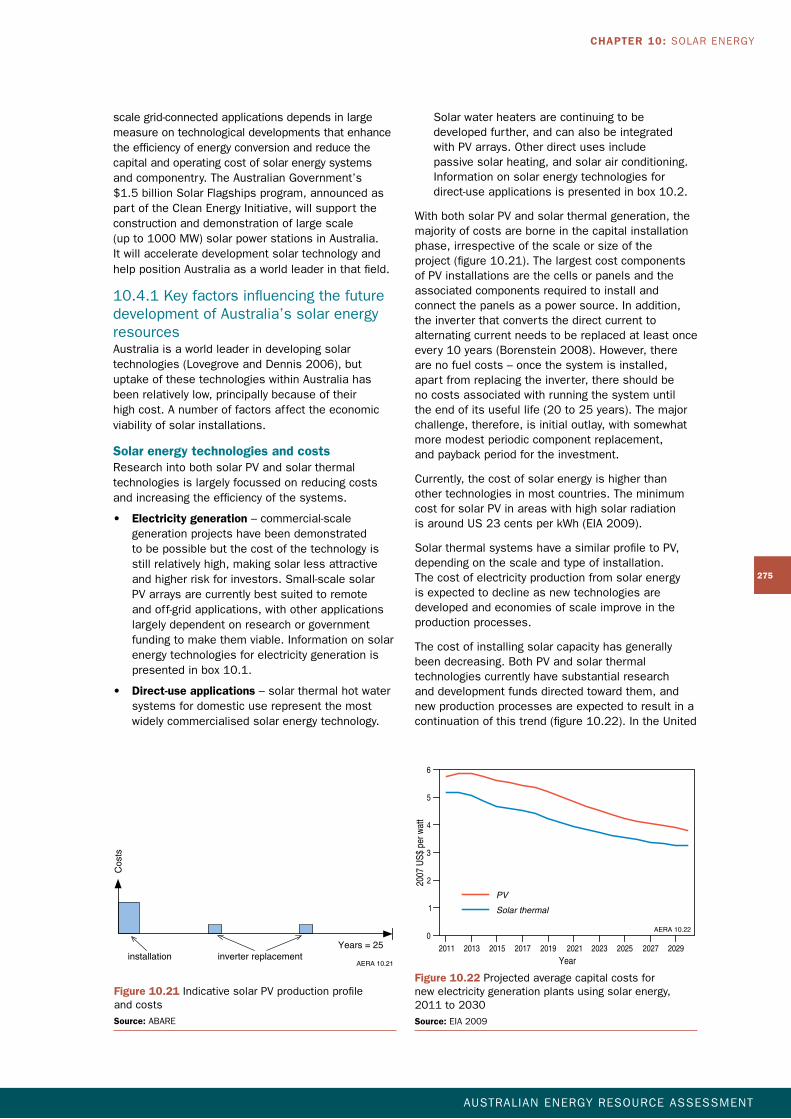
WithbothsolarPVandsolarthermalgeneration,themajorityofcostsareborneinthecapitalinstallationphase,irrespectiveofthescaleorsizeoftheproject(figure10.21).ThelargestcostcomponentsofPVinstallationsarethecellsorpanelsandtheassociatedcomponentsrequiredtoinstallandconnectthepanelsasapowersource.Inaddition,theinverterthatconvertsthedirectcurrenttoalternatingcurrentneedstobereplacedatleastonceevery10years(Borenstein2008).However,therearenofuelcosts–oncethesystemisinstalled,apartfromreplacingtheinverter,thereshouldbenocostsassociatedwithrunningthesystemuntiltheendofitsusefullife(20to25years).Themajorchallenge,therefore,isinitialoutlay,withsomewhatmoremodestperiodiccomponentreplacement, andpaybackperiodfortheinvestment.
Currently,thecostofsolarenergyishigherthan othertechnologiesinmostcountries.TheminimumcostforsolarPVinareaswithhighsolarradiation isaroundUS23centsperkWh(EIA2009).
SolarthermalsystemshaveasimilarprofiletoPV,dependingonthescaleandtypeofinstallation.Thecostofelectricityproductionfromsolarenergyisexpectedtodeclineasnewtechnologiesaredevelopedandeconomiesofscaleimproveintheproductionprocesses.
Thecostofinstallingsolarcapacityhasgenerallybeendecreasing.BothPVandsolarthermaltechnologiescurrentlyhavesubstantialresearch anddevelopmentfundsdirectedtowardthem,andnewproductionprocessesareexpectedtoresultinacontinuationofthistrend(figure10.22).IntheUnited
scalegrid-connectedapplicationsdependsinlargemeasureontechnologicaldevelopmentsthatenhancetheefficiencyofenergyconversionandreducethecapitalandoperatingcostofsolarenergysystems andcomponentry.TheAustralianGovernment’s$1.5billionSolarFlagshipsprogram,announcedaspartoftheCleanEnergyInitiative,willsupporttheconstructionanddemonstrationoflargescale (upto1000MW)solarpowerstationsinAustralia. Itwillacceleratedevelopmentsolartechnologyand helppositionAustraliaasaworldleaderinthatfield.
10.4.1KeyfactorsinfluencingthefuturedevelopmentofAustralia’ssolarenergyresourcesAustraliaisaworldleaderindevelopingsolartechnologies(LovegroveandDennis2006),butuptakeofthesetechnologieswithinAustraliahasbeenrelativelylow,principallybecauseoftheir highcost.Anumberoffactorsaffecttheeconomicviabilityofsolarinstallations.
Solar energy technologies and costsResearchintobothsolarPVandsolarthermaltechnologiesislargelyfocussedonreducingcostsandincreasingtheefficiencyofthesystems.
• Electricity generation–commercial-scalegenerationprojectshavebeendemonstratedtobepossiblebutthecostofthetechnologyisstillrelativelyhigh,makingsolarlessattractiveandhigherriskforinvestors.Small-scalesolarPVarraysarecurrentlybestsuitedtoremoteandoff-gridapplications,withotherapplicationslargelydependentonresearchorgovernmentfundingtomakethemviable.Informationonsolarenergytechnologiesforelectricitygenerationispresentedinbox10.1.
• Direct-use applications–solarthermalhotwatersystemsfordomesticuserepresentthemostwidelycommercialisedsolarenergytechnology.
Cos
ts
Years = 25installation inverter replacement
AERA 10.21
Figure 10.21 IndicativesolarPVproductionprofile and costs
Source: ABARE
PV
Solar thermal
0
1
2
3
4
5
6
2007
US$
per
wat
t
2011 2013 2015 2017 2019 2021 2023 2025 2027 2029
Year
AERA 10.22
Figure 10.22 Projectedaveragecapitalcostsfor newelectricitygenerationplantsusingsolarenergy, 2011to2030
Source: EIA2009
AUSTRALIAN ENERGY RESOURCE ASSESSMENT
276
Stand-alonePVsystemscanbelocatedclosetocustomers(forexampleonroofareasofresidentialbuildings),whichreducesthecostsofelectricitytransmissionanddistribution.However,concentratingsolarthermaltechnologiesrequiremorespecificconditionsandlargeareasofland(Lorenz,PinnerandSeitz2008)whichareoftenonlyavailablelongdistancesfromthecustomersneedingtheenergy. InAustralia,installingsmall-scaleresidentialormediumscalecommercialsystems(bothPVandthermal)canbehighlyattractiveoptionsforremoteareaswhereelectricityinfrastructureisdifficultorcostlytoaccess,andalternativelocalsourcesofelectricityareexpensive.
government policiesGovernmentpolicieshavebeenimplementedatseveralstagesofthesolarenergyproductionchaininAustralia.RebatesprovidedforsolarwaterheatingsystemsandresidentialPVinstallationsreducethecostofthesetechnologiesforconsumersandencouragetheiruptake.
TheSolarHomesandCommunitiesPlan(2000toJune2009)providedrebatesfortheinstallationofsolarPVsystems.ThecapacityofPVsystemsinstalledbyAustralianhouseholdsincreasedsignificantlyunderthisprogram(figure10.23). TheexpandedRETschemeincludestheSolar Creditsinitiative,whichprovidesamultipliedcreditforelectricitygeneratedbysmallsolarPVsystems. Solar Creditsprovidesanup-frontcapitalsubsidytowardstheinstallationofsmallsolarPVsystems.
TheAustralianGovernmenthasalsoannounced $1.5billionofnewfundingforitsSolarFlagshipsprogram.Thisprogramaimstoinstalluptofournewsolarpowerplants,withacombinedpoweroutputofupto1000MW,madeupofbothPVandsolarthermalpowerplants,withthelocationsandtechnologiestobedeterminedbyacompetitivetenderprocess.Theprogramaimstodemonstratenewsolartechnologiesatacommercialscale,therebyacceleratinguptakeofsolarenergyingeneralandprovidingtheopportunityforAustraliatodevelopleadershipinsolarenergytechnology(RET2009b).
TheAustralianGovernmenthasalsoallocatedfundingtoestablishtheAustralianSolarInstitute(ASI),whichwillbebasedinNewcastle.ItwillhavestrongcollaborativelinkswithCSIROandUniversitiesundertakingR&Dinsolartechnologies.TheinstitutewillaimtodrivedevelopmentofsolarthermalandPVtechnologiesinAustralia,includingtheareasofefficiencyandcosteffectiveness(RET2009a).
Othergovernmentpolicies,includingfeed-intariffs,whichareproposedoralreadyinplaceinmostAustralianstatesandterritories,mayalsoencouragetheuptakeofsolarenergy.
States,thecapitalcostofnewPVplantsisprojectedtofallby37percent(inrealterms)from2009to2030(EIA2009).
TheElectricPowerResearchInstitute(EPRI)hasdevelopedestimatesofthelevelisedcostoftechnologya,includingarangeofsolartechnologies,toenablethecomparisonoftechnologiesatdifferentlevelsofmaturity(Chapter2,figures2.18,2.19).Thesolartechnologiesconsideredareparabolictroughs,centralreceiversystems,fixedPVsystemsandtrackingPVsystems.Centralreceiversolarsystemswithstorageareforecasttohavethelowestcostsoftechnologyin2015.AddingstoragetothecentralreceiversystemsortoparabolictroughsisestimatedtodecreasethecostperKWhproduced,asitallowsthesystemtoproduceahigherelectricityoutput.TrackingPVsystemsareforecasttohavethelowestcostoftheoptionsthatdonotincorporatestorage.TheEPRItechnologystatusdatainfigures2.18and2.19showthat,althoughsolartechnologiesremainrelativelyhighcostoptionsthroughouttheoutlookperiod,significantreductionsincostareanticipatedby2030.ThesubstantialglobalRD&D(bygovernmentsandtheprivatesector)intosolartechnologies,includingtheAustralianGovernment’s$1.5billionSolarFlagshipsProgramtosupporttheconstructionanddemonstrationoflargescalesolarpowerstationsinAustralia,isexpectedtoplayakeyroleinacceleratingthedevelopmentanddeploymentofsolarenergy.
Thetimetakentoinstallordevelopasolarsystem ishighlydependentonthesizeandscaleoftheproject.Solarhotwatersystemscanbeinstalledinaroundfourhours.Small-scalePVsystemscansimilarlybeinstalledquiterapidly.However,commercialscaledevelopmentstakeconsiderablylonger,dependingonthetypeofinstallationandotherfactors,includingbroaderlocationorenvironmentalconsiderations.
Location of the resourceInAustralia,thebestsolarresourcesarecommonlydistantfromthenationalelectricitymarket(NEM),especiallythemajorurbancentresontheeasternseaboard.Thisposesachallengefordevelopingnewsolarpowerplants,asthereneedstobeabalancebetweenmaximisingthesolarradiationandminimisingthecostsofconnectivitytotheelectricitygrid.However,thereispotentialforsolarthermalenergyapplicationtoprovidebaseandintermediateloadelectricitywithfossil-fuelplants(suchasgasturbinepowerstations)inareaswithisolatedgridsystemsandgoodinsolationresources.ThereportbytheWyldGroupandMMA(2008)identifiedMountIsa,AliceSprings,TennantCreekandthePilbararegionasareaswiththesecharacteristics.AccesstoAustralia’smajorsolarenergyresources–aswithotherremoterenewableenergysources–islikelytorequireinvestmenttoextendtheelectricitygrid.
a ThisEPRItechnologystatusdataenablesthecomparisonoftechnologiesatdifferentlevelsofmaturity. Itshouldnotbeusedtoforecastmarketandinvestmentoutcomes.
CHAPTER 10: SOLAR ENERGY
AUSTRALIAN ENERGY RESOURCE ASSESSMENT
277
theenergyrequiredtoproduceitovera20yearsystemlifespan(MacKay2009).Inareaswithlesssolarradiation,suchasCentral-NorthernEurope,theenergyyieldratioisestimatedtobearoundfour.Thispositiveenergyyieldratioalsomeansthatgreenhousegasemissionsgeneratedfromtheproductionofsolarenergysystemsaremorethanoffsetoverthesystems’lifecycle,astherearenogreenhousegasemissionsgeneratedfromtheiroperation.
Mostsolarthermalelectricitygenerationsystemsrequirewaterforsteamproductionandthiswateruseaffectstheefficiencyofthesystem.Themajorityofthiswaterisconsumedin‘wetcooling’towers,whichuseevaporativecoolingtocondensethesteamafterithaspassedthroughtheturbine.Inaddition,solarthermalsystemsrequirewatertowashthemirrors,tomaintaintheirreflectivity(Jones2008).Itispossibletouse‘drycooling’towers,whicheliminatemostofthewaterconsumption,butthisreducestheefficiencyofthesteamcyclebyapproximately10percent(Stein2009b).
AfurtheroptionunderdevelopmentistheuseofhightemperatureBraytoncycles,whichdonotusesteamturbinesandthusdonotconsumewater.BraytoncyclesaremoreefficientthanconventionalRankine(steam)cycles,buttheycanonlybeachievedbypoint-focussingsolarthermaltechnologies(powertowersanddishes).
10.4.2OutlookforsolarenergymarketAlthoughsolarenergyismoreabundantinAustraliathanotherrenewableenergysources,plansforexpandingsolarenergyinAustraliagenerallyrelyonsubsidiestobeeconomicallyviable.Therearecurrentlyonlyasmallnumberofproposedcommercialsolarenergyprojects,mostlyofsmallscale.Solarenergyiscurrentlymoreexpensivetoproducethanotherformsofrenewableenergy,suchashydro,windandbiomass(WyldGroupandMMA2008).Intheshortterm,therefore,solarenergywillfinditdifficulttocompetecommerciallywithotherformsofcleanenergyforelectricitygenerationintheNEM.However,asglobaldeploymentofsolarenergytechnologiesincreases,thecostofthetechnologiesislikelytodecrease.Moreover,technologicaldevelopmentsandgreenhousegasemissionreductionpoliciesareexpectedtodriveincreaseduseofsolarenergyinthemediumandlongterm.
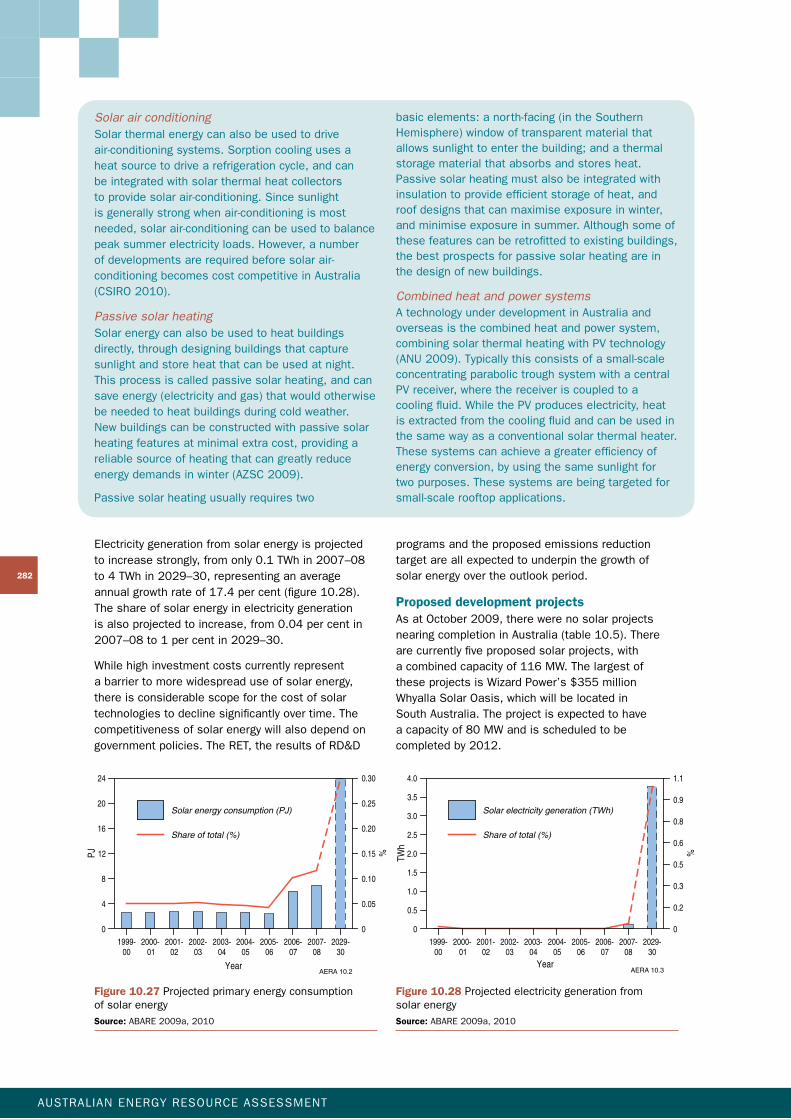
Key projections to 2029–30ABARE’slatest(2010)AustralianenergyprojectionsincludetheRET,a5percentemissionsreductiontarget,andothergovernmentpolicies.SolarenergyuseinAustraliaisprojectedtomorethantriple,from7PJin2007–08to24PJin2029–30,growingatanaveragerateof5.9percentayear(figure10.27,table10.4).Whilesolarwaterheatingisprojectedtoremainthepredominantuseforsolarenergy,theshareofPVintotalsolarenergyuseisprojectedtoincrease.
Infrastructure issuesThelocationoflargescalesolarpowerplants inAustraliawillbeinfluencedbythecostofconnectiontotheelectricitygrid.Intheshortterm,developmentsarelikelytofocusonisolatedgridsystemsornodestotheexistingelectricitygrid, sincethisminimisesinfrastructurecosts.
Inthelongerterm,theextensionofthegridtoaccessremotesolarenergyresourcesindesertregionsmayrequirebuildinglongdistancetransmissionlines.Thetechnologyneededtoachievethisexists:highvoltagedirectcurrent(HVDC)transmissionlinesareabletotransferelectricityoverthousandsofkilometres,withminimallosses.SomeHVDClinesarealreadyinuseinAustralia,andarebeingusedtoforminterstategridconnections;thelongestexamplebeingtheHVDClinkbetweenTasmaniaandVictoria.However,buildingaHVDClinktoasolarpowerstationindesertareaswouldrequirealargeup-frontinvestment.
Theideaofgeneratinglargescalesolarenergyinremotedesertregionshasbeenproposedonamuchlargerscaleinternationally.InJune2009theDESERTECFoundationoutlinedaproposaltobuildlargescalesolarfarmsinthesun-richregionsoftheMiddleEastandNorthernAfrica,andexporttheirpowertoEuropeusinglongdistanceHVDClines. Morerecently,anAsiaPacificSunbeltDevelopmentProjecthasbeenestablishedwiththeaimofmovingsolarenergybywayoffuelratherthanelectricityfromregionssuchasAustraliatothoseAsiancountrieswhoimportenergy,suchasJapanandKorea.Theseprojectsillustratethegrowinginternationalinterestinutilisinglargescalesolarpowerfromremoteandinhospitableareas,despitetheinfrastructurechallengesintransmittingortransportingenergyoverlongdistances.
Environmental issuesAroof-mounted,grid-connectedsolarsysteminAustraliaisestimatedtoyieldmorethanseventimes
0
MW
10
20
30
40
50
2000
Year2001 2002 2003 2004 2005 2006 2007 2008 2009
AERA 10.23
Figure 10.23 ResidentialPVcapacityinstalledundertheSolarHomesandCommunitiesPlan(asofOctober2009)
Source: DEWHA2009
AUSTRALIAN ENERGY RESOURCE ASSESSMENT
278
BOx 10.1SOLARENERGyTECHNOLOGIESFORELECTRICITyGENERATION
Sunlighthasbeenusedforheatingbygeneratingfireforhundredsofyears,butcommercialtechnologiesspecificallytousesolarenergytodirectlyheatwaterorgeneratepowerwerenotdevelopeduntilthe1800s.Solarwaterheatersdevelopedandinstalledbetween1910and1920werethefirstcommercialapplicationofsolarenergy.ThefirstPVcellscapableofconvertingenoughenergyintopowertorunelectricalequipmentwerenotdevelopeduntilthe1950sandthefirstsolarpowerstations(thermalandPV)withcapacityofatleast1megawattstartedoperatinginthe1980s.
Solar thermal electricitySolarthermalelectricityisproducedbyconvertingsunlightintoheat,andthenusingtheheattodrive agenerator.Thesunlightisconcentratedusingmirrors,andfocussedontoasolarreceiver.Thisreceivercontainsaworkingfluidthatabsorbstheconcentratedsunlight,andcanbeheateduptoveryhightemperatures.Heatistransferredfromtheworkingfluidtoasteamturbine,similartothoseusedinfossilfuelandnuclearpowerstations.Alternatively,theheatcanbestoredforlateruse(seebelow).
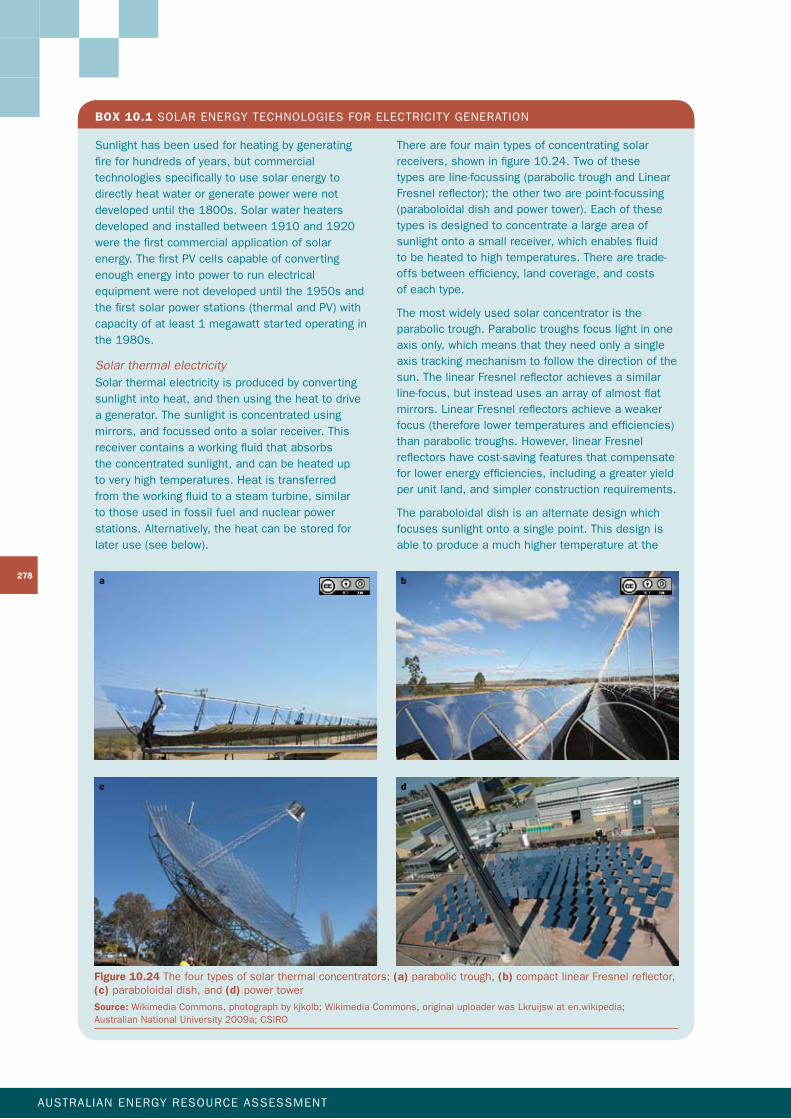
Therearefourmaintypesofconcentratingsolarreceivers,showninfigure10.24.Twoofthesetypesareline-focussing(parabolictroughandLinearFresnelreflector);theothertwoarepoint-focussing(paraboloidaldishandpowertower).Eachofthesetypesisdesignedtoconcentratealargeareaofsunlightontoasmallreceiver,whichenablesfluid tobeheatedtohightemperatures.Therearetrade-offsbetweenefficiency,landcoverage,andcosts ofeachtype.
Themostwidelyusedsolarconcentratoristheparabolictrough.Parabolictroughsfocuslightinoneaxisonly,whichmeansthattheyneedonlyasingleaxistrackingmechanismtofollowthedirectionofthesun.ThelinearFresnelreflectorachievesasimilarline-focus,butinsteadusesanarrayofalmostflatmirrors.LinearFresnelreflectorsachieveaweakerfocus(thereforelowertemperaturesandefficiencies)thanparabolictroughs.However,linearFresnelreflectorshavecost-savingfeaturesthatcompensateforlowerenergyefficiencies,includingagreateryieldperunitland,andsimplerconstructionrequirements.
Theparaboloidaldishisanalternatedesignwhichfocusessunlightontoasinglepoint.Thisdesignisabletoproduceamuchhighertemperatureatthe
Figure 10.24 Thefourtypesofsolarthermalconcentrators: (a)parabolictrough,(b)compactlinearFresnelreflector,(c)paraboloidaldish,and(d)powertower
Source: WikimediaCommons,photographbykjkolb;WikimediaCommons,originaluploaderwasLkruijswaten.wikipedia; AustralianNationalUniversity2009a;CSIRO
a
c
b
d
CHAPTER 10: SOLAR ENERGY
AUSTRALIAN ENERGY RESOURCE ASSESSMENT
279
receiver,whichincreasestheefficiencyofenergyconversion.Theparaboloidaldishhasthegreatestpotentialtobeusedinmodularform,whichmaygivethisdesignanadvantageinoff-gridandremoteapplications.However,tofocusthesunlightontoasinglepoint,paraboloidaldishesneedtotrackthedirectionofsunlightontwoaxes.Thisrequiresamorecomplextrackingmechanism,andismoreexpensivetobuild.Theotherpointfocusingdesignisthe‘powertower’,whichusesaseriesofground-basedmirrorstofocusontoanelevatedcentralreceiver.Powertowermirrorsalsorequiretwo-axistrackingmechanisms;howevertheuseofsmaller,flatmirrorscanreducecosts.
Theparabolictroughhasthemostwidespreadcommercialuse.Anarrayofnineparabolictroughplantsproducingacombined354MWhaveoperatedinCaliforniasincethe1980s.SeveralnewoneshavebeenbuiltinSpainandNevadainthelastfewyearsatarounda50–60MWscale,andtherearemanyparabolictroughplantseitherintheconstructionorplanningphase.Whileparabolictroughshavethemajorityofthecurrentmarketshare,allfourdesignsaregainingrenewedcommercialinterest.Thereisan11MWsolarpowertowerplantoperatinginSpain, andasimilar20MWplanthasrecentlybegunoperatingatthesamelocation.ThelinearFresnelreflectorhasbeendemonstratedonasmallscale(5MW),anda177MWplantisplannedforconstructioninCalifornia.Theparaboloidaldishhasalsobeendemonstratedonasmallscale,andthereareplansforlargescaledishplants.
Methodsofpowerconversionandthermalstoragevaryfromtypetotype.Whilesolarthermalplantsaregenerallysuitedtolargescaleplants(greaterthan 50MW),theparaboloidaldishhasthepotentialto beusedinmodularform.Thismaygivedishsystemsanadvantageinremoteandoff-gridapplications.
Efficiency of solar thermalTheconversionefficiencyofsolarthermalpowerplantsdependsonthetypeofconcentratorused, andtheamountofsunlight.Ingeneral,thepoint-focusingconcentrators(paraboloidaldishandpowertower)canachievehigherefficienciesthanlinefocussingtechnologies(parabolictroughandFresnelreflector).Thisispossiblebecausethepoint-focussingtechnologiesachievehighertemperaturesforhigherthermodynamiclimits.
Thehighestvalueofsolar-to-electricefficiencyeverrecordedforasolarthermalsystemwas31.25percent,usingasolardishinpeaksunlightconditions(Sandia2009).Parabolictroughscanachieveapeaksolar-to-electricefficiencyofover20percent(SEGS2009).However,theconversionefficiencydropssignificantlywhentheradiationdropsinintensity,
sotheannualaverageefficienciesaresignificantlylower.AccordingtoBegay-Campbell(2008),theannualsolar-to-electricefficiencyisapproximately12–14percentforparabolictroughs,12percentforpowertowers(althoughemergingtechnologiescanachieve18–20percent),and22–25percentforparaboloidaldishes.LinearFresnelreflectorsachieveasimilarefficiencytoparabolictroughs,withanannualsolar-to-electricefficiencyofapproximately 12percent(Millsetal.2002).
Energy storageSolarthermalelectricitysystemshavethepotentialtostoreenergyoverseveralhours.Theworkingfluidusedinthesystemcanbeusedtotemporarilystoreheat,andcanbeconvertedintoelectricityafterthesunhasstoppedshining.Thismeansthatsolarthermalplantshavethepotentialtodispatchpoweratpeakdemandtimes.Itshouldbenoted,however,thatperiodsofsustainedcloudyweathercuttheproductivecapacityofsolarthermalpower. Theseasonalityofsunshinealsoreducespoweroutputinwinter.
Thermalstorageisoneofthekeyadvantagesofsolarthermalpower,andcreatesthepotentialforintermediateorbase-loadpowergeneration.Althoughthermalstoragetechnologyisrelativelynew,severalrecentlyconstructedsolarthermalpowerplantshaveincludedthermalstorageofapproximately7hours’powergeneration.Inaddition,therearenewpowertowerdesignsthatincorporateupto16hoursofthermalstorage,allowing24hourpowergenerationinappropriateconditions.Thedevelopmentofcosteffectivestoragetechnologiesmayenableamuchhigheruptakeofsolarthermalpowerinthefuture(WyldGroupandMMA2008).
Currentresearchisdevelopingalternativeenergystoragemethods,includingchemicalstorage,andphase-changematerials.Chemicalstorageoptionsincludedissociatedammoniaandsolar-enhancednaturalgas.Thesenewstoragemethodshavethepotentialtoprovideseasonalstorageofsolarenergy,ortoconvertsolarenergyintoportablefuels.Infuture,itmaybepossibleforsolarfuelstobeusedinthetransportsector,orevenforexportingsolarenergy.
Hybrid operation with fossil fuel plantsSolarthermalpowerplantscanmakeuseof existingturbinetechnologiesthathavebeendevelopedandrefinedovermanydecadesinfossilfueltechnologies.Usingthismaturetechnologycanreducemanufacturingcostsandincreasetheefficiencyofpowergeneration.Inaddition,solarthermalheatcollectorscanbeusedinhybridoperationwithfossilfuelburners.Anumberofexistingsolarthermalpowerplantsusegasburnerstoboostpowersupplyduringlowlevelsofsunlight.
AUSTRALIAN ENERGY RESOURCE ASSESSMENT
280
Combiningsolarthermalpowerwithgascanprovideahedgeagainsttheintermittencyofsunlight.
Solarthermalheatcollectorscanbeattachedtoexistingcoalorgaspowerstationstopre-heatthewaterusedintheseplants.Thisispossiblesincesolarthermalheatcollectorsperformaverysimilarfunctiontofossilfuelburners.Inthisway,solarthermalpowercanmakeuseofexistinginfrastructure.Thisoptionisnotaffectedbyintermittencyofsunlight,sincethefossilfuelburnersprovidefirmcapacityofproduction.Internationally,thereareseveralnewintegratedsolarcombinedcycle(ISCC)plantsplannedforconstruction.ISCCplantsaresimilartocombinedcyclegasplants(usingbothagasturbine,andasteamturbine),butusesolarthermalheatcollectorstoboostthesteamturbineproduction.
Solar updraft towersAnalternativesolarthermalpowertechnologyisthesolarupdrafttower,alsoknownasasolarchimney.Theupdrafttowercapturessolarenergyusingalargegreenhouse,whichheatsairbeneathatransparentroof.Averytallchimneyisplacedatthecentreofthegreenhouse,andtheheatedaircreatespressuredifferencesthatdriveairflowupthechimney.Electricityisgeneratedfromtheairflowusingwindturbinesatthebaseofthechimney.
Solarupdrafttowershavebeentestedatarelativelysmallscale,witha50kWplantinSpainbeingtheonlyworkingprototypeatpresent.Thereareplanstoupscalethistechnology,includingaproposed200MWplantinBuronga,NSW.ThemaindisadvantageofsolarupdrafttowersisthattheydeliversignificantlylesspowerperunitareathanconcentratingsolarthermalandPVsystems(Enviromission2009).
Photovoltaic systemsThecostsofproducingPVcellshasdeclinedrapidlyinrecentyearsasuptakehasincreased(Fthenakis
etal.2009)andanumberofPVtechnologieshave
beendeveloped.Thecostofmodulescanbereduced
infourmainways:
• makingthinnerlayers–reducingmaterialand
processingcosts;
• integratingPVpanelswithbuildingelementssuch
asglassandroofs–reducingoverallsystem
costs;
• makingadhesiveonsite–reducingmaterials
costs;and
• improvingdecisionsaboutmakingorbuying
inputs,increasingeconomiesofscale,and
improvingthedesignofPVmodules.
TherearethreemaintypesofPVtechnology:
crystallinesilicon,thin-filmandconcentratingPV.
Crystallinesiliconistheoldestandmostwidespread
technology.Thesecellsarebecomingmoreefficient
overtime,andcostshavefallensteadily.
Thin-filmPVisanemerginggroupoftechnologies,
targetedatreducingcostsofPVcells.Thin-filmPV
isatanearlierstageofdevelopment,andcurrently
deliversalowerefficiencythancrystallinesilicon,
estimatedataround10percent,althoughmany
ofthenewervarietiesstilldeliverefficienciesof
lessthanthis(Prowse2009).However,thisis
compensatedbylowercosts,andtherearestrong
prospectsforefficiencyimprovementsinthefuture.
Thin-filmPVcanbeinstalledonmanydifferent
substrates,givingitgreatflexibilityinitsapplications.
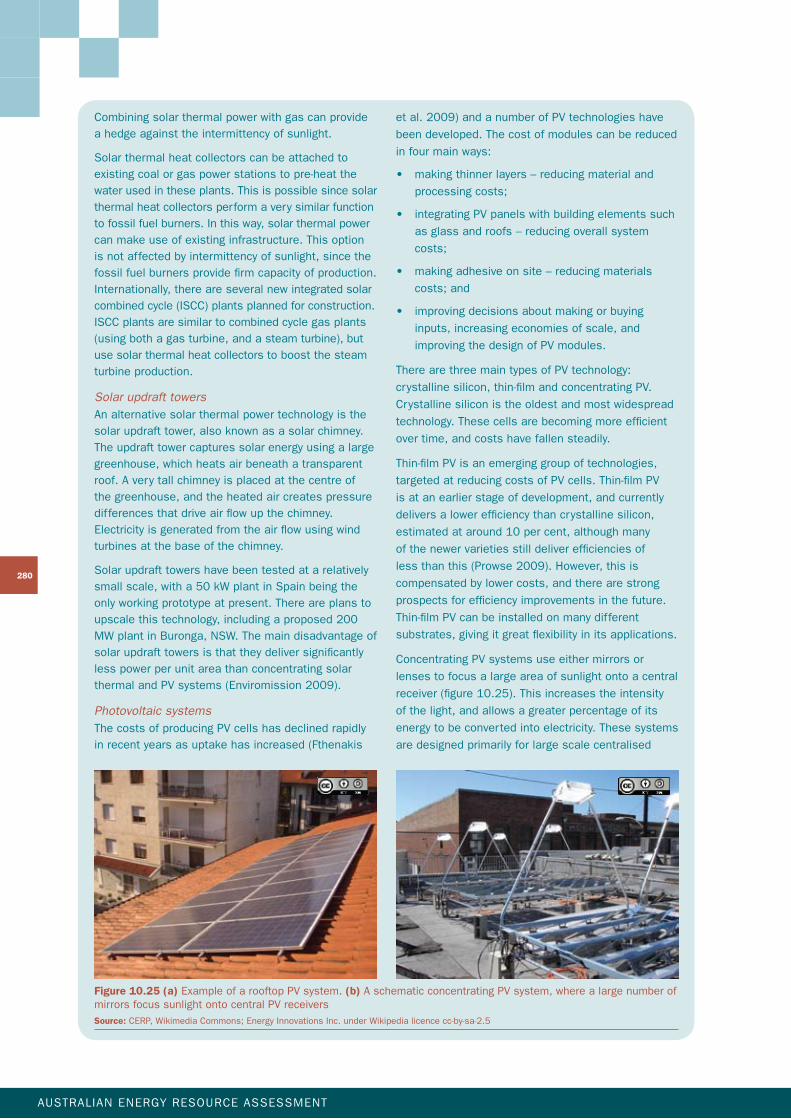
ConcentratingPVsystemsuseeithermirrorsor
lensestofocusalargeareaofsunlightontoacentral
receiver(figure10.25).Thisincreasestheintensity
ofthelight,andallowsagreaterpercentageofits
energytobeconvertedintoelectricity.Thesesystems
aredesignedprimarilyforlargescalecentralised
Figure 10.25 (a)ExampleofarooftopPVsystem. (b)AschematicconcentratingPVsystem,wherealargenumberofmirrorsfocussunlightontocentralPVreceivers
Source: CERP,WikimediaCommons;EnergyInnovationsInc.underWikipedialicencecc-by-sa-2.5
CHAPTER 10: SOLAR ENERGY
AUSTRALIAN ENERGY RESOURCE ASSESSMENT
281
power,duetothecomplexitiesofthereceivers.ConcentratingPVisthemostefficientformofPV,deliveringatypicalsystemefficiencyofaround 20percent,andhasachievedefficienciesofjustover40percentinideallaboratoryconditions(NREL2008).
AnadvantageofusingconcentratingPVisthatitreducestheareaofsolarcellsneededtocapture thesunlight.PVcellsareoftenexpensivetoproduce,andthemirrorsorlensesusedtoconcentratethelightaregenerallycheaperthanthecells.However,theuseofsolarconcentratorsgenerallyrequiresalargersystemthatcannotbescaleddownaseasilyasflat-platePVcells.
ArelativelyrecentareaofgrowthforPVapplicationsisinBuilding-integratedPV(BIPV)systems.BIPVsystemsincorporatePVtechnologyintomanydifferentcomponentsofanewbuilding.Thesecomponentsincluderooftops,wallsandwindows,
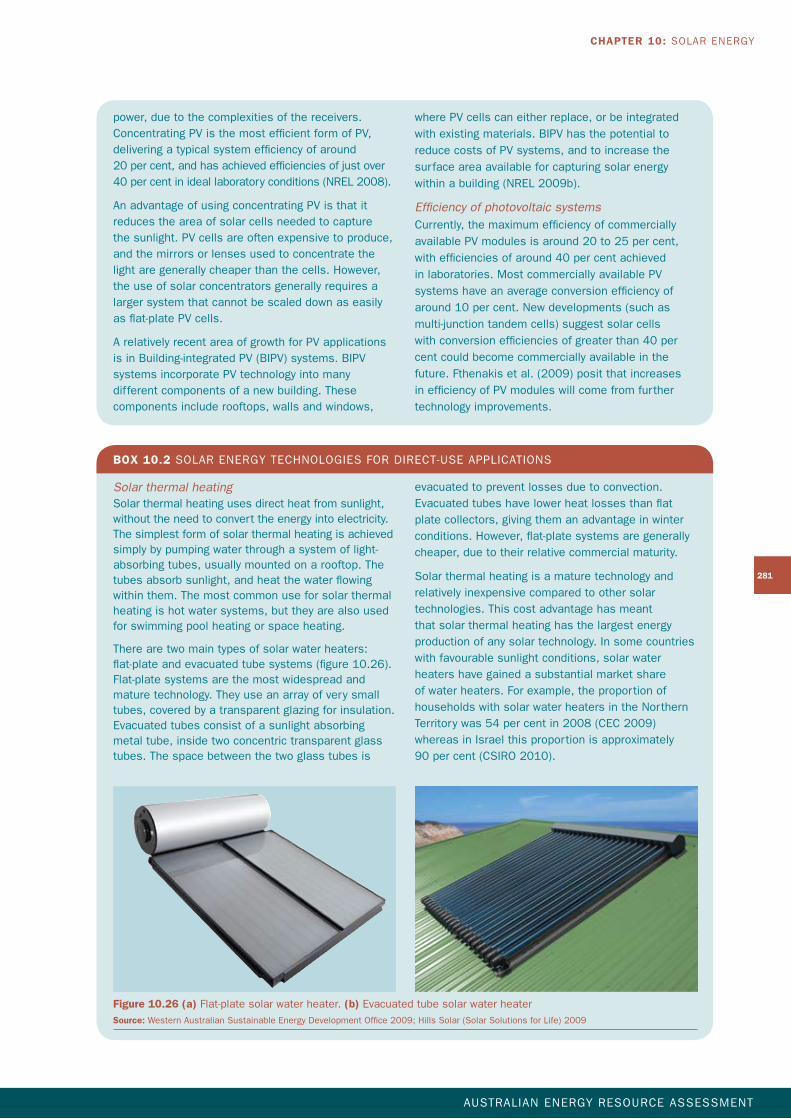
Solar thermal heatingSolarthermalheatingusesdirectheatfromsunlight,withouttheneedtoconverttheenergyintoelectricity.Thesimplestformofsolarthermalheatingisachievedsimplybypumpingwaterthroughasystemoflight-absorbingtubes,usuallymountedonarooftop.Thetubesabsorbsunlight,andheatthewaterflowingwithinthem.Themostcommonuseforsolarthermalheatingishotwatersystems,buttheyarealsousedforswimmingpoolheatingorspaceheating.
Therearetwomaintypesofsolarwaterheaters:flat-plateandevacuatedtubesystems(figure10.26).Flat-platesystemsarethemostwidespreadandmaturetechnology.Theyuseanarrayofverysmalltubes,coveredbyatransparentglazingforinsulation.Evacuatedtubesconsistofasunlightabsorbingmetaltube,insidetwoconcentrictransparentglasstubes.Thespacebetweenthetwoglasstubesis
BOx 10.2SOLARENERGyTECHNOLOGIESFORDIRECT-USEAPPLICATIONS
evacuatedtopreventlossesduetoconvection.Evacuatedtubeshavelowerheatlossesthanflatplatecollectors,givingthemanadvantageinwinterconditions.However,flat-platesystemsaregenerallycheaper,duetotheirrelativecommercialmaturity.
Solarthermalheatingisamaturetechnologyandrelativelyinexpensivecomparedtoothersolartechnologies.Thiscostadvantagehasmeantthatsolarthermalheatinghasthelargestenergyproductionofanysolartechnology.Insomecountrieswithfavourablesunlightconditions,solarwaterheatershavegainedasubstantialmarketshareofwaterheaters.Forexample,theproportionofhouseholdswithsolarwaterheatersintheNorthernTerritorywas54percentin2008(CEC2009)whereasinIsraelthisproportionisapproximately 90percent(CSIRO2010).
wherePVcellscaneitherreplace,orbeintegratedwithexistingmaterials.BIPVhasthepotentialtoreducecostsofPVsystems,andtoincreasethesurfaceareaavailableforcapturingsolarenergywithinabuilding(NREL2009b).
Efficiency of photovoltaic systemsCurrently,themaximumefficiencyofcommerciallyavailablePVmodulesisaround20to25percent,withefficienciesofaround40percentachievedinlaboratories.MostcommerciallyavailablePVsystemshaveanaverageconversionefficiencyofaround10percent.Newdevelopments(suchasmulti-junctiontandemcells)suggestsolarcellswithconversionefficienciesofgreaterthan40percentcouldbecomecommerciallyavailableinthefuture.Fthenakisetal.(2009)positthatincreasesinefficiencyofPVmoduleswillcomefromfurthertechnologyimprovements.
Figure 10.26 (a)Flat-platesolarwaterheater. (b)EvacuatedtubesolarwaterheaterSource: WesternAustralianSustainableEnergyDevelopmentOffice2009;HillsSolar(SolarSolutionsforLife)2009
AUSTRALIAN ENERGY RESOURCE ASSESSMENT
282
Solar air conditioningSolarthermalenergycanalsobeusedtodriveair-conditioningsystems.Sorptioncoolingusesaheatsourcetodrivearefrigerationcycle,andcanbeintegratedwithsolarthermalheatcollectorstoprovidesolarair-conditioning.Sincesunlightisgenerallystrongwhenair-conditioningismostneeded,solarair-conditioningcanbeusedtobalancepeaksummerelectricityloads.However,anumberofdevelopmentsarerequiredbeforesolarair-conditioningbecomescostcompetitiveinAustralia(CSIRO2010).
Passive solar heatingSolarenergycanalsobeusedtoheatbuildingsdirectly,throughdesigningbuildingsthatcapturesunlightandstoreheatthatcanbeusedatnight.Thisprocessiscalledpassivesolarheating,andcansaveenergy(electricityandgas)thatwouldotherwisebeneededtoheatbuildingsduringcoldweather.Newbuildingscanbeconstructedwithpassivesolarheatingfeaturesatminimalextracost,providingareliablesourceofheatingthatcangreatlyreduceenergydemandsinwinter(AZSC2009).
Passivesolarheatingusuallyrequirestwo
0
4
8
12
16
20
24
PJ
0
0.30
0.25
0.20
0.15
0.10
0.05
%
Share of total (%)
Solar energy consumption (PJ)
1999-00
2000-01
2001-02
2002-03
2003-04
2004-05
2005-06
2006-07
2007-08
2029-30
AERA 10.2Year
%
AERA 10.3
0
4.0
3.5
3.0
2.5
2.0
1.5
1.0
0.5
1.1
0.9
0.8
0.6
0.5
0.3
0.2
01999-
002000-
012001-
022002-
032003-
042004-
052005-
062006-
072007-
082029-
30
TWh
Share of total (%)
Solar electricity generation (TWh)
Year
Figure 10.27 Projectedprimaryenergyconsumption ofsolarenergy
Source: ABARE2009a,2010
Figure 10.28 Projectedelectricitygenerationfrom solar energy
Source: ABARE2009a,2010
basicelements:anorth-facing(intheSouthernHemisphere)windowoftransparentmaterialthatallowssunlighttoenterthebuilding;andathermalstoragematerialthatabsorbsandstoresheat.Passivesolarheatingmustalsobeintegratedwithinsulationtoprovideefficientstorageofheat,androofdesignsthatcanmaximiseexposureinwinter,andminimiseexposureinsummer.Althoughsomeofthesefeaturescanberetrofittedtoexistingbuildings,thebestprospectsforpassivesolarheatingareinthedesignofnewbuildings.
Combined heat and power systemsAtechnologyunderdevelopmentinAustraliaandoverseasisthecombinedheatandpowersystem,combiningsolarthermalheatingwithPVtechnology(ANU2009).Typicallythisconsistsofasmall-scaleconcentratingparabolictroughsystemwithacentralPVreceiver,wherethereceiveriscoupledtoacoolingfluid.WhilethePVproduceselectricity,heatisextractedfromthecoolingfluidandcanbeusedinthesamewayasaconventionalsolarthermalheater.Thesesystemscanachieveagreaterefficiencyofenergyconversion,byusingthesamesunlightfortwopurposes.Thesesystemsarebeingtargetedforsmall-scalerooftopapplications.
programsandtheproposedemissionsreductiontargetareallexpectedtounderpinthegrowthofsolarenergyovertheoutlookperiod.
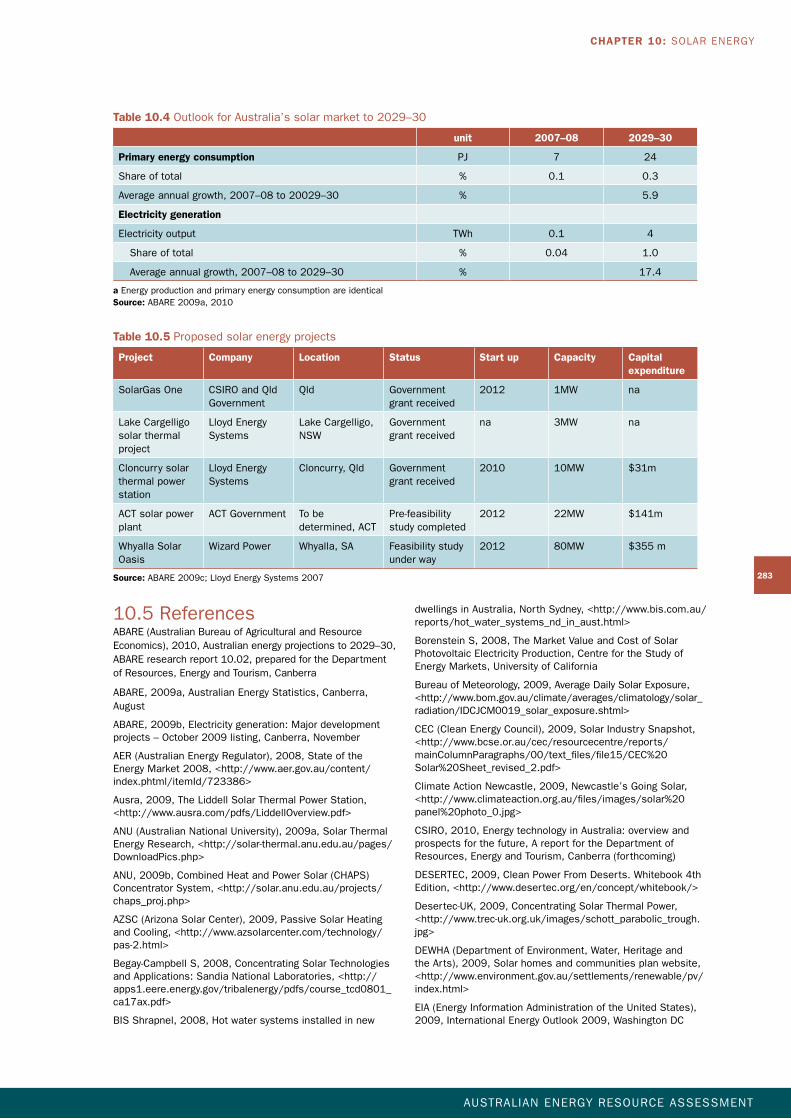
Proposed development projectsAsatOctober2009,therewerenosolarprojectsnearingcompletioninAustralia(table10.5).Therearecurrentlyfiveproposedsolarprojects,withacombinedcapacityof116MW.ThelargestoftheseprojectsisWizardPower’s$355millionWhyallaSolarOasis,whichwillbelocatedinSouthAustralia.Theprojectisexpectedtohaveacapacityof80MWandisscheduledtobecompletedby2012.
Electricitygenerationfromsolarenergyisprojectedtoincreasestrongly,fromonly0.1TWhin2007–08to4TWhin2029–30,representinganaverageannualgrowthrateof17.4percent(figure10.28).Theshareofsolarenergyinelectricitygenerationisalsoprojectedtoincrease,from0.04percentin2007–08to1percentin2029–30.
Whilehighinvestmentcostscurrentlyrepresentabarriertomorewidespreaduseofsolarenergy,thereisconsiderablescopeforthecostofsolartechnologiestodeclinesignificantlyovertime.Thecompetitivenessofsolarenergywillalsodependongovernmentpolicies.TheRET,theresultsofRD&D
CHAPTER 10: SOLAR ENERGY
AUSTRALIAN ENERGY RESOURCE ASSESSMENT
283
Table 10.5 Proposedsolarenergyprojects
Project Company Location Status Start up Capacity Capital expenditure
SolarGasOne CSIROandQldGovernment
Qld Governmentgrantreceived
2012 1MW na
LakeCargelligosolarthermalproject
LloydEnergySystems
LakeCargelligo,NSW
Governmentgrantreceived
na 3MW na
Cloncurrysolarthermalpowerstation
LloydEnergySystems
Cloncurry,Qld Governmentgrantreceived
2010 10MW $31m
ACTsolarpowerplant
ACTGovernment Tobedetermined,ACT
Pre-feasibilitystudycompleted
2012 22MW $141m
WhyallaSolarOasis
WizardPower Whyalla,SA Feasibilitystudyunderway
2012 80MW $355m
Source: ABARE2009c;LloydEnergySystems2007
Table 10.4 OutlookforAustralia’ssolarmarketto2029–30
unit 2007–08 2029–30
Primary energy consumption PJ 7 24
Shareoftotal % 0.1 0.3
Averageannualgrowth,2007–08to20029–30 % 5.9
Electricity generation
Electricityoutput TWh 0.1 4
Shareoftotal % 0.04 1.0
Averageannualgrowth,2007–08to2029–30 % 17.4
a Energyproductionandprimaryenergyconsumptionareidentical Source: ABARE2009a,2010
10.5ReferencesABARE(AustralianBureauofAgriculturalandResourceEconomics),2010,Australianenergyprojectionsto2029–30,ABAREresearchreport10.02,preparedfortheDepartmentofResources,EnergyandTourism,Canberra
ABARE,2009a,AustralianEnergyStatistics,Canberra,August
ABARE,2009b,Electricitygeneration:Majordevelopmentprojects–October2009listing,Canberra,November
AER(AustralianEnergyRegulator),2008,StateoftheEnergyMarket2008,<http://www.aer.gov.au/content/index.phtml/itemId/723386>
Ausra,2009,TheLiddellSolarThermalPowerStation,<http://www.ausra.com/pdfs/LiddellOverview.pdf>
ANU(AustralianNationalUniversity),2009a,SolarThermalEnergyResearch,<http://solar-thermal.anu.edu.au/pages/DownloadPics.php>
ANU,2009b,CombinedHeatandPowerSolar(CHAPS)ConcentratorSystem,<http://solar.anu.edu.au/projects/chaps_proj.php>
AZSC(ArizonaSolarCenter),2009,PassiveSolarHeating andCooling,<http://www.azsolarcenter.com/technology/pas-2.html>
Begay-CampbellS,2008,ConcentratingSolarTechnologiesandApplications:SandiaNationalLaboratories,<http://apps1.eere.energy.gov/tribalenergy/pdfs/course_tcd0801_ca17ax.pdf>
BISShrapnel,2008,Hotwatersystemsinstalledinnew
dwellingsinAustralia,NorthSydney,<http://www.bis.com.au/reports/hot_water_systems_nd_in_aust.html>
BorensteinS,2008,TheMarketValueandCostofSolarPhotovoltaicElectricityProduction,CentrefortheStudyofEnergyMarkets,UniversityofCalifornia
BureauofMeteorology,2009,AverageDailySolarExposure,<http://www.bom.gov.au/climate/averages/climatology/solar_radiation/IDCJCM0019_solar_exposure.shtml>
CEC(CleanEnergyCouncil),2009,SolarIndustrySnapshot,<http://www.bcse.or.au/cec/resourcecentre/reports/mainColumnParagraphs/00/text_files/file15/CEC%20Solar%20Sheet_revised_2.pdf>
ClimateActionNewcastle,2009,Newcastle’sGoingSolar,<http://www.climateaction.org.au/files/images/solar%20panel%20photo_0.jpg>
CSIRO,2010,EnergytechnologyinAustralia:overviewandprospectsforthefuture,AreportfortheDepartmentofResources,EnergyandTourism,Canberra(forthcoming)
DESERTEC,2009,CleanPowerFromDeserts.Whitebook4thEdition,<http://www.desertec.org/en/concept/whitebook/>
Desertec-UK,2009,ConcentratingSolarThermalPower,<http://www.trec-uk.org.uk/images/schott_parabolic_trough.jpg>
DEWHA(DepartmentofEnvironment,Water,HeritageandtheArts),2009,Solarhomesandcommunitiesplanwebsite,<http://www.environment.gov.au/settlements/renewable/pv/index.html>
EIA(EnergyInformationAdministrationoftheUnitedStates),2009,InternationalEnergyOutlook2009,WashingtonDC
AUSTRALIAN ENERGY RESOURCE ASSESSMENT
284
Enviromission,2009,TechnologyOverview,<http://www.enviromission.com.au/EVM/content/technology_technologyover.html>
EPIA(EuropeanPhotovoltaicIndustryAssociation),2009,GlobalMarketOutlookforPhotovoltaicsUntil2013, <http://www.epia.org/publications/epia-publications.html>
FthenakisV,MasonJEandZweibelK,2009,Thetechnical,geographical,andeconomicfeasibilityforsolarenergytosupplytheenergyneedsoftheUS,EnergyPolicy,vol37, no2,387–399
GeoscienceAustralia,2009,RenewableEnergyPowerStations,<http://www.ga.gov.au/renewable/operating/operating_renewable.xls>
Greenpeace,2009,ConcentratingSolarPower,GlobalOutlook09,<http://www.greenpeace.org/international/press/reports/concentrating-solar-power-2009>
IEA(InternationalEnergyAgency),2003,GreenhouseGasResearchandDevelopmentProgramme–ThepotentialofsolarelectricitytoreduceCO
2emissions,Paris
IEA,2009a,WorldEnergyOutlook2009,Paris
IEA,2009b,WorldEnergyBalances,2009,Paris
IEA-PVPS,2008,TrendsinPhotovoltaicApplications:SurveyreportofselectedIEAcountriesbetween1992and2007,IEAPhotovoltaicPowerSystemsProgramme
JiaxingDyiSolarEnergyCo,2009,SolarWaterHeater-1,<http://jxdiyi.en.made-in-china.com/product/sqdnACbhfQDM/China-Flat-Solar-Water-Heater-1.html>
JonesJ,2008,ConcentratingSolarThermalPower,RenewableEnergyWorldMagazine
LloydEnergySystems,2007,CloncurrySolarThermalStorageProject,<http://www.lloydenergy.com/presentations/Cloncurry%20Solar%20Thermal%20Storage%20Project.pdf>
LorenzP,PinnerDandSeitzT,2008,TheEconomicsofSolarPower.TheMcKinseyQuarterly,June2008
LovegroveKandDennisM,2006,SolarthermalenergysystemsinAustralia.InternationalJournalofEnvironmentalStudies.63(6):791–802
MacKayDJC,2009,SustainableEnergy–WithouttheHotAir.UIT,Cambridge,<http://www.withouthotair.com/>
McKinsey&Company,2008,TheEconomicsofSolarPower,inMcKinseyQuarterly,June2008,<http://www.mckinseyquarterly.com>
MillsD,MorrisonGandLeLievreP,2002,ProjectProposalforaCompactLinearFresnelReflectorSolarThermalPlantintheHunterValley,<http://solar1.mech.unsw.edu.au/glm/papers/Mills_projectproposal_newcastle.pdf>
NationalAeronauticsandSpaceAdministration(NASA),2009,SurfaceMeteorologyandSolarEnergyDataset,<http://eosweb.larc.nasa.gov/sse>
NREL,2009a,PhotographicInformationExchange, <http://www.nrel.gov/data/pix/searchpix.html>
NREL,2009b,PhotovoltaicResearch–Building-IntegratedPV,<http://www.nrel.gov/pv/building_integrated_pv.html>
ProwseR,2009,Personalcommunication,5/6/2009.CentreManager,CentreforSustainableEnergySystems,AustralianNationalUniversity
RET(DepartmentofResources,EnergyandTourism),2009a,AustralianSolarInstituteFactSheet,<http://www.ret.gov.au/energy/Documents/ASI%20Fact%20sheet%2014Jan%20cleared%20by%20MO.pdf>
RET,2009b,SolarFlagshipsProgramFactSheet,<http://www.ret.gov.au/energy/Documents/Solar%20Flagships%20factsheet%20-%20Oct%202009.pdf>
Sandia,2009,LabAccomplishments2009:SandiaNationalLaboratories,<http://www.sandia.gov/LabNews/labs-accomplish/2009/lab_accomplish-2009.pdf>
SEGS,2009,SolarElectricityGeneratingSystemswebsite,<http://www.flagsol.com/SEGS_tech.htm>
Sellsius,2006,TheWorld’sMostEfficientSolarEnergy,<http://blog.sellsiusrealestate.com/technology/the-worlds-most-efficient-solar-energy/2006/08/06/>
SolarSystems,2009,154MWVictorianProject,<http://www.solarsystems.com.au/154MWVictorianProject.html>
SolarTubeCompany,2009,SolarWaterHeatingSystem,<http://www.solartubecompany.co.uk/solar-water-heating/>
SteinW,2009a,personalcommunication,4/8/2009.Manager,NationalSolarEnergyCentre,CSIRODivisionofEnergyTechnology
SteinW,2009b,personalcommunication,3/11/2009.Manager,NationalSolarEnergyCentre,CSIRODivisionofEnergyTechnology
SunwizeTechnologies,2008,SunWizeWorldInsolationMap,<http://www.sunwize.com/info_center/solar-insolation-map.php>
WattM,2009,NationalSurveyReportofPVPowerApplicationsinAustralia2008:AustralianPVAssociation
WEC(WorldEnergyCouncil),2007,SurveyofEnergyResources2007,London,September2007,<http://www.worldenergy.org/pugblications/survey_of_energy_resources_2007/default.asp>
WEC,2009,Surveyofenergyresources:Interimupdate2009.London,July2009,<http://www.worldenergy.org/publications/survey_of_energy_resources_interim_update_2009/default.asp>
WyldGroupandMMA,2008,HighTemperatureSolarThermalTechnologyRoadmap.PreparedfortheNSWandVictorianGovernmentsbyWyldGroupandMcLennanMagasanikAssociates,<http://www.coag.gov.au/reports/docs/HTSolar_thermal_roadmap.pdf>