Chapter 10. Bridge Structures
108
Toma, S.; Duan, L. and Chen, W.F. “Bridge Structures” Structural Engineering Handbook Ed. Chen Wai-Fah Boca Raton: CRC Press LLC, 1999
Transcript of Chapter 10. Bridge Structures

Toma, S.; Duan, L. and Chen, W.F. “Bridge Structures”Structural Engineering HandbookEd. Chen Wai-FahBoca Raton: CRC Press LLC, 1999

Bridge Structures
Shouji TomaDepartment of Civil Engineering,Hokkai-Gakuen University, Sapporo, Japan
Lian DuanDivision of Structures, CaliforniaDepartment of Transportation, Sacramento,CA
Wai-Fah ChenSchool of Civil Engineering,Purdue University,West Lafayette, IN
10.1 General10.2 Steel Bridges10.3 Concrete Bridges10.4 Concrete Substructures10.5 Floor System10.6 Bearings, Expansion Joints, and Railings10.7 Girder Bridges10.8 Truss Bridges10.9 Rigid Frame Bridges (Rahmen Bridges)10.10Arch Bridges10.11Cable-Stayed Bridges10.12Suspension Bridges10.13Defining TermsAcknowledgmentReferencesFurther ReadingAppendix: Design Examples
10.1 General
10.1.1 Introduction
A bridge is a structure that crosses over a river, bay, or other obstruction, permitting the smooth andsafe passage of vehicles, trains, and pedestrians. An elevation view of a typical bridge is shown inFigure 10.1. A bridge structure is divided into an upper part (the superstructure), which consists ofthe slab, the floor system, and the main truss or girders, and a lower part (the substructure), which arecolumns, piers, towers, footings, piles, and abutments. The superstructure provides horizontal spanssuch as deck and girders and carries traffic loads directly. The substructure supports the horizontalspans, elevating above the ground surface. In this chapter, main structural features of commontypes of steel and concrete bridges are discussed. Two design examples, a two-span continuous,cast-in-place, prestressed concrete box girder bridge and a three-span continuous, composite plategirder bridge, are given in the Appendix.
c©1999 by CRC Press LLC
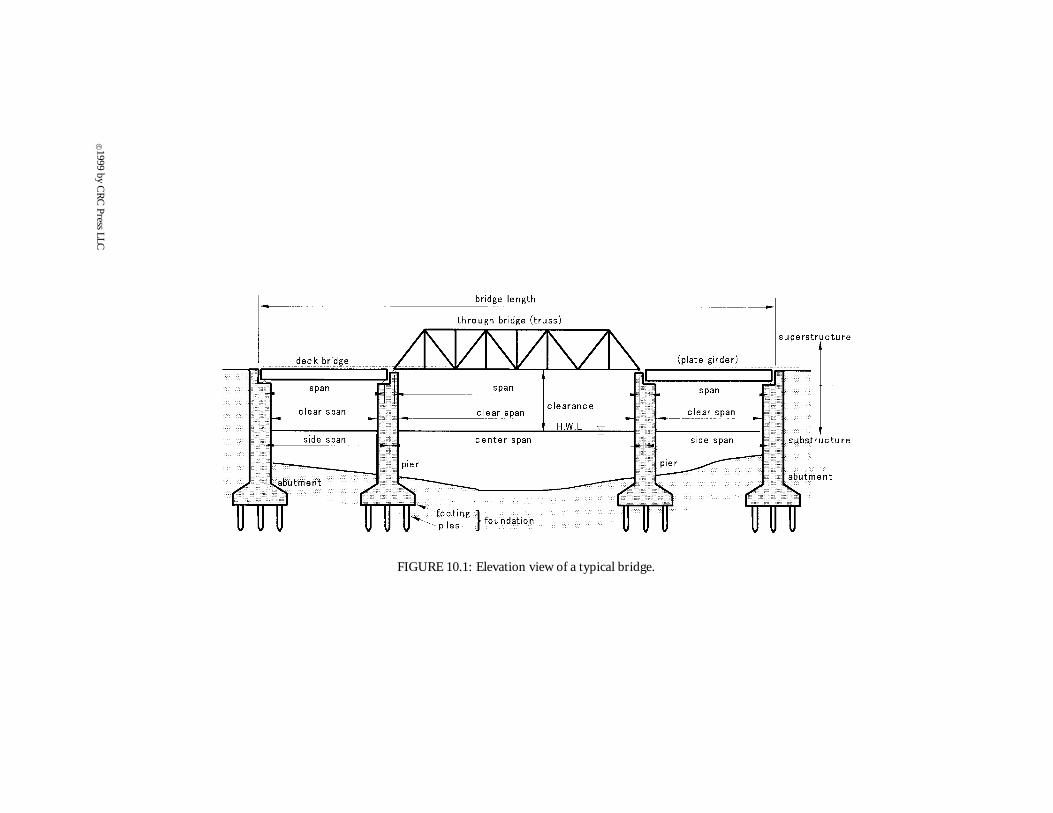
FIGURE 10.1: Elevation view of a typical bridge.
c© 1999by
CR
CPress
LLC

10.1.2 Classification
1. Classification by Materials
Steel bridges: A steel bridge may use a wide variety of structural steel componentsand systems: girders, frames, trusses, arches, and suspension cables.
Concrete bridges: There are two primary types of concrete bridges: reinforced andprestressed.
Timber bridges: Wooden bridges are used when the span is relatively short.
Metal alloy bridges: Metal alloys such as aluminum alloy and stainless steel are alsoused in bridge construction.
2. Classification by Objectives
Highway bridges: bridges on highways.
Railway bridges: bridges on railroads.
Combined bridges: bridges carrying vehicles and trains.
Pedestrian bridges: bridges carrying pedestrian traffic.
Aqueduct bridges: bridges supporting pipes with channeled waterflow.
Bridges can alternatively be classified into movable (for ships to pass the river) or fixedand permanent or temporary categories.
3. Classification by Structural System (Superstructures)
Plate girder bridges: The main girders consist of a plate assemblage of upper andlower flanges and a web. H- or I-cross-sections effectively resist bending and shear.
Box girder bridges: The single (or multiple) main girder consists of a box beamfabricated from steel plates or formed from concrete, which resists not only bendingand shear but also torsion effectively.
T-beam bridges: A number of reinforced concrete T-beams are placed side by sideto support the live load.
Composite girder bridges: The concrete deck slab works in conjunction with the steelgirders to support loads as a united beam. The steel girder takes mainly tension,while the concrete slab takes the compression component of the bending moment.
Grillage girder bridges: The main girders are connected transversely by floor beamsto form a grid pattern which shares the loads with the main girders.
Truss bridges: Truss bar members are theoretically considered to be connected withpins at their ends to form triangles. Each member resists an axial force, eitherin compression or tension. Figure 10.1 shows a Warren truss bridge with verticalmembers, which is a “trough bridge”, i.e., the deck slab passes through the lowerpart of the bridge. Figure 10.2 shows a comparison of the four design alternativesevaluated for Minato Oh-Hasshi in Osaka, Japan. The truss frame design wasselected.
Arch bridges: The arch is a structure that resists load mainly in axial compression.In ancient times stone was the most common material used to construct magnif-icent arch bridges. There is a wide variety of arch bridges as will be discussed inSection 10.10
c©1999 by CRC Press LLC

FIGURE 10.2: Design comparison for Minato Oh-Hashi, Japan. (From Hanshin Expressway PublicCorporation, Construction Records of Minato Oh-Hashi, Japan Society of Civil Engineers, Tokyo [inJapanese], 1975. With permission.)
Cable-stayed bridges: The girders are supported by highly strengthened cables (oftencomposed of tightly bound steel strands) which stem directly from the tower. Theseare most suited to bridge long distances.
Suspension bridges: The girders are suspended by hangers tied to the main cableswhich hang from the towers. The load is transmitted mainly by tension in cable.
c©1999 by CRC Press LLC

This design is suitable for very long span bridges.
Table 10.1 shows the span lengths appropriate to each type of bridge.
4. Classification by Support ConditionFigure 10.3 shows three different support conditions for girder bridges.
Simply supported bridges: The main girders or trusses are supported by a movablehinge at one end and a fixed hinge at the other (simple support); thus they can beanalyzed using only the conditions of equilibrium.
Continuously supported bridges: Girders or trusses are supported continuously bymore than three supports, resulting in a structurally indeterminate system. Thesetend to be more economical since fewer expansion joints, which have a commoncause of service and maintenance problems, are needed. Sinkage at the supportsmust be avoided.
Gerber bridges (cantilever bridge): A continuous bridge is rendered determinateby placing intermediate hinges between the supports. Minato Oh-Hashi’s bridge,shown in Figure 10.2a, is an example of a Gerber truss bridge.
10.1.3 Plan
Before the structural design of a bridge is considered, a bridge project will start with planning thefundamental design conditions. A bridge plan must consider the following factors:
1. Passing Line and LocationA bridge, being a continuation of a road, does best to follow the line of the road. A rightangle bridge is easy to design and construct but often forces the line to be bent. A skewedbridge or a curved bridge is commonly required for expressways or railroads where theroad line must be kept straight or curved, even at the cost of a more difficult design (seeFigure 10.4).
2. WidthThe width of a highway bridge is usually defined as the width of the roadway plus that ofthe sidewalk, and often the same dimension as that of the approaching road.
3. Type of Structure and Span LengthThe types of substructures and superstructures are determined by factors such as thesurrounding geographical features, the soil foundation, the passing line and its width, thelength and span of the bridge, aesthetics, the requirement for clearance below the bridge,transportation of the construction materials and erection procedures, construction cost,period, and so forth.
4. AestheticsA bridge is required not only to fulfill its function as a thoroughfare, but also to use itsstructure and form to blend, harmonize, and enhance its surroundings.
10.1.4 Design
The bridge design includes selection of a bridge type, structural analysis and member design, andpreparation of detailed plans and drawings. The size of members that satisfy the requirementsof design codes are chosen [1, 17]. They must sustain prescribed loads. Structural analyses areperformed on a model of the bridge to ensure safety as well as to judge the economy of the design.The final design is committed to drawings and given to contractors.
c©1999 by CRC Press LLC
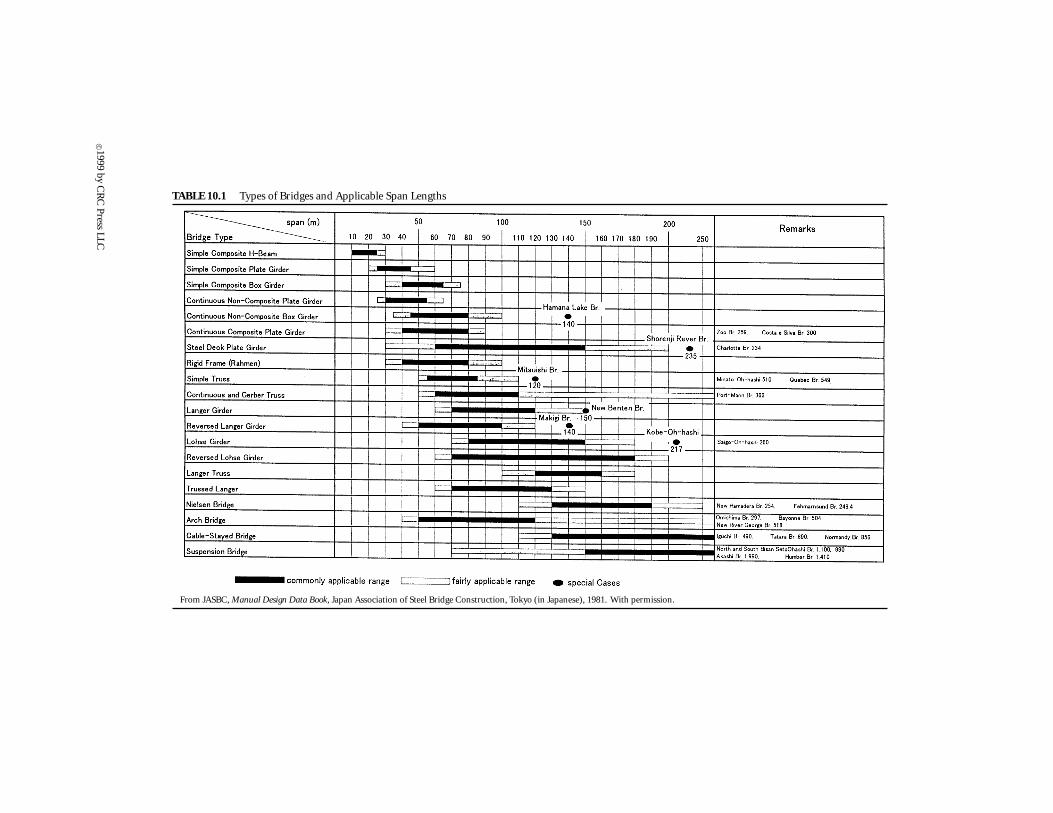
TABLE 10.1 Types of Bridges and Applicable Span Lengths
From JASBC, Manual Design Data Book, Japan Association of Steel Bridge Construction, Tokyo (in Japanese), 1981. With permission.
c© 1999by
CR
CPress
LLC

FIGURE 10.3: Supporting conditions.
FIGURE 10.4: Bridge lines.
10.1.5 Loads
Designers should consider the following loads in bridge design:
1. Primary loads exert constantly or continuously on the bridge.
Dead load: weight of the bridge.
Live load: vehicles, trains, or pedestrians, including the effect of impact. A vehicularload is classified into three parts by AASHTO [1]: the truck axle load, a tandemload, and a uniformly distributed lane load.
Other primary loads may be generated by prestressing forces, the creep of concrete, theshrinkage of concrete, soil pressure, water pressure, buoyancy, snow, and centrifugalactions or waves.
c©1999 by CRC Press LLC
2. Secondary loads occur at infrequent intervals.
Wind load: a typhoon or hurricane.
Earthquake load: especially critical in its effect on the substructure.
Other secondary loads come about with changes in temperature, acceleration, or tempo-rary loads during erection, collision forces, and so forth.
10.1.6 Influence Lines
Since the live loads by definition move, the worst case scenario along the bridge must be determined.The maximum live load bending moment and shear envelopes are calculated conveniently usinginfluence lines. The influence line graphically illustrates the maximum forces (bending moment andshear), reactions, and deflections over a section of girder as a load travels along its length. Influencelines for the bending moment and shear force of a simply supported beam are shown in Figure 10.5.For a concentrated load, the bending moment or shear at section A can be calculated by multiplyingthe load and the influence line scalar. For a uniformly distributed load, it is the product of the loadintensity and the net area of the corresponding influence line diagram.
10.2 Steel Bridges
10.2.1 Introduction
The main part of a steel bridge is made up of steel plates which compose main girders or framesto support a concrete deck. Gas flame cutting is generally used to cut steel plates to designateddimensions. Fabrication by welding is conducted in the shop where the bridge components areprepared before being assembled (usually bolted) on the construction site. Several members for twotypical steel bridges, plate girder and truss bridges, are given in Figure 10.6. The composite plategirder bridge in Figure 10.6a is a deck type while the truss bridge in Figure 10.6b is a through-decktype.
Steel has higher strength, ductility, and toughness than many other structural materials such asconcrete or wood, and thus makes an economical design. However, steel must be painted to preventrusting and also stiffened to prevent a local buckling of thin members and plates.
10.2.2 Welding
Welding is the most effective means of connecting steel plates. The properties of steel change whenheated and this change is usually for the worse. Molten steel must be shielded from the air to preventoxidization. Welding can be categorized by the method of heating and the shielding procedure.Shielded metal arc welding (SMAW), submerged arc welding (SAW), CO2 gas metal arc welding(GMAW), tungsten arc inert gas welding (TIG), metal arc inert gas welding (MIG), electric beamwelding, laser beam welding, and friction welding are common methods.
The first two welding procedures mentioned above, SMAW and SAW, are used extensively in bridgeconstruction due to their high efficiency. Both use an electric arc, which is generally considered themost efficientmethodofapplyingheat. SMAWisdonebyhandand is suitable forweldingcomplicatedjoints but is less efficient than SAW. SAW is generally automated and can be very effective for weldingsimple parts such as the connection between the flange and web of plate girders. A typical placementof these welding methods is shown in Figure 10.7. TIG and MIG use an electric arc for heat sourceand inert gas for shielding.
An electric beam weld must not be exposed to air, and therefore must be laid in a vacuum chamber.A laser beam weld can be placed in air but is less versatile than other types of welding. It cannot be
c©1999 by CRC Press LLC

FIGURE 10.5: Influence lines.
used on thick plates but is ideal for minute or artistic work. Since the welding equipment necessaryfor heating and shielding is not easy to handle on a construction site, all welds are usually laid in thefabrication shop.
The heating and cooling processes during welding induce residual stresses to the connected parts.The steel surfaces or parts of the cross section at some distance from the hot weld, cool first. Whenthe area close to the weld then cools, it tries to shrink but is restrained by the more solidified and
c©1999 by CRC Press LLC
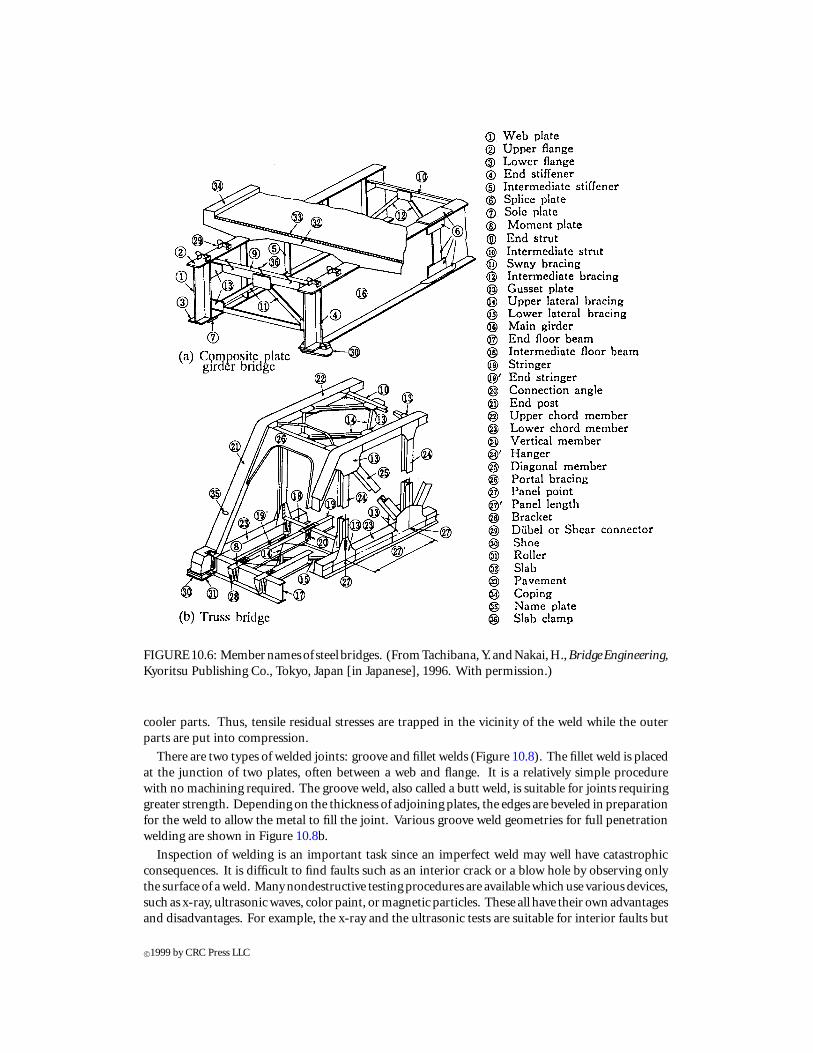
FIGURE10.6: Membernamesof steel bridges. (FromTachibana, Y. andNakai, H., BridgeEngineering,Kyoritsu Publishing Co., Tokyo, Japan [in Japanese], 1996. With permission.)
cooler parts. Thus, tensile residual stresses are trapped in the vicinity of the weld while the outerparts are put into compression.
There are two types of welded joints: groove and fillet welds (Figure 10.8). The fillet weld is placedat the junction of two plates, often between a web and flange. It is a relatively simple procedurewith no machining required. The groove weld, also called a butt weld, is suitable for joints requiringgreater strength. Depending on the thickness of adjoining plates, the edges are beveled in preparationfor the weld to allow the metal to fill the joint. Various groove weld geometries for full penetrationwelding are shown in Figure 10.8b.
Inspection of welding is an important task since an imperfect weld may well have catastrophicconsequences. It is difficult to find faults such as an interior crack or a blow hole by observing onlythe surface of a weld. Many nondestructive testing procedures are available which use various devices,such as x-ray, ultrasonic waves, color paint, or magnetic particles. These all have their own advantagesand disadvantages. For example, the x-ray and the ultrasonic tests are suitable for interior faults but
c©1999 by CRC Press LLC
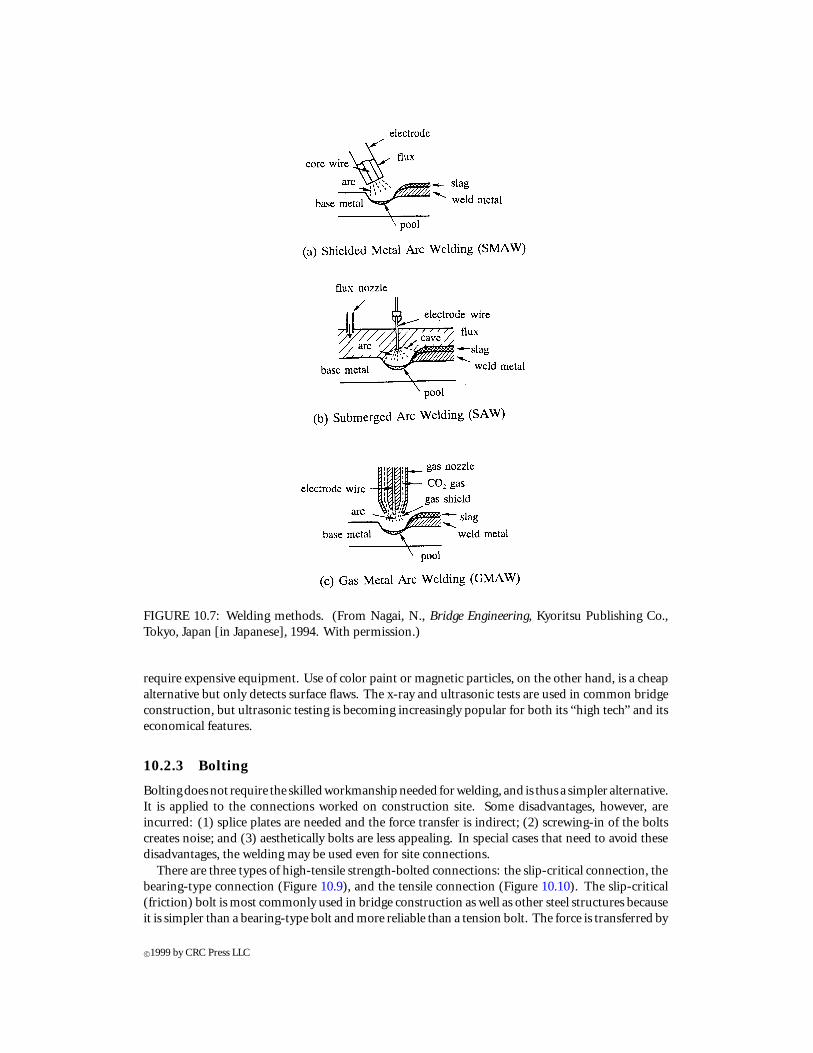
FIGURE 10.7: Welding methods. (From Nagai, N., Bridge Engineering, Kyoritsu Publishing Co.,Tokyo, Japan [in Japanese], 1994. With permission.)
require expensive equipment. Use of color paint or magnetic particles, on the other hand, is a cheapalternative but only detects surface flaws. The x-ray and ultrasonic tests are used in common bridgeconstruction, but ultrasonic testing is becoming increasingly popular for both its “high tech” and itseconomical features.
10.2.3 Bolting
Boltingdoesnot require the skilledworkmanshipneeded forwelding, and is thus a simpler alternative.It is applied to the connections worked on construction site. Some disadvantages, however, areincurred: (1) splice plates are needed and the force transfer is indirect; (2) screwing-in of the boltscreates noise; and (3) aesthetically bolts are less appealing. In special cases that need to avoid thesedisadvantages, the welding may be used even for site connections.
There are three types of high-tensile strength-bolted connections: the slip-critical connection, thebearing-type connection (Figure 10.9), and the tensile connection (Figure 10.10). The slip-critical(friction) bolt is most commonly used in bridge construction as well as other steel structures becauseit is simpler than a bearing-type bolt and more reliable than a tension bolt. The force is transferred by
c©1999 by CRC Press LLC

FIGURE 10.8: Types of welding joints. (From Tachibana, Y. and Nakai, H., Bridge Engineering,Kyoritsu Publishing Co., Tokyo, Japan [in Japanese], 1996. With permission.)
the friction generated between the base plates and the splice plates. The friction resistance is inducedby the axial compression force in the bolts.
The bearing-type bolt transfers the force by bearing against the plate as well as making some useof friction. The bearing-type bolt can transfer larger force than the friction bolts but is less forgivingwith respect to the clearance space often existing between the bolt and the plate. These require thatprecise holes be drilled and at exact spacings. The force transfer mechanism for these connections isshown in Figure 10.9. In the beam-to-column connection shown in Figure 10.10, the bolts attachedto the column are tension bolts while the bolts on the beam are slip-critical bolts.
The tension bolt transfers force in the direction of the bolt axis. The tension type of bolt connectionis easy to connect on site, but difficulties arise in distributing forces equally to each bolt, resultingin reduced reliability. Tension bolts may also be used to connect box members of the towers ofsuspension bridges where compression forces are larger than the tension forces. In this case, thecompression is shared with butting surfaces of the plates and the tension is carried by the bolts.
10.2.4 Fabrication in Shop
Steel bridges are fabricated into members in the shop yard and then transported to the constructionsite for assembly. Ideally all constructional work would be completed in the shop to get the highestquality in the minimum construction time. The larger and longer the members can be, the better,within the restrictions set by transportation limits and erection tolerances. When crane ships forerection and barges for transportation can be used, one block can weigh as much as a thousand tons
c©1999 by CRC Press LLC
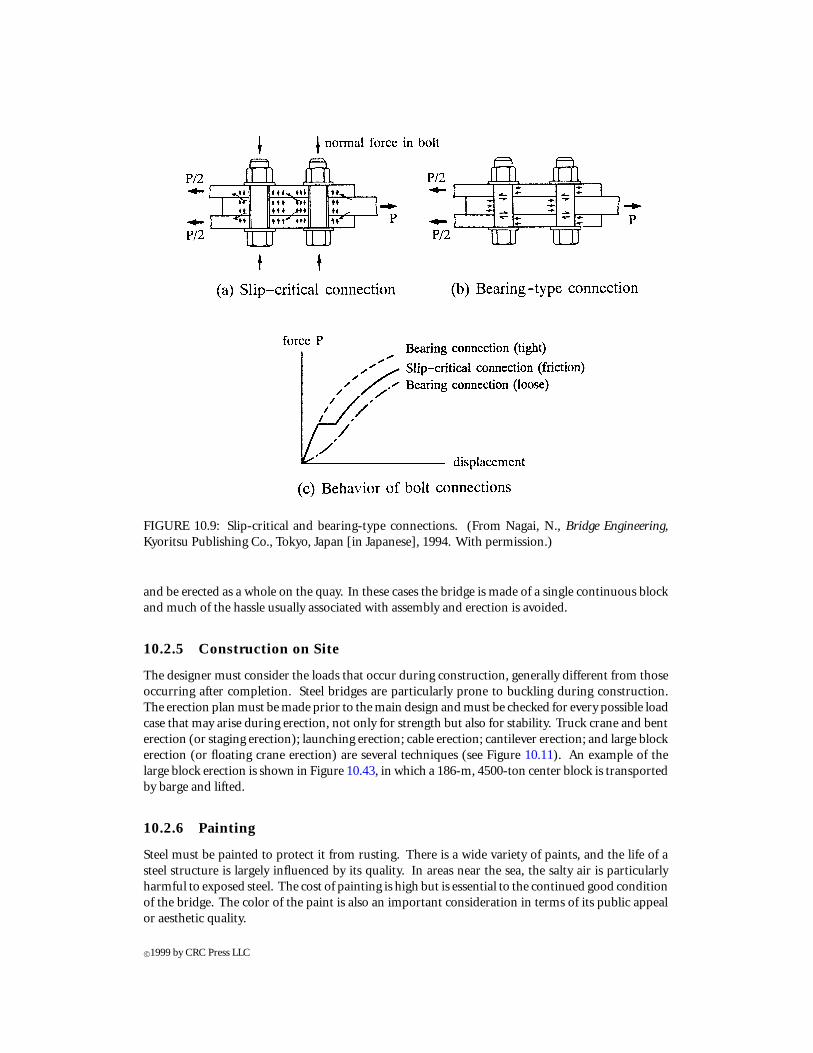
FIGURE 10.9: Slip-critical and bearing-type connections. (From Nagai, N., Bridge Engineering,Kyoritsu Publishing Co., Tokyo, Japan [in Japanese], 1994. With permission.)
and be erected as a whole on the quay. In these cases the bridge is made of a single continuous blockand much of the hassle usually associated with assembly and erection is avoided.
10.2.5 Construction on Site
The designer must consider the loads that occur during construction, generally different from thoseoccurring after completion. Steel bridges are particularly prone to buckling during construction.The erection plan must be made prior to the main design and must be checked for every possible loadcase that may arise during erection, not only for strength but also for stability. Truck crane and benterection (or staging erection); launching erection; cable erection; cantilever erection; and large blockerection (or floating crane erection) are several techniques (see Figure 10.11). An example of thelarge block erection is shown in Figure 10.43, in which a 186-m, 4500-ton center block is transportedby barge and lifted.
10.2.6 Painting
Steel must be painted to protect it from rusting. There is a wide variety of paints, and the life of asteel structure is largely influenced by its quality. In areas near the sea, the salty air is particularlyharmful to exposed steel. The cost of painting is high but is essential to the continued good conditionof the bridge. The color of the paint is also an important consideration in terms of its public appealor aesthetic quality.
c©1999 by CRC Press LLC

FIGURE 10.10: Tension-type connection.
10.3 Concrete Bridges
10.3.1 Introduction
For modern bridges, both structural concrete and steel give satisfactory performance. The choicebetween the two materials depends mainly upon the cost of construction and maintenance. Generally,concrete structures require less maintenance than steel structures, but since the relative cost of steeland concrete is different from country to country, and may even vary throughout different parts ofthe same country, it is impossible to put one definitively above the other in terms of “economy”.
In this section, the main features of common types of concrete bridge superstructures are brieflydiscussed. Concrete bridge substructures will be discussed in Section 10.4. A design example of atwo-span continuous, cast-in-place, prestressed concrete box girder bridge is given in the Appendix.For a more detailed look at design procedures for concrete bridges, reference should be made to therecent books of Gerwick [7], Troitsky [24], Xanthakos [26, 27], and Tonias [23].
10.3.2 Reinforced Concrete Bridges
Figure 10.12 shows the typical reinforced concrete sections commonly used in highway bridge su-perstructures.
1. SlabA reinforced concrete slab (Figure 10.12a) is the most economical bridge superstructurefor spans of up to approximately 40 ft (12.2 m). The slab has simple details and standardformwork and is neat, simple, and pleasing in appearance. Common spans range from16 to 44 ft (4.9 to 13.4 m) with structural depth-to-span ratios of 0.06 for simple spansand 0.045 for continuous spans.
2. T-Beam (Deck Girder)The T-beams (Figure 10.12b) are generally economic for spans of 40 to 60 ft (12.2 to 18.3m), but do require complicated formwork, particularly for skewed bridges. Structural
c©1999 by CRC Press LLC

FIGURE 10.11: Erections methods. (From Japan Construction Mechanization Association, CostEstimation of Bridge Erection, Tokyo, Japan [in Japanese], 1991. With permission.)
depth-to-span ratios are 0.07 for simple spans and 0.065 for continuous spans. Thespacing of girders in a T-beam bridge depends on the overall width of the bridge, theslab thickness, and the cost of the formwork and may be taken as 1.5 times the structuraldepth. The most commonly used spacings are between 6 and 10 ft (1.8 to 3.1 m).
3. Cast-in-Place Box GirderBox girders like the one shown in Figure 10.12c, are often used for spans of 50 to 120 ft
c©1999 by CRC Press LLC

FIGURE 10.12: Typical reinforced concrete sections in bridge superstructures.
(15.2 to 36.6 m). Its formwork for skewed structures is simpler than that required for theT-beam. Due to excessive dead load deflections, the use of reinforced concrete box girdersover simple spans of 100 ft (30.5 m) or more may not be economical. The depth-to-spanratios are typically 0.06 for simple spans and 0.055 for continuous spans with the girdersspaced at 1.5 times the structural depth. The high torsional resistance of the box girdermakes it particularly suitable for curved alignments, such as the ramps onto freeways. Itssmooth flowing lines are appealing in metropolitan cities.
4. Design ConsiderationA reinforced concrete highway bridge should be designed to satisfy the specification orcode requirements, such as the AASHTO-LRFD [1] requirements (American Associationof State Highway and Transportation Officials—Load and Resistance Factor Design) forall appropriate service, fatigue, strength, and extreme event limit states. In the AASHTO-LRFD [1], service limit states include cracking and deformation effects, and strengthlimit states consider the strength and stability of a structure. A bridge structure is usuallydesigned for the strength limit states and is then checked against the appropriate serviceand extreme event limit states.
c©1999 by CRC Press LLC
10.3.3 Prestressed Concrete Bridges
Prestressed concrete, using high-strength materials, makes an attractive alternative for long-spanbridges. It has been widely used in bridge structures since the 1950s.
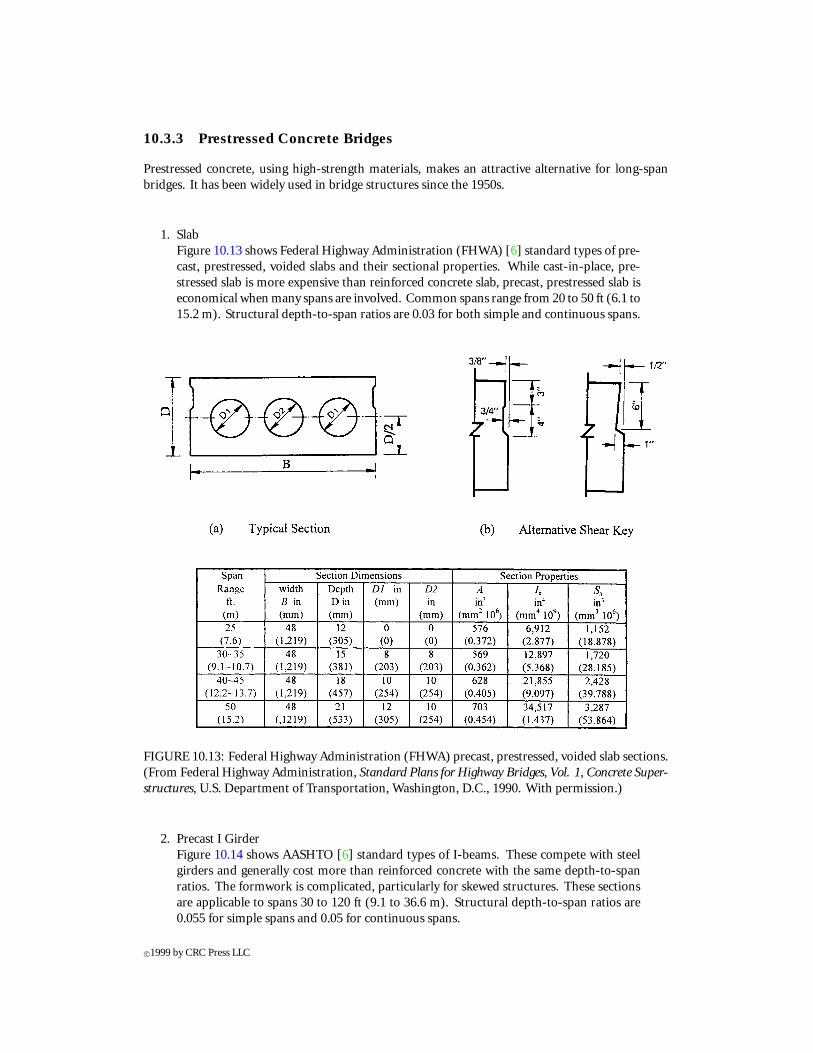
1. SlabFigure 10.13 shows Federal Highway Administration (FHWA) [6] standard types of pre-cast, prestressed, voided slabs and their sectional properties. While cast-in-place, pre-stressed slab is more expensive than reinforced concrete slab, precast, prestressed slab iseconomical when many spans are involved. Common spans range from 20 to 50 ft (6.1 to15.2 m). Structural depth-to-span ratios are 0.03 for both simple and continuous spans.
FIGURE 10.13: Federal Highway Administration (FHWA) precast, prestressed, voided slab sections.(From Federal Highway Administration, Standard Plans for Highway Bridges, Vol. 1, Concrete Super-structures, U.S. Department of Transportation, Washington, D.C., 1990. With permission.)
2. Precast I GirderFigure 10.14 shows AASHTO [6] standard types of I-beams. These compete with steelgirders and generally cost more than reinforced concrete with the same depth-to-spanratios. The formwork is complicated, particularly for skewed structures. These sectionsare applicable to spans 30 to 120 ft (9.1 to 36.6 m). Structural depth-to-span ratios are0.055 for simple spans and 0.05 for continuous spans.
c©1999 by CRC Press LLC

FIGURE 10.14: Precast, prestressed AASHTO (American Association of State Highway and Trans-portation Officials) I-beam sections. (From Federal Highway Administration, Standard Plans forHighway Bridges, Vol. 1, Concrete Superstructures, U.S. Department of Transportation, Washington,D.C., 1990. With permission.)
3. Box GirderFigure 10.15 shows FHWA [6] standard types of precast box sections. The shape of acast-in-place, prestressed concrete box girder is similar to the conventional reinforcedconcrete box girder (Figure 10.12c). The spacing of the girders can be taken as twice thestructural depth. It is used mostly for spans of 100 to 600 ft (30.5 to 182.9 m). Structuraldepth-to-span ratios are 0.045 for simple spans and 0.04 for continuous spans. These
c©1999 by CRC Press LLC
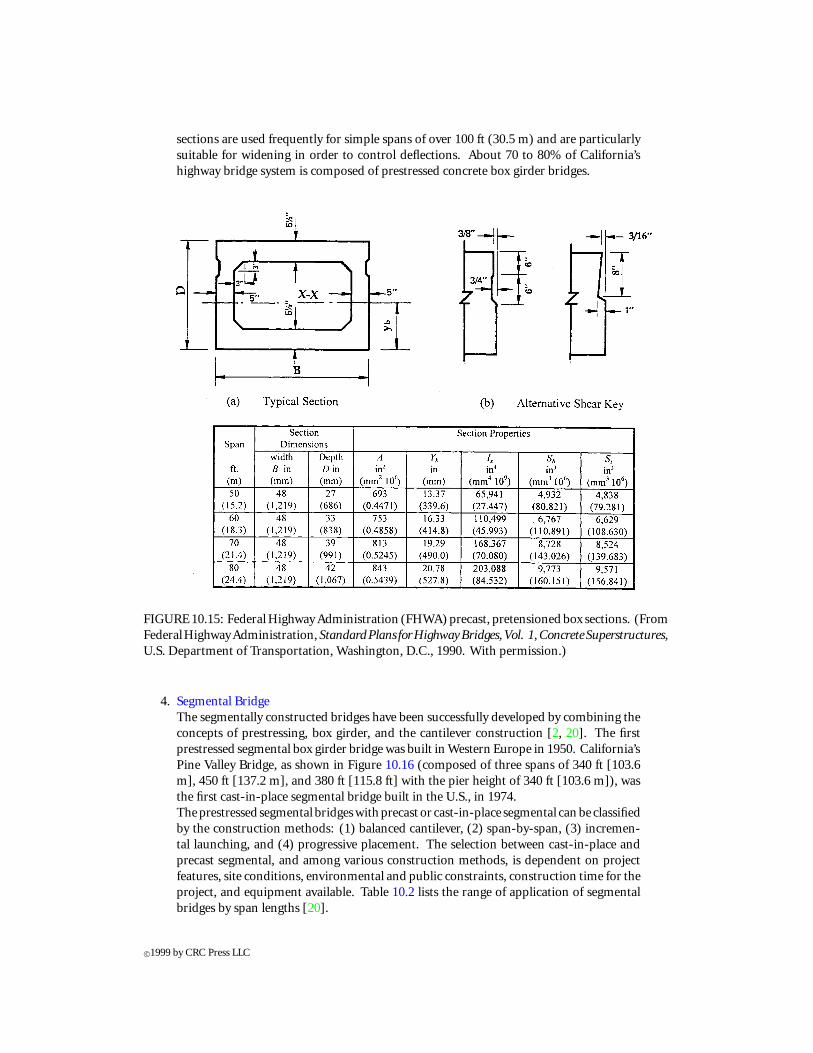
sections are used frequently for simple spans of over 100 ft (30.5 m) and are particularlysuitable for widening in order to control deflections. About 70 to 80% of California’shighway bridge system is composed of prestressed concrete box girder bridges.
FIGURE 10.15: Federal Highway Administration (FHWA) precast, pretensioned box sections. (FromFederalHighwayAdministration, StandardPlans forHighwayBridges, Vol. 1, ConcreteSuperstructures,U.S. Department of Transportation, Washington, D.C., 1990. With permission.)
4. Segmental BridgeThe segmentally constructed bridges have been successfully developed by combining theconcepts of prestressing, box girder, and the cantilever construction [2, 20]. The firstprestressed segmental box girder bridge was built in Western Europe in 1950. California’sPine Valley Bridge, as shown in Figure 10.16 (composed of three spans of 340 ft [103.6m], 450 ft [137.2 m], and 380 ft [115.8 ft] with the pier height of 340 ft [103.6 m]), wasthe first cast-in-place segmental bridge built in the U.S., in 1974.The prestressed segmental bridges with precast or cast-in-place segmental can be classifiedby the construction methods: (1) balanced cantilever, (2) span-by-span, (3) incremen-tal launching, and (4) progressive placement. The selection between cast-in-place andprecast segmental, and among various construction methods, is dependent on projectfeatures, site conditions, environmental and public constraints, construction time for theproject, and equipment available. Table 10.2 lists the range of application of segmentalbridges by span lengths [20].
c©1999 by CRC Press LLC

FIGURE 10.16:a Pine Valley Bridge, California. Construction state. (From California Department ofTransportation. With permission.)
FIGURE 10.16:b Pine Valley Bridge, California. Construction completed. (From California Depart-ment of Transportation. With permission.)
c©1999 by CRC Press LLC
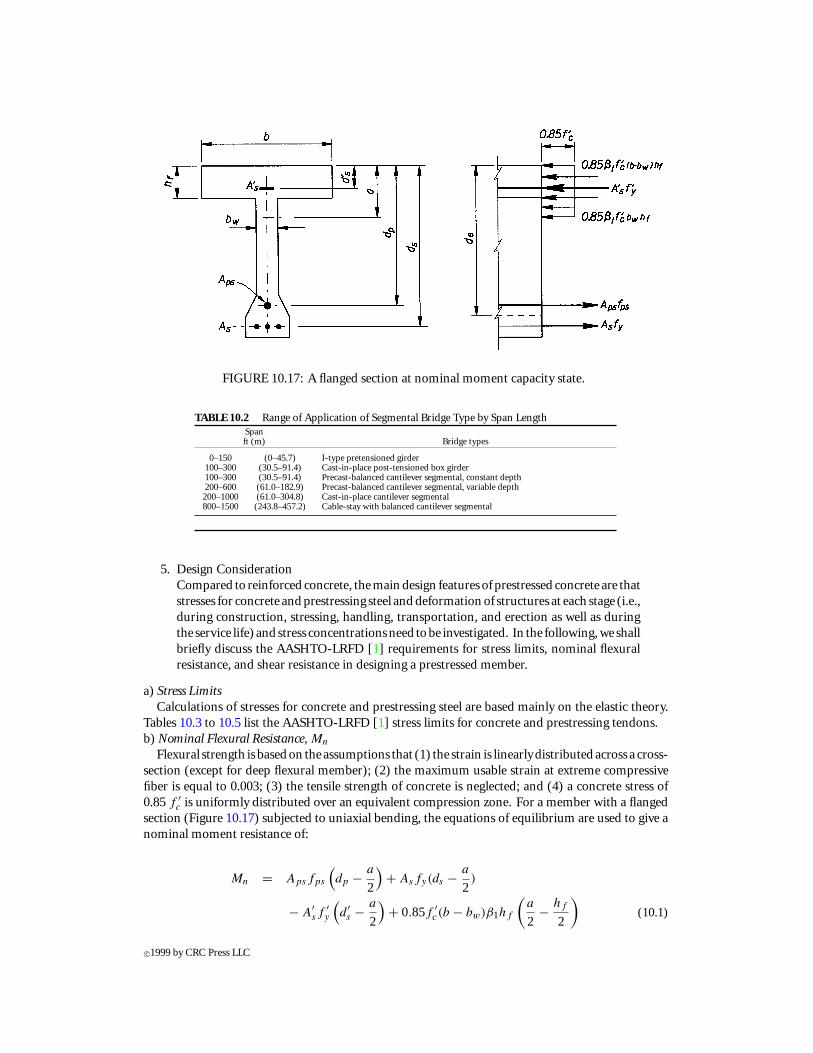
FIGURE 10.17: A flanged section at nominal moment capacity state.
TABLE 10.2 Range of Application of Segmental Bridge Type by Span LengthSpanft (m) Bridge types
0–150 (0–45.7) I-type pretensioned girder100–300 (30.5–91.4) Cast-in-place post-tensioned box girder100–300 (30.5–91.4) Precast-balanced cantilever segmental, constant depth200–600 (61.0–182.9) Precast-balanced cantilever segmental, variable depth200–1000 (61.0–304.8) Cast-in-place cantilever segmental800–1500 (243.8–457.2) Cable-stay with balanced cantilever segmental
5. Design ConsiderationCompared to reinforced concrete, the main design features of prestressed concrete are thatstresses for concrete and prestressing steel and deformation of structures at each stage (i.e.,during construction, stressing, handling, transportation, and erection as well as duringthe service life) and stress concentrationsneed tobe investigated. In the following, we shallbriefly discuss the AASHTO-LRFD [1] requirements for stress limits, nominal flexuralresistance, and shear resistance in designing a prestressed member.
a) Stress LimitsCalculations of stresses for concrete and prestressing steel are based mainly on the elastic theory.
Tables 10.3 to 10.5 list the AASHTO-LRFD [1] stress limits for concrete and prestressing tendons.b) Nominal Flexural Resistance, Mn
Flexural strength is based on the assumptions that (1) the strain is linearly distributed across a cross-section (except for deep flexural member); (2) the maximum usable strain at extreme compressivefiber is equal to 0.003; (3) the tensile strength of concrete is neglected; and (4) a concrete stress of0.85 f ′
c is uniformly distributed over an equivalent compression zone. For a member with a flangedsection (Figure 10.17) subjected to uniaxial bending, the equations of equilibrium are used to give anominal moment resistance of:
Mn = Apsfps
(dp − a
2
)+ Asfy(ds − a
2)
− A′sf
′y
(d ′s − a
2
)+ 0.85f ′
c(b − bw)β1hf
(a
2− hf
2
)(10.1)
c©1999 by CRC Press LLC

TABLE 10.3 Stress Limits for Prestressing TendonsPrestressing tendon type
Stress-relievedstrand and plain Deformed
Stress Prestressing high-strength Low Relaxation high-strengthtype method bars strand bars
At jacking Pretensioning 0.72fpu 0.78fpu —(fpj ) Post-tensioning 0.76fpu 0.80fpu 0.75fpu
After Pretensioning 0.70fpu 0.74fpu —transfer Post-tensioning(fpt ) At anchorages
and couplers 0.70fpu 0.70fpu 0.66fpuimmediatelyafter anchor set
General 0.70fpu 0.74fpu 0.66fpu
At service After all losseslimit 0.80fpy 0.80fpy 0.80fpy
state (fpe)
From American Association of State Highway and Transportation Officials, AASHTO LRFD BridgeDesign Specifications, First Edition, Washington, D.C., 1994. With permission.
a = βc (10.2)
c = Apsfpu + Asfy − A′sf
′y − 0.85β1f
′c(b − bw)hf
0.85β1f ′cbw + kAps
fpu
dp
(10.3)
fps = fpu
(1 − k
c
dp
)(10.4)
k = 2
(1.04− fpy
fpu
)(10.5)
where A represents area; f is stress; b is the width of the compression face of member; bw isthe web width of a section; hf is the compression flange depth of a cross-section; dp and ds aredistances from extreme compression fiber to the centroid of prestressing tendons and to centroid oftension reinforcement, respectively; subscripts c and y indicate specified strength for concrete andsteel, respectively; subscripts p and s signify prestressing steel and reinforcement steel, respectively;subscripts ps, py, and pu correspond to states of nominal moment capacity, yield, and specifiedtensile strength of prestressing steel, respectively; superscript prime (′) represents compression; andβ1 is the concrete stress block factor, equal to 0.85 f ′
c ≤ 4000 psi and 0.05 less for each 1000 psiof f ′
c in excess of 4000 psi, and minimum β1 = 0.65. The above equations also can be used for arectangular section in which bw = b is taken.
Maximum reinforcement limit:
c
de
≤ 0.42 (10.6)
de = Apsfpsdp + Asfyds
Apsfps + Asfy
(10.7)
Minimum reinforcement limit:
φMn ≥ 1.2Mcr (10.8)
in which φ is the flexural resistance factor 1.0 for prestressed concrete and 0.9 for reinforced concrete,and Mcr is the cracking moment strength given by the elastic stress distribution and the modulus ofrupture of concrete.
c©1999 by CRC Press LLC

TABLE 10.4 Temporary Concrete Stress Limits at Jacking State Before Losses Due to Creep and
Shrinkage—Fully Prestressed ComponentsStress Stresstype Area and condition ksi (MPa)
Compressive Pretensioned 0.60f ′ci
Post-tensioned 0.55f ′ci
Precompressed tensile zone without bonded reinforcement N/A
Area other than the precompressed tensile zones and withoutbonded auxiliary reinforcement
0.0948√
f ′ci
≤ 0.2
(0.25
√f ′ci
≤ 1.38)
Tensile
Nonsegmentalbridges
Area with bonded reinforcement which is sufficient to resist 120%of the tension force in the cracked concrete computed
0.22√
f ′ci
on the basis of uncracked section(0.58
√f ′ci
)Handling stresses in prestressed piles
(0.158
√f ′ci
)(0.415
√f ′ci
)
Type A joints with minimum bonded aux-iliary reinforcement through the
0.0948√
f ′ci
max. tension
Longitudinal stressthrough joint inprecompressed
joints which is sufficient to carry the cal-culated tensile force at a stress of 0.5 fy
with internal tendons
(0.25√
f ′ci
max. tension)
tensile zone Type A joints without the minimumbonded auxiliary reinforcement throughthe joints with internal tendons
No tension
Type B with external tendons 0.2 min. compression(1.38 min. compression)
Segmental Transverse stress For any type of joint 0.0948√
f ′c max. tension
bridges through joints (0.25√
f ′c max. tension)
Without bonded non-prestressed rein-forcement
No tension
Other area Bonded reinforcement is sufficient tocarry the calculated tensile force in the
0.19√
f ′ci
concrete on the assumption of an un-cracked section at a stress of 0.5 fsy
(0.50√
f ′ci
)
Note: Type A joints are cast-in-place joints of wet concrete and/or epoxy between precast units. Type B joints are dry jointsbetween precast units.
From American Association of State Highway and Transportation Officials, AASHTO LRFD Bridge Design Specifications, FirstEdition, Washington, D.C., 1994. With permission.
c) Nominal Shear Resistance, Vn
The nominal shear resistance shall be determined by the following formulas:
Vn = the lesser of
{Vc + Vs + Vp
0.25f ′cbνdν + Vp
(10.9)
where
Vc ={
0.0316β√
f ′cbνdν (ksi)
0.083β√
f ′cbνdν (MPa)
(10.10)
Vs = Aνfydν (cosθ + cosα) sinα
s(10.11)
where bν is the effective web width determined by subtracting the diameters of ungrouted ductsor one-half the diameters of grouted ducts; dν is the effective depth between the resultants of thetensile and compressive forces due to flexure, but not less than the greater of 0.9 de or 0.72h; Aν
is the area of transverse reinforcement within distance s; s is the spacing of the stirrups; α is theangle of inclination of transverse reinforcement to the longitudinal axis; β is a factor indicating the
c©1999 by CRC Press LLC
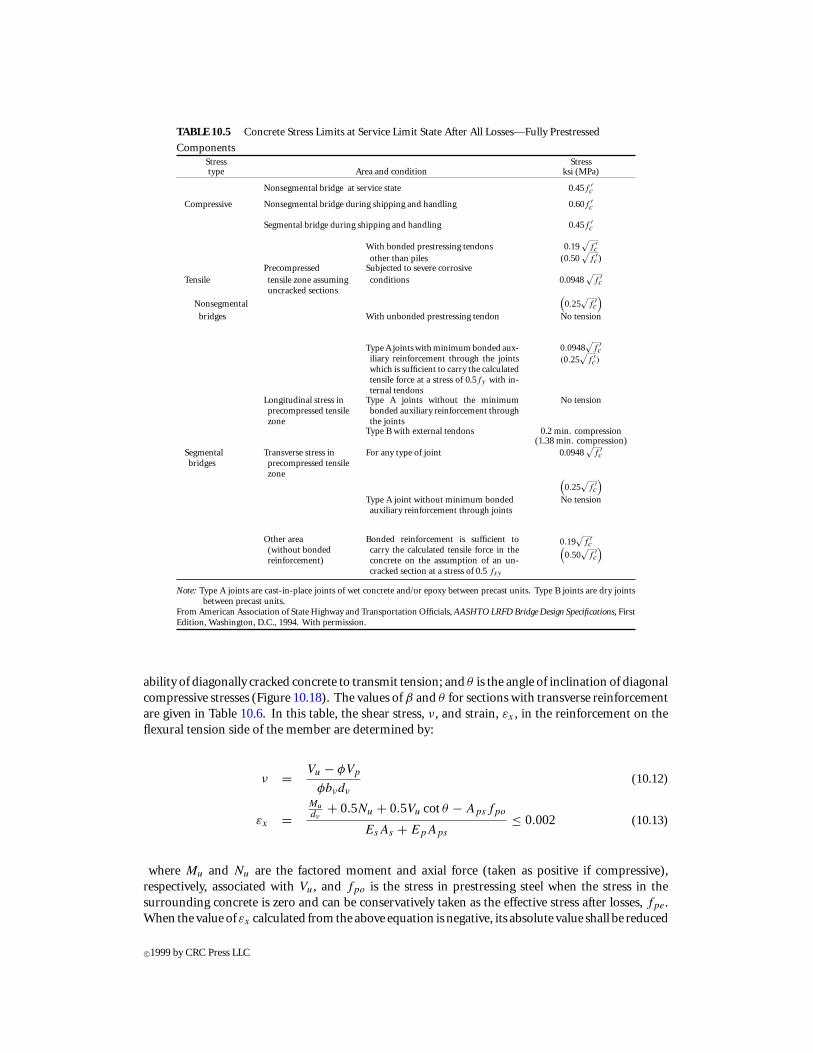
TABLE 10.5 Concrete Stress Limits at Service Limit State After All Losses—Fully Prestressed
ComponentsStress Stresstype Area and condition ksi (MPa)
Nonsegmental bridge at service state 0.45f ′c
Compressive Nonsegmental bridge during shipping and handling 0.60f ′c
Segmental bridge during shipping and handling 0.45f ′c
With bonded prestressing tendons 0.19√
f ′c
other than piles (0.50√
f ′c)
Precompressed Subjected to severe corrosiveTensile tensile zone assuming
uncracked sectionsconditions 0.0948
√f ′c
Nonsegmental(0.25
√f ′c
)bridges With unbonded prestressing tendon No tension
Type A joints with minimum bonded aux-iliary reinforcement through the jointswhich is sufficient to carry the calculatedtensile force at a stress of 0.5fy with in-ternal tendons
0.0948√
f ′c
(0.25√
f ′c)
Longitudinal stress inprecompressed tensilezone
Type A joints without the minimumbonded auxiliary reinforcement throughthe joints
No tension
Type B with external tendons 0.2 min. compression(1.38 min. compression)
Segmentalbridges
Transverse stress inprecompressed tensilezone
For any type of joint 0.0948√
f ′c
(0.25
√f ′c
)Type A joint without minimum bondedauxiliary reinforcement through joints
No tension
Other area(without bondedreinforcement)
Bonded reinforcement is sufficient tocarry the calculated tensile force in theconcrete on the assumption of an un-cracked section at a stress of 0.5 fsy
0.19√
f ′c(
0.50√
f ′c
)
Note: Type A joints are cast-in-place joints of wet concrete and/or epoxy between precast units. Type B joints are dry jointsbetween precast units.
From American Association of State Highway and Transportation Officials, AASHTO LRFD Bridge Design Specifications, FirstEdition, Washington, D.C., 1994. With permission.
ability of diagonally cracked concrete to transmit tension; and θ is the angle of inclination of diagonalcompressive stresses (Figure 10.18). The values of β and θ for sections with transverse reinforcementare given in Table 10.6. In this table, the shear stress, ν, and strain, εx , in the reinforcement on theflexural tension side of the member are determined by:
ν = Vu − φVp
φbνdν
(10.12)
εx =Mu
dν+ 0.5Nu + 0.5Vu cotθ − Apsfpo
EsAs + EpAps
≤ 0.002 (10.13)
where Mu and Nu are the factored moment and axial force (taken as positive if compressive),respectively, associated with Vu, and fpo is the stress in prestressing steel when the stress in thesurrounding concrete is zero and can be conservatively taken as the effective stress after losses, fpe.When the value of εx calculated from the above equation is negative, its absolute value shall be reduced
c©1999 by CRC Press LLC
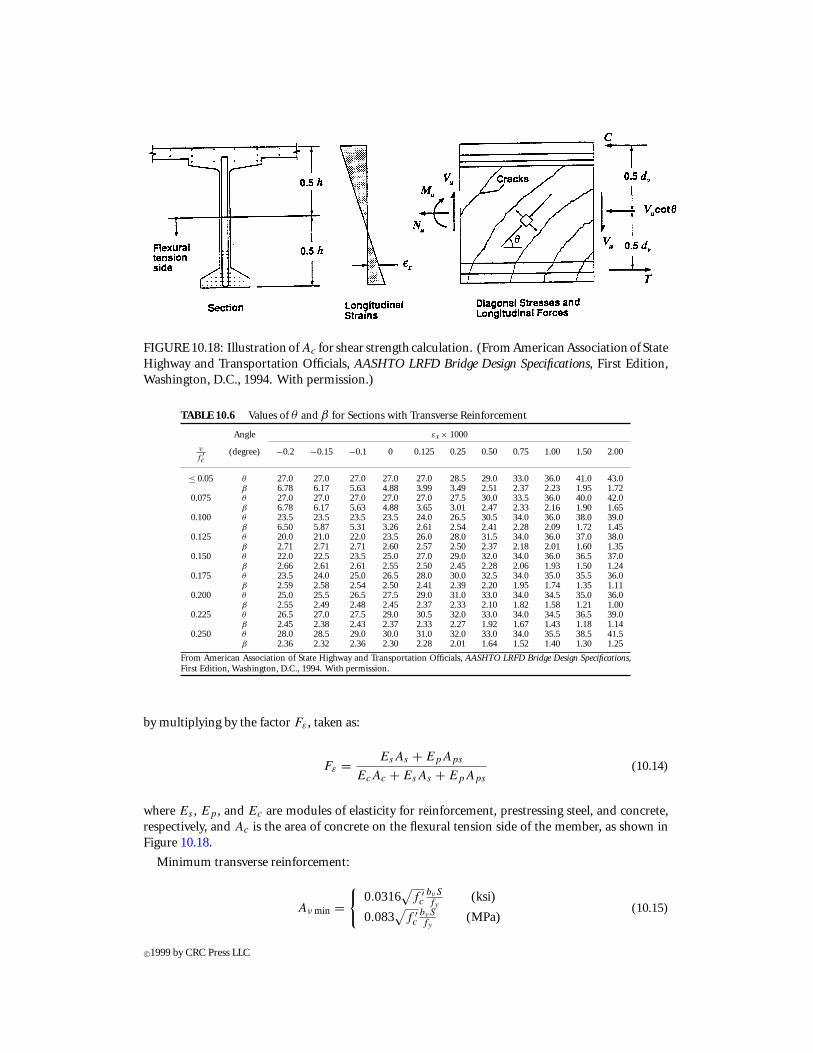
FIGURE 10.18: Illustration ofAc for shear strength calculation. (From American Association of StateHighway and Transportation Officials, AASHTO LRFD Bridge Design Specifications, First Edition,Washington, D.C., 1994. With permission.)
TABLE 10.6 Values of θ and β for Sections with Transverse Reinforcement
Angle εx× 1000
ν
f ′c
(degree) −0.2 −0.15 −0.1 0 0.125 0.25 0.50 0.75 1.00 1.50 2.00
≤ 0.05 θ 27.0 27.0 27.0 27.0 27.0 28.5 29.0 33.0 36.0 41.0 43.0β 6.78 6.17 5.63 4.88 3.99 3.49 2.51 2.37 2.23 1.95 1.72
0.075 θ 27.0 27.0 27.0 27.0 27.0 27.5 30.0 33.5 36.0 40.0 42.0β 6.78 6.17 5.63 4.88 3.65 3.01 2.47 2.33 2.16 1.90 1.65
0.100 θ 23.5 23.5 23.5 23.5 24.0 26.5 30.5 34.0 36.0 38.0 39.0β 6.50 5.87 5.31 3.26 2.61 2.54 2.41 2.28 2.09 1.72 1.45
0.125 θ 20.0 21.0 22.0 23.5 26.0 28.0 31.5 34.0 36.0 37.0 38.0β 2.71 2.71 2.71 2.60 2.57 2.50 2.37 2.18 2.01 1.60 1.35
0.150 θ 22.0 22.5 23.5 25.0 27.0 29.0 32.0 34.0 36.0 36.5 37.0β 2.66 2.61 2.61 2.55 2.50 2.45 2.28 2.06 1.93 1.50 1.24
0.175 θ 23.5 24.0 25.0 26.5 28.0 30.0 32.5 34.0 35.0 35.5 36.0β 2.59 2.58 2.54 2.50 2.41 2.39 2.20 1.95 1.74 1.35 1.11
0.200 θ 25.0 25.5 26.5 27.5 29.0 31.0 33.0 34.0 34.5 35.0 36.0β 2.55 2.49 2.48 2.45 2.37 2.33 2.10 1.82 1.58 1.21 1.00
0.225 θ 26.5 27.0 27.5 29.0 30.5 32.0 33.0 34.0 34.5 36.5 39.0β 2.45 2.38 2.43 2.37 2.33 2.27 1.92 1.67 1.43 1.18 1.14
0.250 θ 28.0 28.5 29.0 30.0 31.0 32.0 33.0 34.0 35.5 38.5 41.5β 2.36 2.32 2.36 2.30 2.28 2.01 1.64 1.52 1.40 1.30 1.25
From American Association of State Highway and Transportation Officials, AASHTO LRFD Bridge Design Specifications,First Edition, Washington, D.C., 1994. With permission.
by multiplying by the factor Fε , taken as:
Fε = EsAs + EpAps
EcAc + EsAs + EpAps
(10.14)
where Es , Ep , and Ec are modules of elasticity for reinforcement, prestressing steel, and concrete,respectively, and Ac is the area of concrete on the flexural tension side of the member, as shown inFigure 10.18.
Minimum transverse reinforcement:
Aν min ={
0.0316√
f ′c
bνSfy
(ksi)
0.083√
f ′c
bνSfy
(MPa)(10.15)
c©1999 by CRC Press LLC
Maximum spacing of transverse reinforcement:
For Vu < 0.1f ′cbνdν smax = the smaller of
{0.8dν
24 in. (600 mm )(10.16)
For Vu ≥ 0.1f ′cbνdν smax = the smaller of
{0.4dν
12 in. (300 mm )(10.17)
10.4 Concrete Substructures
10.4.1 Introduction
Bridge substructures transfer traffic loads from the superstructure to the footings and foundations.Vertical intermediate supports (piers or bents) and end supports (abutments) are included.
10.4.2 Bents and Piers
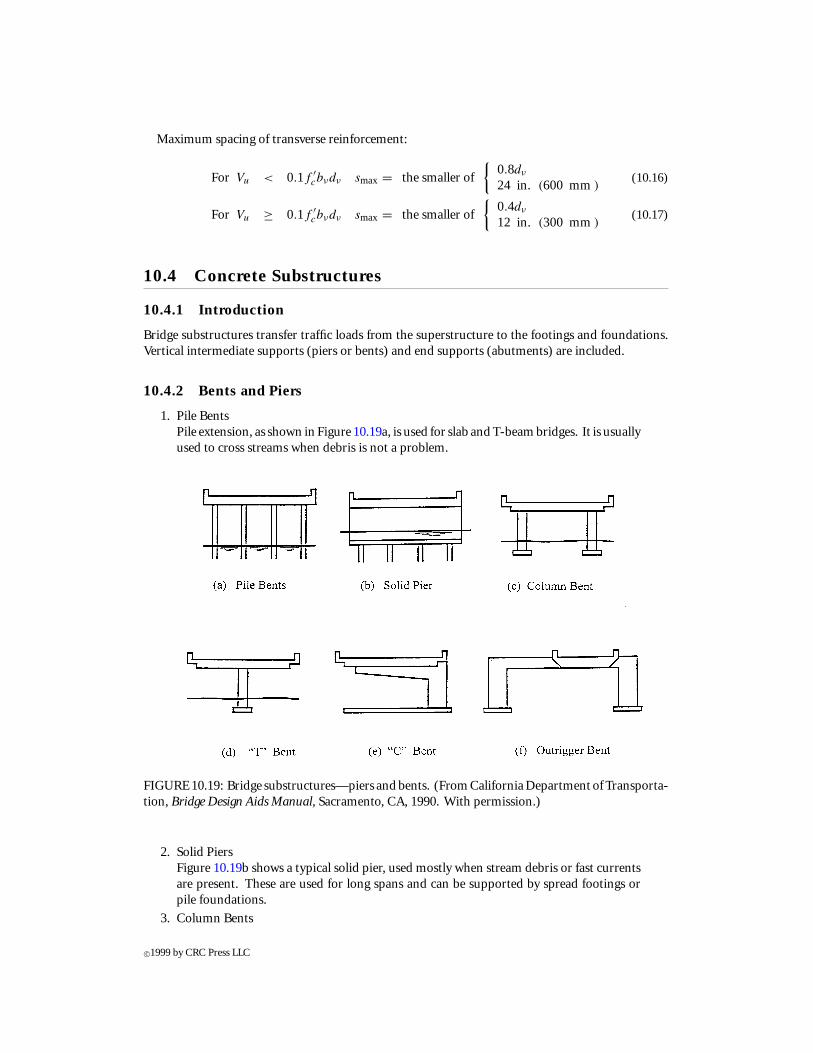
1. Pile BentsPile extension, as shown in Figure 10.19a, is used for slab and T-beam bridges. It is usuallyused to cross streams when debris is not a problem.
FIGURE 10.19: Bridge substructures—piers and bents. (From California Department of Transporta-tion, Bridge Design Aids Manual, Sacramento, CA, 1990. With permission.)
2. Solid PiersFigure 10.19b shows a typical solid pier, used mostly when stream debris or fast currentsare present. These are used for long spans and can be supported by spread footings orpile foundations.
3. Column Bents
c©1999 by CRC Press LLC
Column bents (Figure 10.19c) are generally used on dry land structures and are supportedby spread footings or pile foundations. Multi-column bents are desirable for bridges inseismic zones. The single-column bent, such as a T bent (Figure 10.19d), modified T bent(C bent) (Figure 10.19e), or outrigger bent (Figure 10.19f), may be used when the locationof the columns is restricted and changes of the alignment are impossible. To achieve apleasing appearance at the minimum cost using standard column shapes, Caltrans [3]developed “standard architectural columns” (Figure 10.20). Prismatic sections of columntypes 1 and 1W, with one-way flares of column types 2 and 2W, and with two-way flaresof column types 3 and 3W may be used for various highway bridges.
10.4.3 Abutments
Abutments are the end supports of a bridge. Figure 10.21 shows the typical abutments used forhighway bridges. The seven types of abutments can be divided into two categories: open and closedends. Selection of an abutment type depends on the requirements for structural support, movement,drainage, road approach, and earthquakes.
1. Open-End AbutmentsOpen-end abutments include diaphragm abutments and short-seat abutments. These arethe most frequently used abutments and are usually the most economical, adaptable, andattractive. The basic structural difference between the two types is that seat abutmentspermit the superstructure tomove independently fromtheabutmentwhile thediaphragmabutment does not. Since open-end abutments have lower abutment walls, there isless settlement in the road approaches than that experienced by higher backfilled closedabutments. They also provide for more economical widening than closed abutments.
2. Closed-End AbutmentsClosed-end abutments include cantilever, strutted, rigid frame, bin, and closure abut-ments. These are less commonly used, but for bridge widenings of the same kind, unusualsites, or in tightly constrained urban locations. Rigid frame abutments are generally usedwith tunnel-type single-span connectors and overhead structures which permit passagethrough a roadway embankment. Because the structural supports are adjacent to trafficthese have a high initial cost and present a closed appearance to approaching traffic.
10.4.4 Design Consideration
After the recent 1989 Loma Prieta and the 1994 Northridge Earthquakes in the U.S. and the 1995Kobe earthquake in Japan, major damages were found in substructures. Special attention, therefore,must be paid to seismic effects and the detailing of the ductile structures. Boundary conditions andsoil–foundation–structure interaction in seismic analyses should also be carefully considered.
10.5 Floor System
10.5.1 Introduction
The floor system of a bridge usually consists of a deck, floor beams, and stringers. The deck directlysupports the live load. Floor beams as well as stringers, shown in Figure 10.22, form a grillage andtransmit the load from the deck to the main girders. The floor beams and stringers are used forframed bridges, i.e., truss, rahmen, and arch bridges (see Figures 10.40, 10.45, and 10.47), in whichthe spacing of the main girders or trusses is large. In an upper deck type of plate girder bridge the
c©1999 by CRC Press LLC
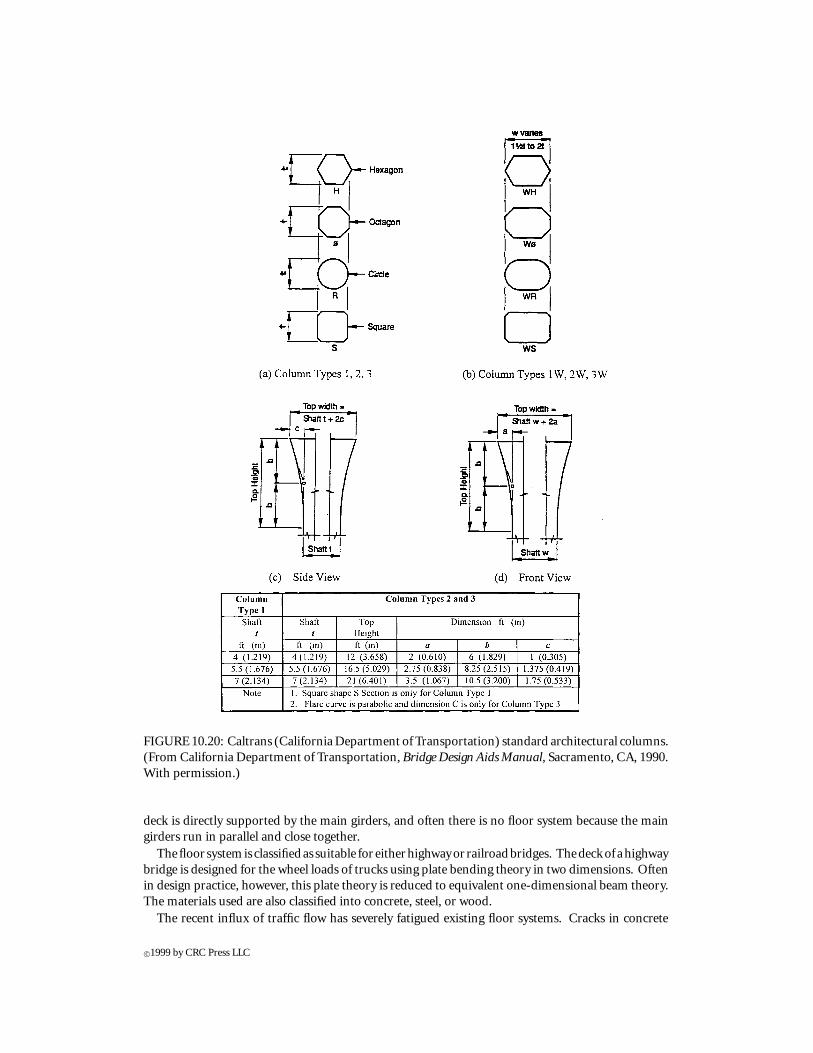
FIGURE 10.20: Caltrans (California Department of Transportation) standard architectural columns.(From California Department of Transportation, Bridge Design Aids Manual, Sacramento, CA, 1990.With permission.)
deck is directly supported by the main girders, and often there is no floor system because the maingirders run in parallel and close together.
Thefloor systemis classifiedas suitable for eitherhighwayor railroadbridges. Thedeckof ahighwaybridge is designed for the wheel loads of trucks using plate bending theory in two dimensions. Oftenin design practice, however, this plate theory is reduced to equivalent one-dimensional beam theory.The materials used are also classified into concrete, steel, or wood.
The recent influx of traffic flow has severely fatigued existing floor systems. Cracks in concrete
c©1999 by CRC Press LLC

FIGURE 10.21: Typical types of abutments. (From California Department of Transportation, BridgeDesign Aids Manual, Sacramento, CA, 1990. With permission.)
decks and connections of floor system are often found in old bridges that have been in service formany years.
10.5.2 Decks
1. Concrete DeckA reinforced concrete deck slab is most commonly used in highway bridges. It is thedeck that is most susceptible to damage caused by the flow of traffic, which continues toincrease. Urban highways are exposed to heavy traffic and must be repaired frequently.Recently, a composite deck slab was developed to increase the strength, ductility, anddurability of decks without increasing their weight or affecting the cost and duration ofconstruction. In a composite slab, the bottom steel plate serves both as a part of theslab and the formwork for pouring the concrete. There are many ways of combiningthe steel plate and the reinforcement. A typical example is shown in Figure 10.23. Thisslab is prefabricated in the yard and then the concrete is poured on site after girders
c©1999 by CRC Press LLC

FIGURE 10.22: Floor system. (From Nagai, N., Bridge Engineering, Kyoritsu Publishing Co., Tokyo,Japan [in Japanese], 1994. With permission.)
have been placed. A precast, prestressed deck may reduce the time required to completeconstruction.
FIGURE 10.23: Composite deck. (From Japan Association of Steel Bridge Construction, Planning ofSteel Bridges, Tokyo [in Japanese], 1988. With permission.)
2. Steel DeckFor long spans, the steel deck is used to minimize the weight of the deck. The steel deckplate is stiffened with longitudinal and transverse ribs as shown in Figure 10.24. Thesteel deck also works as the upper flange of the supporting girders. The pavement on
c©1999 by CRC Press LLC

the steel deck should be carefully finished to prevent water from penetrating through thepavement and causing the steel deck to rust.
FIGURE 10.24: Steel plate deck. (From Japan Association of Steel Bridge Construction, Outline ofSteel Bridges, Tokyo [in Japanese], 1985. With permission.)
10.5.3 Pavement
The pavement on the deck provides a smooth driving surface and prevents rain water from seepinginto the reinforcing bars and steel deck below. A layer of waterproofing may be inserted between thepavement and the deck. Asphalt is most commonly used to pave highway bridges. Its thickness isusually 5 to 10 cm on highways and 2 to 3 cm on pedestrian bridges.
10.5.4 Stringers
The stringers support the deck directly and transmit the loads to floor beams, as can be seen inFigure 10.22. They are placed in the longitudinal direction just like the main girders are in a plategirder bridge and thus provide much the same kind of support.
The stringers must be sufficiently stiff in bending to prevent cracks from forming in the deck or onthe pavement surface. The design codes usually limit the vertical displacement caused by the weightof a truck.
10.5.5 Floor Beams
The floor beams are placed in the transverse direction and connected by high-tension bolts to thetruss frame or arch, as shown in Figure 10.22. The floor beams support the stringers and transmitthe loads to main girders, trusses, or arches. In other words, the main truss or arch receives the loadsindirectly via the floor beams. The floor beams also provide transverse stiffness to bridges and thusimprove the overall torsional resistance.
c©1999 by CRC Press LLC
10.6 Bearings, Expansion Joints, and Railings
10.6.1 Introduction
Aside from the main components, such as the girders or the floor structure, other parts such asbearings (shoes), expansion joints, guardrailings, drainage paths, lighting, and sound-proofing wallsalso make up the structure of a bridge. Each plays a minor part but provides an essential function.Drains flush rain water off and wash away dust. Guardrailings and lights add to the aesthetic qualityof the design as well as providing their obvious original functions. A sound-proofing wall may takeaway from the beauty of the structure but might be required by law in urban areas to isolate the soundof traffic from the surrounding residents. In the following section, bearings, expansion joints, andguardrailings are discussed.
10.6.2 Bearings (Shoes)
Bearings support the superstructure (the main girders, trusses, or arches) and transmit the loads tothe substructure (abutments or piers). The bearings connect the upper and lower structures andcarry the whole weight of the superstructure. The bearings are designed to resist these reaction forcesby providing support conditions that are fixed or hinged. The hinged bearings may be movable orimmovable; horizontal movement is restrained or unrestrained, i.e., horizontal reaction is producedor not. The amount of the horizontal movement is determined by calculating the elongation due toa temperature change.
Many bearings were found to have sustained extensive damage during the 1995 Kobe Earthquakein Japan, due to stress concentrations, which are the weak spots along the bridge. The bearings mayplay the role of a fuse to keep damage from occurring at vital sections of the bridge, but the risk ofthe superstructure falling down goes up. The girder-to-girder or girder-to-abutment connectionsprevent the girders from collapsing during strong earthquakes.
Many types of bearings are available. Some are shown in Figure 10.25 and briefly explained in thefollowing:
Line bearings: The contacting line between the upper plate and the bottom round surfaceprovides rotational capability as well as sliding. These are used in small bridges.
Plate bearings: The bearing plate has a plane surface on the top side which allows sliding and aspherical surface on the bottom allowing rotation. The plate is placed between the upperand lower shoes.
Hinged bearings (pin bearings): A pin is inserted between the upper and lower shoes allowingrotation but no translation in longitudinal direction.
Roller bearings: Lateral translation is unrestrained by using single or multiple rollers for hingedbearings or spherical bearings.
Spherical bearings (pivot bearings): Convex and concave spherical surfaces allow rotation inall directions and no lateral movement. The two types are: a point contact for largedifferences in the radii of each sphere and a surface contact for small differences in theirradii.
Pendel bearings: An eye bar connects the superstructure and the substructure by a pin at eachend. Longitudinal movement is permitted by inclining the eye bar; therefore, the distanceof the pins at ends should be properly determined. These are used to provide a negativereaction in cable-stayed bridges. There is no resistance in the transverse direction.
Wind bearings: This type of bearing provides transverse resistance for wind and is often usedwith pendel bearings.
c©1999 by CRC Press LLC
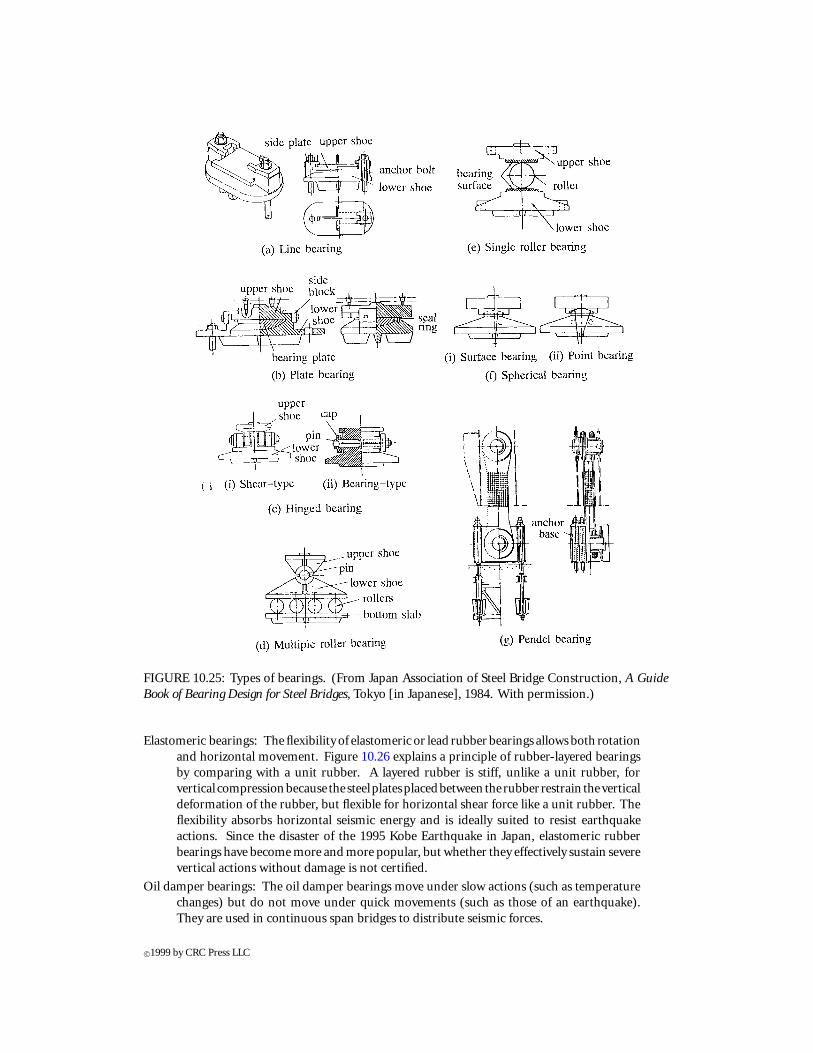
FIGURE 10.25: Types of bearings. (From Japan Association of Steel Bridge Construction, A GuideBook of Bearing Design for Steel Bridges, Tokyo [in Japanese], 1984. With permission.)
Elastomeric bearings: The flexibility of elastomeric or lead rubber bearings allows both rotationand horizontal movement. Figure 10.26 explains a principle of rubber-layered bearingsby comparing with a unit rubber. A layered rubber is stiff, unlike a unit rubber, forvertical compressionbecause the steelplatesplacedbetween the rubber restrain theverticaldeformation of the rubber, but flexible for horizontal shear force like a unit rubber. Theflexibility absorbs horizontal seismic energy and is ideally suited to resist earthquakeactions. Since the disaster of the 1995 Kobe Earthquake in Japan, elastomeric rubberbearings have become more and more popular, but whether they effectively sustain severevertical actions without damage is not certified.
Oil damper bearings: The oil damper bearings move under slow actions (such as temperaturechanges) but do not move under quick movements (such as those of an earthquake).They are used in continuous span bridges to distribute seismic forces.
c©1999 by CRC Press LLC

FIGURE 10.26: Properties of elastomeric bearings.
A selection from these types of bearings is made according to the size of the bridge and themagnitude of predicted downward or upward reaction forces.
10.6.3 Expansion Joints
Expansion joints are provided to allow a bridge to adjust its length under changes in temperatureor deformation by external loads. They are designed according to expanding length and material asclassified in Figure 10.27. Steel expansion joints are most commonly used. A defect is often foundat the boundary between the steel and the concrete slab where the disturbing jolt is given to drivers
c©1999 by CRC Press LLC

as they pass over the junction. To solve this problem, rubber joints are used on the road surfaceto provide a smooth transition for modern bridge construction (see Figure 10.27e), or continuousgirders are more commonly adopted than simple girders.
FIGURE 10.27: Types of expansion joints. (From Japan Association of Steel Bridge Construction, AGuide Book of Expansion Joint Design for Steel Bridges, Tokyo [in Japanese], 1984. With permission.)
10.6.4 Railings
Guardrailings are provided to ensure vehicles and pedestrians do not fall off the bridge. They may bea handrail for pedestrians, a heavier guard for vehicles, or a common railing for both. These are madefrom materials such as concrete, steel, or aluminum. The guardrailings are located prominently andare thus open to the critical eye of the public. It is important that they not only keep traffic withinboundaries but also add to the aesthetic appeal of the whole bridge (Figure 10.28).
c©1999 by CRC Press LLC

FIGURE 10.28: Pedestrian railing. (From Japan Association of Steel Bridge Construction, Outline ofSteel Bridges, Tokyo [in Japanese], 1985. With permission.)
10.7 Girder Bridges
10.7.1 Structural Features
Girder bridges are structurally the simplest and the most common. They consist of a floor slab,girders, and the bearings which support and transmit gravity loads to the substructure. Girders resistbending moments and shear forces and are used to span short distances. Girders are classified bymaterial into steel plate and box girders, reinforced or prestressed concrete T-beams, and compositegirders. The box girder is also used often for prestressed concrete continuous bridges. The steelgirder bridges are explained in this section; the concrete bridges were described in Section 10.3.
Figure 10.29 shows the structural composition of plate and box girder bridges and the load transferpath. In plate girder bridges, the live load is directly supported by the slab and then by the maingirders. In box girder bridges the forces are taken first by the slab, then supported by the stringers
c©1999 by CRC Press LLC
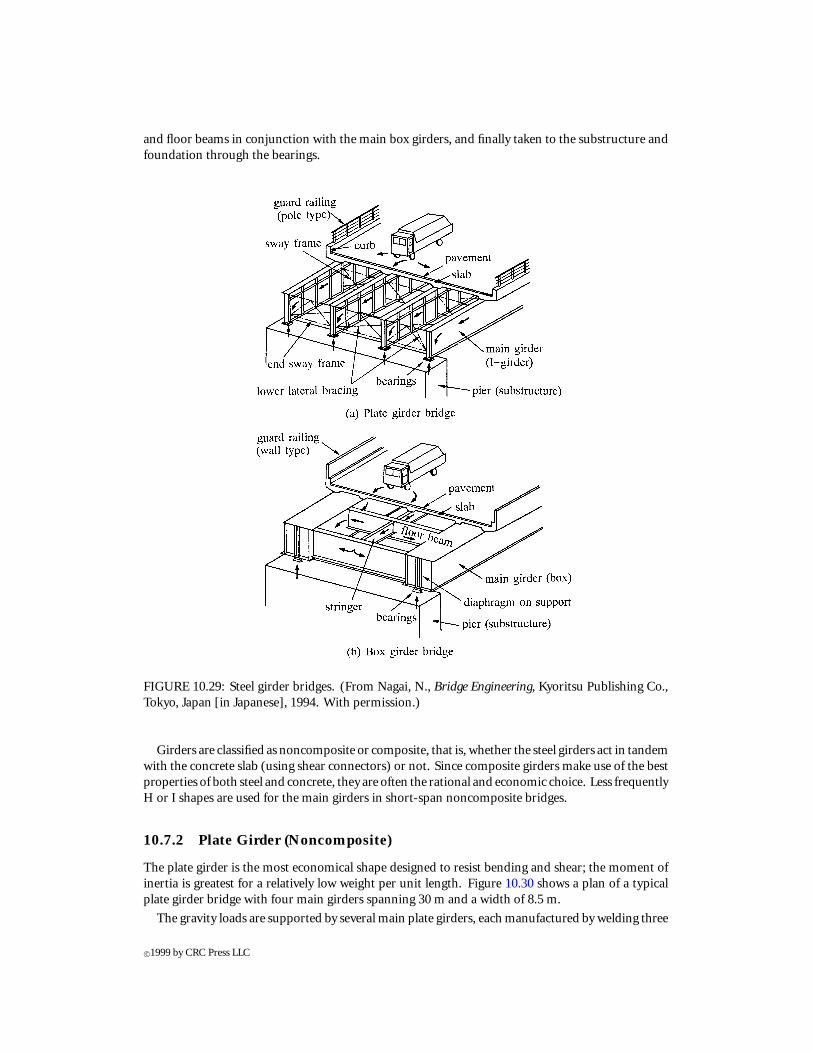
and floor beams in conjunction with the main box girders, and finally taken to the substructure andfoundation through the bearings.
FIGURE 10.29: Steel girder bridges. (From Nagai, N., Bridge Engineering, Kyoritsu Publishing Co.,Tokyo, Japan [in Japanese], 1994. With permission.)
Girders are classified as noncomposite or composite, that is, whether the steel girders act in tandemwith the concrete slab (using shear connectors) or not. Since composite girders make use of the bestproperties of both steel and concrete, they are often the rational and economic choice. Less frequentlyH or I shapes are used for the main girders in short-span noncomposite bridges.
10.7.2 Plate Girder (Noncomposite)
The plate girder is the most economical shape designed to resist bending and shear; the moment ofinertia is greatest for a relatively low weight per unit length. Figure 10.30 shows a plan of a typicalplate girder bridge with four main girders spanning 30 m and a width of 8.5 m.
The gravity loads are supported by several main plate girders, each manufactured by welding three
c©1999 by CRC Press LLC

FIGURE 10.30: General plans of a typical plate girder bridge. (From Tachibana, Y. and Nakai, H.,Bridge Engineering, Kyoritsu Publishing Co., Tokyo, Japan [in Japanese], 1996. With permission.)
plates: an upper and lower flange and a web. Figure 10.31 shows a block of plate girder and itsfabrication process. The web and the flanges are cut from steel plate and welded. The block isfabricated in the shop and transported to the construction site for erection.
The design procedure for plate girders, primarily the sizing of the three plates, is as follows:
1. Web height: The web height is the fundamental design factor affecting the weight andcost of the bridge. If the height is too small, the flanges need to be large and the deadweight increases. The height (h) is determined empirically by dividing the span length(L) by a “reasonable” factor. Common ratios are h/L = 1/18 to 1/20 for highway bridgesand a little smaller for railway bridges. The web height also influences the stiffness of the
c©1999 by CRC Press LLC

FIGURE 10.31: Fabrication of plate girder block.
bridge. Greater heights generally produce greater stiffness. However, if the height is toogreat, the web becomes unstable and must have its thickness supplemented or stiffenersadded. These measures increase the weight and the cost. In addition, plate girders withexcessively deep web and small flanges are liable to buckle laterally.
2. Web thickness: The web primarily resists shear forces, which are not usually significantwhen the web height is properly designed. The shear force is generally assumed to bedistributed uniformly across the web instead of using the exact equation of beam theory.The web thickness (t) is determined such that thinner is better as long as buckling isprevented. Since the web does not contribute much to the bending resistance, thin websare most economical but the possibility of buckling increases. Therefore, the web isusually stiffened by horizontal and vertical stiffeners, which will be discussed later (seeFigure 10.34). It is not primarily strength but rather stiffness that controls the design ofwebs.
3. Area of flanges: After the sizes of web are determined, the flanges are designed. The flangeswork mostly in bending and the required area is calculated using equilibrium conditionsimposed on the internal and external bending moment. A selection of strength for thesteel material is principally made at this stage in the design process.
4. Width and thickness of flanges: The width and thickness can be determined by ensur-ing that the area of the flanges falls under the limiting width-to-thickness ratio, b/t
(Figure 10.32), as specified in design codes. If the flanges are too thin (i.e., the width-to-thickness ratio is too large), the compression flange may buckle or the tension flange maybe distorted by the heat of welding. Thus, the thickness of both flanges must be checked.Since plate girders have little torsional resistance, special attention should be paid to lat-eral torsional buckling. To prevent this phenomenon, the compression flange must havesufficient width to resist “out-of-plane” bending. Figure 10.33 shows the lateral torsionalbuckling that may occur by bending with respect to strong axis.
After determining the member sizes, calculations of the resisting moment capacity are made toensure code requirements are satisfied. If these fail, the above steps must be repeated until thespecifications are met.
A few other important factors in the design of girder bridges will be explained in the following:
Design of web stiffeners: The horizontal and vertical stiffeners should be attached to the web
c©1999 by CRC Press LLC
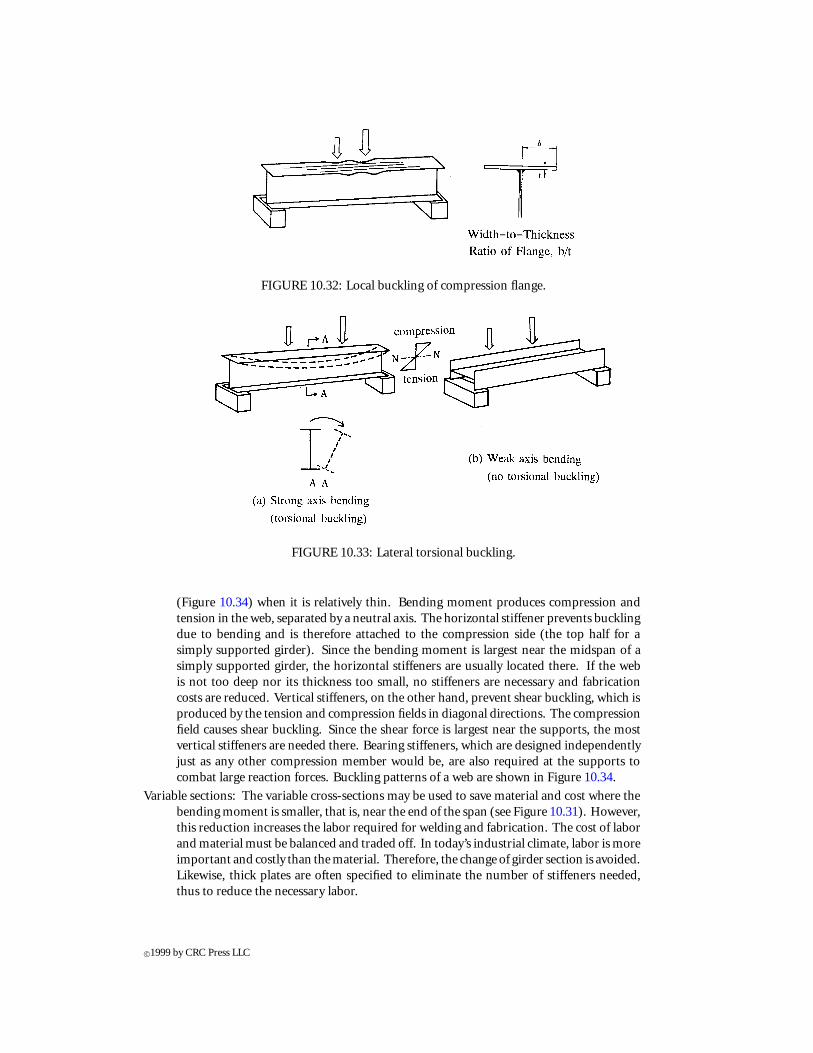
FIGURE 10.32: Local buckling of compression flange.
FIGURE 10.33: Lateral torsional buckling.
(Figure 10.34) when it is relatively thin. Bending moment produces compression andtension in the web, separated by a neutral axis. The horizontal stiffener prevents bucklingdue to bending and is therefore attached to the compression side (the top half for asimply supported girder). Since the bending moment is largest near the midspan of asimply supported girder, the horizontal stiffeners are usually located there. If the webis not too deep nor its thickness too small, no stiffeners are necessary and fabricationcosts are reduced. Vertical stiffeners, on the other hand, prevent shear buckling, which isproduced by the tension and compression fields in diagonal directions. The compressionfield causes shear buckling. Since the shear force is largest near the supports, the mostvertical stiffeners are needed there. Bearing stiffeners, which are designed independentlyjust as any other compression member would be, are also required at the supports tocombat large reaction forces. Buckling patterns of a web are shown in Figure 10.34.
Variable sections: The variable cross-sections may be used to save material and cost where thebending moment is smaller, that is, near the end of the span (see Figure 10.31). However,this reduction increases the labor required for welding and fabrication. The cost of laborand material must be balanced and traded off. In today’s industrial climate, labor is moreimportant and costly than the material. Therefore, the change of girder section is avoided.Likewise, thick plates are often specified to eliminate the number of stiffeners needed,thus to reduce the necessary labor.
c©1999 by CRC Press LLC

FIGURE 10.34: Buckling and stiffeners of web.
10.7.3 Composite Girder
If two beams are simply laid one upon the other, as shown in Figure 10.35a, they act separately andonly share the load depending on their relative flexural stiffness. In this case, slip occurs along theboundary between the beams. However, if the two beams are connected and slip prevented as shownin Figure 10.35b, they act as a unit, i.e., a composite girder. For composite plate girder bridges,the steel girder and the concrete slab are joined by shear connectors. In this way, the concrete slabbecomes integral with the girder and usually takes most of the compression component of the bendingmoment while the steel plate girder takes the tension. Composite girders are much more effectivethan the simply tiered girder.
FIGURE 10.35: Principle of tiered beam and composite beam. (From Tachibana, Y. and Nakai, H.,Bridge Engineering, Kyoritsu Publishing Co., Tokyo, Japan [in Japanese], 1996. With permission.)
Let us consider the two cases shown in Figure 10.35 and note the difference between tiered beamsand composite beams. Both have the same cross-sections and are subjected to a concentrated load atmidspan. The moment of inertia for the composite beam is four times that of the tiered beams, thus
c©1999 by CRC Press LLC

the resulting vertical deflection is one-fourth. The maximum bending stress in the extreme (top orbottom) fiber is half that of the tiered beam configuration.
The corresponding stress distributions are shown in Figure 10.36. Points “S” and “V” are thecenter of area of the steel section and the composite section, respectively. According to beam theory,the strain distribution is linear but the stress distribution has a step change at the boundary betweenthe steel and concrete.
FIGURE 10.36: Section of composite girder. (From Tachibana, Y. and Nakai, H., Bridge Engineering,Kyoritsu Publishing Co., Tokyo, Japan [in Japanese], 1996. With permission.)
Three types of shear connectors—studs, horse shoes, and steel blocks—are shown in Figure 10.37.Studs are most commonly used since they are easily welded to the compression flange by the electric
FIGURE 10.37: Types of shear connectors. (From Nagai, N., Bridge Engineering, Kyoritsu PublishingCo., Tokyo, Japan [in Japanese], 1994. With permission.)
resistance welding, but the weld inspection is a cumbersome task. If the weld on a certain stud ispoor, the stud may shear off and trigger a totally unforeseen failure mode. Other types are consideredto maintain more reliability.
Shear connectors are needed most near the ends of the span, where the shear force is largest. Thisregion is illustrated in Figure 10.35a, which shows the maximum shift due to slip occurs at the endsof tiered beams. It is this slip that is restrained by the shear connectors.
c©1999 by CRC Press LLC

10.7.4 Grillage Girder
When girders are placed in a row and connected transversely by floor beams, the truck loads aredistributed by the floor beams to the girders. This system is called a grillage of girders. If the maingirders are plate girders, no stiffness in torsion is considered. On the other hand, box girders andconcrete girders can be analyzed assuming stiffness is available to resist torsion. Floor beams increasethe torsional resistance of the whole structural system of the bridge.
Let us consider the structural system shown in Figure 10.38a to observe the load distribution in agrillage system. This grillage has three girders with one floor beam at midspan. In this case, there
FIGURE 10.38: Grillage girders. (From Tachibana, Y. and Nakai, H., Bridge Engineering, KyoritsuPublishing Co., Tokyo, Japan [in Japanese], 1996. With permission.)
are three nodal forces at the intersections of the girders and the floor beam but only two equilibriumequations (V = 0andM = 0). Thus, itbecomesonedegree statically indeterminate. Ifwedisconnectthe intersection between main girder B and the floor beam and apply a pair of indeterminate forces,X, at point b, as shown in Figure 10.38b, X can be obtained using the compatibility condition at point
c©1999 by CRC Press LLC
b. Once the force, X, is found, the sectional forces in the girders can be calculated. This structuralsystem is commonly applied to the practical design of plate girder bridges.
10.7.5 Box Girder
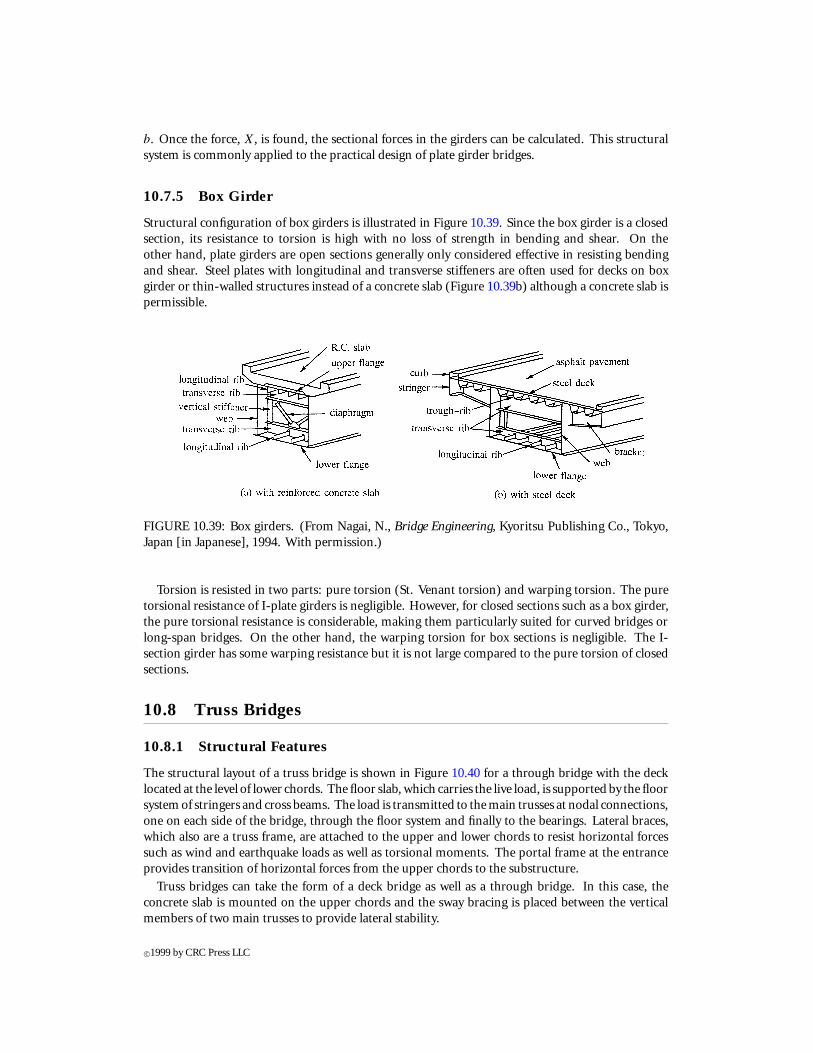
Structural configuration of box girders is illustrated in Figure 10.39. Since the box girder is a closedsection, its resistance to torsion is high with no loss of strength in bending and shear. On theother hand, plate girders are open sections generally only considered effective in resisting bendingand shear. Steel plates with longitudinal and transverse stiffeners are often used for decks on boxgirder or thin-walled structures instead of a concrete slab (Figure 10.39b) although a concrete slab ispermissible.
FIGURE 10.39: Box girders. (From Nagai, N., Bridge Engineering, Kyoritsu Publishing Co., Tokyo,Japan [in Japanese], 1994. With permission.)
Torsion is resisted in two parts: pure torsion (St. Venant torsion) and warping torsion. The puretorsional resistance of I-plate girders is negligible. However, for closed sections such as a box girder,the pure torsional resistance is considerable, making them particularly suited for curved bridges orlong-span bridges. On the other hand, the warping torsion for box sections is negligible. The I-section girder has some warping resistance but it is not large compared to the pure torsion of closedsections.
10.8 Truss Bridges
10.8.1 Structural Features
The structural layout of a truss bridge is shown in Figure 10.40 for a through bridge with the decklocated at the level of lower chords. The floor slab, which carries the live load, is supported by the floorsystem of stringers and cross beams. The load is transmitted to the main trusses at nodal connections,one on each side of the bridge, through the floor system and finally to the bearings. Lateral braces,which also are a truss frame, are attached to the upper and lower chords to resist horizontal forcessuch as wind and earthquake loads as well as torsional moments. The portal frame at the entranceprovides transition of horizontal forces from the upper chords to the substructure.
Truss bridges can take the form of a deck bridge as well as a through bridge. In this case, theconcrete slab is mounted on the upper chords and the sway bracing is placed between the verticalmembers of two main trusses to provide lateral stability.
c©1999 by CRC Press LLC
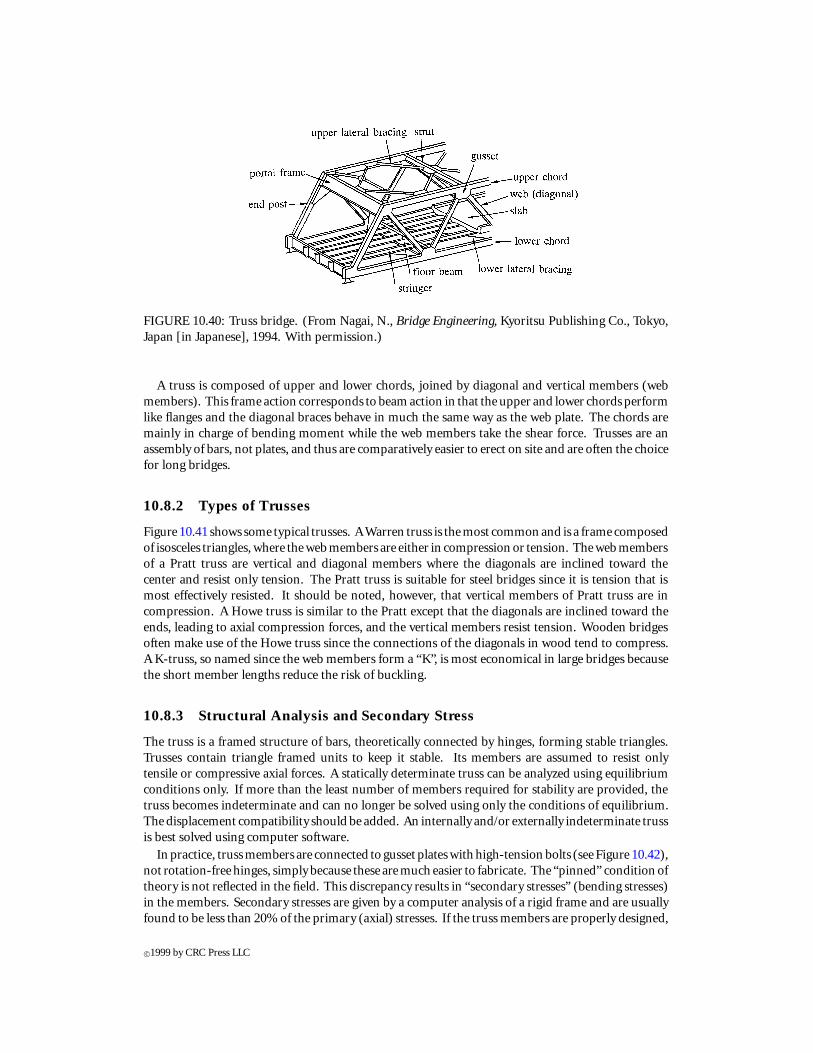
FIGURE 10.40: Truss bridge. (From Nagai, N., Bridge Engineering, Kyoritsu Publishing Co., Tokyo,Japan [in Japanese], 1994. With permission.)
A truss is composed of upper and lower chords, joined by diagonal and vertical members (webmembers). This frame action corresponds to beam action in that the upper and lower chords performlike flanges and the diagonal braces behave in much the same way as the web plate. The chords aremainly in charge of bending moment while the web members take the shear force. Trusses are anassembly of bars, not plates, and thus are comparatively easier to erect on site and are often the choicefor long bridges.
10.8.2 Types of Trusses
Figure 10.41 shows some typical trusses. A Warren truss is the most common and is a frame composedof isosceles triangles, where the web members are either in compression or tension. The web membersof a Pratt truss are vertical and diagonal members where the diagonals are inclined toward thecenter and resist only tension. The Pratt truss is suitable for steel bridges since it is tension that ismost effectively resisted. It should be noted, however, that vertical members of Pratt truss are incompression. A Howe truss is similar to the Pratt except that the diagonals are inclined toward theends, leading to axial compression forces, and the vertical members resist tension. Wooden bridgesoften make use of the Howe truss since the connections of the diagonals in wood tend to compress.A K-truss, so named since the web members form a “K”, is most economical in large bridges becausethe short member lengths reduce the risk of buckling.
10.8.3 Structural Analysis and Secondary Stress
The truss is a framed structure of bars, theoretically connected by hinges, forming stable triangles.Trusses contain triangle framed units to keep it stable. Its members are assumed to resist onlytensile or compressive axial forces. A statically determinate truss can be analyzed using equilibriumconditions only. If more than the least number of members required for stability are provided, thetruss becomes indeterminate and can no longer be solved using only the conditions of equilibrium.The displacement compatibility should be added. An internally and/or externally indeterminate trussis best solved using computer software.
In practice, truss members are connected to gusset plates with high-tension bolts (see Figure 10.42),not rotation-free hinges, simply because these are much easier to fabricate. The “pinned” condition oftheory is not reflected in the field. This discrepancy results in “secondary stresses” (bending stresses)in the members. Secondary stresses are given by a computer analysis of a rigid frame and are usuallyfound to be less than 20% of the primary (axial) stresses. If the truss members are properly designed,
c©1999 by CRC Press LLC
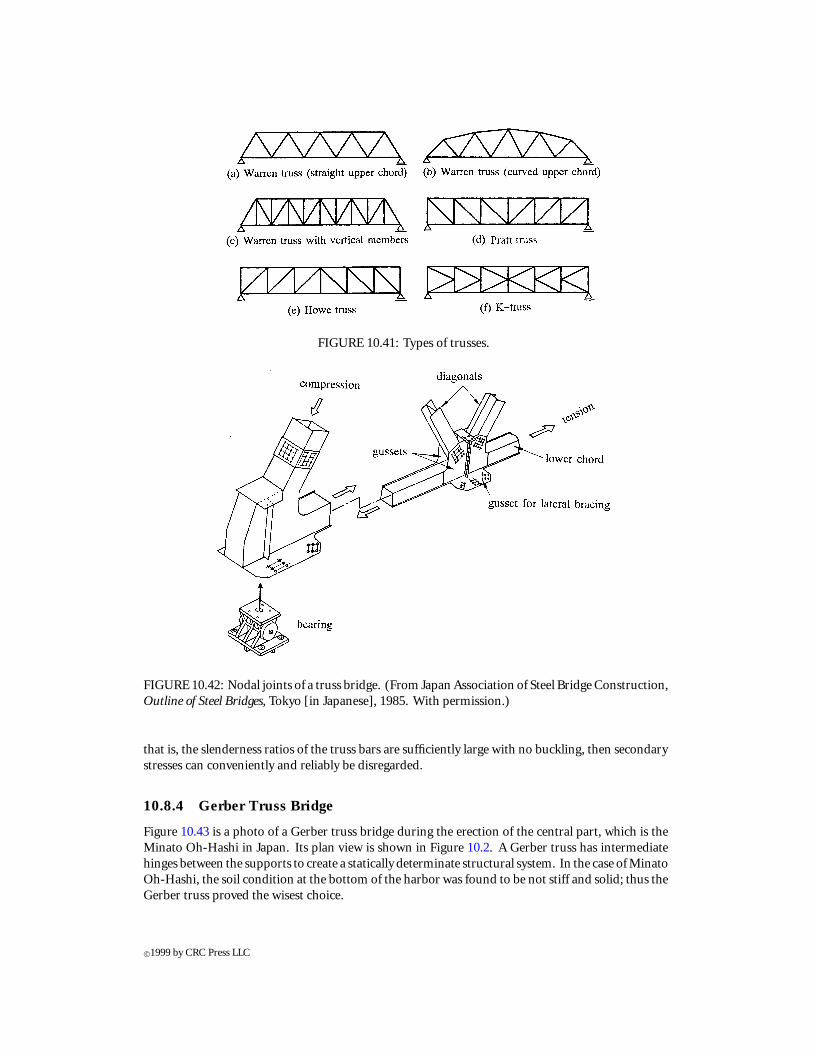
FIGURE 10.41: Types of trusses.
FIGURE 10.42: Nodal joints of a truss bridge. (From Japan Association of Steel Bridge Construction,Outline of Steel Bridges, Tokyo [in Japanese], 1985. With permission.)
that is, the slenderness ratios of the truss bars are sufficiently large with no buckling, then secondarystresses can conveniently and reliably be disregarded.
10.8.4 Gerber Truss Bridge
Figure 10.43 is a photo of a Gerber truss bridge during the erection of the central part, which is theMinato Oh-Hashi in Japan. Its plan view is shown in Figure 10.2. A Gerber truss has intermediatehinges between the supports to create a statically determinate structural system. In the case of MinatoOh-Hashi, the soil condition at the bottom of the harbor was found to be not stiff and solid; thus theGerber truss proved the wisest choice.
c©1999 by CRC Press LLC

FIGURE 10.43: Lifting erection of the Minato Oh-Hashi, Japan. (Gerber bridge, 1974). (FromHanshin Expressway Public Corporation, Techno Gallery, Osaka, Japan, 1994. With permission.)
10.9 Rigid Frame Bridges (Rahmen Bridges)
10.9.1 Structural Features
The members are rigidly connected in “rahmen” structures or “rigid frames”. Unlike the truss andthe arch bridges, which will be discussed in the following subsection, all the members are subjectedto both an axial force and bending moments. Figure 10.44 shows various types of rahmen bridges.
Themembersof a rigid framebridgearemuch larger than those ina typical building. Consequently,stress concentrations occur at the junctions of beams and columns which must be carefully designedusing finite element analyses or experimental verification. The supports of rahmen bridges are eitherhinged or fixed, making it an externally indeterminate structure, and it is therefore not suitable whenthe foundation is likely to sink. The reactions at supports are horizontal and vertical forces at hinges,with the addition of a bending moment at a fixed base.
10.9.2 Portal Frame
A portal frame is the simplest design (Figure 10.44a) and is widely used for the piers of elevatedhighway bridges because the space underneath can be effectively used for other roads or parking lots.These piers were proved, in the 1995 Kobe Earthquake in Japan, to be more resilient, that is, to retainmore strength and absorb more energy than single-legged piers.
10.9.3 π-Rahmen (Strutted Beam Bridge)
The π-rahmen design is usually used for bridges in mountainous regions where the foundation isfirm, passing over deep valleys with a relatively long span, or for bridges crossing over expressways(Figure 10.44b). As shown in the structural layout of a π-rahmen bridge in Figure 10.45, the twolegs support the main girders, inducing axial compression in the center span of the girder. Live loadon the deck is transmitted to the main girders through the floor system. Intermediate hinges may be
c©1999 by CRC Press LLC
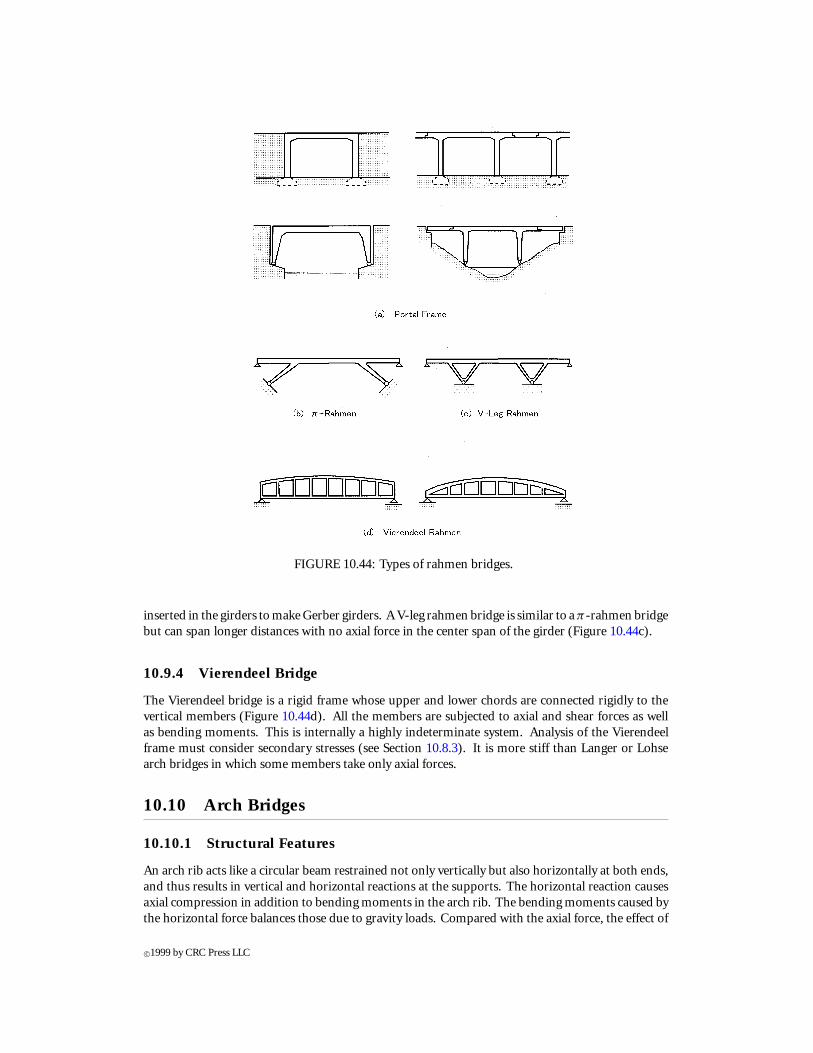
FIGURE 10.44: Types of rahmen bridges.
inserted in the girders to make Gerber girders. A V-leg rahmen bridge is similar to aπ-rahmen bridgebut can span longer distances with no axial force in the center span of the girder (Figure 10.44c).
10.9.4 Vierendeel Bridge
The Vierendeel bridge is a rigid frame whose upper and lower chords are connected rigidly to thevertical members (Figure 10.44d). All the members are subjected to axial and shear forces as wellas bending moments. This is internally a highly indeterminate system. Analysis of the Vierendeelframe must consider secondary stresses (see Section 10.8.3). It is more stiff than Langer or Lohsearch bridges in which some members take only axial forces.
10.10 Arch Bridges
10.10.1 Structural Features
An arch rib acts like a circular beam restrained not only vertically but also horizontally at both ends,and thus results in vertical and horizontal reactions at the supports. The horizontal reaction causesaxial compression in addition to bending moments in the arch rib. The bending moments caused bythe horizontal force balances those due to gravity loads. Compared with the axial force, the effect of
c©1999 by CRC Press LLC
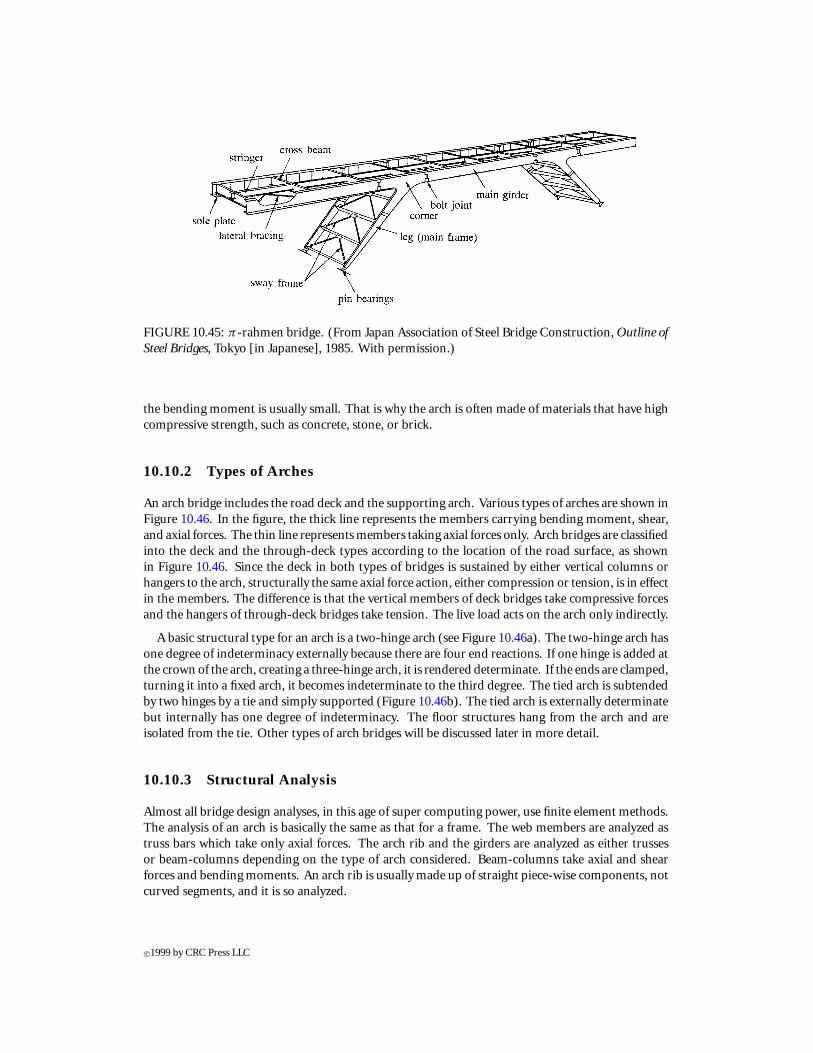
FIGURE 10.45: π-rahmen bridge. (From Japan Association of Steel Bridge Construction, Outline ofSteel Bridges, Tokyo [in Japanese], 1985. With permission.)
the bending moment is usually small. That is why the arch is often made of materials that have highcompressive strength, such as concrete, stone, or brick.
10.10.2 Types of Arches
An arch bridge includes the road deck and the supporting arch. Various types of arches are shown inFigure 10.46. In the figure, the thick line represents the members carrying bending moment, shear,and axial forces. The thin line represents members taking axial forces only. Arch bridges are classifiedinto the deck and the through-deck types according to the location of the road surface, as shownin Figure 10.46. Since the deck in both types of bridges is sustained by either vertical columns orhangers to the arch, structurally the same axial force action, either compression or tension, is in effectin the members. The difference is that the vertical members of deck bridges take compressive forcesand the hangers of through-deck bridges take tension. The live load acts on the arch only indirectly.
A basic structural type for an arch is a two-hinge arch (see Figure 10.46a). The two-hinge arch hasone degree of indeterminacy externally because there are four end reactions. If one hinge is added atthe crown of the arch, creating a three-hinge arch, it is rendered determinate. If the ends are clamped,turning it into a fixed arch, it becomes indeterminate to the third degree. The tied arch is subtendedby two hinges by a tie and simply supported (Figure 10.46b). The tied arch is externally determinatebut internally has one degree of indeterminacy. The floor structures hang from the arch and areisolated from the tie. Other types of arch bridges will be discussed later in more detail.
10.10.3 Structural Analysis
Almost all bridge design analyses, in this age of super computing power, use finite element methods.The analysis of an arch is basically the same as that for a frame. The web members are analyzed astruss bars which take only axial forces. The arch rib and the girders are analyzed as either trussesor beam-columns depending on the type of arch considered. Beam-columns take axial and shearforces and bending moments. An arch rib is usually made up of straight piece-wise components, notcurved segments, and it is so analyzed.
c©1999 by CRC Press LLC

FIGURE 10.46: Types of arch bridges. (From Shimada, S., Journal of Bridge and Foundation Engi-neering, 25(8), 1991 [in Japanese]. With permission.)
10.10.4 Langer Bridge
TheLanger arch is analyzedby assuming that the arch rib takes only axial compression (Figure10.46c).The arch rib is thin, but the girders are deep and resist moment and shear as well as axial tension.The girders of the Langer bridge are regarded as being strengthened by the arch rib. Figure 10.47shows the structural components of a Langer bridge.
If diagonals are used in the web, it is called a trussed Langer. The difference between a trussedLanger and a standard truss is that the lower chord is a girder instead of just a bar. The Langer bridgeis also determinate externally and indeterminate internally. The deck-type bridge of the Langer isoften called a reversed Langer.
10.10.5 Lohse Bridge
The Lohse bridge is very similar to the Langer bridge except the Lohse bridge carries its resistance tobending in the arch rib as well as the girder (Figure 10.46d). By this assumption, the Lohse bridge isstiffer than the Langer. The distribution of bending moments in the arch rib and the girder dependson the stiffness ratio of the two members, which is the designer’s decision. The Lohse arch bridgesmay be thought of as tiered beams (see Figure 10.35) connected by vertical members. The vertical
c©1999 by CRC Press LLC
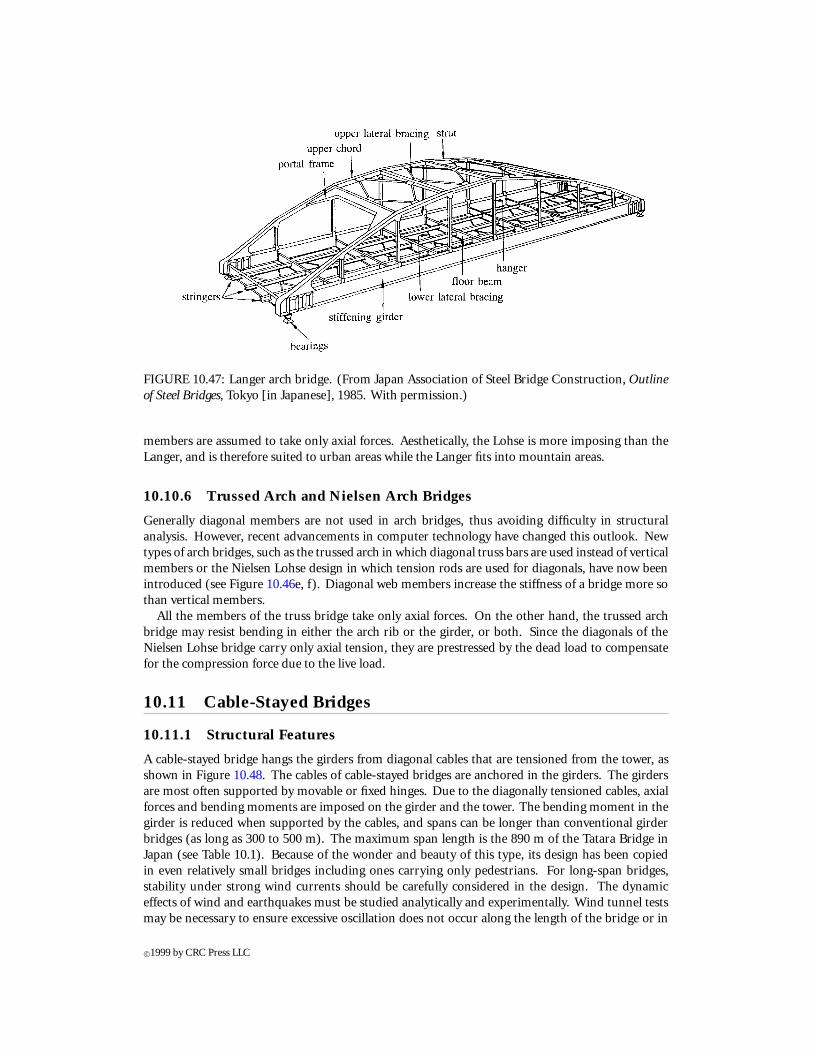
FIGURE 10.47: Langer arch bridge. (From Japan Association of Steel Bridge Construction, Outlineof Steel Bridges, Tokyo [in Japanese], 1985. With permission.)
members are assumed to take only axial forces. Aesthetically, the Lohse is more imposing than theLanger, and is therefore suited to urban areas while the Langer fits into mountain areas.
10.10.6 Trussed Arch and Nielsen Arch Bridges
Generally diagonal members are not used in arch bridges, thus avoiding difficulty in structuralanalysis. However, recent advancements in computer technology have changed this outlook. Newtypes of arch bridges, such as the trussed arch in which diagonal truss bars are used instead of verticalmembers or the Nielsen Lohse design in which tension rods are used for diagonals, have now beenintroduced (see Figure 10.46e, f). Diagonal web members increase the stiffness of a bridge more sothan vertical members.
All the members of the truss bridge take only axial forces. On the other hand, the trussed archbridge may resist bending in either the arch rib or the girder, or both. Since the diagonals of theNielsen Lohse bridge carry only axial tension, they are prestressed by the dead load to compensatefor the compression force due to the live load.
10.11 Cable-Stayed Bridges
10.11.1 Structural Features
A cable-stayed bridge hangs the girders from diagonal cables that are tensioned from the tower, asshown in Figure 10.48. The cables of cable-stayed bridges are anchored in the girders. The girdersare most often supported by movable or fixed hinges. Due to the diagonally tensioned cables, axialforces and bending moments are imposed on the girder and the tower. The bending moment in thegirder is reduced when supported by the cables, and spans can be longer than conventional girderbridges (as long as 300 to 500 m). The maximum span length is the 890 m of the Tatara Bridge inJapan (see Table 10.1). Because of the wonder and beauty of this type, its design has been copiedin even relatively small bridges including ones carrying only pedestrians. For long-span bridges,stability under strong wind currents should be carefully considered in the design. The dynamiceffects of wind and earthquakes must be studied analytically and experimentally. Wind tunnel testsmay be necessary to ensure excessive oscillation does not occur along the length of the bridge or in
c©1999 by CRC Press LLC

FIGURE 10.48: Cable-stayed bridge. (From Japan Association of Steel Bridge Construction, Outlineof Steel Bridges, Tokyo [in Japanese], 1985. With permission.)
the tower. The cables also may resonate in the wind if they are thin and flexible. In this case, devicesare necessary to curb the vibration. The stability of bridges under wind loads will be discussed inmore detail in Section 10.12 (see Figure 10.61).
10.11.2 Types of Cable-Stayed Bridges
Cable-stayed bridges may be classified by the hanging formation of the cable and the shape of thetower. Figure 10.49 illustrates three typical cable formations. Structurally, the radial cable mosteffectively decreases the axial force in the tower and girders; however, difficulty in construction arisesdue to the structural complexity at the top of the tower. The fan type is more common because thecable connections at the tower are distributed. The harp type is aesthetically the most pleasing.
FIGURE 10.49: Types of cable formation. (From Nagai, N., Bridge Engineering, Kyoritsu PublishingCo., Tokyo, Japan [in Japanese], 1994. With permission.)
Figure 10.50 shows various tower designs. As the span length becomes large, columns such as theA, the H, or the upside-down Y shape are selected; these have significant torsional resistance.
10.11.3 Structural Analysis
The cable-stayed bridge is usually analyzed using linear elastic frame analysis. The cable is modeledas a bar element with hinged ends. Figure 10.51 shows the flow of gravity loads. Most of the load is
c©1999 by CRC Press LLC
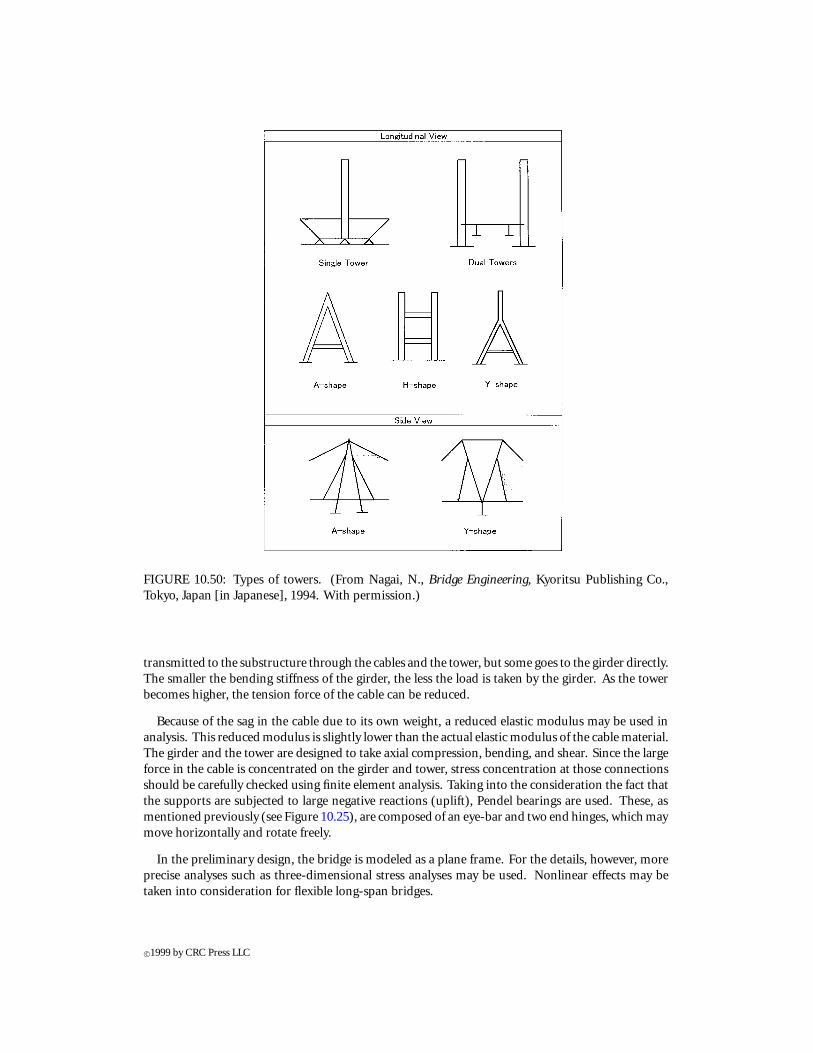
FIGURE 10.50: Types of towers. (From Nagai, N., Bridge Engineering, Kyoritsu Publishing Co.,Tokyo, Japan [in Japanese], 1994. With permission.)
transmitted to the substructure through the cables and the tower, but some goes to the girder directly.The smaller the bending stiffness of the girder, the less the load is taken by the girder. As the towerbecomes higher, the tension force of the cable can be reduced.
Because of the sag in the cable due to its own weight, a reduced elastic modulus may be used inanalysis. This reduced modulus is slightly lower than the actual elastic modulus of the cable material.The girder and the tower are designed to take axial compression, bending, and shear. Since the largeforce in the cable is concentrated on the girder and tower, stress concentration at those connectionsshould be carefully checked using finite element analysis. Taking into the consideration the fact thatthe supports are subjected to large negative reactions (uplift), Pendel bearings are used. These, asmentioned previously (see Figure 10.25), are composed of an eye-bar and two end hinges, which maymove horizontally and rotate freely.
In the preliminary design, the bridge is modeled as a plane frame. For the details, however, moreprecise analyses such as three-dimensional stress analyses may be used. Nonlinear effects may betaken into consideration for flexible long-span bridges.
c©1999 by CRC Press LLC

FIGURE 10.51: Force flow in cable-stayed bridges. (From Nagai, N., Bridge Engineering, KyoritsuPublishing Co., Tokyo, Japan [in Japanese], 1994. With permission.)
10.11.4 Tension in Cable
One of the important aspects in the design of a cable-stayed bridge is the determination of the tensionforce in the cable, which is directly related to forces in the tower and the girder. Control on the tensionforce in the cables is critical. The pre-tension of the cables must be known because it changes thestresses in the girder and the tower. Figure 10.52 shows the bending moment distribution underdead loads along the bridge before and after the prestressing force is applied. It can be seen that theproper prestress reduces bending moments in the girder significantly. If the vertical component ofthe tension is selected to be equal to the reaction of the continuous girder (supported at the junctionof the cable and girder), the bending moment in the girder can be reduced to match that of thecontinuous girder.
FIGURE 10.52: Bending moment distribution. (From Japan Society of Civil Engineers, Cable-StayedBridges—Technology and its Change, Tokyo, Japan [in Japanese], 1990. With permission.)
The following three general principles are to be considered in determining cable tension [19]:
1. Avoid having any bending moments (generated by dead loads) in the tower. This is
c©1999 by CRC Press LLC
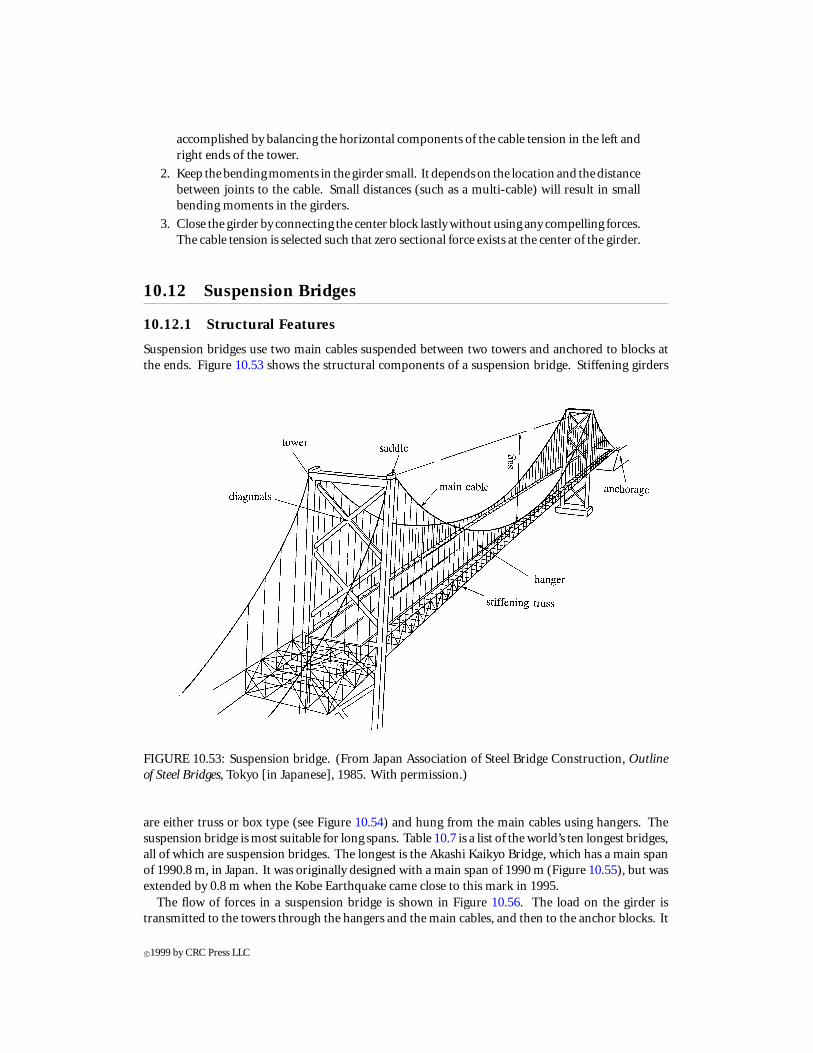
accomplished by balancing the horizontal components of the cable tension in the left andright ends of the tower.
2. Keep the bending moments in the girder small. It depends on the location and the distancebetween joints to the cable. Small distances (such as a multi-cable) will result in smallbending moments in the girders.
3. Close the girder by connecting the center block lastly without using any compelling forces.The cable tension is selected such that zero sectional force exists at the center of the girder.
10.12 Suspension Bridges
10.12.1 Structural Features
Suspension bridges use two main cables suspended between two towers and anchored to blocks atthe ends. Figure 10.53 shows the structural components of a suspension bridge. Stiffening girders
FIGURE 10.53: Suspension bridge. (From Japan Association of Steel Bridge Construction, Outlineof Steel Bridges, Tokyo [in Japanese], 1985. With permission.)
are either truss or box type (see Figure 10.54) and hung from the main cables using hangers. Thesuspension bridge is most suitable for long spans. Table 10.7 is a list of the world’s ten longest bridges,all of which are suspension bridges. The longest is the Akashi Kaikyo Bridge, which has a main spanof 1990.8 m, in Japan. It was originally designed with a main span of 1990 m (Figure 10.55), but wasextended by 0.8 m when the Kobe Earthquake came close to this mark in 1995.
The flow of forces in a suspension bridge is shown in Figure 10.56. The load on the girder istransmitted to the towers through the hangers and the main cables, and then to the anchor blocks. It
c©1999 by CRC Press LLC

FIGURE 10.54: Types of stiffening girders. (From Japan Association of Steel Bridge Construction,Outline of Steel Bridges, Tokyo [in Japanese], 1985. With permission.)
TABLE 10.7 The World’s 10 Longest BridgesCenter span
Rank Name (m) Country Year completed
1 Akashi Kaikyo Bridge 1990 Japan 1998 (est.)2 Great Belt East Bridge 1624 Denmark 1997 (est.)3 Humber Bridge 1410 England 19814 Tsing Ma Bridge 1377 China 1997 (est.)5 Verrazano Gate Bridge 1298 U.S. 19646 Golden Gate Bridge 1280 U.S. 19377 Mackinac Straits Bridge 1158 U.S. 19578 Minami Bisan-Seto Bridge 1100 Japan 19889 Faith Sulton Mehmet Bridge 1090 Turkey 198810 Bosporus Bridge 1074 Turkey 1973
From Honshu Shikoku Bridge Authority, Booklet and Brochures, Japan. With permission.
can be seen that anchor blocks are essential to take the horizontal reaction force from the cables. Thegravity of the anchor blocks resists the upward component of the cable tension force, and the shearforce between the anchor blocks and the foundation resists the horizontal component. Constructiondifficulty may arise where soil conditions are poor. Different from the cable-stayed bridge, no axialforce is induced in the girders of a suspension bridge unless it is a self-anchored suspension bridge(see Figure 10.57d).
The sag in the main cable affects the structural behavior of the suspension bridge: the smaller thesag, the larger the stiffness of the bridge and thereby large horizontal forces are applied to anchorblocks. In general the ratio of the sag to the main span is selected to be about 1:10.
10.12.2 Types of Suspension Bridges
Suspension bridges can be classified by the support condition of their stiffening girders and the maincable (Figure 10.57). The three-span, two-hinge type is most commonly used for highway bridges.The continuous girder is often adopted for railroad bridges to avoid “knuckle points”, which adverselyaffect the trains. When the side span is short, the single-span type is selected. The main cables ofself-anchored bridges are fixed to the girders instead of to the anchor blocks, making the constructionof anchor blocks unnecessary; instead the axial compression is carried in the girders as in the cable-stayed bridge. There are special cases (such as the Severn Bridge in England) where diagonal hangershave been used.
10.12.3 Structural Analysis
If the dead load of the cable and the stiffening girders is assumed to be uniformly distributed alongthe bridge length, the deflection of the cable is parabolic and all dead loads are supported by the
c©1999 by CRC Press LLC
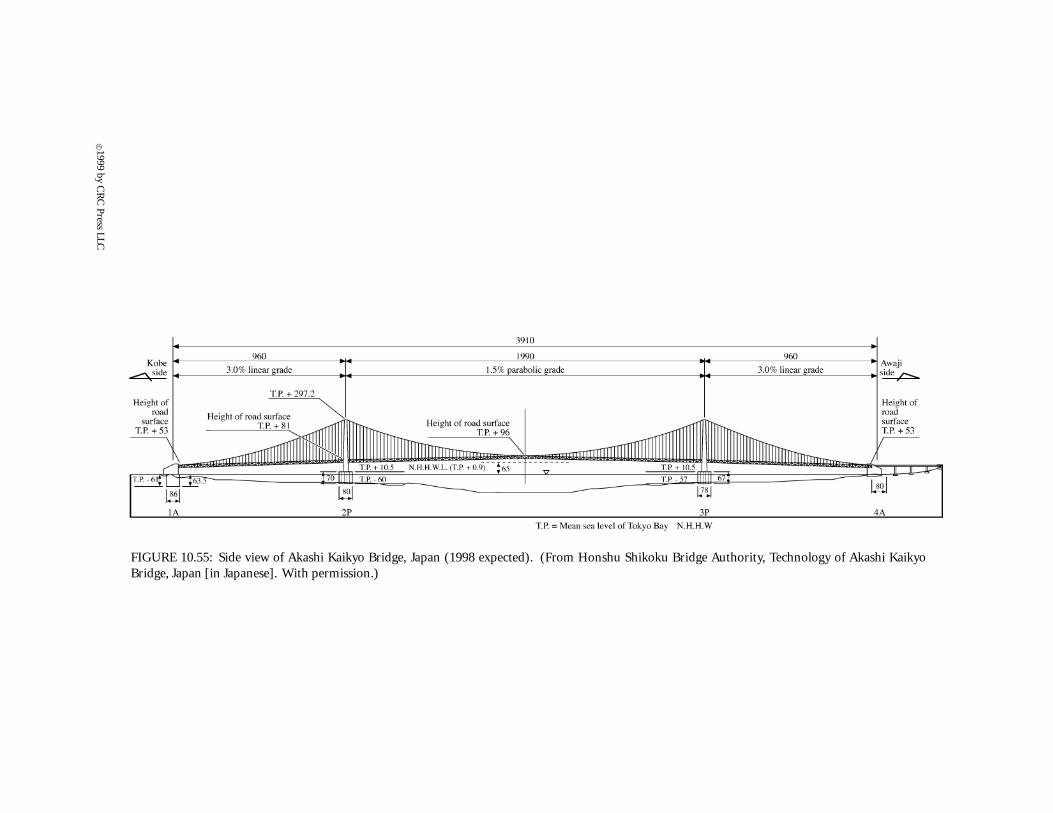
FIGURE 10.55: Side view of Akashi Kaikyo Bridge, Japan (1998 expected). (From Honshu Shikoku Bridge Authority, Technology of Akashi KaikyoBridge, Japan [in Japanese]. With permission.)
c© 1999by
CR
CPress
LLC

FIGURE 10.56: Force flow in a suspension bridge. (From Nagai, N., Bridge Engineering, KyoritsuPublishing Co., Tokyo, Japan [in Japanese], 1994. With permission.)
FIGURE 10.57: Types of suspension bridges. (From Nagai, N., Bridge Engineering, Kyoritsu Publish-ing Co., Tokyo, Japan [in Japanese], 1994. With permission.)
cable. In this case, only live loads act on the girder.There are two analytical procedures: elastic theory, in which linear elastic material and small
displacement are assumed, and the deflection theory, which considers the deflection of the cable dueto live loads. When the span becomes large, elastic theory is too conservative in its estimation ofbending moments.
10.12.4 Cable Design
For the cable, the high-strength steel wire, i.e., usually 5 mm in diameter with a strength of 160 to 180kg/mm2 (1760 N/mm2) and zinc-galvanized, is used. There are several types of cables (Figure 10.58):strand rope, spiral rope, locked coil rope (LCR), and parallel wire strand (PWS). The PWS is usedmost commonly for suspension bridges; thousands of parallel wire elements are bundled into a circleby a squeezing machine, then wrapped with steel wire and painted.
The wire is treated by an air spinning (AS) method or the prefabricated parallel wire strand method(PWSS). In the AS method, the 5-mm wire is elected by rounding between anchor blocks one byone until the prescribed number of wires is obtained. In the PWSS method, a strand that bundles
c©1999 by CRC Press LLC

FIGURE 10.58: Types of cables. (From Nagai, N., Bridge Engineering, Kyoritsu Publishing Co., Tokyo,Japan [in Japanese], 1994. With permission.)
100 to 200 wire elements is suspended between the anchor blocks by fixing with a socket. In thismethod, the construction period can be short because more wires are elected at one time than in theAS method. The thick strand is more stable to wind but harder to handle during construction. Afoothold (or catwalk) must be provided under the cable for the workers to attach the cable band tothe main cable.
10.12.5 Stiffening Girder
Truss or box type girders are used to stiffen suspension bridges. The girder must be carefully designedtohave sufficient stiffness forwind stability. Forvery long spans trusses aremost effective in improvingthe stiffness and stability (see Figure 10.54). The box girder is also often adopted due to its ease offabrication.
10.12.6 Tower
The tower is designed to be subjected to large axial compression and bending moment. It is designedto have smaller bending stiffness in the longitudinal direction since the horizontal forces comingfrom both sides of the tower keep it balanced. Figure 10.59 shows a comparison of several towersused for various structures. The Sears Tower in Chicago, known as the tallest building, has a heightof 443 m.
A bridge tower usually consists of more than three cells inside, each having adequate resistance totorsion and local buckling under large axial forces. Mechanical dampers such as the TMD (tunedmass damper) or the TLD (tuned liquid damper) are often used during construction to control toweroscillations caused by wind forces. Figure 10.60 shows a typical construction procedure adopted forthe Akashi Kaikyo Bridge, in which a climbing tower crane is used. An alternative method is to usea creeper crane, which clambers up along the tower.
10.12.7 Stability for Wind
Suspension bridges are so flexible that the dynamic stability under wind effects should be investigatedusing a wind tunnel. The dynamic responses may be categorized into three types, of which responsebehaviors are shown in Figure 10.61: vortex-induced oscillations, buffeting, and torsional flutters.The flutter, also called “galloping”, is torsional oscillation and is especially dangerous since it is aself-diverging resonance and may incite failure quickly and easily. The flow of air increases theamplitude of oscillations under certain combinations of wind speed and structural characteristics(natural frequency), as illustrated in Figure 10.61. Flexible bridges, such as suspension or cable-stayedbridges, must be carefully designed if the wind speeds are likely to incite flutter.
c©1999 by CRC Press LLC
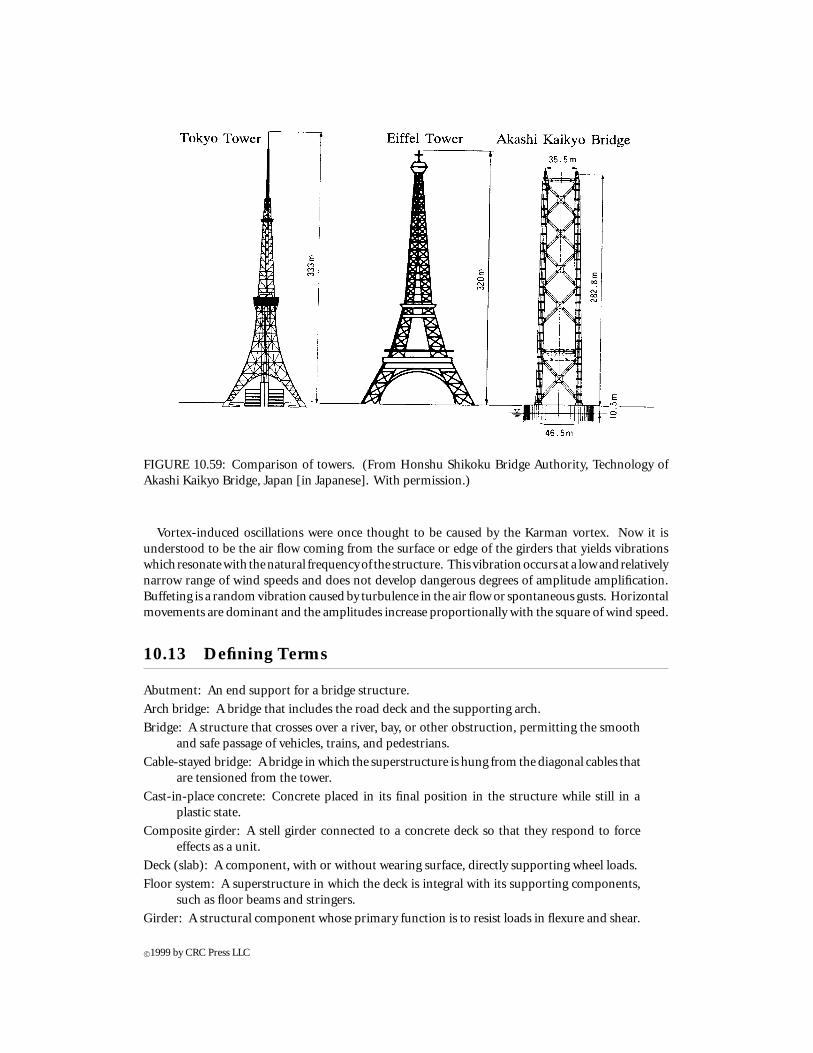
FIGURE 10.59: Comparison of towers. (From Honshu Shikoku Bridge Authority, Technology ofAkashi Kaikyo Bridge, Japan [in Japanese]. With permission.)
Vortex-induced oscillations were once thought to be caused by the Karman vortex. Now it isunderstood to be the air flow coming from the surface or edge of the girders that yields vibrationswhich resonatewith thenatural frequencyof the structure. This vibrationoccurs at a lowandrelativelynarrow range of wind speeds and does not develop dangerous degrees of amplitude amplification.Buffeting is a random vibration caused by turbulence in the air flow or spontaneous gusts. Horizontalmovements are dominant and the amplitudes increase proportionally with the square of wind speed.
10.13 Defining Terms
Abutment: An end support for a bridge structure.
Arch bridge: A bridge that includes the road deck and the supporting arch.
Bridge: A structure that crosses over a river, bay, or other obstruction, permitting the smoothand safe passage of vehicles, trains, and pedestrians.
Cable-stayed bridge: A bridge in which the superstructure is hung from the diagonal cables thatare tensioned from the tower.
Cast-in-place concrete: Concrete placed in its final position in the structure while still in aplastic state.
Composite girder: A stell girder connected to a concrete deck so that they respond to forceeffects as a unit.
Deck (slab): A component, with or without wearing surface, directly supporting wheel loads.
Floor system: A superstructure in which the deck is integral with its supporting components,such as floor beams and stringers.
Girder: A structural component whose primary function is to resist loads in flexure and shear.
c©1999 by CRC Press LLC

FIGURE 10.60: Construction of a tower. (From Honshu Shikoku Bridge Authority, Technology ofAkashi Kaikyo Bridge, Japan [in Japanese]. With permission.)
Generally, this term is used for fabricated sections.
Girder bridge: A bridge superstructure that consists of a floor slab, girders, and bearings.
Influence line: A continuous or discretized function over a section of girder whose value at apoint, multiplied by a load acting normal to the girder at that point, yields the force effectbeing sought.
Lever rule: The static summation of moments about one point to calculate the reaction at asecond point.
LRFD (Load and Resistance Factor Design): A method of proportioning structural compo-nents (members, connectors, connecting elements, and assemblages) such that no ap-plicable limit state is exceeded when the structure is subjected to all appropriate loadcombinations.
c©1999 by CRC Press LLC
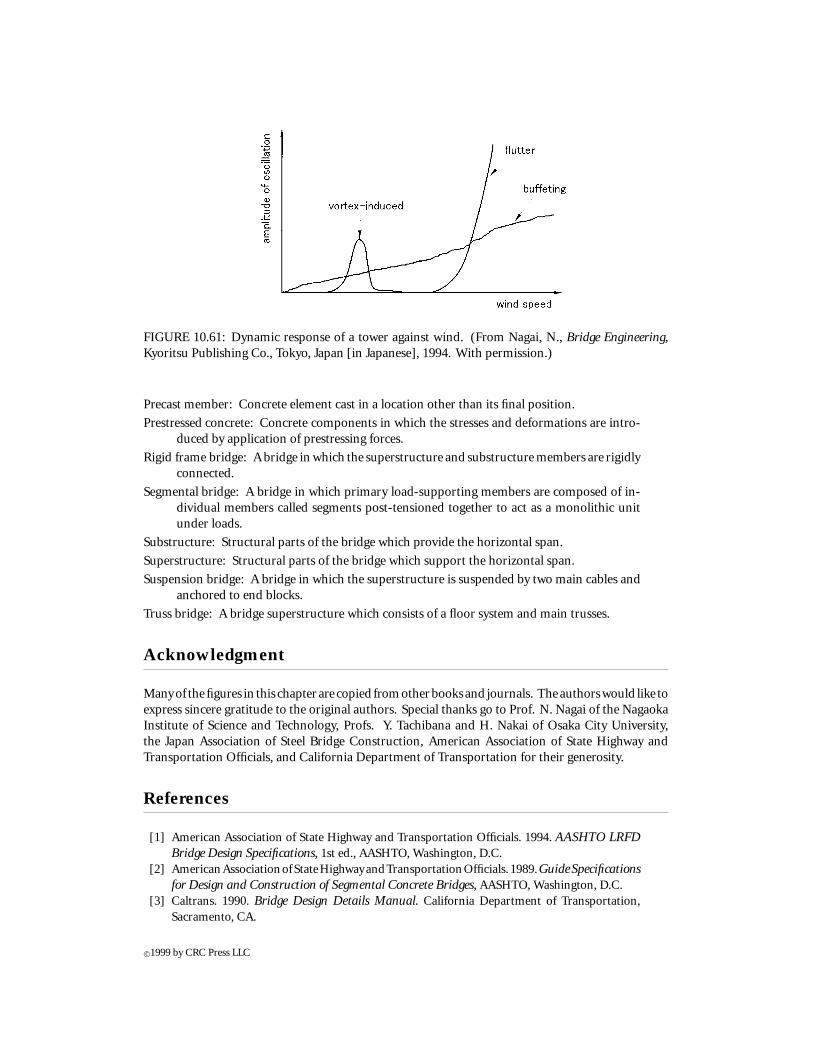
FIGURE 10.61: Dynamic response of a tower against wind. (From Nagai, N., Bridge Engineering,Kyoritsu Publishing Co., Tokyo, Japan [in Japanese], 1994. With permission.)
Precast member: Concrete element cast in a location other than its final position.
Prestressed concrete: Concrete components in which the stresses and deformations are intro-duced by application of prestressing forces.
Rigid frame bridge: A bridge in which the superstructure and substructure members are rigidlyconnected.
Segmental bridge: A bridge in which primary load-supporting members are composed of in-dividual members called segments post-tensioned together to act as a monolithic unitunder loads.
Substructure: Structural parts of the bridge which provide the horizontal span.
Superstructure: Structural parts of the bridge which support the horizontal span.
Suspension bridge: A bridge in which the superstructure is suspended by two main cables andanchored to end blocks.
Truss bridge: A bridge superstructure which consists of a floor system and main trusses.
Acknowledgment
Manyof thefigures in this chapter are copied fromotherbooks and journals. Theauthorswould like toexpress sincere gratitude to the original authors. Special thanks go to Prof. N. Nagai of the NagaokaInstitute of Science and Technology, Profs. Y. Tachibana and H. Nakai of Osaka City University,the Japan Association of Steel Bridge Construction, American Association of State Highway andTransportation Officials, and California Department of Transportation for their generosity.
References
[1] American Association of State Highway and Transportation Officials. 1994. AASHTO LRFDBridge Design Specifications, 1st ed., AASHTO, Washington, D.C.
[2] AmericanAssociationofStateHighwayandTransportationOfficials. 1989.GuideSpecificationsfor Design and Construction of Segmental Concrete Bridges, AASHTO, Washington, D.C.
[3] Caltrans. 1990. Bridge Design Details Manual. California Department of Transportation,Sacramento, CA.
c©1999 by CRC Press LLC
[4] Caltrans. 1993.BridgeDesignPracticeManual, vol. 2, CaliforniaDepartmentofTransportation,Sacramento, CA.
[5] Caltrans. 1990. Bridge Design Aids Manual. California Department of Transportation, Sacra-mento, CA.
[6] Federal Highway Administration. 1990. Standard Plans for Highway Bridges, Vol. I, ConcreteSuperstructures, U.S. Department of Transportation, FHWA, Washington, D.C.
[7] Gerwick, B.C., Jr. 1993. Construction of Prestressed Concrete Structures, 2nd ed., John Wiley& Sons, New York.
[8] Hanshin Expressway Public Corporation. 1975. Construction Records of Minato Oh-Hashi,HEPC, Japan Society of Civil Engineers, Tokyo, Japan (in Japanese).
[9] Hanshin Expressway Public Corporation. 1994. Techno Gallery, HEPC, Osaka, Japan.[10] Honshu Shikoku Bridge Authority. Technology of Akashi Kaikyo Bridge, HSBA, Japan (in
Japanese).[11] Japan Association of Steel Bridge Construction. 1981. Manual Design Data Book, JASBC,
Tokyo, Japan (in Japanese).[12] Japan Association of Steel Bridge Construction. 1984. A Guide Book of Bearing Design for Steel
Bridges, JASBC, Tokyo, Japan (in Japanese).[13] Japan Association of Steel Bridge Construction. 1984. A Guide Book of Expansion Joint Design
for Steel Bridges, JASBC, Tokyo, Japan (in Japanese).[14] Japan Association of Steel Bridge Construction. 1985. Outline of Steel Bridges, JASBC, Tokyo,
Japan (in Japanese).[15] Japan Association of Steel Bridge Construction. 1988. Planning of Steel Bridges, JASBC, Tokyo,
Japan (in Japanese).[16] Japan Construction Mechanization Association. 1991. Cost Estimation of Bridge Erection,
JCMA, Tokyo, Japan (in Japanese).[17] Japan Road Association. 1993. Specifications for Highway Bridges, Part I Common Provisions,
Part II Steel Bridges, and Part III Concrete Bridges, JRA, Tokyo, Japan (in Japanese).[18] Japan Society of Civil Engineers. 1990. Cable-Stayed Bridges—Technology and its Change,
JSCE, Tokyo, Japan (in Japanese).[19] Nagai, N. 1994. Bridge Engineering, Kyoritsu Publishing Co., Tokyo, Japan (in Japanese).[20] Podolny, W. and Muller, J.M. 1982. Construction and Design of Prestressed Concrete Segmental
Bridges, John Wiley & Sons, New York.[21] Shimada, S. 1991. Basic theory of arch structures, Journal of Bridge and Foundation Engineer-
ing, Kensetsu-Tosho, 25(8), 48-52, Tokyo, Japan (in Japanese).[22] Tachibana, Y. and Nakai, H. 1996. Bridge Engineering, Kyoritsu Publishing Co., Tokyo, Japan
(in Japanese).[23] Tonias, D.E. 1995. Bridge Engineering, McGraw-Hill, New York.[24] Troitsky, M.S. 1994. Planning and Design of Bridges, John Wiley & Sons, New York.[25] VSL. 1994. VSL Post-Tensioning System, VSL Corporation, Campbell, CA.[26] Xanthakos, P.P. 1994. Theory and Design of Bridges, John Wiley & Sons, New York.[27] Xanthakos, P.P. 1995.BridgeSubstructureandFoundationDesign, Prentice-Hall, UpperSaddle
River, NJ.
Further Reading
[1] Billington, D.P. 1983. The Tower and the Bridge, Basic Books, Inc., New York.[2] Leonhardt, F. 1984. Bridges, Aesthetics and Design, MIT Press, Cambridge, MA.[3] Chen, W. F. and Duan, L. 1998. Handbook of Bridge Engineering, CRC Press, Boca Raton, FL.
c©1999 by CRC Press LLC
Appendix: Design Examples
10.A.1 Two-Span, Continuous, Cast-in-Place, Prestressed Concrete Box GirderBridge
Given: A two-span, continuous, cast-in-place, prestressed concrete box girder bridge has two equalspans of length 157 ft (47.9 m) with a column bent. The superstructure is 34 ft (10.4 m) wide. Theelevation of the bridge is shown in Figure 10.62a.
Material:
Initial concrete f ′ci = 3500 psi (24.13 MPa), Eci = 3372ksi (23,250 MPa)
Final concrete f ′c = 4000 psi (27.58 MPa), Ec = 3600 ksi (24,860 MPa)
Prestressing steel fpu = 270 ksi (1860 MPa) low relaxation strand, Ep = 28,500 ksi(197,000 MPa)
Mild steel fy = 60 ksi (414 MPa), Es = 29,000 ksi (200,000 MPa)
Prestressing:
Anchorage set thickness = 0.375 in. (9.5 mm)
Prestressing stress at jacking fpj = 0.8
fpu = 216 ksi (1489 MPa)
The secondary moments due to prestressing at the bent are MDA = 1.118 Pj (kips-ft)MDG = 1.107 Pj (kips-ft)
Loads:
Dead load = self-weight + barrier rail + future wearing 3 in AC overlay
Live load = AASHTO HS20-44 + dynamic load allowance
Specification:
AASHTO-LRFD [1] (referred to as AASHTO in this example)
Requirements:
1. Determine cross-section geometry
2. Determine longitudinal section and cable path
3. Calculate loads
4. Calculate live load distribution factors
5. Calculate unfactored moments and shear demands for interior girder
6. Determine load factors for strength limit state I and service limit state I
7. Calculate section properties for interior girder
8. Calculate prestress losses
9. Determine prestressing force, Pj , for interior girder
10. Check concrete strength for interior girder, service limit state I
11. Flexural strength design for interior girder, strength limit state I
12. Shear strength design for interior girder, strength limit state I
c©1999 by CRC Press LLC

FIGURE 10.62: A two-span, continuous, prestressed concrete box girder bridge.
Solution
1. Determine Cross-Section Geometry1.1) Structural Depth, dFor prestressed continuous spans, the structural depth, d , can be determined using a
c©1999 by CRC Press LLC

depth-to-span ratio (d/L) of 0.04.
d = 0.04L = 0.04(157) = 6.28 ft (1.91 m)
Use d = 6.25 ft (1.91 m)
1.2) Girder Spacing, STo provide effective torsional resistance and a sufficient number of girders for prestresspaths, the spacing of girders should not be larger than twice their depth.
Smax < 2d = 2(6.25) = 12.5 ft (3.81 m)
Using an overhang of 4 ft (1.22 m), the center-to-center distance between two exteriorgirders is 26 ft (7.92 m).
Try three girders and two bays, S = 26/2 = 13 ft > 12.5 ft N.G.
Try four girders and three bays, S = 26/3 = 8.67 ft < 12.5 ft O.K.
Use a girder spacing, S = 8.67 ft (2.64 m)
1.3) Typical SectionFrom past experience and design practice, we select a thickness of 7 in. (178 mm) at theedge and 12 in. (305 mm) at the face of exterior girder for the overhang, the width of12 in. (305 mm) for girders with the exterior girder flaring to 18 in. (457 mm) at theanchorage end. The length of this flare is usually taken as one-tenth of the span length 15.7ft (4.79 m). The deck and soffit thicknesses depend on the clear distance between adjacentgirders. We choose 7.875 in. (200 mm) and 5.875 in. (149 mm) for the deck and soffitthicknesses, respectively. A typical section for this example is shown in Figure 10.62b.The section properties of the box girder are :
Properties Midspan Bent (face of support)
A ft2 (m2) 57.25 (5.32) 68.98 (6.41)I ft4 (m4) 325.45 (2.81) 403.56 (3.48)yb ft (m) 3.57 (1.09) 3.09 (0.94)
2. Determine Longitudinal Section and Cable PathTo lower the center of gravity of the superstructure at the face of a bent cap in a cast-in-place post-tensioned box girder, the thickness of soffit is flared to 12 in., as shown inFigure 10.62c. A cable path is generally controlled by the maximum dead load momentsand the position of the jack at the end section. Maximum eccentricities should occur atpoints of maximum dead load moment and almost no eccentricity should be present atthe jacked end section. For this example, the maximum dead load moments occur at thebent cap, close to 0.4L for span 1 and 0.6L for span 2. A parabolic cable path is chosenas shown in Figure 10.62c.
3. Calculate Loads3.1) Component Dead Load, DC
The component dead load, DC, includes all structural dead loads with the exception ofthe future wearing surface and specified utility loads. For design purposes, two parts ofthe DC are defined as:
DC1: girder self-weight (150 lb/ft3) acting at the prestressing state
DC2: barrier rail weight (784 kips/ft) acting at service state after all losses
c©1999 by CRC Press LLC
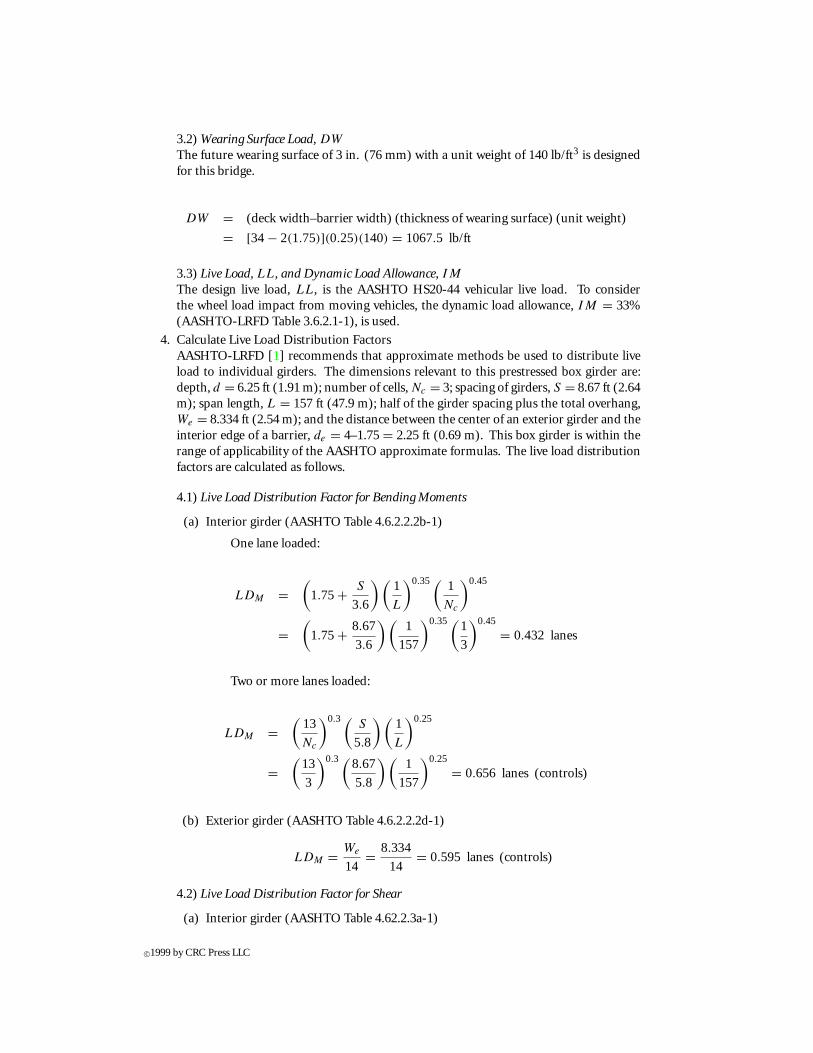
3.2) Wearing Surface Load, DW
The future wearing surface of 3 in. (76 mm) with a unit weight of 140 lb/ft3 is designedfor this bridge.
DW = (deck width–barrier width) (thickness of wearing surface) (unit weight)
= [34− 2(1.75)](0.25)(140) = 1067.5 lb/ft
3.3) Live Load, LL, and Dynamic Load Allowance, IM
The design live load, LL, is the AASHTO HS20-44 vehicular live load. To considerthe wheel load impact from moving vehicles, the dynamic load allowance, IM = 33%(AASHTO-LRFD Table 3.6.2.1-1), is used.
4. Calculate Live Load Distribution FactorsAASHTO-LRFD [1] recommends that approximate methods be used to distribute liveload to individual girders. The dimensions relevant to this prestressed box girder are:depth, d = 6.25 ft (1.91 m); number of cells, Nc = 3; spacing of girders, S = 8.67 ft (2.64m); span length, L = 157 ft (47.9 m); half of the girder spacing plus the total overhang,We = 8.334 ft (2.54 m); and the distance between the center of an exterior girder and theinterior edge of a barrier, de = 4–1.75 = 2.25 ft (0.69 m). This box girder is within therange of applicability of the AASHTO approximate formulas. The live load distributionfactors are calculated as follows.
4.1) Live Load Distribution Factor for Bending Moments
(a) Interior girder (AASHTO Table 4.6.2.2.2b-1)
One lane loaded:
LDM =(
1.75+ S
3.6
) (1
L
)0.35(1
Nc
)0.45
=(
1.75+ 8.67
3.6
) (1
157
)0.35(1
3
)0.45
= 0.432 lanes
Two or more lanes loaded:
LDM =(
13
Nc
)0.3 (S
5.8
) (1
L
)0.25
=(
13
3
)0.3 (8.67
5.8
) (1
157
)0.25
= 0.656 lanes (controls)
(b) Exterior girder (AASHTO Table 4.6.2.2.2d-1)
LDM = We
14= 8.334
14= 0.595 lanes (controls)
4.2) Live Load Distribution Factor for Shear
(a) Interior girder (AASHTO Table 4.62.2.3a-1)
c©1999 by CRC Press LLC

One lane loaded:
LDV =(
S
9.5
)0.6 (d
12L
)0.1
=(
8.67
9.5
)0.6 (6.25
12(157)
)0.1
= 0.535 lanes
Two or more lanes loaded:
LDV =(
S
7.3
)0.9 (d
12L
)0.1
=(
8.67
7.3
)0.9 (6.25
12(157)
)0.1
= 0.660 lanes (controls)
(b) Exterior girder (AASHTO Table 4.62.2.3b-1)
One lane loaded: Lever rule
The lever rule assumes that the deck in its transverse direction is simply supportedby the girders and uses statics to determine the live load distribution to the girders.AASHTO-LRFD also requires that when the lever rule is used, the multiple presencefactor, m, should apply. For a one loaded lane, m = 1.2. The lever rule model forthe exterior girder is shown in Figure 10.63. From static equilibrium:
R = 5.92
8.67= 0.683
LDν = mR = 1.2(0.683) = 0.820 (controls)
FIGURE 10.63: Live load distribution for exterior girder—lever rule.
c©1999 by CRC Press LLC

Two or more lanes loaded: Modify interior girder factor by e
LDV = e(LDv)interior girder =(
0.64+ de
12.5
)(LDν)interior girder
=(
0.64+ 2.25
12.5
)(0.66) = 0.541
The live load distribution factors at the strength limit state:
Strength limit state I Interior girder Exterior girder
Bending moment 0.656 lanes 0.595 lanes
Shear 0.660 lanes 0.820 lanes
5. Calculate Unfactored Moments and Shear Demands for Interior GirderIt is practically assumed that all dead loads are carried by the box girder and equallydistributed to each girder. The live loads take forces to the girders according to live loaddistribution factors (AASHTO Article 4.6.2.2.2). Unfactored moment and shear demandsfor an interior girder are shown in Figures 10.64 and 10.65. Details are listed in Tables 10.8and 10.9. Only the results for span 1 are shown in these tables and figures since the bridgeis symmetrical about the bent.
TABLE 10.8 Moment and Shear Due to Unfactored Dead
Load for the Interior Girder (Span 1)Unfactored dead load
DC1a DC2b DWc
Location MDC1 VDC1 MDC2 VDC2 MDW VDW(x/L) (k-ft) (kips) (k-ft) (kips) (k-ft) (kips)
0.0 0 125.2 0 11.4 0 15.60.1 1700 91.5 155 8.4 212 11.40.2 2871 57.7 262 5.3 357 7.20.3 3513 24.0 321 2.2 437 3.00.4 3626 −9.7 331 −0.9 451 −1.20.5 3210 −43.4 293 −4.0 399 −5.40.6 2264 −77.1 207 −7.1 282 −9.60.7 789 −111 72 −10.1 98 −13.80.8 −1215 −145 −111 −13.2 −151 −18.00.9 −3748 −178 −342 −16.3 −466 −22.21.0 −6833 −216 −622 −19.4 −847 −26.4
(−6292) (−573) (−781)
Note: Moments in brackets are for face of support at the bent. Moments inspan 2 are symmetrical about the bent. Shear in span are antisym-metrical about the bent.
aDC1, interior girder self-weight.bDC2, barrier self-weight.cDW, wearing surface load.
6. Determine Load Factors for Strength Limit State I and Service Limit State I6.1) General Design Equation (AASHTO Article 1.3.2)
η∑
γiQi ≤ φRn (10.18)
c©1999 by CRC Press LLC

FIGURE 10.64: Moment envelopes for span 1.
FIGURE 10.65: Shear envelopes for span 1.
c©1999 by CRC Press LLC

TABLE 10.9 Moment and Shear Envelopes and Associated Forces for the
Interior Girder Due to AASHTO HS20-44 Live Load (Span 1)Positive momentand associated Negative moment Shear and
shear and associated shear associated moment
Location MLL+IM VLL+IM MLL+IM VLL+IM VLL+IM MLL+IM
(x/L) (k-ft) (kips) (k-ft) (kips) (kips) (k-ft)
0.0 0 0 0 0 60.0 00.1 782 49.8 −85 −5.4 50.1 7870.2 1312 41.8 −169 −5.4 42.0 13200.3 1612 29.3 −253 −5.4 34.3 16140.4 1715 21.8 −337 −5.4 −27.7 16500.5 1650 −30.0 −422 −5.4 −35.1 16280.6 1431 −36.7 −506 −5.4 −42.0 14240.7 1081 −42.6 −590 −5.4 −49.9 8520.8 647 −47.8 −748 −8.3 −59.2 2160.9 196 −32.9 −1339 −50.1 −68.8 −6671.0 0 0 −2266 −67.8 −78.5 1788
−(2104)
Note: LL + IM = AASHTO HS20-44 live load plus dynamic load allowance. Moments inbrackets are for face of support at the bent. Moments in span 2 are symmetrical aboutthe bent. Shear in span 2 is antisymmetrical about the bent. Live load distribution factorsare considered.
where γi are load factors, φ is a resistance factor, Qi represents force effects, Rn is thenominal resistance, and η is a factor related to ductility, redundancy, and operationalimportance of that being designed. η is defined as:
η = ηDηRηI ≥ 0.95 (10.19)
where
ηD ={
1.05 for nonductile components and connections0.95 for ductile components and connections
(10.20)
ηR ={
1.05 for nonredundant members0.95 for redundant members
(10.21)
ηI =
1.05 operationally important bridge0.95 general bridge
only apply to strength and extremeevent limit states
(10.22)
For this bridge, the following values are assumed:
Ductility Redundancy ImportanceLimit states ηD ηR ηI η
Strength limit state 0.95 0.95 1.05 0.95Service limit state 1.0 1.0 1.0 1.0
6.2) Load Factors and Load CombinationsThe load factors and combinations are specified as (AASHTO Table 3.4.1-1):
Strength limit state I: 1.25(DC1 + DC2) + 1.5(DW) + 1.75(LL + M)
Service limit state I: DC1 + DC2 + DW + (LL + IM)
c©1999 by CRC Press LLC
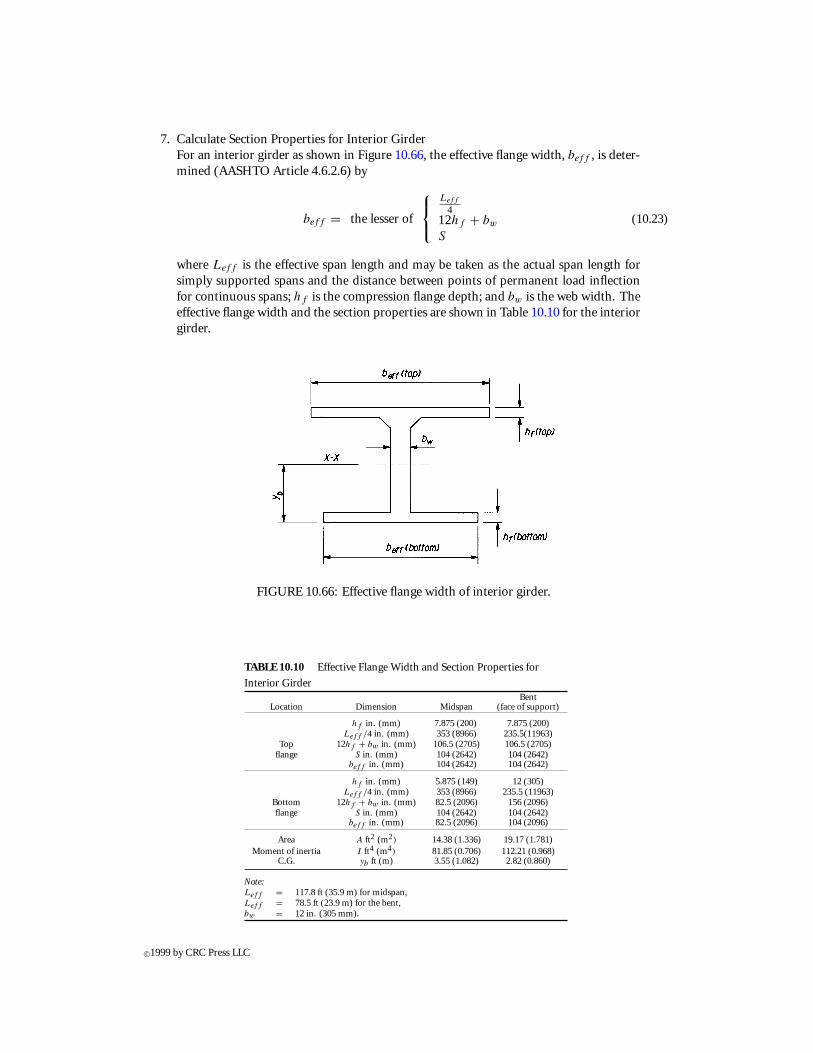
7. Calculate Section Properties for Interior GirderFor an interior girder as shown in Figure 10.66, the effective flange width, beff , is deter-mined (AASHTO Article 4.6.2.6) by
beff = the lesser of
Leff
412hf + bw
S
(10.23)
where Leff is the effective span length and may be taken as the actual span length forsimply supported spans and the distance between points of permanent load inflectionfor continuous spans; hf is the compression flange depth; and bw is the web width. Theeffective flange width and the section properties are shown in Table 10.10 for the interiorgirder.
FIGURE 10.66: Effective flange width of interior girder.
TABLE 10.10 Effective Flange Width and Section Properties for
Interior GirderBent
Location Dimension Midspan (face of support)
hf in. (mm) 7.875 (200) 7.875 (200)Leff /4 in. (mm) 353 (8966) 235.5(11963)
Top 12hf + bw in. (mm) 106.5 (2705) 106.5 (2705)flange S in. (mm) 104 (2642) 104 (2642)
beff in. (mm) 104 (2642) 104 (2642)
hf in. (mm) 5.875 (149) 12 (305)Leff /4 in. (mm) 353 (8966) 235.5 (11963)
Bottom 12hf + bw in. (mm) 82.5 (2096) 156 (2096)flange S in. (mm) 104 (2642) 104 (2642)
beff in. (mm) 82.5 (2096) 104 (2096)
Area A ft2 (m2) 14.38 (1.336) 19.17 (1.781)Moment of inertia I ft4 (m4) 81.85 (0.706) 112.21 (0.968)
C.G. yb ft (m) 3.55 (1.082) 2.82 (0.860)
Note:Leff = 117.8 ft (35.9 m) for midspan,Leff = 78.5 ft (23.9 m) for the bent,bw = 12 in. (305 mm).
c©1999 by CRC Press LLC

8. Calculate Prestress LossesFor a cast-in-place post-tensioned box girder, two types of losses, instantaneous losses(friction, anchorage set, and elastic shortening) and time-dependent losses (creep andshrinkage of concrete and relaxation of prestressing steel) are significant. Since the pre-stress lossesarenot symmetrical about thebent for thisbridge, thecalculation isperformedfor both spans.8.1) Frictional Loss, 1fpF
1fpF = fpj
(1 − e−(Kx+µα)
)(10.24)
where K is the wobble friction coefficient = 0.0002 1/ft (6.6 × 10⁻⁷ 1/mm); µ is thecoefficient of friction = 0.25 (AASHTO Article 5.9.5.2.2a); x is the length of a prestressingtendon from the jacking end to the point considered; and α is the sum of the absolutevalues of angle change in the prestressing steel path from the jacking end.For a parabolic cable path (Figure 10.67), the angle change is α = 2ep/Lp , where ep is thevertical distance between two control points and Lp is the horizontal distance betweentwo control points. The details are given in Table 10.11.
FIGURE 10.67: Parabolic cable path.
TABLE 10.11 Prestress Frictional Loss
Segment ep (in.) Lp (ft) α (rad)∑
α (rad)∑
Lp (ft) Point 1fpF (ksi)
A 31.84 0 0 0 0 A 0.0AB 31.84 62.8 0.0845 0.0845 62.8 B 7.13BC 42.50 78.5 0.0902 0.1747 141.3 C 14.90CD 8.50 15.7 0.0902 0.2649 157.0 D 20.09DE 8.50 15.7 0.0902 0.3551 172.7 E 25.06EF 42.50 78.5 0.0902 0.4453 251.2 F 32.18FG 31.84 62.8 0.0845 0.5298 314.0 G 38.23
8.2) Anchorage Set Loss, 1fpA
The effect of anchorage set on the cable stress can be approximated by the Caltrans
c©1999 by CRC Press LLC

procedure [4], as shown in Figure 10.68. It is assumed that the anchorage set loss changeslinearly within the length, LpA.
FIGURE 10.68: Anchorage set loss model. (From California Department of Transportation, BridgeDesign Practice, Copyright 1983 (Figure 3–10, pages 3–46, updated March, 1993), Sacramento, CA,1993. With permission.)
LpA =√
E(1L)LpF
1fpF
(10.25)
1f = 21fpF x
LpF
(10.26)
1fpA = 1f
(1 − x
LpA
)(10.27)
where 1L is the thickness of the anchorage set; E is the modulus of elasticity of theanchorage set; 1f is the change in stress due to the anchor set; LpA is the length influencedby the anchor set; LpF is the length to a point where loss is known; and x is the horizontaldistance from the jacking end to the point considered.For an anchor set thickness of 1L = 0.375in. and E = 29,000 ksi, consider the point B
where LpF = 141.3 ft and 1fpF = 14.9 ksi:
LpA =√
E(1L)LpF
1fpF
=√
29,000(3/8)(141.3)
12(14.90)= 92.71 ft < 141.3 ft O.K
1f = 21fpF x
LpF
= 2(14.90)(92.71)
141.3= 19.55 ksi
1fpA = 1f
(1 − x
LpA
)= 19.55
(1 − x
92.71
)
8.3) Elastic Shortening Loss, 1fpES
The loss due to elastic shortening in post-tensioned members is calculated using thefollowing formula (AASHTO Article 5.9.5.2.3b):
c©1999 by CRC Press LLC
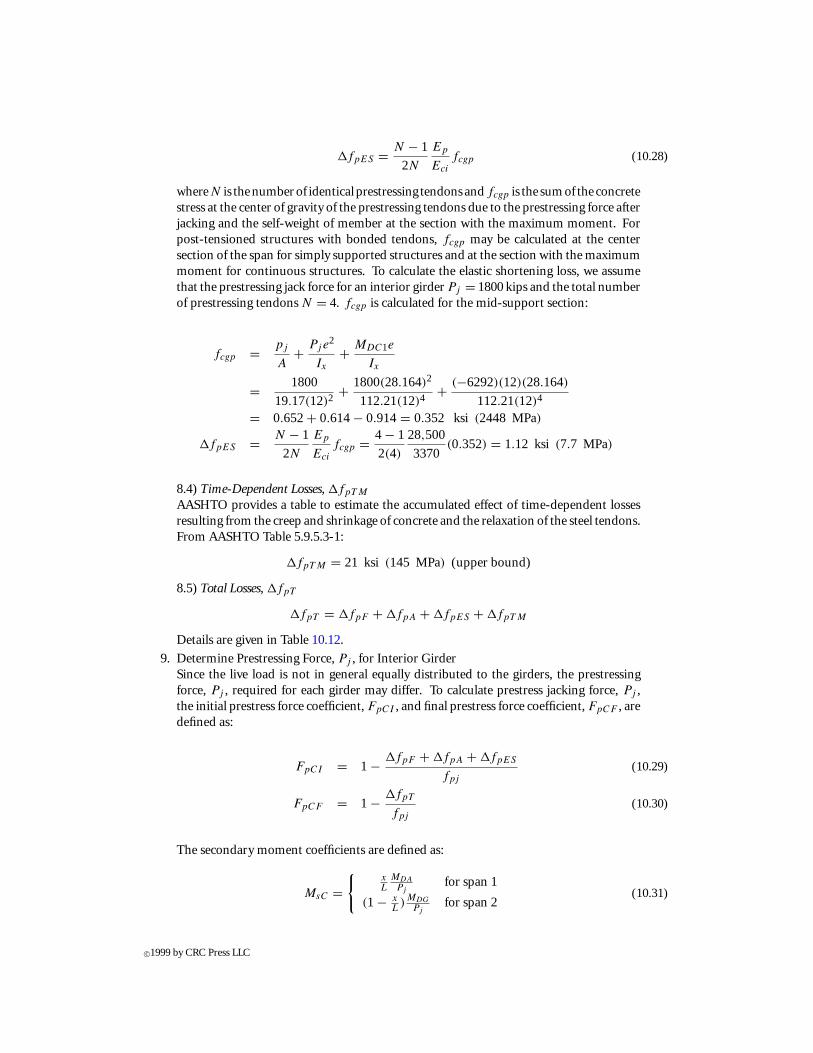
1fpES = N − 1
2N
Ep
Eci
fcgp (10.28)
whereN is thenumberof identical prestressing tendons andfcgp is the sumof the concretestress at the center of gravity of the prestressing tendons due to the prestressing force afterjacking and the self-weight of member at the section with the maximum moment. Forpost-tensioned structures with bonded tendons, fcgp may be calculated at the centersection of the span for simply supported structures and at the section with the maximummoment for continuous structures. To calculate the elastic shortening loss, we assumethat the prestressing jack force for an interior girder Pj = 1800 kips and the total numberof prestressing tendons N = 4. fcgp is calculated for the mid-support section:
fcgp = pj
A+ Pje
2
Ix
+ MDC1e
Ix
= 1800
19.17(12)2+ 1800(28.164)2
112.21(12)4+ (−6292)(12)(28.164)
112.21(12)4
= 0.652+ 0.614− 0.914= 0.352 ksi (2448 MPa)
1fpES = N − 1
2N
Ep
Eci
fcgp = 4 − 1
2(4)
28,500
3370(0.352) = 1.12 ksi (7.7 MPa)
8.4) Time-Dependent Losses, 1fpT M
AASHTO provides a table to estimate the accumulated effect of time-dependent lossesresulting from the creep and shrinkage of concrete and the relaxation of the steel tendons.From AASHTO Table 5.9.5.3-1:
1fpT M = 21 ksi (145 MPa) (upper bound)
8.5) Total Losses, 1fpT
1fpT = 1fpF + 1fpA + 1fpES + 1fpT M
Details are given in Table 10.12.
9. Determine Prestressing Force, Pj , for Interior GirderSince the live load is not in general equally distributed to the girders, the prestressingforce, Pj , required for each girder may differ. To calculate prestress jacking force, Pj ,the initial prestress force coefficient, FpCI , and final prestress force coefficient, FpCF , aredefined as:
FpCI = 1 − 1fpF + 1fpA + 1fpES
fpj
(10.29)
FpCF = 1 − 1fpT
fpj
(10.30)
The secondary moment coefficients are defined as:
MsC ={
xL
MDA
Pjfor span 1
(1 − xL)MDG
Pjfor span 2
(10.31)
c©1999 by CRC Press LLC

TABLE 10.12 Cable Path and Prestress LossesLocation Prestress losses (ksi) Force coeff.
Span (x/L) 1fpF 1fpA 1fpES 1fpT M 1fpT FpCI FpCF
0.0 0.00 19.55 41.67 0.904 0.8070.1 1.78 16.24 40.14 0.911 0.8140.2 3.56 12.93 38.61 0.918 0.8210.3 5.35 9.93 37.40 0.924 0.8270.4 7.13 6.31 35.56 0.933 0.835
1 0.5 8.68 3.00 1.12 21 33.79 0.941 0.8440.6 10.24 32.36 0.947 0.8500.7 11.79 33.91 0.940 0.8430.8 13.35 0.00 35.47 0.933 0.8360.9 14.90 37.02 0.926 0.8291.0 20.09 42.21 0.902 0.805
0.0 20.09 42.21 0.902 0.8050.1 25.06 47.18 0.879 0.7820.2 26.49 48.61 0.872 0.7750.3 27.91 50.03 0.866 0.7680.4 29.34 51.46 0.859 0.7620.5 30.76 0.00 1.12 21 52.88 0.852 0.755
2 0.6 32.18 54.30 0.846 0.7490.7 33.69 55.81 0.839 0.7420.8 35.21 57.33 0.832 0.7350.9 36.72 58.84 0.825 0.7281.0 38.23 60.35 0.818 0.721
Note:
FpCI = 1 − 1fpF +1fpA+1fpESfpj
FpCF = 1 − 1fpTfpj
where x is the distance from the left end for each span. The combined prestressingmoment coefficients are defined as:
MpsCI = FpCI (e) + MsC (10.32)
MpsCF = FpCF (e) + MsC (10.33)
where e is the distance between the cable and the center of gravity of a cross-section;positive values of e indicate that the cable is above the center of gravity, and negative onesindicate the cable is below it.The prestress force coefficients and the combined moment coefficients are calculated andlisted in Table 10.13. According to AASHTO, the prestressing force, Pj , can be determinedusing the concrete tensile stress limit in the precompression tensile zone (see Table 10.5):
fDC1 + fDC2 + fDW + fLL+IM + fpsF ≥ −0.19√
f ′c (10.34)
in which
c©1999 by CRC Press LLC
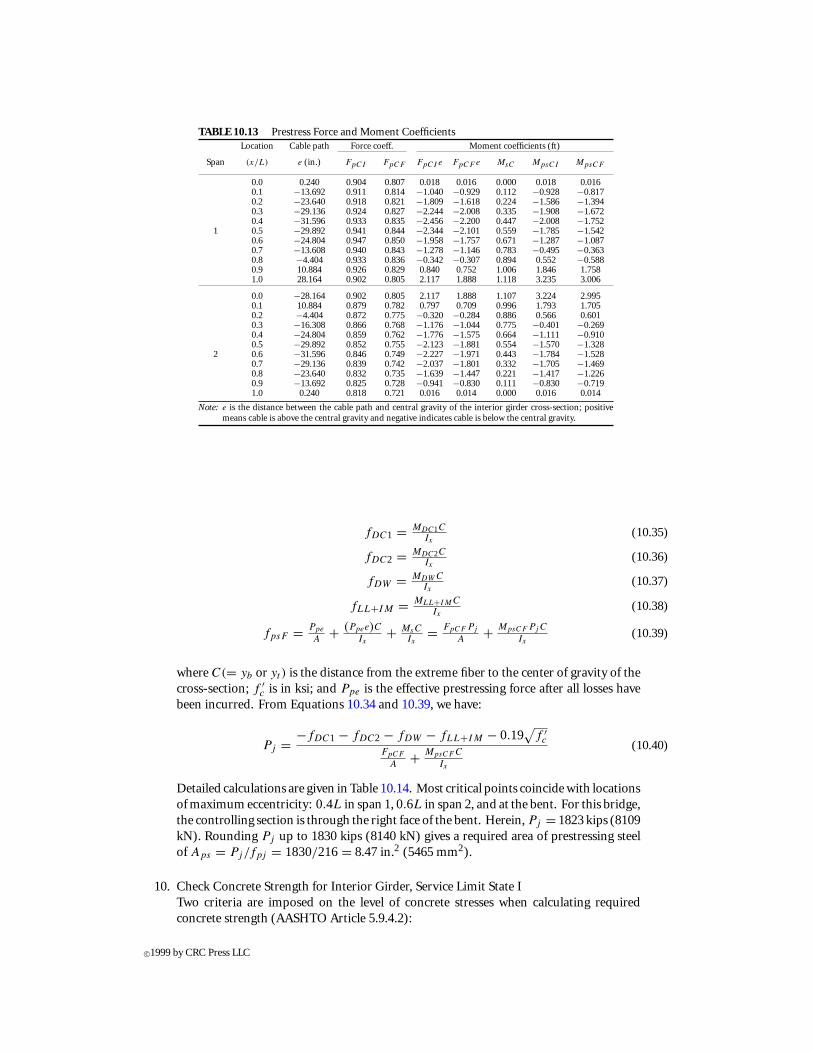
TABLE 10.13 Prestress Force and Moment CoefficientsLocation Cable path Force coeff. Moment coefficients (ft)
Span (x/L) e (in.) FpCI FpCF FpCI e FpCF e MsC MpsCI MpsCF
0.0 0.240 0.904 0.807 0.018 0.016 0.000 0.018 0.0160.1 −13.692 0.911 0.814 −1.040 −0.929 0.112 −0.928 −0.8170.2 −23.640 0.918 0.821 −1.809 −1.618 0.224 −1.586 −1.3940.3 −29.136 0.924 0.827 −2.244 −2.008 0.335 −1.908 −1.6720.4 −31.596 0.933 0.835 −2.456 −2.200 0.447 −2.008 −1.752
1 0.5 −29.892 0.941 0.844 −2.344 −2.101 0.559 −1.785 −1.5420.6 −24.804 0.947 0.850 −1.958 −1.757 0.671 −1.287 −1.0870.7 −13.608 0.940 0.843 −1.278 −1.146 0.783 −0.495 −0.3630.8 −4.404 0.933 0.836 −0.342 −0.307 0.894 0.552 −0.5880.9 10.884 0.926 0.829 0.840 0.752 1.006 1.846 1.7581.0 28.164 0.902 0.805 2.117 1.888 1.118 3.235 3.006
0.0 −28.164 0.902 0.805 2.117 1.888 1.107 3.224 2.9950.1 10.884 0.879 0.782 0.797 0.709 0.996 1.793 1.7050.2 −4.404 0.872 0.775 −0.320 −0.284 0.886 0.566 0.6010.3 −16.308 0.866 0.768 −1.176 −1.044 0.775 −0.401 −0.2690.4 −24.804 0.859 0.762 −1.776 −1.575 0.664 −1.111 −0.9100.5 −29.892 0.852 0.755 −2.123 −1.881 0.554 −1.570 −1.328
2 0.6 −31.596 0.846 0.749 −2.227 −1.971 0.443 −1.784 −1.5280.7 −29.136 0.839 0.742 −2.037 −1.801 0.332 −1.705 −1.4690.8 −23.640 0.832 0.735 −1.639 −1.447 0.221 −1.417 −1.2260.9 −13.692 0.825 0.728 −0.941 −0.830 0.111 −0.830 −0.7191.0 0.240 0.818 0.721 0.016 0.014 0.000 0.016 0.014
Note: e is the distance between the cable path and central gravity of the interior girder cross-section; positivemeans cable is above the central gravity and negative indicates cable is below the central gravity.
fDC1 = MDC1CIx
(10.35)
fDC2 = MDC2CIx
(10.36)
fDW = MDW CIx
(10.37)
fLL+IM = MLL+IMCIx
(10.38)
fpsF = Ppe
A+ (Ppee)C
Ix+ MsC
Ix= FpCF Pj
A+ MpsCF Pj C
Ix(10.39)
where C(= yb or yt ) is the distance from the extreme fiber to the center of gravity of thecross-section; f ′
c is in ksi; and Ppe is the effective prestressing force after all losses havebeen incurred. From Equations 10.34 and 10.39, we have:
Pj = −fDC1 − fDC2 − fDW − fLL+IM − 0.19√
f ′c
FpCF
A+ MpsCF C
Ix
(10.40)
Detailed calculations are given in Table 10.14. Most critical points coincide with locationsof maximum eccentricity: 0.4L in span 1, 0.6L in span 2, and at the bent. For this bridge,the controlling section is through the right face of the bent. Herein, Pj = 1823 kips (8109kN). Rounding Pj up to 1830 kips (8140 kN) gives a required area of prestressing steelof Aps = Pj/fpj = 1830/216= 8.47 in.2 (5465 mm2).
10. Check Concrete Strength for Interior Girder, Service Limit State ITwo criteria are imposed on the level of concrete stresses when calculating requiredconcrete strength (AASHTO Article 5.9.4.2):
c©1999 by CRC Press LLC

TABLE 10.14 Determination of Prestressing Jacking Force for an Interior GirderTop fiber Bottom fiber
Jacking JackingLocation Stress (psi) force Stress (psi) force
Span (x/L) fDC1 fDC2 fDW fLL+IM Pj (kips) fDC1 fDC2 fDW fLL+IM Pj (kips)
0.0 0 0 0 0 — 0 0 0 0 —0.1 389 36 48 179 — −512 −47 −64 −236 7490.2 658 60 82 301 — −865 −79 −108 −395 13070.3 805 73 100 369 — −1058 −97 −132 −485 15420.4 831 76 103 393 — −1092 −100 −136 −517 1573
1 0.5 735 67 91 378 — −967 −88 −120 −497 14820.6 519 47 64 328 — −682 −62 −85 −431 11930.7 181 16 22 248 — −238 −22 −30 −326 4550.8 −278 −25 −35 −171 242 366 33 46 225 —0.9 −859 −78 −107 −307 1210 1129 103 140 403 —1.0 −1336 −122 −166 −447 1818 1098 100 136 367 —
0.0 −1336 −122 −166 −447 1823 1098 100 136 367 —0.1 −859 −78 −107 −307 1264 1129 103 140 403 —0.2 −278 −25 −35 −171 254 366 33 46 225 —0.3 181 16 22 248 — −238 −22 −30 −326 5200.4 519 47 64 328 — −682 −62 −85 −431 1371
2 0.5 735 67 91 378 — −967 −88 −120 −497 16910.6 831 76 103 393 — −1092 −100 −136 −517 17820.7 805 73 100 369 — −1058 −97 −132 −485 17390.8 658 60 82 301 — −865 −79 −108 −395 14740.9 389 36 48 179 — −512 −47 −64 −236 8431.0 0 0 0 0 — 0 0 0 0 —
Note: Positive stress indicates compression and negative stress indicates tension. Pj are obtained by Equation 10.40.
{fDC1 + fpsI ≤ 0.55f ′
ci at prestressing statefDC1 + fDC2 + fDW + fLL+IM + fpsF ≤ 0.45f ′
c at service state(10.41)
fpsI = PjI
A+
(PjI e
)C
Ix
+ MsIC
Ix
= FpCIPj
A+ MpsCIPjC
Ix
(10.42)
The concrete stresses in the extreme fibers (after instantaneous losses and final losses) aregiven in Tables 10.15 and 10.16. For the initial concrete strength in the prestressing state,the controlling location is the bottom fiber at 0.9L section in span 1. From Equation 10.41we have:
f ′ci,req ≥ fDC1+fpsI
0.55 = 9300.55 = 1691 psi < 3500 psi
... choose f ′ci = 3500 psi (24.13 MPa) O.K.
For the final concrete strength at the service limit state, the controlling location is againin the bottom fiber at 0.9L section in span 1. From Equation 10.41 we have:
f ′c,req ≥ fDC1+fDC2+fDW +fLL+IM+fpsF
0.45
= 15390.45 = 3420 psi < 4000 psi
... choose f ′c = 4000 psi (27.58 MPa) O.K.
11. Flexural Strength Design for Interior Girder, Strength Limit State IAASHTO requires that for the strength limit state I
c©1999 by CRC Press LLC

TABLE 10.15 Concrete Stresses after Instantaneous Losses for the Interior GirderTop fiber stress (psi) Bottom fiber stress (psi)
Total Total
Location F ∗pCI
M∗psCI
initial F ∗pCI
M∗psCI
initial
Span (x/L) fDC1 Pj /A P ∗j
Yt /I fpsI stress fDC1 Pj /A P ∗j
yh/I fpsI stress
0.0 0 799 8 807 807 0 799 −10 789 7890.1 389 805 −389 416 806 −512 805 512 1317 8050.2 658 812 −665 147 805 −865 812 874 1686 8210.3 805 817 −800 17 821 −1058 817 1052 1868 8100.4 831 824 −842 −18 813 −1092 824 1107 1931 839
1 0.5 735 831 −748 83 819 −967 831 984 1815 8480.6 519 837 −540 298 816 −682 837 710 1547 8650.7 181 831 −208 623 804 −238 831 723 1104 8660.8 −278 825 231 1056 778 366 825 −304 520 8660.9 −859 818 774 1592 733 1129 818 −1017 −199 9301.0 −1336 598 1257 1854 519 1098 598 −1033 −435 663
0.0 −1336 598 1252 1850 514 1098 598 −1030 −432 6660.1 −859 777 752 1528 670 1129 777 −988 −212 9170.2 −278 771 237 1008 730 366 771 −312 −459 8250.3 181 765 −168 597 777 −238 765 221 986 7490.4 519 759 −466 293 812 −682 759 613 1372 690
2 0.5 735 753 −658 95 830 −967 753 865 1619 6520.6 831 748 −748 0 830 −1092 748 983 1731 6390.7 805 741 −715 27 831 −1058 741 940 1681 6230.8 658 735 −594 141 799 −865 735 781 1516 6510.9 389 729 −348 381 770 −512 729 458 1187 6751.0 0 723 7 730 730 0 723 −9 714 714
Note: Positive stress indicates compression and negative stress indicates tension.
TABLE 10.16 Concrete Stresses after Total Losses for the Interior GirderTop fiber stress (psi) Bottom fiber stress (psi)
Total TotalLocation F ∗
pCFM∗
psCFfinal F ∗
pCFM∗
psCFfinal
Span (x/L) fLOAD Pj /A P ∗j
Yt /I fpsF stress fLOAD Pj /A P ∗j
yb/I fpsF stress
0.0 0 713 7 720 720 0 713 −9 704 7040.1 653 720 −343 377 1030 −858 720 450 1170 3120.2 1100 726 −584 141 1241 −1466 726 768 1494 480.3 1348 731 −701 30 1377 −1772 731 922 1652 −1190.4 1403 738 −735 4 1407 −1844 738 966 1704 −140
1 0.5 1272 746 −647 99 1371 −1672 746 850 1596 −760.6 958 751 −455 296 1254 −1260 751 599 1350 900.7 467 745 −152 593 1060 −614 745 200 945 3310.8 −510 739 −246 985 475 670 739 −324 415 10850.9 −1351 732 737 1469 119 1776 732 −969 −237 15391.0 −2070 533 1168 1701 −368 1702 533 −960 −427 1275
0.0 −2070 533 1164 1697 −373 1702 533 −957 −423 12780.1 −1351 691 715 1406 55 1776 691 −940 −249 15270.2 −510 685 252 937 427 670 685 −331 353 10240.3 467 679 −113 566 1033 −614 679 148 828 2130.4 958 673 −382 292 1250 −1260 673 502 1175 −85
2 0.5 1272 667 −557 111 1383 −1672 667 732 1399 −2730.6 1403 662 −641 21 1424 −1844 662 842 1504 −3400.7 1348 655 −616 40 1387 −1772 655 809 1465 −3070.8 1100 649 −514 135 1235 −1466 649 676 1325 −1220.9 653 643 −302 341 994 −858 643 397 1040 1811.0 0 637 6 643 643 0 637 −8 629 629
Note: fLOAD = fDC1 + fDC2 + FDW + fLL+IM . Positive stress indicates compression and negative stress indicates tension.
Mu ≤ φMn
Mu = η∑
γiMi = 0.95[1.25(MDC1 + MDC2)
+ 1.5MDW + 1.75MLLH ] + Mps
where φ is the flexural resistance factor 1.0 and Mps is the secondary moment due to
c©1999 by CRC Press LLC
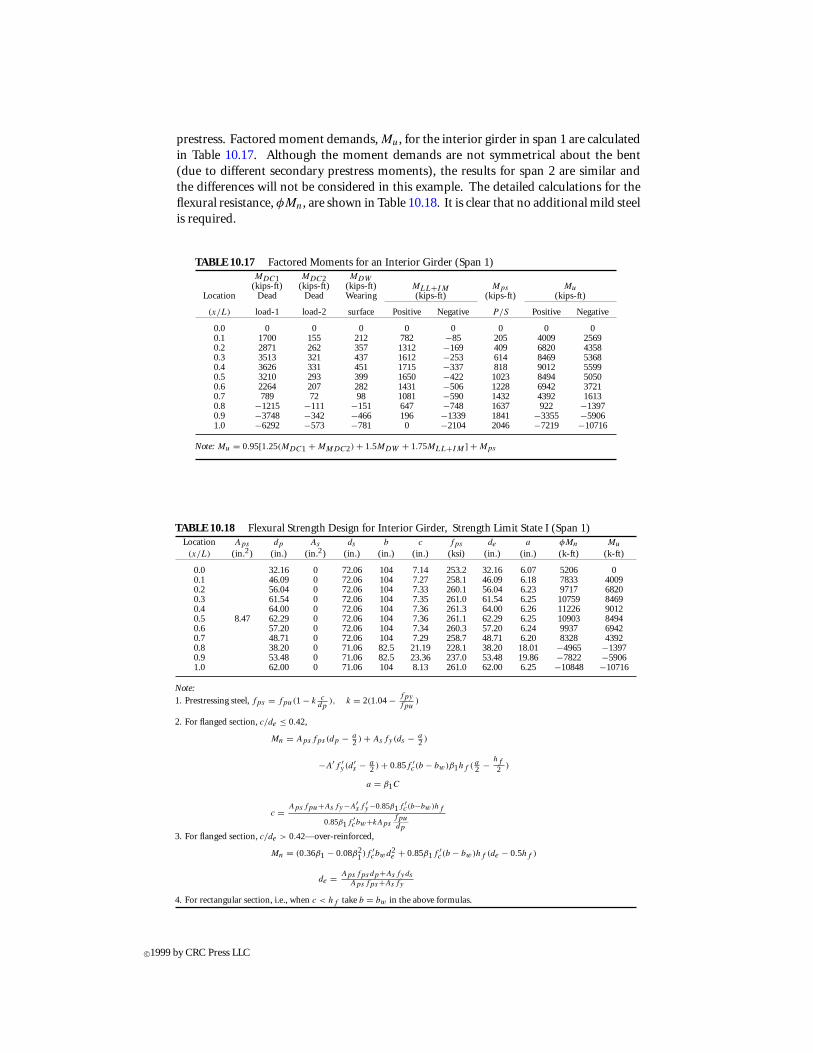
prestress. Factored moment demands, Mu, for the interior girder in span 1 are calculatedin Table 10.17. Although the moment demands are not symmetrical about the bent(due to different secondary prestress moments), the results for span 2 are similar andthe differences will not be considered in this example. The detailed calculations for theflexural resistance, φMn, are shown in Table 10.18. It is clear that no additional mild steelis required.
TABLE 10.17 Factored Moments for an Interior Girder (Span 1)MDC1 MDC2 MDW
(kips-ft) (kips-ft) (kips-ft) MLL+IM Mps MuLocation Dead Dead Wearing (kips-ft) (kips-ft) (kips-ft)
(x/L) load-1 load-2 surface Positive Negative P/S Positive Negative
0.0 0 0 0 0 0 0 0 00.1 1700 155 212 782 −85 205 4009 25690.2 2871 262 357 1312 −169 409 6820 43580.3 3513 321 437 1612 −253 614 8469 53680.4 3626 331 451 1715 −337 818 9012 55990.5 3210 293 399 1650 −422 1023 8494 50500.6 2264 207 282 1431 −506 1228 6942 37210.7 789 72 98 1081 −590 1432 4392 16130.8 −1215 −111 −151 647 −748 1637 922 −13970.9 −3748 −342 −466 196 −1339 1841 −3355 −59061.0 −6292 −573 −781 0 −2104 2046 −7219 −10716
Note: Mu = 0.95[1.25(MDC1 + MMDC2) + 1.5MDW + 1.75MLL+IM ] + Mps
TABLE 10.18 Flexural Strength Design for Interior Girder, Strength Limit State I (Span 1)Location Aps dp As ds b c fps de a φMn Mu
(x/L) (in.2) (in.) (in.2) (in.) (in.) (in.) (ksi) (in.) (in.) (k-ft) (k-ft)
0.0 32.16 0 72.06 104 7.14 253.2 32.16 6.07 5206 00.1 46.09 0 72.06 104 7.27 258.1 46.09 6.18 7833 40090.2 56.04 0 72.06 104 7.33 260.1 56.04 6.23 9717 68200.3 61.54 0 72.06 104 7.35 261.0 61.54 6.25 10759 84690.4 64.00 0 72.06 104 7.36 261.3 64.00 6.26 11226 90120.5 8.47 62.29 0 72.06 104 7.36 261.1 62.29 6.25 10903 84940.6 57.20 0 72.06 104 7.34 260.3 57.20 6.24 9937 69420.7 48.71 0 72.06 104 7.29 258.7 48.71 6.20 8328 43920.8 38.20 0 71.06 82.5 21.19 228.1 38.20 18.01 −4965 −13970.9 53.48 0 71.06 82.5 23.36 237.0 53.48 19.86 −7822 −59061.0 62.00 0 71.06 104 8.13 261.0 62.00 6.25 −10848 −10716
Note:
1. Prestressing steel, fps = fpu(1 − k cdp
), k = 2(1.04− fpyfpu
)
2. For flanged section, c/de ≤ 0.42,
Mn = Apsfps (dp − a2 ) + Asfy(ds − a
2 )
−A′f ′y (d ′
s − a2 ) + 0.85f ′
c(b − bw)β1hf ( a2 − hf
2 )
a = β1C
c = Apsfpu+Asfy−A′s f ′
y−0.85β1f ′c(b−bw)hf
0.85β1f ′cbw+kAps
fpudp
3. For flanged section, c/de > 0.42—over-reinforced,
Mn = (0.36β1 − 0.08β21)f ′
cbwd2e + 0.85β1f ′
c(b − bw)hf (de − 0.5hf )
de = Apsfpsdp+AsfydsApsfps+Asfy
4. For rectangular section, i.e., when c < hf take b = bw in the above formulas.
c©1999 by CRC Press LLC
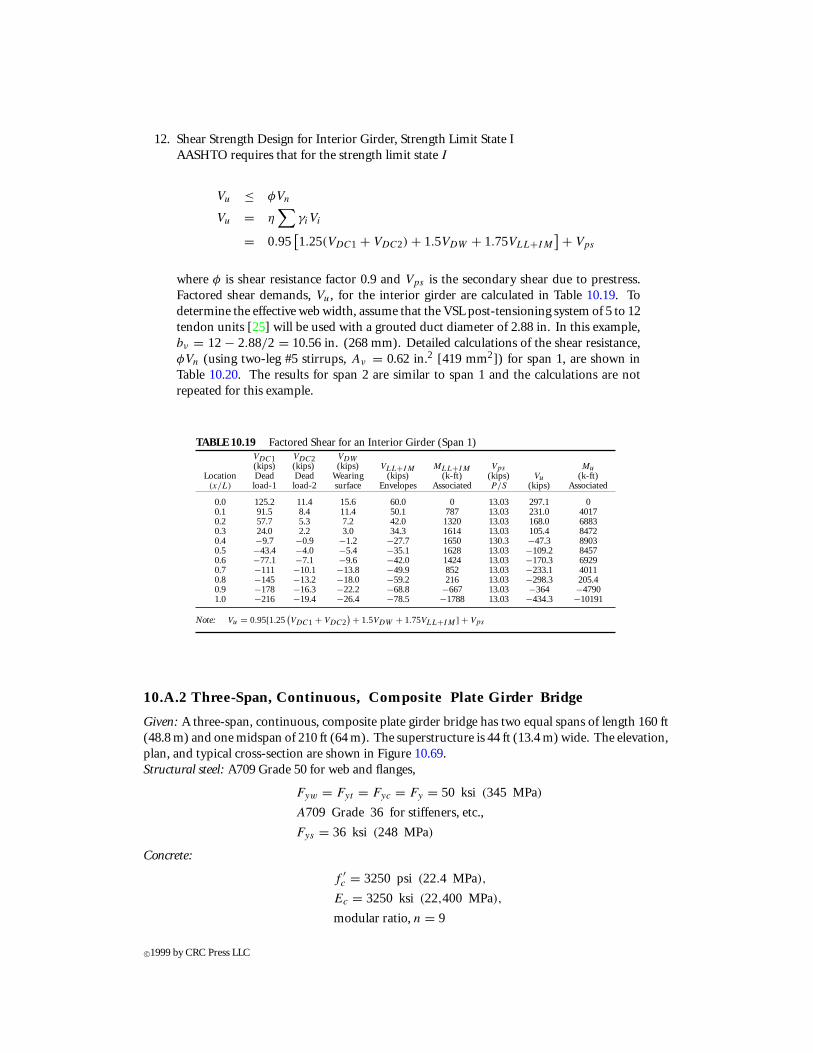
12. Shear Strength Design for Interior Girder, Strength Limit State IAASHTO requires that for the strength limit state I
Vu ≤ φVn
Vu = η∑
γiVi
= 0.95[1.25(VDC1 + VDC2) + 1.5VDW + 1.75VLL+IM
] + Vps
where φ is shear resistance factor 0.9 and Vps is the secondary shear due to prestress.Factored shear demands, Vu, for the interior girder are calculated in Table 10.19. Todetermine the effective web width, assume that the VSL post-tensioning system of 5 to 12tendon units [25] will be used with a grouted duct diameter of 2.88 in. In this example,bν = 12− 2.88/2 = 10.56 in. (268 mm). Detailed calculations of the shear resistance,φVn (using two-leg #5 stirrups, Aν = 0.62 in.2 [419 mm2]) for span 1, are shown inTable 10.20. The results for span 2 are similar to span 1 and the calculations are notrepeated for this example.
TABLE 10.19 Factored Shear for an Interior Girder (Span 1)VDC1 VDC2 VDW(kips) (kips) (kips) VLL+IM MLL+IM Vps Mu
Location Dead Dead Wearing (kips) (k-ft) (kips) Vu (k-ft)(x/L) load-1 load-2 surface Envelopes Associated P/S (kips) Associated
0.0 125.2 11.4 15.6 60.0 0 13.03 297.1 00.1 91.5 8.4 11.4 50.1 787 13.03 231.0 40170.2 57.7 5.3 7.2 42.0 1320 13.03 168.0 68830.3 24.0 2.2 3.0 34.3 1614 13.03 105.4 84720.4 −9.7 −0.9 −1.2 −27.7 1650 130.3 −47.3 89030.5 −43.4 −4.0 −5.4 −35.1 1628 13.03 −109.2 84570.6 −77.1 −7.1 −9.6 −42.0 1424 13.03 −170.3 69290.7 −111 −10.1 −13.8 −49.9 852 13.03 −233.1 40110.8 −145 −13.2 −18.0 −59.2 216 13.03 −298.3 205.40.9 −178 −16.3 −22.2 −68.8 −667 13.03 −364 −47901.0 −216 −19.4 −26.4 −78.5 −1788 13.03 −434.3 −10191
Note: Vu = 0.95[1.25(VDC1 + VDC2
) + 1.5VDW + 1.75VLL+IM ] + Vps
10.A.2 Three-Span, Continuous, Composite Plate Girder Bridge
Given: A three-span, continuous, composite plate girder bridge has two equal spans of length 160 ft(48.8 m) and one midspan of 210 ft (64 m). The superstructure is 44 ft (13.4 m) wide. The elevation,plan, and typical cross-section are shown in Figure 10.69.Structural steel: A709 Grade 50 for web and flanges,
Fyw = Fyt = Fyc = Fy = 50 ksi (345 MPa)
A709 Grade 36 for stiffeners, etc.,
Fys = 36 ksi (248 MPa)
Concrete:
f ′c = 3250 psi (22.4 MPa),
Ec = 3250 ksi (22,400 MPa),
modular ratio, n = 9
c©1999 by CRC Press LLC
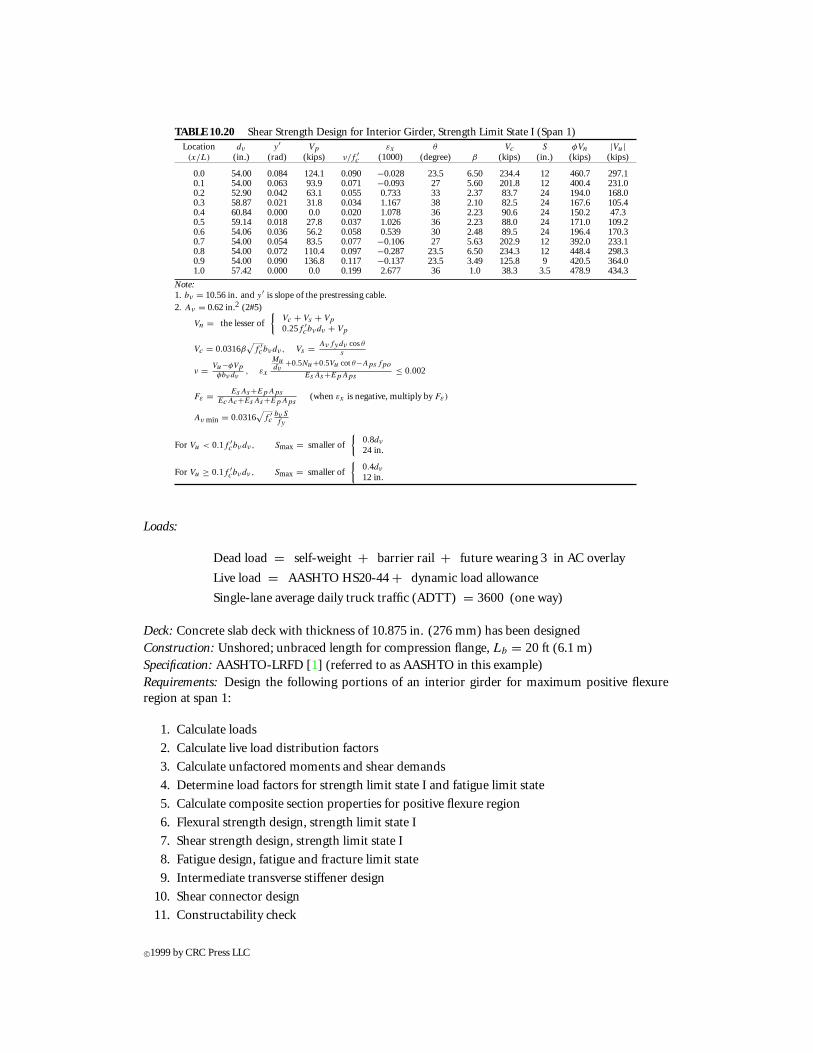
TABLE 10.20 Shear Strength Design for Interior Girder, Strength Limit State I (Span 1)Location dν y′ Vp εx θ Vc S φVn |Vu|(x/L) (in.) (rad) (kips) ν/f ′
c (1000) (degree) β (kips) (in.) (kips) (kips)
0.0 54.00 0.084 124.1 0.090 −0.028 23.5 6.50 234.4 12 460.7 297.10.1 54.00 0.063 93.9 0.071 −0.093 27 5.60 201.8 12 400.4 231.00.2 52.90 0.042 63.1 0.055 0.733 33 2.37 83.7 24 194.0 168.00.3 58.87 0.021 31.8 0.034 1.167 38 2.10 82.5 24 167.6 105.40.4 60.84 0.000 0.0 0.020 1.078 36 2.23 90.6 24 150.2 47.30.5 59.14 0.018 27.8 0.037 1.026 36 2.23 88.0 24 171.0 109.20.6 54.06 0.036 56.2 0.058 0.539 30 2.48 89.5 24 196.4 170.30.7 54.00 0.054 83.5 0.077 −0.106 27 5.63 202.9 12 392.0 233.10.8 54.00 0.072 110.4 0.097 −0.287 23.5 6.50 234.3 12 448.4 298.30.9 54.00 0.090 136.8 0.117 −0.137 23.5 3.49 125.8 9 420.5 364.01.0 57.42 0.000 0.0 0.199 2.677 36 1.0 38.3 3.5 478.9 434.3
Note:1. bν = 10.56 in. and y′ is slope of the prestressing cable.2. Aν = 0.62 in.2 (2#5)
Vn = the lesser of
{Vc + Vs + Vp
0.25f ′cbνdν + Vp
Vc = 0.0316β√
f ′cbνdν , Vs = Aνfydν cosθ
s
ν = Vu−φVpφbνdν
, εx
Mudν
+0.5Nu+0.5Vu cotθ−Apsfpo
EsAs+EpAps≤ 0.002
Fε = EsAs+EpApsEcAc+EsAs+EpAps
(when εx is negative, multiply by Fε)
Aν min = 0.0316√
f ′c
bνSfy
For Vu < 0.1f ′cbνdν , Smax = smaller of
{0.8dν
24 in.
For Vu ≥ 0.1f ′cbνdν , Smax = smaller of
{0.4dν
12 in.
Loads:
Dead load = self-weight + barrier rail + future wearing 3 in AC overlay
Live load = AASHTO HS20-44 + dynamic load allowance
Single-lane average daily truck traffic (ADTT) = 3600 (one way)
Deck: Concrete slab deck with thickness of 10.875 in. (276 mm) has been designedConstruction: Unshored; unbraced length for compression flange, Lb = 20 ft (6.1 m)Specification: AASHTO-LRFD [1] (referred to as AASHTO in this example)Requirements: Design the following portions of an interior girder for maximum positive flexureregion at span 1:
1. Calculate loads
2. Calculate live load distribution factors
3. Calculate unfactored moments and shear demands
4. Determine load factors for strength limit state I and fatigue limit state
5. Calculate composite section properties for positive flexure region
6. Flexural strength design, strength limit state I
7. Shear strength design, strength limit state I
8. Fatigue design, fatigue and fracture limit state
9. Intermediate transverse stiffener design
10. Shear connector design
11. Constructability check
c©1999 by CRC Press LLC
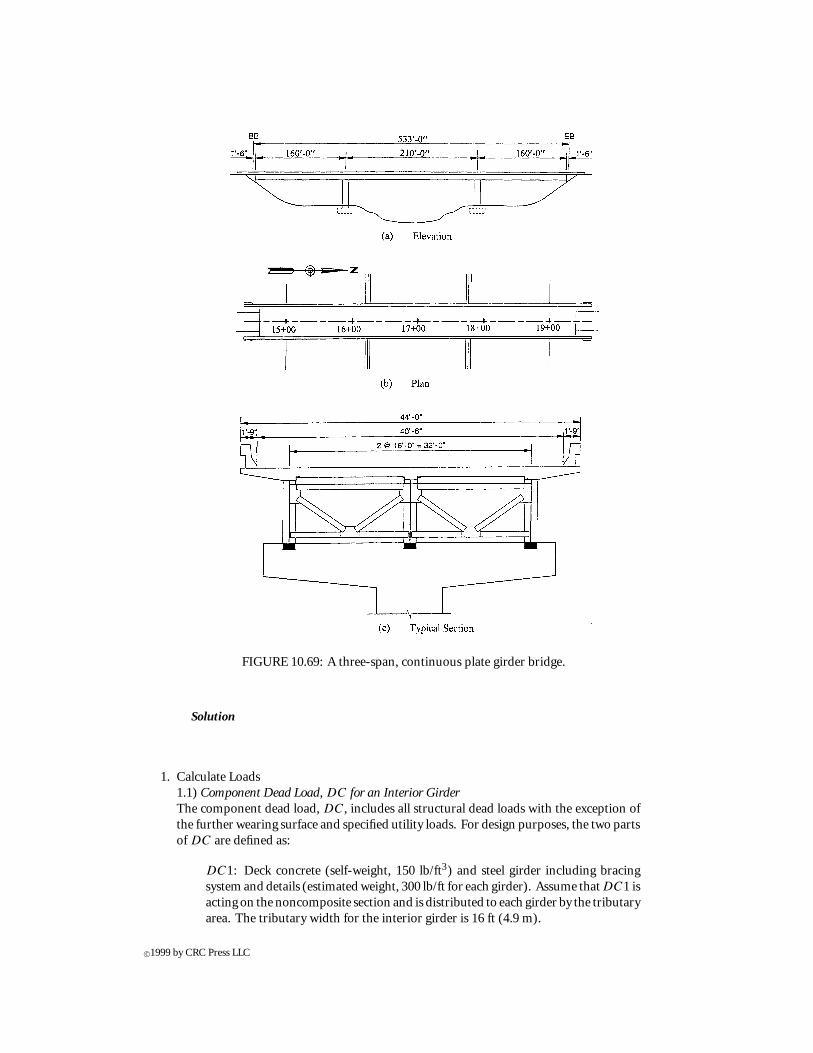
FIGURE 10.69: A three-span, continuous plate girder bridge.
Solution
1. Calculate Loads1.1) Component Dead Load, DC for an Interior GirderThe component dead load, DC, includes all structural dead loads with the exception ofthe further wearing surface and specified utility loads. For design purposes, the two partsof DC are defined as:
DC1: Deck concrete (self-weight, 150 lb/ft3) and steel girder including bracingsystem and details (estimated weight, 300 lb/ft for each girder). Assume thatDC1 isacting on the noncomposite section and is distributed to each girder by the tributaryarea. The tributary width for the interior girder is 16 ft (4.9 m).
c©1999 by CRC Press LLC
DC1 = [(10.875/12)(16) + (1.5)(15.25− 10.975)/12(1.5)] (0.15) + 0.3
= 2.557 kips/ft (37.314 kN/m)
DC2: Barrier rail weight (784 kips/ft). Assume that DC2 is acting on the long-termcomposite section and is equally distributed to each girder.
DC2 = 0.784/3 = 0.261 kips/ft (3.809 kN/m)
1.2) Wearing Surface Load, DW
A future wearing surface of 3 in. (76 mm) with a unit weight of 140 lb/ft3 is assumed tobe carried by the long-term composite section and equally distributed to each girder.
DW = (deck width–barrier width) (thickness of wearing surface)
(unit weight)/3
= [44− 2(1.75)] (0.25)(0.14)/3 = 0.473kips/ft (6.903kN/m)
1.3) Live Load, LL, and Dynamic Load Allowance, IM
The design live load, LL, is the AASHTO HS20-44 vehicular live load. To consider thewheel load impact from moving vehicles, the dynamic load allowance, IM = 33% for thestrength limit state and 15% for the fatigue limit state are used [AASHTO Table 3.6.2.1-1].
2. Calculate Live Load Distribution Factors2.1) Range Applicability of AASHTO Approximate FormulasAASHTO-LRFD [1] recommends that approximate methods be used to distribute liveload to individual girders. For concrete deck on steel girders, live load distribution factorsaredependenton thegirder spacing, S, span length,L, concrete slabdepth, ts , longitudinalstiffnessparameter,Kg , andnumberofgirders,Nb. The rangeof applicabilityofAASHTOapproximate formulas are 3.5 ft ≤ S ≤ 16 ft; 4.5 in. ≤ ts ≤ 12 in.; 20 ft ≤ L ≤ 240ft; and Nb ≥ 4. For this design example, S = 16 ft, L1 = L3 = 160 ft, L2 = 210 ft,ts = 10.875 in., and Nb = 3 < 4. It is obvious that this bridge is out of the range ofapplicability of AASHTO formulas. The conventional level rule is used to determine liveload distribution factors.2.2) Level RuleThe level rule assumes that the deck in its transverse direction is simply supported by thegirders and uses statics to determine the live load distribution to the girders. AASHTOalso requires that when the level rule is used, the multiple presence factor, m (1.2 for oneloaded lane, 1.0 for two loaded lanes, 0.85 for three loaded lanes, and 0.65 for more thanthree loaded lanes), should apply.2.3) Live Load Distribution Factors for Strength Limit StateFigure 10.70 shows locations of traffic lanes for the interior girder. For a 12-ft (3.6-m)traffic lane width, the number of traffic lanes for this bridge is three.
(a) One lane loaded (Figure 10.70a)
R = 13
16= 0.8125 lanes
LD = mR = 1.2(0.8125) = 0.975 lanes
c©1999 by CRC Press LLC
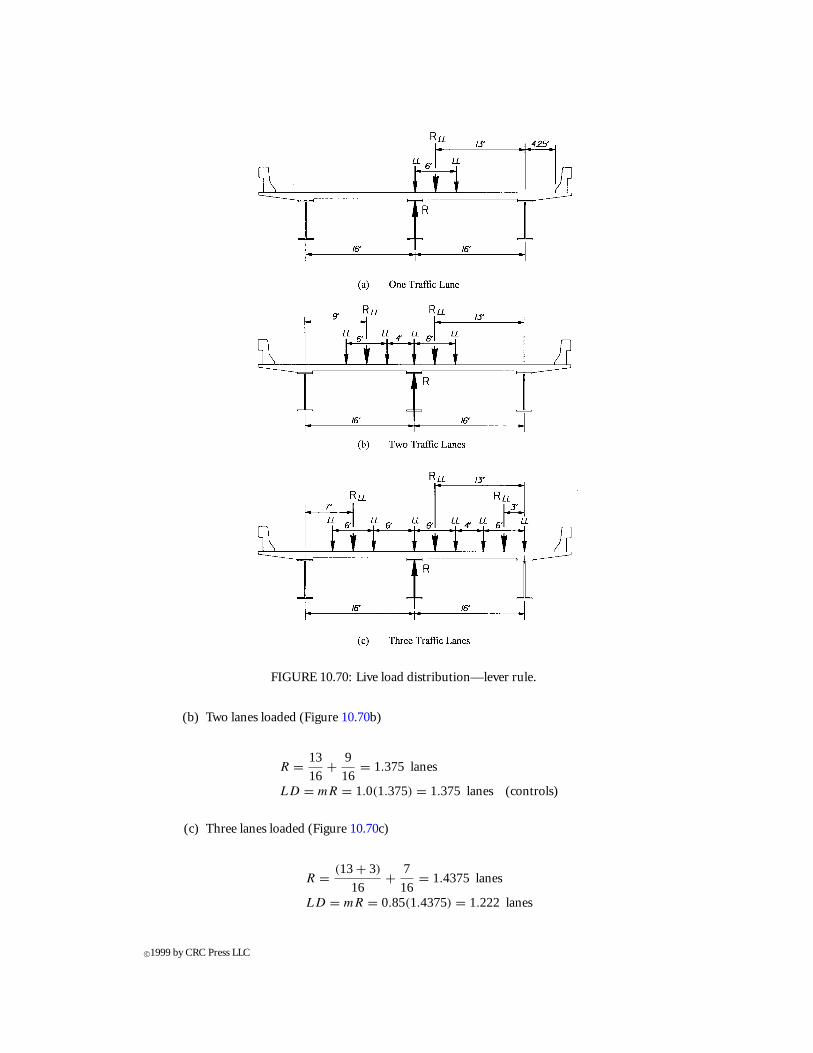
FIGURE 10.70: Live load distribution—lever rule.
(b) Two lanes loaded (Figure 10.70b)
R = 13
16+ 9
16= 1.375 lanes
LD = mR = 1.0(1.375) = 1.375 lanes (controls)
(c) Three lanes loaded (Figure 10.70c)
R = (13+ 3)
16+ 7
16= 1.4375 lanes
LD = mR = 0.85(1.4375) = 1.222 lanes
c©1999 by CRC Press LLC

2.4) Live Load Distribution Factors for Fatigue Limit StateAASHTO requires that one traffic lane load be used and multiple presence factors not beapplied to the fatigue limit state. The live load distribution factor for the fatigue limitstate, therefore, is obtained by one lane loaded without a multiple presence factor of 1.2.
LD = 0.813
3. Calculate Unfactored Moments and Shear DemandsFor an interior girder, unfactored moment and shear demands are shown in Figures 10.71and 10.72 for the strength limit state and Figures 10.73 and 10.74 for the fatigue limitstate. The details are listed in Tables 10.21 to 10.23. Only the results for span 1 and onehalf of span 2 are shown in these tables and figures since the bridge is symmetrical aboutthe centerline of span 2.
4. Determine Load Factors for Strength Limit State I and Fatigue Limit State4.1) General Design Equation (AASHTO Article 1.3.2)
η∑
γiQi ≤ φRn (10.43)
where γi are load factors and φ resistance factors; Qi represents force effects or demands;and Rn is the nominal resistance. η is a factor related to ductility, redundancy, andoperational importance of that being designed and is defined as:
η = ηDηRηI ≥ 0.95 (10.44)
where
ηD ={
1.05 for nonductile components and connections0.95 for ductile components and connections
(10.45)
ηR ={
1.05 for nonredundant members0.95 for redundant members
(10.46)
ηI =
1.05 operationally important bridge0.95 general bridge
only apply to strengthand extreme event limit states
(10.47)
For this bridge, the following values are assumed:
Ductility Redundancy ImportanceLimit states ηD ηR ηI η
Strength limit state 0.95 0.95 1.05 0.95
Fatigue limit state 1.0 1.0 1.0 1.0
4.2) Load Factors and Load CombinationsThe load factors and combinations are specified as (AASHTO Table 3.4.1-1):
Strength limit state I: 1.25(DC1 + DC2) + 1.5(DW) + 1.75(LL + IM)
Service limit state: 0.75(LL + IM)
5. Calculate Composite Section Properties for Positive Flexure RegionTry steel section (Figure 10.75) as:
c©1999 by CRC Press LLC
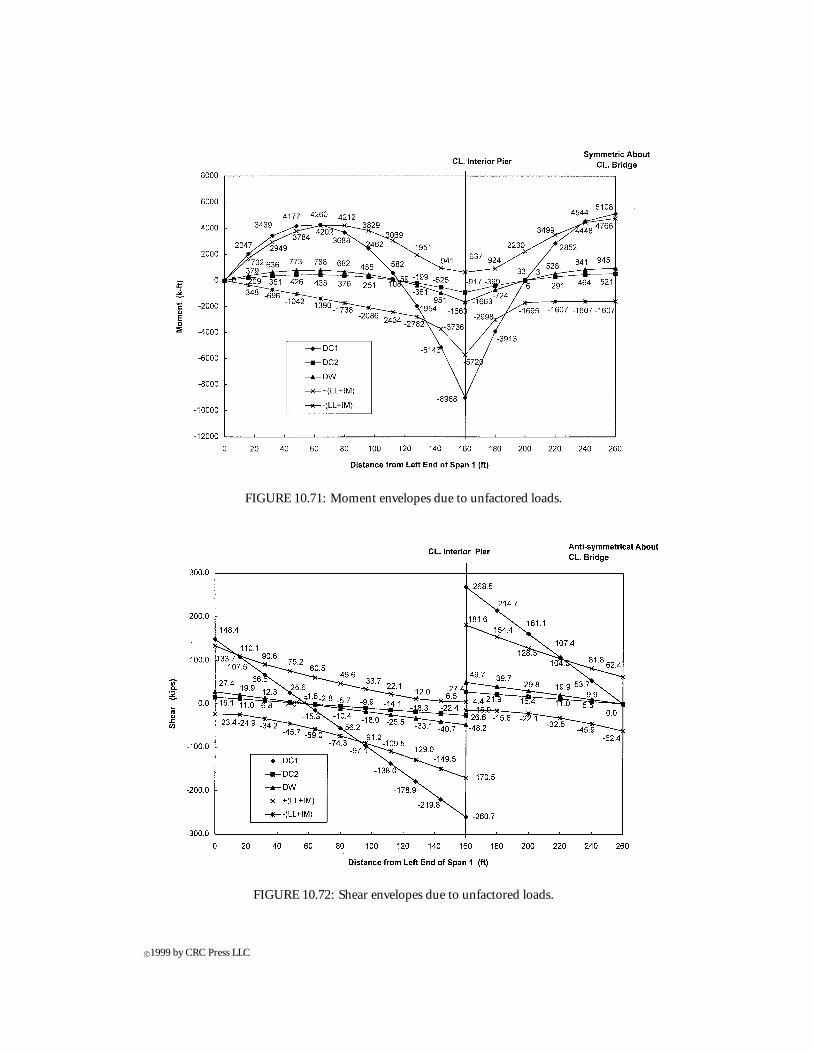
FIGURE 10.71: Moment envelopes due to unfactored loads.
FIGURE 10.72: Shear envelopes due to unfactored loads.
c©1999 by CRC Press LLC
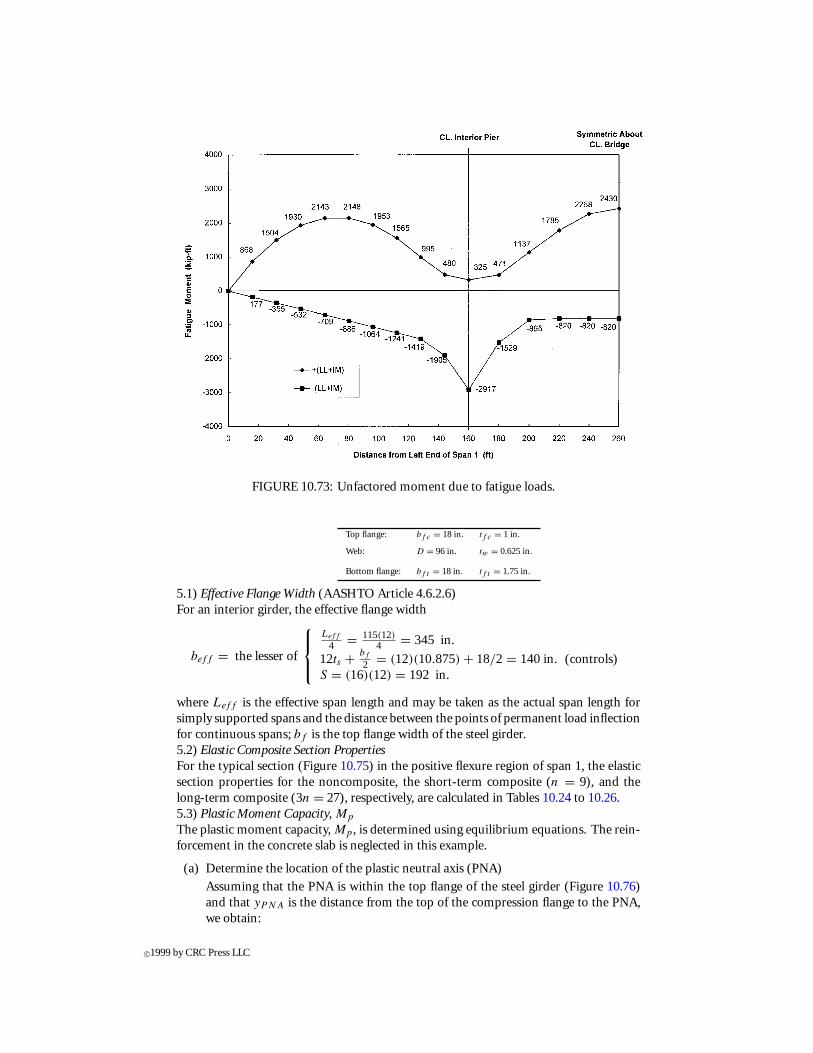
FIGURE 10.73: Unfactored moment due to fatigue loads.
Top flange: bf c = 18 in. tf c = 1 in.
Web: D = 96 in. tw = 0.625 in.
Bottom flange: bf t = 18 in. tf t = 1.75 in.
5.1) Effective Flange Width (AASHTO Article 4.6.2.6)For an interior girder, the effective flange width
beff = the lesser of
Leff
4 = 115(12)4 = 345 in.
12ts + bf
2 = (12)(10.875) + 18/2 = 140in. (controls)S = (16)(12) = 192 in.
where Leff is the effective span length and may be taken as the actual span length forsimply supported spans and the distance between the points of permanent load inflectionfor continuous spans; bf is the top flange width of the steel girder.5.2) Elastic Composite Section PropertiesFor the typical section (Figure 10.75) in the positive flexure region of span 1, the elasticsection properties for the noncomposite, the short-term composite (n = 9), and thelong-term composite (3n = 27), respectively, are calculated in Tables 10.24 to 10.26.5.3) Plastic Moment Capacity, Mp
The plastic moment capacity, Mp , is determined using equilibrium equations. The rein-forcement in the concrete slab is neglected in this example.
(a) Determine the location of the plastic neutral axis (PNA)
Assuming that the PNA is within the top flange of the steel girder (Figure 10.76)and that yPNA is the distance from the top of the compression flange to the PNA,we obtain:
c©1999 by CRC Press LLC

TABLE 10.21 Moment Envelopes for Strength Limit State IMDC1 MDC2 MDW
(kips-ft) (kips-ft) (kips-ft) MLL+IM MuLocation Dead Dead Wearing (kips-ft) (kips-ft)
Span (x/L) load-1 load-2 surface Positive Negative Positive Negative
0.0 0 0 0 0 0 0 00.1 2047 209 379 1702 −348 6049 26410.2 3439 351 636 2949 −696 10310 42500.3 4177 426 773 3784 −1042 12858 48350.4 4260 435 788 4202 −1390 13684 4387
1 0.5 3688 376 682 4212 −1738 12800 29080.6 2462 251 455 3829 −2086 10236 4020.7 582 59 108 3069 −2434 6017 −31310.8 −1954 −199 −361 1951 −2782 173 −76960.9 −5143 −525 −951 941 −3736 −6522 −142971.0 −8988 −917 −1663 637 −5720 −13074 −23641
0.0 −8988 −917 −1663 637 −5720 −13074 −236410.1 −3913 −399 −724 924 −2998 −4616 −111360.2 33 3 6 2230 −1695 3759 −2767
2 0.3 2852 291 528 3499 −1607 10302 18120.4 4544 464 841 4448 −1607 14540 44730.5 5108 521 945 4766 −1607 15954 5359
Note: Live load distribution factor, LD = 1.375. Dynamic load allowance, IM = 33%. Mu =0.95
[1.25
(MDC1 + MDC2
) + 1.5MDW + 1.75MLL+IM
]
TABLE 10.22 Shear Envelopes for Strength Limit State IVDC1 VDC2 VDW
(kips-ft) (kips-ft) (kips-ft) VLL+IM VuLocation Dead Dead Wearing (kips-ft) (kips-ft)
Span (x/L) load-1 load-2 surface Positive Negative Positive Negative
0.0 148.4 15.1 27.4 133.7 −23.4 455.4 194.30.1 107.5 11.0 19.9 110.1 −24.9 352.2 127.70.2 66.6 6.8 12.3 90.6 −34.2 255.3 47.80.3 25.6 2.6 4.7 75.2 −45.7 165.2 −35.70.4 −15.3 −1.6 −2.8 60.5 −59.0 76.5 −122.1
1 0.5 −56.2 −5.7 −10.4 46.6 −74.3 −10.8 −211.80.6 −97.1 −9.9 −18.0 33.7 −91.2 −96.7 −304.30.7 −138.0 −14.1 −25.5 22.1 −109.5 −180.2 −398.90.8 −178.9 −18.3 −33.1 12.0 −129.0 −261.5 −495.80.9 −219.8 −22.4 −40.7 6.5 −149.5 −334.9 −594.11.0 −260.7 −26.6 −48.2 4.4 −170.5 −402.5 −693.3
0.0 268.5 27.4 49.7 181.6 −15.0 724.2 397.30.1 214.7 21.9 39.7 154.4 −15.8 594.2 311.20.2 161.1 16.4 29.8 128.3 −22.1 466.5 216.4
2 0.3 107.4 11.0 19.9 104.0 −32.5 341.8 115.00.4 53.7 5.5 9.9 81.8 −45.9 220.4 8.10.5 0 0 0 62.4 −62.4 103.8 −103.8
Note: Live load distribution factor, LD = 1.375. Dynamic load allowance, IM = 33%. Vu =0.95
[1.25
(VDC1 + VDC2
) + 1.5VDW + 1.75VLL+IM
]
Ps + Pc1 = Pc2 + Pw + Pt (10.48)
where
Ps = 0.85f ′cbeff ts = 0.85(3.25)(140)(10.875) = 4206kips (18,708 kN)
Pc1 = yPNAbf cFyc
Pc2 = Af cFyc − Pc1 = (tf c − yPNA)bf cFyc
Pc = Pc1 + Pc2 = Af cFyc = (18)(1)(50) = 900kips (4,003 kN)
Pw = AwFyw = (96)(0.625)(50) = 3,000 kips (13,344 kN)
Pt = Af tFyt = (18)(1.75)(50) = 1,575 kips (7,006 kN)
Substituting the above expressions into Equation (10.48) and solving for yPNA, weobtain
c©1999 by CRC Press LLC
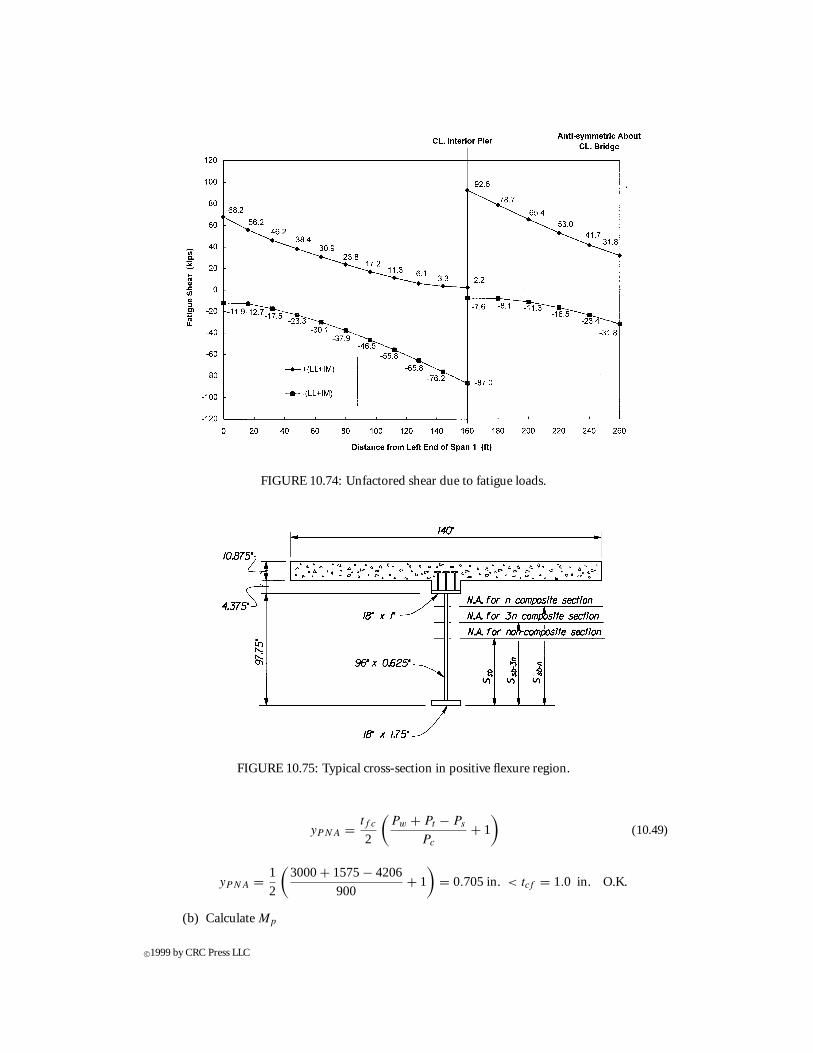
FIGURE 10.74: Unfactored shear due to fatigue loads.
FIGURE 10.75: Typical cross-section in positive flexure region.
yPNA = tf c
2
(Pw + Pt − Ps
Pc
+ 1
)(10.49)
yPNA = 1
2
(3000+ 1575− 4206
900+ 1
)= 0.705in. < tcf = 1.0 in. O.K.
(b) Calculate Mp
c©1999 by CRC Press LLC
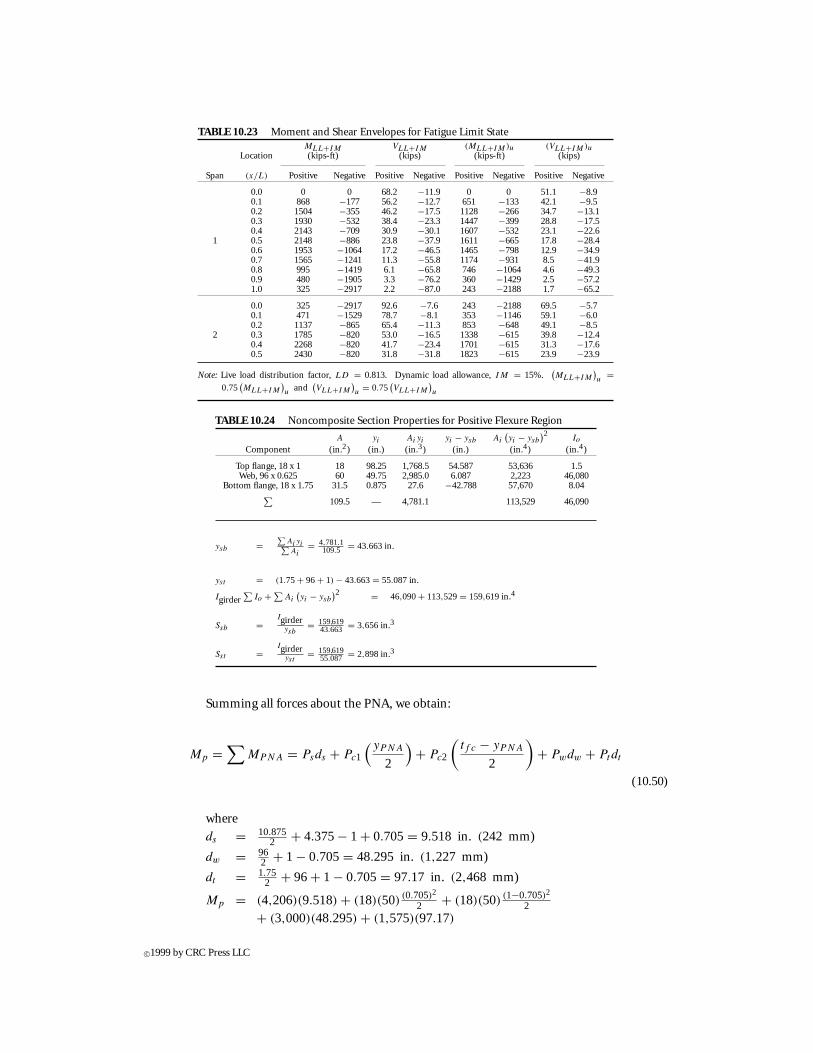
TABLE 10.23 Moment and Shear Envelopes for Fatigue Limit StateMLL+IM VLL+IM (MLL+IM )u (VLL+IM )u
Location (kips-ft) (kips) (kips-ft) (kips)
Span (x/L) Positive Negative Positive Negative Positive Negative Positive Negative
0.0 0 0 68.2 −11.9 0 0 51.1 −8.90.1 868 −177 56.2 −12.7 651 −133 42.1 −9.50.2 1504 −355 46.2 −17.5 1128 −266 34.7 −13.10.3 1930 −532 38.4 −23.3 1447 −399 28.8 −17.50.4 2143 −709 30.9 −30.1 1607 −532 23.1 −22.6
1 0.5 2148 −886 23.8 −37.9 1611 −665 17.8 −28.40.6 1953 −1064 17.2 −46.5 1465 −798 12.9 −34.90.7 1565 −1241 11.3 −55.8 1174 −931 8.5 −41.90.8 995 −1419 6.1 −65.8 746 −1064 4.6 −49.30.9 480 −1905 3.3 −76.2 360 −1429 2.5 −57.21.0 325 −2917 2.2 −87.0 243 −2188 1.7 −65.2
0.0 325 −2917 92.6 −7.6 243 −2188 69.5 −5.70.1 471 −1529 78.7 −8.1 353 −1146 59.1 −6.00.2 1137 −865 65.4 −11.3 853 −648 49.1 −8.5
2 0.3 1785 −820 53.0 −16.5 1338 −615 39.8 −12.40.4 2268 −820 41.7 −23.4 1701 −615 31.3 −17.60.5 2430 −820 31.8 −31.8 1823 −615 23.9 −23.9
Note: Live load distribution factor, LD = 0.813. Dynamic load allowance, IM = 15%.(MLL+IM
)u
=0.75
(MLL+IM
)u and
(VLL+IM
)u
= 0.75(VLL+IM
)u
TABLE 10.24 Noncomposite Section Properties for Positive Flexure Region
A yi Aiyi yi − ysb Ai
(yi − ysb
)2Io
Component (in.2) (in.) (in.3) (in.) (in.4) (in.4)
Top flange, 18 x 1 18 98.25 1,768.5 54.587 53,636 1.5Web, 96 x 0.625 60 49.75 2,985.0 6.087 2,223 46,080
Bottom flange, 18 x 1.75 31.5 0.875 27.6 −42.788 57,670 8.04∑109.5 — 4,781.1 113,529 46,090
ysb =∑
Aiyi∑Ai
= 4,781.1109.5 = 43.663in.
yst = (1.75+ 96+ 1) − 43.663= 55.087in.
Igirder∑
Io + ∑Ai
(yi − ysb
)2 = 46,090+ 113,529= 159,619in.4
Ssb =Igirder
ysb= 159,619
43.663 = 3,656in.3
Sst =Igirder
yst= 159,619
55.087 = 2,898in.3
Summing all forces about the PNA, we obtain:
Mp =∑
MPNA = Psds + Pc1
(yPNA
2
)+ Pc2
(tf c − yPNA
2
)+ Pwdw + Ptdt
(10.50)
where
ds = 10.8752 + 4.375− 1 + 0.705= 9.518 in. (242 mm)
dw = 962 + 1 − 0.705= 48.295 in. (1,227 mm)
dt = 1.752 + 96+ 1 − 0.705= 97.17 in. (2,468 mm)
Mp = (4,206)(9.518) + (18)(50) (0.705)2
2 + (18)(50) (1−0.705)2
2+ (3,000)(48.295) + (1,575)(97.17)
c©1999 by CRC Press LLC
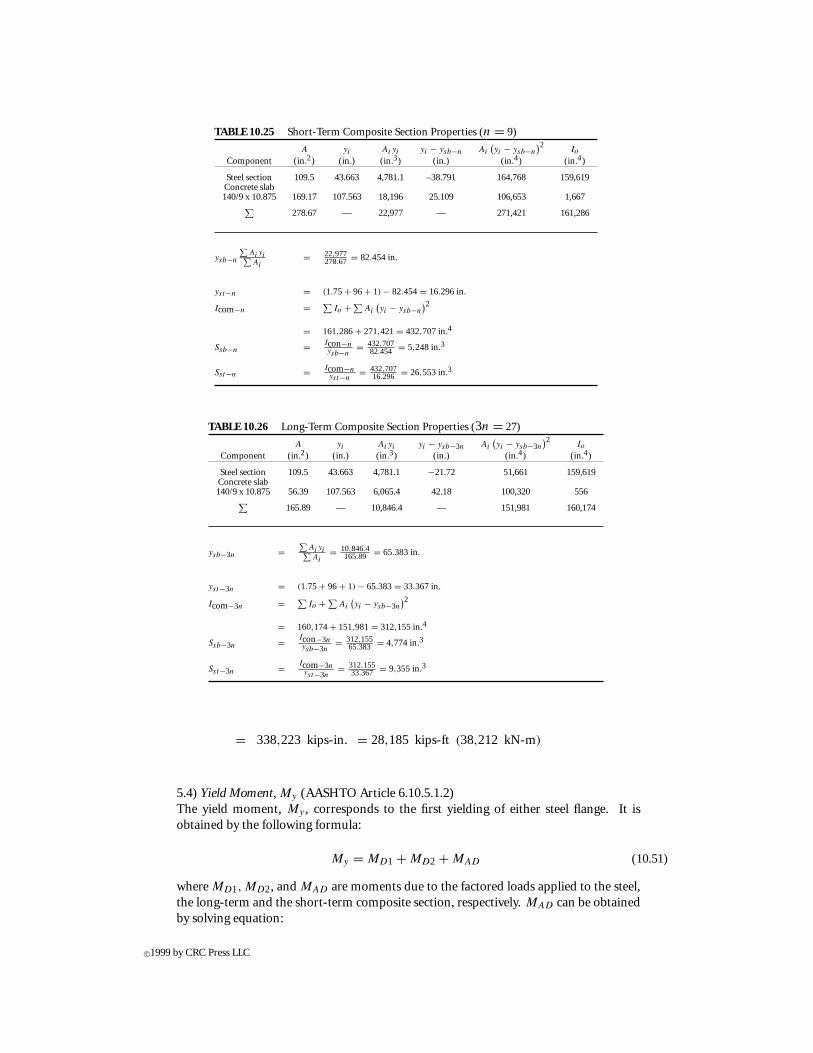
TABLE 10.25 Short-Term Composite Section Properties (n = 9)
A yi Aiyi yi − ysb−n Ai
(yi − ysb−n
)2Io
Component (in.2) (in.) (in.3) (in.) (in.4) (in.4)
Steel section 109.5 43.663 4,781.1 –38.791 164,768 159,619Concrete slab140/9 x 10.875 169.17 107.563 18,196 25.109 106,653 1,667∑
278.67 — 22,977 — 271,421 161,286
ysb−n
∑Aiyi∑Ai
= 22,977278.67 = 82.454in.
yst−n = (1.75+ 96+ 1) − 82.454= 16.296in.
Icom−n = ∑Io + ∑
Ai
(yi − ysb−n
)2
= 161,286+ 271,421= 432,707in.4
Ssb−n = Icon−nysb−n
= 432,70782.454 = 5,248in.3
Sst−n = Icom−nyst−n
= 432,70716.296 = 26,553in.3
TABLE 10.26 Long-Term Composite Section Properties (3n = 27)
A yi Aiyi yi − ysb−3n Ai
(yi − ysb−3n
)2Io
Component (in.2) (in.) (in.3) (in.) (in.4) (in.4)
Steel section 109.5 43.663 4,781.1 −21.72 51,661 159,619Concrete slab140/9 x 10.875 56.39 107.563 6,065.4 42.18 100,320 556∑
165.89 — 10,846.4 — 151,981 160,174
ysb−3n =∑
Aiyi∑Ai
= 10,846.4165.89 = 65.383in.
yst−3n = (1.75+ 96+ 1) − 65.383= 33.367in.
Icom−3n = ∑Io + ∑
Ai
(yi − ysb−3n
)2
= 160,174+ 151,981= 312,155in.4
Ssb−3n = Icon−3nysb−3n
= 312,15565.383 = 4,774in.3
Sst−3n = Icom−3nyst−3n
= 312,15533.367 = 9,355in.3
= 338,223 kips-in. = 28,185 kips-ft (38,212 kN-m)
5.4) Yield Moment, My (AASHTO Article 6.10.5.1.2)The yield moment, My , corresponds to the first yielding of either steel flange. It isobtained by the following formula:
My = MD1 + MD2 + MAD (10.51)
where MD1, MD2, and MAD are moments due to the factored loads applied to the steel,the long-term and the short-term composite section, respectively. MAD can be obtainedby solving equation:
c©1999 by CRC Press LLC
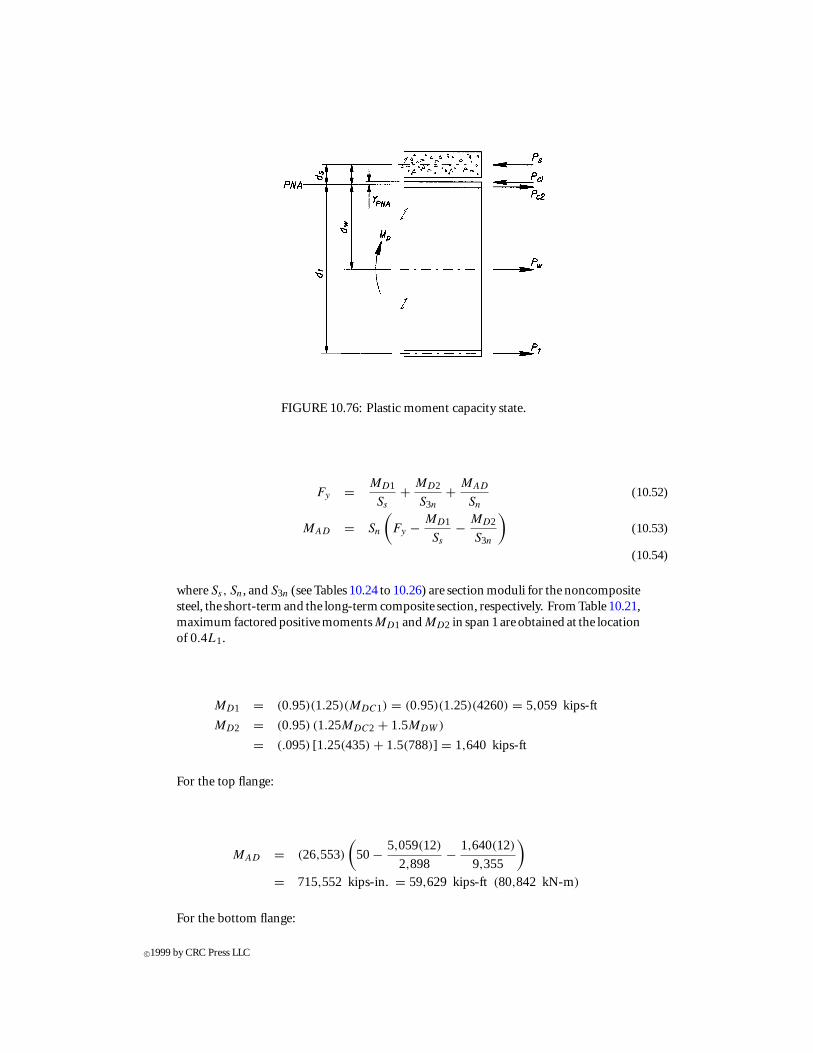
FIGURE 10.76: Plastic moment capacity state.
Fy = MD1
Ss
+ MD2
S3n
+ MAD
Sn
(10.52)
MAD = Sn
(Fy − MD1
Ss
− MD2
S3n
)(10.53)
(10.54)
where Ss, Sn, and S3n (see Tables 10.24 to 10.26) are section moduli for the noncompositesteel, the short-term and the long-term composite section, respectively. From Table 10.21,maximum factored positive momentsMD1 andMD2 in span 1 are obtained at the locationof 0.4L1.
MD1 = (0.95)(1.25)(MDC1) = (0.95)(1.25)(4260) = 5,059 kips-ft
MD2 = (0.95) (1.25MDC2 + 1.5MDW)
= (.095) [1.25(435) + 1.5(788)] = 1,640 kips-ft
For the top flange:
MAD = (26,553)
(50− 5,059(12)
2,898− 1,640(12)
9,355
)= 715,552 kips-in. = 59,629 kips-ft (80,842 kN-m)
For the bottom flange:
c©1999 by CRC Press LLC

MAD = (5,248)
(50− 5,059(12)
3,656− 1,640(12)
4,774
)= 153,623 kips-in. = 12,802 kips-ft (17,356 kN-m) (controls)
... My = 5,059+ 1,640+ 12,802= 19,501kips-ft (26,438 kN-m)
6. Flexural Strength Design, Strength Limit State I6.1) Compactness of Steel Girder SectionThe steel section is first checked to meet the requirements of a compact section (AASHTOArticle 6.10.5.2.2).
(a) Ductility requirement:
Dp ≤ d + ts + th
7.5
where Dp is the depth from the top of the concrete deck to the PNA, d is the depth ofthe steel girder, and th is the thickness of the concrete haunch above the top flange ofthe steel girder. The purpose of this requirement is to prevent permanent crashingof the concrete slab when the composite section approaches its plastic momentcapacity. For this example, referring to Figure 10.75 and 10.76, we obtain:
Dp = 10.875+ 4.375− 1 + 0.705= 14.955 in. (381 mm)
Dp = 14.955 in. <d + ts + th
7.5= 98.75+ 10.875+ 3.375
7.5= 15.067 in. O.K.
(b) Web slenderness requirement,2Dcp
tw≤ 3.76
√E
Fyc
where Dcp is the depth of the web in compression at the plastic moment state.Since the PNA is within the top flange, Dcp is equal to zero. The web slendernessrequirement is satisfied.
(c) Compression flange slenderness and compression flange bracing requirement
It isusually assumedthat the topflange is adequatelybracedby thehardenedconcretedeck; there are, therefore, no requirements for the compression flange slendernessand bracing for compact composite sections at the strength limit state.... the section is a compact composite section.
6.2) Moment of Inertia Ratio Limit (AASHTO Article 6.10.1.1)The flexural members shall meet the following requirement:
0.1 ≤ Iyc
Iy
≤ 0.9
where Iyc and Iy are the moments of inertia of the compression flange and steel girderabout the vertical axis in the plane of web, respectively. This limit ensures that the lateraltorsional bucking formulas are valid.
c©1999 by CRC Press LLC

Iyc = (1)(18)3
12= 486 in.4
Iy = 486+ (96)(0.625)3
12+ (1.75)(18)3
12+ 1338 in.4
0.1 <Iyc
Iy
= 486
1338= 0.36 < 0.9 O.K.
6.3) Nominal Flexure Resistance, Mn (AASHTO Article 10.5.2.2a)It is assumed that the adjacent interior-pier section is noncompact. For continuous spanswith thenoncompact interior support section, thenominal flexure resistanceof a compactcomposite section is taken as:
Mn = 1.3RhMy ≤ Mp (10.55)
where Rh is a flange stress reduction factor taken as 1.0 for this homogeneous girder.
Mn = 1.3(1.0)(19,501) = 25,351 kips-ft < Mp = 28,185 kips-ft
6.4) Strength Limit State IAASHTO-LRFD [1] requires that for strength limit state I
Mu ≤ φf Mn (10.56)
where φf is the flexural resistance factor = 1.0. For the composite section in the positiveflexure region in span 1, the maximum moment occurs at 0.4L1 (see Table 10.21).
Mu = 13,684 kips-ft < φf Mn = (1.0)(25,351) = 25,351 kips-ft O.K.
7. Shear Strength Design, Strength Limit State I7.1) Nominal Shear Resistance, Vn
(a) Vn for an unstiffened web (AASHTO Article 6.10.7.2)
Vn =
Vp = 0.58FywDtw For Dtw
≤ 2.46√
EFyw
1.48t2w
√EFyw For 2.46
√E
Fyw< D
tw≤ 3.07
√E
Fyw
4.55t3wE
DFor D
tw> 3.07
√E
Fyw
(10.57)
where D is depth of web and tw is thickness of web.
...D
tw= 96
0.625= 153.6 > 3.07
√E
Fyw
3.07
√29,000
50= 73.9
... Vn = 4.55t3wE
D= 4.55(0.625)3(29,000)
96= 335.6 kips (1,493kN)
(b) Vn for an end-stiffened web panel (AASHTO Article 6.10.7.3.3c)
c©1999 by CRC Press LLC

Vn = CVp (10.58)
C =
1.0 For Dtw
< 1.10√
EkFyw
1.10(D/tw)
√EkFyw
For 1.10√
EkFyw
≤ Dtw
≤ 1.38√
EkFyw
1.52(D/tw)2
√EkFyw
For Dtw
> 1.38√
EkFyw
(10.59)
k = 5 + 5
(do/D)2(10.60)
in which do is the spacing of transverse stiffeners (Figure 10.77).
FIGURE 10.77: Typical steel girder dimensions.
For do = 240 in. and k = 5 + 5(240/96)2 = 5.80
...D
tw= 153.6 > 1.38
√Ek
Fyw
= 1.38
√29,000(5.8)
50= 80
... C = 152
(153.6)2=
√29,000(5.80)
50= 0.374
Vp = 0.58FywDtw = 0.58(50)(96)(0.625) = 1,740 kips (7,740 kN)
Vn = CVp = 0.374(1740) = 650.8 kips (2,895 kN)
c©1999 by CRC Press LLC

(c) Vn for interior-stiffened web panel (AASHTO Article 6.10.7.3a)
Vn =
Vp
(C + 0.87(1−C)√
1+(do/D)2
)For Mu ≤ 0.5φf Mp
RVp
(C + 0.87(1−C)√
1+(do/D)2
)≥ CVp For Mu > 0.5φf Mp
(10.61)
where
R =[0.6 + 0.4
(φf Mn − Mu
φf Mn − 0.75φf My
)]≤ 1.0 (10.62)
7.2) Strength Limit State IAASHTO-LRFD [1] requires that for strength limit state I
Vu ≤ φνVn (10.63)
where φν is the shear resistance factor = 1.0.
(a) Left end of span 1:
... Vu = 445.4 kips > φνVn (for unstiffened web) = 335.6 kips... Stiffeners are needed to increase shear capacity.
In order to facilitate handling of web panel sections, the spacing of transverse stiff-eners shall meet (AASHTO Article 6.10.7.3.2) the following requirement:
do ≤ D
[260
(D/tw)
]2
(10.64)
Try do = 240 in. for end-stiffened web panel
do = 240 in. < D
[260
(D/tw)
]2
= 96
[260
96/0.625
]2
= 275 in. O.K.
and then
φνVn = (1.0)650.8 = 650.8 kips > Vu = 445.4 kips O.K.
(b) Location of the first intermediate stiffeners, 20 ft (6.1m) from the left end in span 1:Factored shear for this location can be obtained using linear interpolation fromTable 10.22. Since Vu = 328.0 kips (1459 kN) is less than the shear capacity ofthe unstiffened web, φνVn = 335.5 kips (1492 kN), the intermediate transversestiffeners may be omitted after the first intermediate stiffeners. Similar calculationscan be used to determine the remaining stiffeners along the girder.
8. Fatigue Design, Fatigue and Fracture Limit StateThe base metal at the connection plate welds to flanges, and webs located at 96 ft (29.26 m)(0.6L1) from the left end of span 1 will be checked for the fatigue load combination.
c©1999 by CRC Press LLC

8.1) Load-Induced Fatigue (AASHTO Article 6.6.1.2)The design requirements for load-induced fatigue apply only to (1) details subjected to anet applied tensile stress and (2) regions where the unfactored permanent loads producecompression, and only if the compressive stress is less than twice the maximum tensilestress resulting from the fatigue load combination. In the fatigue limit state, all stressesare calculated using the elastic section properties (Tables 10.24 to 10.26).
(a) Top-flange weld
The compressive stress at the top-flange weld due to unfactored permanent loads isobtained:
fDC = MDC1(yst − tf c)
Igirder+ (MDC2 + MDW)(yst − tf c)
Icom−3n
= 2462(12)(55.087− 1.0)
159,619+ (251+ 455)(12)(33.367− 1.0)
312,155= 10.89ksi (75.09MPa)
Assume that the negative fatigue moments are carried by the steel section only inthe positive flexure region. The maximum tensile stress at the top-flange weld atthis location due to factored fatigue moment is
fLL+IM =∣∣− (MLL+IM)u
∣∣ (yst − tf c
)Igirder
= 798(12)(54.087)
159,619
= 3.25ksi (22.41MPa)... fDC = 10.89 ksi > 2fLL+IM = 6.49 ksi... no need to check fatigue for the top-flange weld
(b) Bottom-flange weld
• Factored fatigue stress range, (1f )uFor the positive flexure region, we assume that positive fatigue moments areapplied to the short-term composite section and negative fatigue moments areapplied to the noncomposite steel section only.
(1f )u = (MLL+IM)u(ysb−n − tf t
)Icom−n
+∣∣− (MLL+IM)u
∣∣ (ysb − tf t
)Igirder
= 1465(12)(82.454− 1.75)
432,707+ 798(12)(43.663− 1.75)
159,619= 5.79 ksi (39.92 MPa)
• Nominal fatigue resistance range, (1F)nFor filet-welded connections with weld lines normal to the direction of stress,the base metal at transverse stiffeners to flange welds is fatigue detail categoryC′ (AASHTO Table 6.6.1.2.3.-1).
c©1999 by CRC Press LLC

(1F)n =(
A
N
)1/3
≥ 1
2(1F)T H (10.65)
where A is a constant dependent on detail category = 44(10)8 for category C′and
N = (365)(75)n(ADT T )ST (10.66)
ADT TST = p(ADT T ) (10.67)
where p is a fraction of a truck in a single lane (AASHTO Table 3.6.1.4.2-1) =0.8 for three-lane traffic, and n is the number of stress-range cycles per truckpassage (AASHTO Table 6.6.1.2.5-2) = 1.0 for the positive flexure region.
N = (365)(75)(1.0)(0.8)(3600) = 7.844(10)7
For category C′ detail, (1F)T H = 12 ksi (AASHTO Table 6.6.1.2.5-3).
...
(A
N
)1/3
=(
44(10)8
7.844(10)7
)1/3
= 3.83 ksi <1
2(1F)T H = 6 ksi
... (1F)n = 1
2(1F)T H = 6 ksi (41.37 MPa)
• Fatigue limit stateAASHTO requires that each detail shall satisfy:
(1f )u ≤ (1F)n (10.68)
For top-flange weld
(1f )u = 5.79 ksi < (1F)n = 6 ksi O.K.
8.2) Fatigue Requirements for Web (AASHTO Article 6.10.4)The purpose of these requirements is to control out-of-plane flexing of the web due toflexure and shear under repeated live loadings. The repeated live load is taken as twicethe factored fatigue load.
(a) Flexure requirement
fcf ≤
RhFyc For 2Dctw
≤ 5.76√
EFyc
RhFyc
(3.58− 04482Dc
tw
√FycE
)For 5.76
√E
Fyc≤ 2Dc
tw≤ 6.43
√E
Fyc
28.9RhE(
tw2Dc
)2For 2Dc
tw> 6.43
√E
Fyc
(10.69)
where fcf is the maximum elastic flexural stress in the compression flange due tothe unfactored permanent loads and repeated live loadings; Fyc is the yield strengthof the compression flange; and Dc is the depth of the web in compression.
• Depth of web in compression, DcConsidering the algebraic sum of stresses acting on different sections based onelastic section properties, Dc can be obtained by the following formula:
c©1999 by CRC Press LLC

Dc = fDC1 + fDC2 + fDW + fLL+IM
fDC1yst
+ fDC2+fDWyst−3n
+ fLL+IMyst−n
− tf c
=MDC1
Sst+ MDC2+MDW
Sst−3n+ 2(MLL+IM )u
Sst−n
MDC1Igirder
+ MDC2+MDWIcom−3n
+ 2(MLL+IM )uIcom−n
− tf c (10.70)
Substituting moments (Tables 10.21 and 10.23) and section properties (Ta-bles 10.24 and 10.26) into Equation 10.70, we obtain:
Dc =4260(12)
2,898 + (435+788)(12)9,355 + 2(1607)(12)
26,5534260(12)159,629 + (435+788)(12)
312,155 + 2(1607)(12)432,707
− 1
= 17.640+ 1.569+ 1.452
0.320+ 0.047+ 0.089− 1 = 44.29 in. (1,125 mm)
2Dc
tw= 2(44.29)
0.625= 141.7 < 5.76
√E
Fyc
= 183.7
• Maximum compressive stress in flange, fcf (at location 0.4L1)
fcf = fDC1 + fDC2 + fDW + fLL+IM
= MDC1
Sst
+ MDC2 + MDW
Sst−3n
+ 2(MLL+IM)u
Sst−n
= 17.64+ 1.57+ 1.45 = 20.66 < RhFyc = 50 ksi
(b) Shear (AASHTO Article 10.6.10.4.4)
The left end of span 1 is checked as follows:
• Fatigue load
Vu = VDC1 + VDC2 + VDW + 2(VLL+IM)u
= 148.4 + 15.1 + 27.4 + 2(51.1) = 293.1 kips (1304 kN)
• Fatigue shear stress
νcf = Vu
Dtw= 293.1
96(0.625)= 4.89 ksi (33.72 MPa)
• Fatigue shear resistance
C = 0.374 (see Step 7)
νn = 0.58CFyw = 0.58(0.374)(50)
= 10.85ksi > νcf = 4.89ksi O.K.
c©1999 by CRC Press LLC
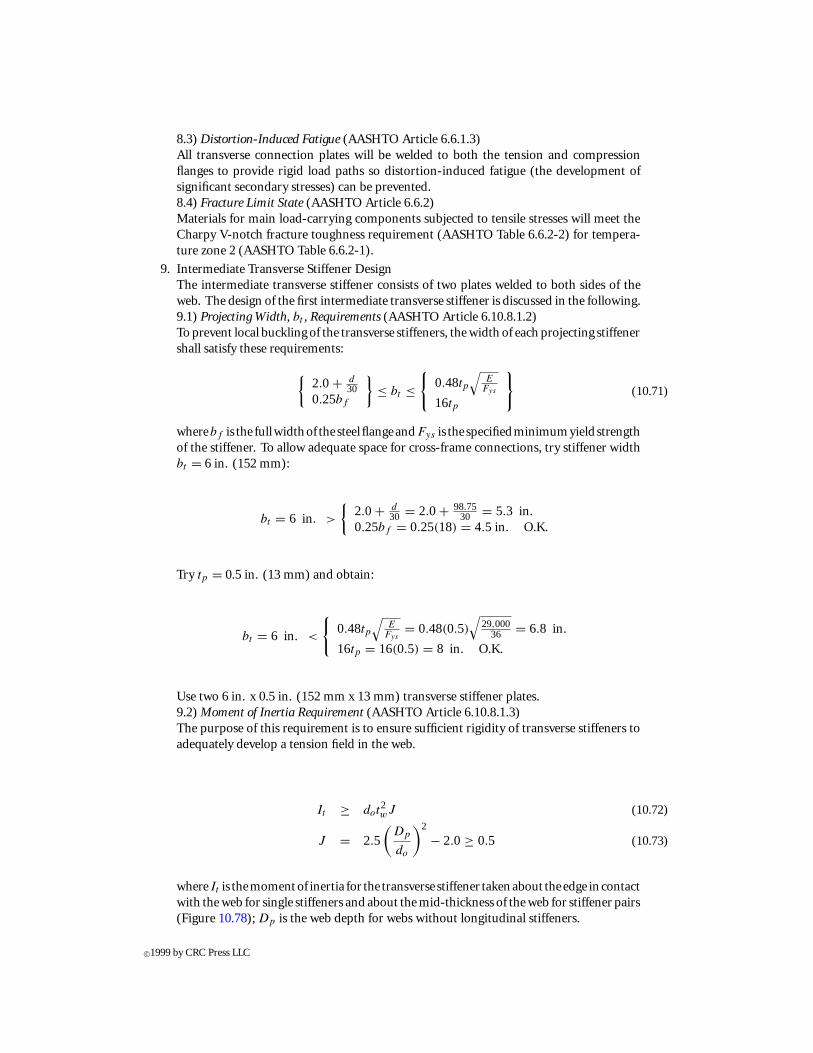
8.3) Distortion-Induced Fatigue (AASHTO Article 6.6.1.3)All transverse connection plates will be welded to both the tension and compressionflanges to provide rigid load paths so distortion-induced fatigue (the development ofsignificant secondary stresses) can be prevented.8.4) Fracture Limit State (AASHTO Article 6.6.2)Materials for main load-carrying components subjected to tensile stresses will meet theCharpy V-notch fracture toughness requirement (AASHTO Table 6.6.2-2) for tempera-ture zone 2 (AASHTO Table 6.6.2-1).
9. Intermediate Transverse Stiffener DesignThe intermediate transverse stiffener consists of two plates welded to both sides of theweb. The design of the first intermediate transverse stiffener is discussed in the following.9.1) Projecting Width, bt , Requirements (AASHTO Article 6.10.8.1.2)To prevent local buckling of the transverse stiffeners, the width of each projecting stiffenershall satisfy these requirements:
{2.0 + d
300.25bf
}≤ bt ≤
{0.48tp
√E
Fys
16tp
}(10.71)
wherebf is the fullwidthof the steelflangeandFys is the specifiedminimumyield strengthof the stiffener. To allow adequate space for cross-frame connections, try stiffener widthbt = 6 in. (152 mm):
bt = 6 in. >
{2.0 + d
30 = 2.0 + 98.7530 = 5.3 in.
0.25bf = 0.25(18) = 4.5 in. O.K.
Try tp = 0.5 in. (13 mm) and obtain:
bt = 6 in. <
{0.48tp
√E
Fys= 0.48(0.5)
√29,000
36 = 6.8 in.
16tp = 16(0.5) = 8 in. O.K.
Use two 6 in. x 0.5 in. (152 mm x 13 mm) transverse stiffener plates.9.2) Moment of Inertia Requirement (AASHTO Article 6.10.8.1.3)The purpose of this requirement is to ensure sufficient rigidity of transverse stiffeners toadequately develop a tension field in the web.
It ≥ dot2wJ (10.72)
J = 2.5
(Dp
do
)2
− 2.0 ≥ 0.5 (10.73)
where It is themomentof inertia for the transverse stiffener takenabout theedge incontactwith the web for single stiffeners and about the mid-thickness of the web for stiffener pairs(Figure 10.78); Dp is the web depth for webs without longitudinal stiffeners.
c©1999 by CRC Press LLC

FIGURE 10.78: Cross-section of web and transverse stiffener.
... J = 2.5
(96
240
)2
− 2.0 = −1.6 < 0.5 ... Use J = 0.5
It = 2
(63(0.5)
12+ (6)(0.5)(3.313)2
)= 83.86 in.4
> dot2wJ = (240)(0.625)2(0.5) = 46.88 in.4 O.K.
9.3) Area Requirement (AASHTO Article 6.10.8.1.4)This requirement ensures that transverse stiffeners have sufficient area to resist the verticalcomponent of the tension field, and is only applied to transverse stiffeners required tocarry the forces imposed by tension-field action.
As ≥ As min =(
0.15BDtw(1 − C)Vu
φνVn
− 18t2w
) (Fyw
Fys
)(10.74)
where B = 1.0 for stiffener pairs. From the previous calculation:
C = 0.374, Fyw = 50 ksi, Fys = 36 ksi
Vu = 328.0 kips, φf Vn = 335.5 kips, tw = 0.625 in.
As = 2(6)(0.5) = 6 in.2 > As min
=(
0.15(1.0)(96)(0.625)(1 − 0374)328.0
335.5− 18(0.625)2
)(50
36
)= − 0.635 in.2
c©1999 by CRC Press LLC

The negative value of As min indicates that the web has sufficient area to resist the verticalcomponent of the tension field.
10. Shear Connector DesignIn a composite girder, stud or channel shear connectors must be provided at the interfacebetween the concrete deck slab and the steel section to resist the interface shear. For acomposite bridge girder, the shear connectors should be normally provided throughoutthe length of the bridge (AASHTO Article 6.10.7.4.1). Stud shear connectors are chosenin this example and will be designed for the fatigue limit state and then checked againstthe strength limit state. The detailed calculations of the shear stud connectors for thepositive flexure region of span 1 are given in the following. A similar procedure can beused to design the shear studs for other portions of the bridge.10.1) Stud Size (AASHTO Article 6.10.7.4.1a)To meet the limits for cover and penetration for shear connectors specified in AASHTOArticle 6.10.7.4.1d, try:
Stud height, Hstud = 7 in. > th + 2 = 3.375+ 2 = 5.375 in. O.K.
Stud diameter, dstud = 0.875 in. < Hstud/4 = 1.75 in. O.K.
10.2) Pitch of Shear Stud, p, for Fatigue Limit State
(a) Basic requirements (AASHTO Article 6.10.7.4.1b)
6dstud ≤ p = nstudZrIcom−n
VsrQ≤ 24 in. (10.75)
where nstud is the number of shear connectors in a cross-section; Q is the firstmoment of transformed section (concrete deck) about the neutral axis of the short-term composite section; Vsr is the shear force range in the fatigue limit state; andZr is the shear fatigue resistance of an individual shear connector.
(b) Fatigue resistance, Zr (AASHTO Article 6.10.7.4.2)
Zr = αd2stud ≥ 5.5d2
stud (10.76)
α = 34.5 − 4.28 logN (10.77)
where N is the number of cycles specified in AASHTO Article 6.6.1.2.5, N =7.844(10)7 cycle (see Step 8).
α = 34.5 − 4.28 log(7.844× 10⁷) = 0.711< 5.5
Zr = 5.5d2stud = 5.5(0.875)2 = 4.211 ksi
(c) First moment, Q, and moment of initial, Icom−n (see Table 10.25)
c©1999 by CRC Press LLC
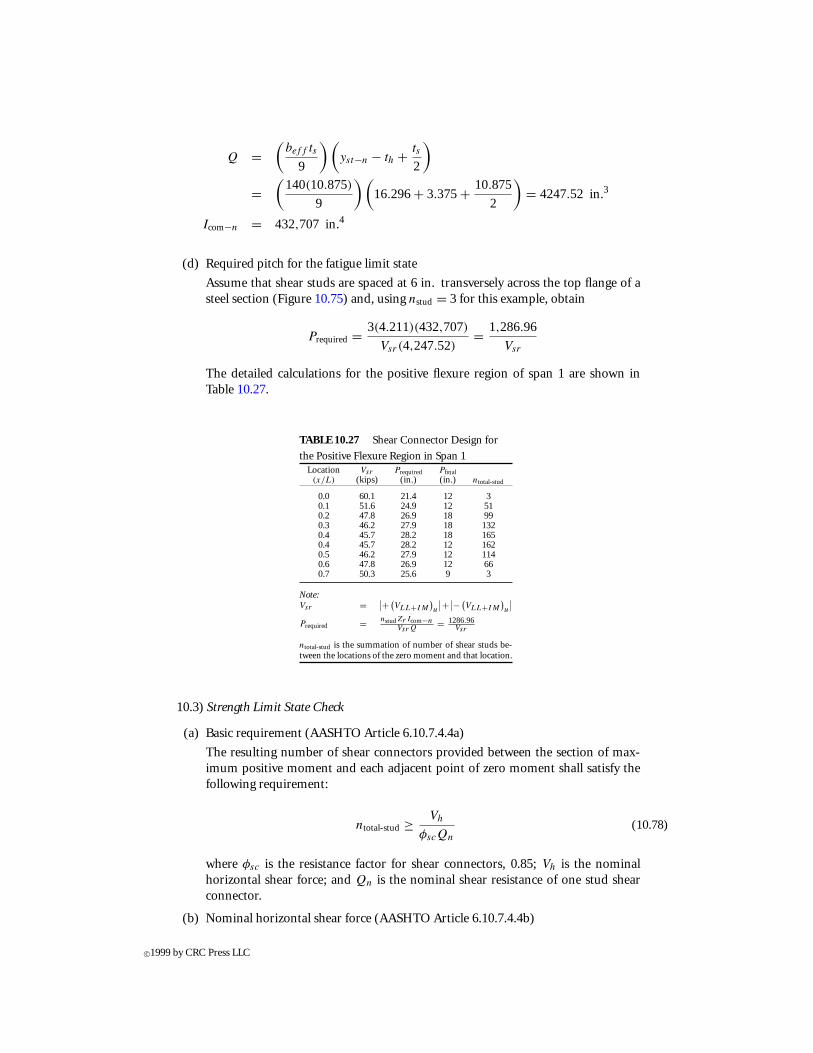
Q =(
beff ts
9
) (yst−n − th + ts
2
)
=(
140(10.875)
9
) (16.296+ 3.375+ 10.875
2
)= 4247.52 in.3
Icom−n = 432,707 in.4
(d) Required pitch for the fatigue limit state
Assume that shear studs are spaced at 6 in. transversely across the top flange of asteel section (Figure 10.75) and, using nstud = 3 for this example, obtain
Prequired = 3(4.211)(432,707)
Vsr (4,247.52)= 1,286.96
Vsr
The detailed calculations for the positive flexure region of span 1 are shown inTable 10.27.
TABLE 10.27 Shear Connector Design for
the Positive Flexure Region in Span 1Location Vsr Prequired Pfinal(x/L) (kips) (in.) (in.) ntotal-stud
0.0 60.1 21.4 12 30.1 51.6 24.9 12 510.2 47.8 26.9 18 990.3 46.2 27.9 18 1320.4 45.7 28.2 18 1650.4 45.7 28.2 12 1620.5 46.2 27.9 12 1140.6 47.8 26.9 12 660.7 50.3 25.6 9 3
Note:Vsr = ∣∣+ (
VLL+IM
)u
∣∣+ ∣∣− (VLL+IM
)u
∣∣Prequired = nstudZr Icom−n
VsrQ= 1286.96
Vsr
ntotal-stud is the summation of number of shear studs be-tween the locations of the zero moment and that location.
10.3) Strength Limit State Check
(a) Basic requirement (AASHTO Article 6.10.7.4.4a)
The resulting number of shear connectors provided between the section of max-imum positive moment and each adjacent point of zero moment shall satisfy thefollowing requirement:
ntotal-stud ≥ Vh
φscQn
(10.78)
where φsc is the resistance factor for shear connectors, 0.85; Vh is the nominalhorizontal shear force; and Qn is the nominal shear resistance of one stud shearconnector.
(b) Nominal horizontal shear force (AASHTO Article 6.10.7.4.4b)
c©1999 by CRC Press LLC
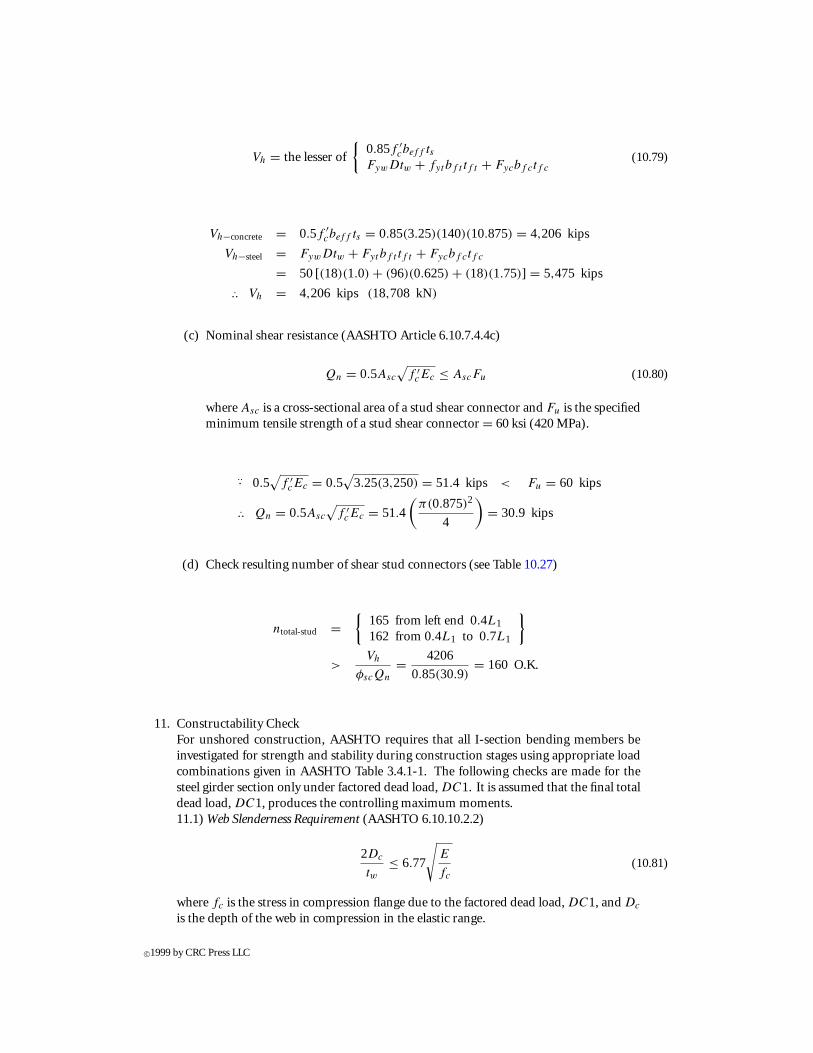
Vh = the lesser of
{0.85f ′
cbeff tsFywDtw + fytbf t tf t + Fycbf ctf c
(10.79)
Vh−concrete = 0.5f ′cbeff ts = 0.85(3.25)(140)(10.875) = 4,206 kips
Vh−steel = FywDtw + Fytbf t tf t + Fycbf ctf c
= 50[(18)(1.0) + (96)(0.625) + (18)(1.75)] = 5,475 kips... Vh = 4,206 kips (18,708 kN)
(c) Nominal shear resistance (AASHTO Article 6.10.7.4.4c)
Qn = 0.5Asc
√f ′
cEc ≤ AscFu (10.80)
where Asc is a cross-sectional area of a stud shear connector and Fu is the specifiedminimum tensile strength of a stud shear connector = 60 ksi (420 MPa).
... 0.5√
f ′cEc = 0.5
√3.25(3,250) = 51.4 kips < Fu = 60 kips
... Qn = 0.5Asc
√f ′
cEc = 51.4
(π(0.875)2
4
)= 30.9 kips
(d) Check resulting number of shear stud connectors (see Table 10.27)
ntotal-stud ={
165 from left end 0.4L1162 from 0.4L1 to 0.7L1
}
>Vh
φscQn
= 4206
0.85(30.9)= 160 O.K.
11. Constructability CheckFor unshored construction, AASHTO requires that all I-section bending members beinvestigated for strength and stability during construction stages using appropriate loadcombinations given in AASHTO Table 3.4.1-1. The following checks are made for thesteel girder section only under factored dead load, DC1. It is assumed that the final totaldead load, DC1, produces the controlling maximum moments.11.1) Web Slenderness Requirement (AASHTO 6.10.10.2.2)
2Dc
tw≤ 6.77
√E
fc
(10.81)
where fc is the stress in compression flange due to the factored dead load, DC1, and Dc
is the depth of the web in compression in the elastic range.
c©1999 by CRC Press LLC

Dc = yst − tf c = 55.087− 1 = 54.087 in. (1,374 mm)
fc = (0.95)(1.25)MDC1
Sst
= 0.95(1.25)(4260)(12)
2,898= 20.95 ksi (145 MPa)
2Dc
tw= 2(54.087)
0.625= 173.1 ≤ 6.77
√E
fc
= 6.77
√29,000
20.95= 251.9 O.K.
... no longitudinal stiffener is required
11.2) Compression Flange Slenderness Requirement (AASHTO Article 6.10.10.2.3)This requirement prevents the local buckling of the top flange before the concrete deckhardens.
bf
2tf≤ 1.38
√√√√ E
fc
√2Dc
tw
(10.82)
bf
2tf= 18
2(1.0)= 9 ≤ 1.38
√√√√ E
fc
√2Dc
tw
= 1.38
√29,000
20.95√
173.1= 14.2 O.K.
11.3) Compression Flange Bracing Requirement (AASHTO Article 6.10.10.2.4)
(a) Flexure (AASHTO Article 6.10.6.4.1)
To ensure that a noncomposite steel girder has sufficient flexural resistance duringconstruction, themomentcapacity shouldbecalculatedconsidering lateral torsionalbuckling with an unbraced length, Lb (Figure 10.77).
For a steel girder without longitudinal stiffeners and (2Dc/tw) > λb
√E/Fyc, the
nominal flexural resistance is
Mn =
1.3RhMy ≤ Mp For Lb ≤ Lp
CbRbRhMy
[1 − 0.5
(Lb−LpLp−Lr
)]≤ RbRhMy For Lp < Lb ≤ Lr
CbRbRhMy2
(LrLb
)2 ≤ RbRhMy For Lb > Lr
(10.83)
Lp ≤ 1.76rt
√E
Fyc
(10.84)
Lr =√
19.71Iycd
Sxc
E
Fyc
(10.85)
where λb equals 4.64 for a member with a compression flange area less than thetension flange area and 5.76 for members with a compression flange area equal toor greater than the tension flange area; rt is the minimum radius of gyration of thecompression flange of the steel section about the vertical axis; Sxc is the sectionmodulus about the horizontal axis of the section to the compression flange (equalto Sst in Table 10.24); Cb is the moment gradient correction factor; and Rb is aflange stress reduction factor considering local buckling of a slender web (AASHTOArticle 6.10.5.4.2).
c©1999 by CRC Press LLC
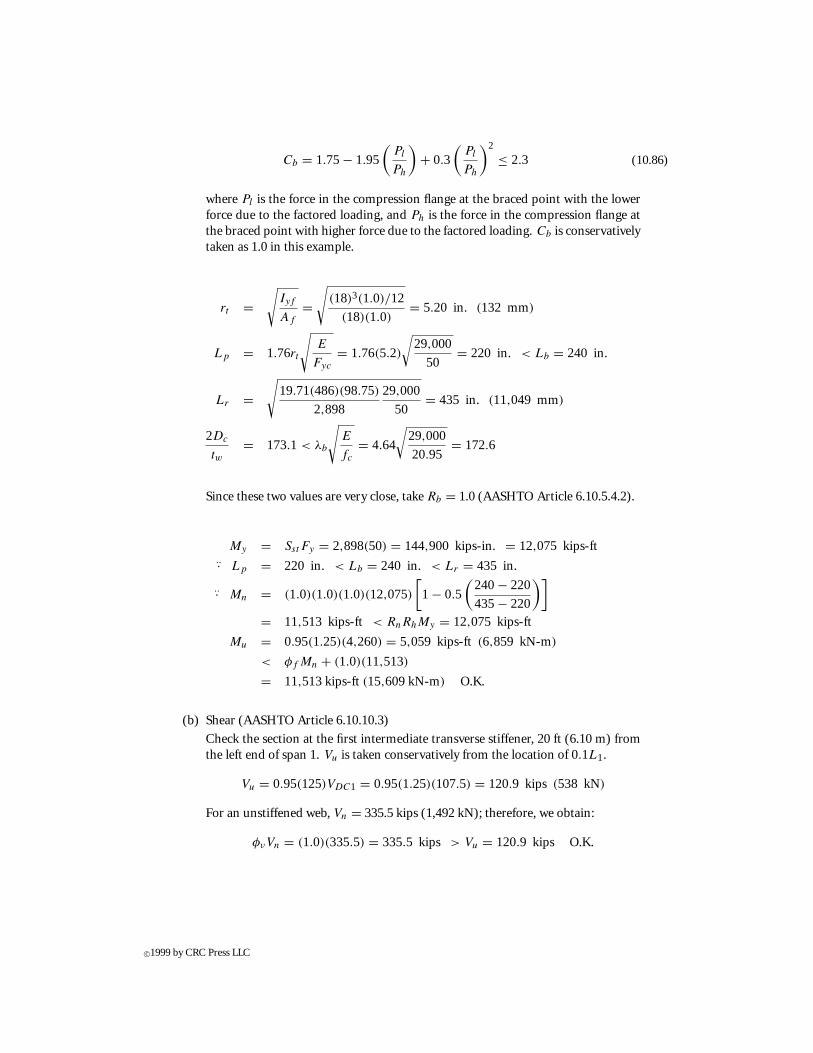
Cb = 1.75− 1.95
(Pl
Ph
)+ 0.3
(Pl
Ph
)2
≤ 2.3 (10.86)
where Pl is the force in the compression flange at the braced point with the lowerforce due to the factored loading, and Ph is the force in the compression flange atthe braced point with higher force due to the factored loading. Cb is conservativelytaken as 1.0 in this example.
rt =√
Iyf
Af
=√
(18)3(1.0)/12
(18)(1.0)= 5.20 in. (132 mm)
Lp = 1.76rt
√E
Fyc
= 1.76(5.2)
√29,000
50= 220 in. < Lb = 240 in.
Lr =√
19.71(486)(98.75)
2,898
29,000
50= 435 in. (11,049 mm)
2Dc
tw= 173.1 < λb
√E
fc
= 4.64
√29,000
20.95= 172.6
Since these two values are very close, take Rb = 1.0 (AASHTO Article 6.10.5.4.2).
My = SstFy = 2,898(50) = 144,900 kips-in. = 12,075 kips-ft... Lp = 220 in. < Lb = 240 in. < Lr = 435 in.
... Mn = (1.0)(1.0)(1.0)(12,075)
[1 − 0.5
(240− 220
435− 220
)]= 11,513 kips-ft < RnRhMy = 12,075 kips-ft
Mu = 0.95(1.25)(4,260) = 5,059 kips-ft (6,859 kN-m)
< φf Mn + (1.0)(11,513)
= 11,513kips-ft (15,609kN-m) O.K.
(b) Shear (AASHTO Article 6.10.10.3)
Check the section at the first intermediate transverse stiffener, 20 ft (6.10 m) fromthe left end of span 1. Vu is taken conservatively from the location of 0.1L1.
Vu = 0.95(125)VDC1 = 0.95(1.25)(107.5) = 120.9 kips (538 kN)
For an unstiffened web, Vn = 335.5 kips (1,492 kN); therefore, we obtain:
φνVn = (1.0)(335.5) = 335.5 kips > Vu = 120.9 kips O.K.
c©1999 by CRC Press LLC