Chapter 1: The Nature of Statistics STP 226: Elements of Statistics Jenifer Boshes Arizona State...
24
Chapter 1: Chapter 1: The Nature of The Nature of Statistics Statistics STP 226: Elements of Statistics STP 226: Elements of Statistics Jenifer Boshes Jenifer Boshes Arizona State University Arizona State University
-
date post
20-Dec-2015 -
Category
Documents
-
view
231 -
download
6
Transcript of Chapter 1: The Nature of Statistics STP 226: Elements of Statistics Jenifer Boshes Arizona State...
Chapter 1:Chapter 1:The Nature of StatisticsThe Nature of Statistics
STP 226: Elements of StatisticsSTP 226: Elements of Statistics
Jenifer BoshesJenifer Boshes
Arizona State UniversityArizona State University
1.1: Statistics Basics1.1: Statistics Basics
Descriptive StatisticsDescriptive Statistics
Descriptive statisticsDescriptive statistics consists of methods consists of methods for organizing and summarizing information.for organizing and summarizing information.
Example 1:Example 1:(a) 80% of a class receives a passing grade.
(b) The Chicago Cubs had a winning record of 97-64 for the 2008 season.
(c) The U.S. won 11.92% of the Gold Medals in the 2008 Olympics.
Population & SamplePopulation & Sample
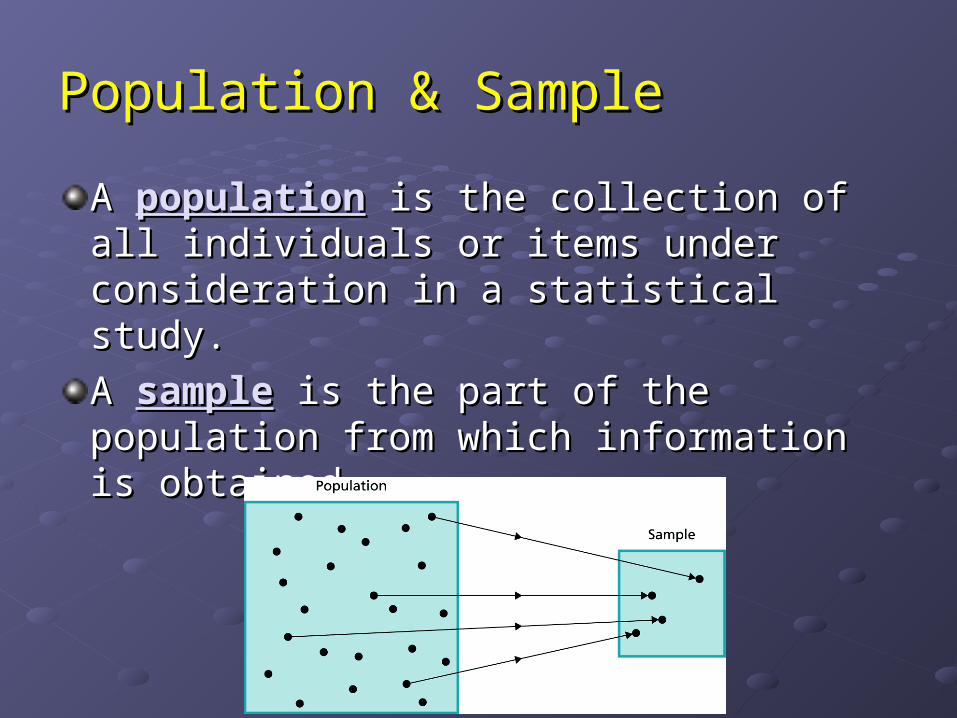
A A populationpopulation is the collection of all is the collection of all individuals or items under consideration in individuals or items under consideration in a statistical study.a statistical study.
A A samplesample is the part of the population is the part of the population from which information is obtained.from which information is obtained.
Inferential StatisticsInferential Statistics
Inferential statisticsInferential statistics consists of methods consists of methods for drawing and measuring the reliability of for drawing and measuring the reliability of conclusions about a population based on conclusions about a population based on information obtained from a sample of the information obtained from a sample of the population.population.
Example 2:Example 2:(a) Political polling.
(b) Archaeological digs.
(c) Average salary of a football player.
Descriptive vs. Inferential StatisticsDescriptive vs. Inferential Statistics
(1)(1) If the intent of the study is to examine If the intent of the study is to examine and explore the information obtained and explore the information obtained for its own intrinsic interest only, the for its own intrinsic interest only, the study is study is descriptivedescriptive..
(2)(2) If the information is obtained from a If the information is obtained from a samplesample of a population and the intent of a population and the intent of the study is to use that information of the study is to use that information to draw conclusions about the to draw conclusions about the population, the study is population, the study is inferentialinferential..

Example 3a:Example 3a:
Classify the following studies as Classify the following studies as descriptive or inferential.descriptive or inferential.
(a) (Example 1.3; Page 6) The 1948 Presidential Election -
TicketTicket VotesVotes PercentagePercentage
Truman-Barkley (Democratic)Truman-Barkley (Democratic) 24,179,34524,179,345 49.749.7
Dewey-Warren (Republican)Dewey-Warren (Republican) 21,991,29121,991,291 45.245.2
Thurmond-Wright (States Rights)Thurmond-Wright (States Rights) 1,176,1251,176,125 2.42.4
Wallace-Taylor (Progressive)Wallace-Taylor (Progressive) 1,157,3261,157,326 2.42.4
Thomas-Smith (Socialist)Thomas-Smith (Socialist) 139,572139,572 0.30.3

Example 3b:Example 3b:Classify the following studies as Classify the following studies as
descriptive or inferential.descriptive or inferential.(b) (Example 1.4; Page 7) Testing Baseballs –
Major League Baseball used Spalding baseballs until 1976. In 1977, MLB began using Rawlings baseballs (which are still in use today). In 1977, pitchers complained that the baseballs were harder, bounced farther and faster, and gave hitters an unfair advantage. An independent testing company randomly selected a sample of 85 baseballs from the 1977 supplies of various major league clubs. The bounce, weight, and hardness of the baseballs chosen was carefully measured and compared with measurements obtained from similar tests on baseballs used in 1952, 1953, 1961, 1963, 1970, 1973. The conclusion was that “… the 1977 Rawlings ball is livelier than the 1976 Spalding, but not as lively as it could be under big league rules, or as the ball has been in the past.”

Example 3c:Example 3c:
Classify the following studies as Classify the following studies as descriptive or inferential.descriptive or inferential.
(c) (Problem 1.12; Page 10) Music People Buy –
Results of monthly telephone surveys yielded the percentage estimates of all music expenditures shown in the table at the top of the next column. These statistics were published in 2001 Consumer Profile.
Music TypeMusic TypeExpenditure Expenditure (%)(%)
RockRock 24.424.4
PopPop 12.112.1
Rap/Hip hopRap/Hip hop 11.411.4
R&B/UrbanR&B/Urban 10.610.6
CountryCountry 10.510.5
ReligiousReligious 6.76.7
JazzJazz 3.43.4
ClassicalClassical 3.23.2
SoundtracksSoundtracks 1.41.4
New AgeNew Age 11
OldiesOldies 0.80.8
Children'sChildren's 0.50.5
OtherOther 7.97.9
UnknownUnknown 6.16.1

Example 3d:Example 3d:Classify the following studies as Classify the following studies as
descriptive or inferential.descriptive or inferential.
(d) (Problem 1.11; Page 10) Dow Jones Industrial Averages -
The following table provides the closing values of the Dow Jones Industrial Averages as of the end of December for the years 1997-2002.
YearYearClosing Closing ValueValue
19971997 7,908.257,908.25
19981998 9,181.439,181.43
19991999 11,497.1211,497.12
20002000 10,786.8510,786.85
20012001 10,021.5010,021.50
20022002 8,341.638,341.63

1.2: Simple Random 1.2: Simple Random SamplingSampling
Acquiring InformationAcquiring Information
A A censuscensus is obtaining information on the is obtaining information on the entire population of interest.entire population of interest.ExperimentationExperimentation is conducting a is conducting a controlled study to come to conclusions controlled study to come to conclusions about a topic.about a topic.SamplingSampling is a method of acquiring is a method of acquiring information by choosing portions of a information by choosing portions of a population in a particular way to make population in a particular way to make inferences.inferences.
Comments on SamplingComments on Sampling
A A representative samplerepresentative sample reflects as reflects as closely as possible the relevant closely as possible the relevant characteristics of the population under characteristics of the population under consideration.consideration.If you were interested in the average If you were interested in the average height of an ASU student, who would height of an ASU student, who would you include in your sample?you include in your sample?
Probability SamplingProbability Sampling
In In probability samplingprobability sampling, a random , a random device, such as tossing a coin or device, such as tossing a coin or consulting a table of random numbers, consulting a table of random numbers, is used to decide which members of the is used to decide which members of the population will constitute the sample population will constitute the sample instead of leaving such decisions to instead of leaving such decisions to human judgment. human judgment. The use of probability sampling The use of probability sampling guarantees that the techniques of guarantees that the techniques of inferential statistics can be applied.inferential statistics can be applied.

Simple Random SamplingSimple Random Sampling
Simple random samplingSimple random sampling is a is a sampling procedure for which each sampling procedure for which each possible sample of a given size is possible sample of a given size is equally likely to be the one obtained. equally likely to be the one obtained. A A simple random samplesimple random sample is a sample is a sample obtained by simple random sampling.obtained by simple random sampling.(Unless otherwise specified, assume (Unless otherwise specified, assume simple random sampling is done without simple random sampling is done without replacement.)replacement.)
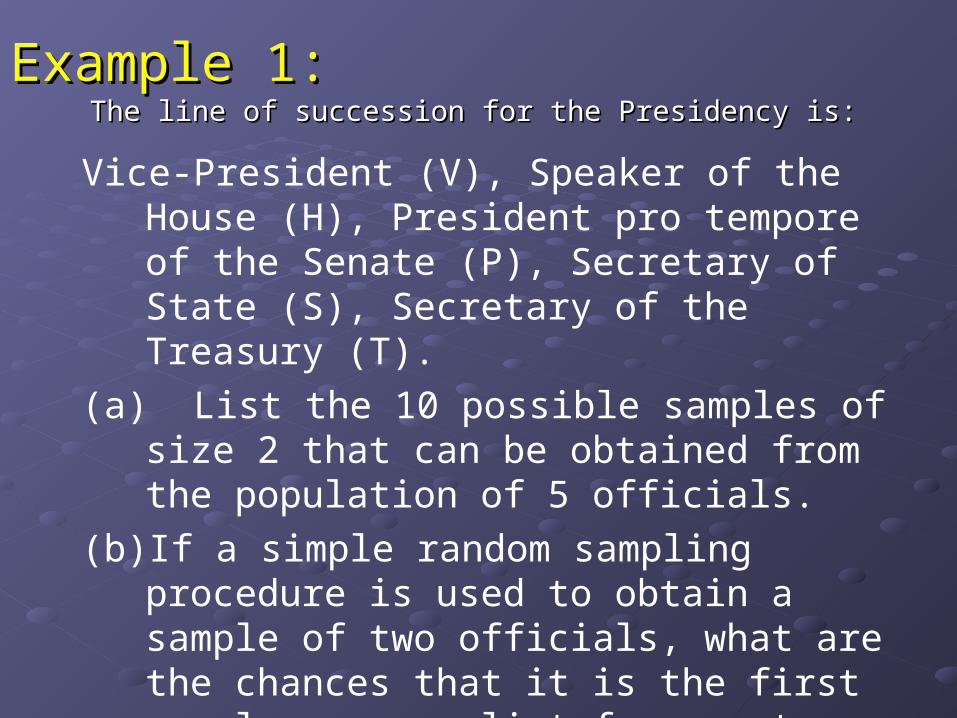
Example 1:Example 1:The line of succession for the Presidency is:The line of succession for the Presidency is:
Vice-President (V), Speaker of the House (H), President pro tempore of the Senate (P), Secretary of State (S), Secretary of the Treasury (T).
(a) List the 10 possible samples of size 2 that can be obtained from the population of 5 officials.
(b) If a simple random sampling procedure is used to obtain a sample of two officials, what are the chances that it is the first sample on your list from part (a)?
(c) What are some ways to obtain an SRS of size 2?
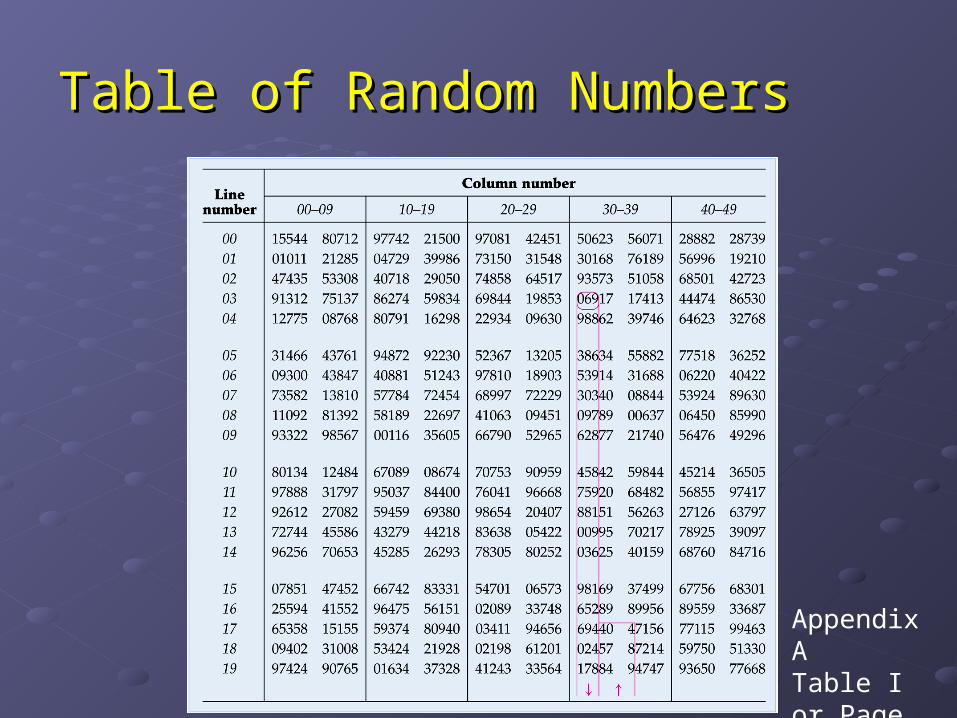
Table of Random NumbersTable of Random Numbers
Appendix ATable Ior Page 14
How to Use the How to Use the Random Number TableRandom Number Table
Number the units of interestNumber the units of interest
Randomly select a starting pointRandomly select a starting point
Read down the column using the number Read down the column using the number of digits of interest (i.e. If there are 50 units of digits of interest (i.e. If there are 50 units of interest, use 2 digits. If there are 451 of interest, use 2 digits. If there are 451 units of interest, use 3 digits.)units of interest, use 3 digits.)
Record numbers, discarding repeats and Record numbers, discarding repeats and numbers outside the list of units.numbers outside the list of units.
Example 2:Example 2:
Use the table of random numbers to Use the table of random numbers to select eight years between 1950-1999 select eight years between 1950-1999 to study for your sample. Let the two to study for your sample. Let the two digit random number you select be the digit random number you select be the year. For example, if you selected ‘62’, year. For example, if you selected ‘62’, study the year 1962. Begin with the study the year 1962. Begin with the digits 79 in row/line 11, columns 07-08 digits 79 in row/line 11, columns 07-08 of the random number table.of the random number table.
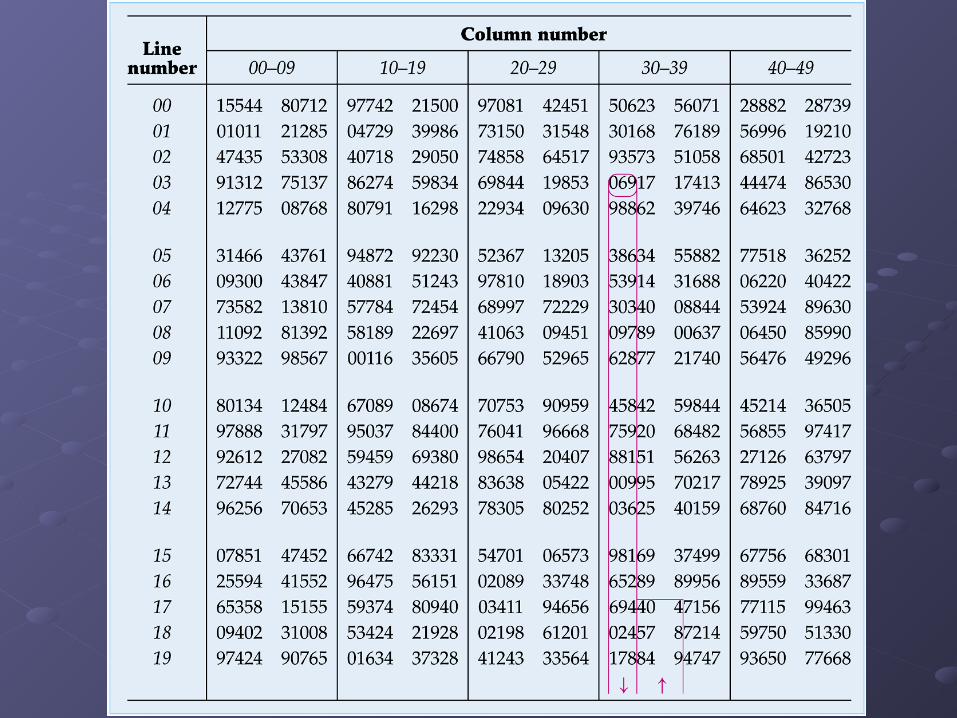
Example 3:Example 3:
(Problem 1.28; Page 16) In the game of (Problem 1.28; Page 16) In the game of keno, 20 balls are selected at random keno, 20 balls are selected at random from 80 balls, numbered 1-80. Use from 80 balls, numbered 1-80. Use Table I in Appendix A to simulate one Table I in Appendix A to simulate one game of keno by obtaining 20 random game of keno by obtaining 20 random numbers between 1 and 80. Begin with numbers between 1 and 80. Begin with the digits 99 in row/line 07, columns 22-the digits 99 in row/line 07, columns 22-23 of the random number table.23 of the random number table.
BibliographyBibliography
Some of the textbook images embedded in Some of the textbook images embedded in the slides were taken from:the slides were taken from:
Elementary StatisticsElementary Statistics, Sixth Edition; by , Sixth Edition; by Weiss; Addison Wesley Publishing Weiss; Addison Wesley Publishing Company Company
Copyright © 2005, Pearson Education, Inc.Copyright © 2005, Pearson Education, Inc.