Chapter 1 The legacy of the crisis: resilience and challenges
62
43 Chapter 1 The legacy of the crisis: resilience and challenges ( 1 ) 1. Introduction The most severe financial and economic cri- sis to have hit Europe since the 1930s has had a major impact on the employment and social situation across the Union. Unemploy- ment, poverty and inequality have seriously worsened in many countries and a return to pre-crisis levels is not foreseen before some time. Individuals and households have been obliged to develop coping strategies in the face of the deteriorating economic situa- tion and with the prospect of only a slow and uncertain recovery. All of this is liable to have negative long-term effects on labour market participation and to lead to a per- manent loss of human capital. Meanwhile, rising level of inequalities and the ability of institutions to deal with the crisis also impacted the trust in institutions. The recession has also been a live stress- test for both social protections and labour market systems and institutions, with Mem- ber States’ performances diverging in terms of economic as well as of employment and social outcomes. They have shown differ- ent degrees of resilience i.e. their capacity to limit the initial impact of the economic shock on labour markets and incomes; to recover quickly; and to progressively ensure a job-rich and inclusive growth. This chapter focuses on the potential con- tribution of employment and social policies to resilience, paying particular attention to the effects of imbalances (such as high levels of unemployment and inequalities, ( 1 ) By Laurent Aujean, Virginia Maestri, Filip Tanay and Céline Thévenot. under-investment in education, levels of household debt, etc.) as well as their dif- fering mixes of social and labour market policies both prior to, and during, the crisis. • Section 2 of the chapter reviews how labour markets and social outcomes have developed since the onset of the recession, in particular with severe impacts for some groups and coun- tries and changes in participation to education and the labour market. • Section 3 highlights the possible long-term consequences of unem- ployment and economic hardship including potential scarring effects on unemployed young people, ‘cop- ing strategies’ during the crisis and the weakening trust in institutions. • Section 4 analyses the developments of social spending in terms of its three main functions: investment, stabilisation and protection and their link to labour market outcomes as well as the poten- tial role of better synchronising benefits to the economic cycle for the resilience of Member States and the role of the financing of social protection. • Section 5 investigates the impact of labour market institutions such as unemployment benefits, employment protection legislation and active labour market policies during the recession as well as policy changes since 2008. • The concluding section summarises both the findings and the main pol- icy implications. 2. The legacy of the crisis on the employment and social situation 2.1. Long and protracted recession Various impacts of the economic downturn on employment and incomes Since 2008, the EU has experienced a recession of exceptional magnitude and duration from which it has been slow to emerge, with real GDP in 2014 exceeding pre-recession levels by only around 1 % in the EU and with euro area GDP still below its 2007 level. This contrasts with the United States where real GDP is now 8 % higher than it was in 2007. Moreover, within the EU, there is a growing gap between the countries that experienced a double dip recession in 2012 and the others. Five years into the recession, real GDP remains substantially below (5 % or more) pre-crisis levels in many countries including Italy, Spain, Por- tugal, Greece, Slovenia and Finland. This is especially worrying, given the long-term effects of the comparatively milder reces- sion of the 1990s ( 2 ) when employment rates declined and took several years to recover, notably in the Nordic countries ( 3 ). ( 2 ) In the 1990s, most EU countries experienced only one year of negative growth and after five years real GDP had increased by 5 to 15 %, with the exception of Sweden and Finland which experienced long and deep recessions. ( 3 ) Social situation monitor, Scarring effects of the crisis, Research note 06/2014.
Transcript of Chapter 1 The legacy of the crisis: resilience and challenges
43
Chapter 1
The legacy of the crisis: resilience and challenges (1)
1. Introduction
The most severe financial and economic cri-sis to have hit Europe since the 1930s has had a major impact on the employment and social situation across the Union. Unemploy-ment, poverty and inequality have seriously worsened in many countries and a return to pre-crisis levels is not foreseen before some time. Individuals and households have been obliged to develop coping strategies in the face of the deteriorating economic situa-tion and with the prospect of only a slow and uncertain recovery. All of this is liable to have negative long-term effects on labour market participation and to lead to a per-manent loss of human capital. Meanwhile, rising level of inequalities and the ability of institutions to deal with the crisis also impacted the trust in institutions.
The recession has also been a live stress-test for both social protections and labour market systems and institutions, with Mem-ber States’ performances diverging in terms of economic as well as of employment and social outcomes. They have shown differ-ent degrees of resilience i.e. their capacity to limit the initial impact of the economic shock on labour markets and incomes; to recover quickly; and to progressively ensure a job-rich and inclusive growth.
This chapter focuses on the potential con-tribution of employment and social policies to resilience, paying particular attention to the effects of imbalances (such as high levels of unemployment and inequalities,
(1) By Laurent Aujean, Virginia Maestri, Filip Tanay and Céline Thévenot.
under-investment in education, levels of household debt, etc.) as well as their dif-fering mixes of social and labour market policies both prior to, and during, the crisis.
• Section 2 of the chapter reviews how labour markets and social outcomes have developed since the onset of the recession, in particular with severe impacts for some groups and coun-tries and changes in participation to education and the labour market.
• Section 3 highlights the possible long-term consequences of unem-ployment and economic hardship including potential scarring effects on unemployed young people, ‘cop-ing strategies’ during the crisis and the weakening trust in institutions.
• Section 4 analyses the developments of social spending in terms of its three main functions: investment, stabilisation and protection and their link to labour market outcomes as well as the poten-tial role of better synchronising benefits to the economic cycle for the resilience of Member States and the role of the financing of social protection.
• Section 5 investigates the impact of labour market institutions such as unemployment benefits, employment protection legislation and active labour market policies during the recession as well as policy changes since 2008.
• The concluding section summarises both the findings and the main pol-icy implications.
2. The legacy of the crisis on the employment and social situation
2.1. Long and protracted recession
Various impacts of the economic downturn on employment and incomes
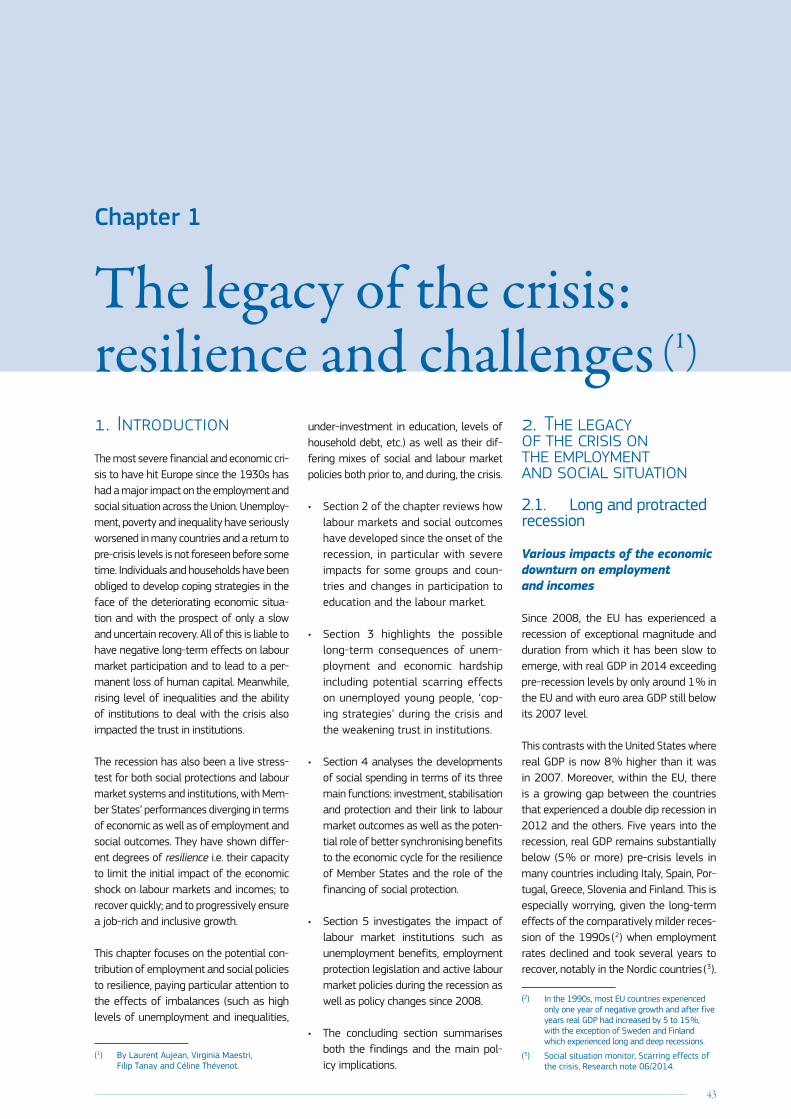
Since 2008, the EU has experienced a recession of exceptional magnitude and duration from which it has been slow to emerge, with real GDP in 2014 exceeding pre-recession levels by only around 1 % in the EU and with euro area GDP still below its 2007 level.
This contrasts with the United States where real GDP is now 8 % higher than it was in 2007. Moreover, within the EU, there is a growing gap between the countries that experienced a double dip recession in 2012 and the others. Five years into the recession, real GDP remains substantially below (5 % or more) pre-crisis levels in many countries including Italy, Spain, Por-tugal, Greece, Slovenia and Finland. This is especially worrying, given the long-term effects of the comparatively milder reces-sion of the 1990s ( 2) when employment rates declined and took several years to recover, notably in the Nordic countries ( 3).
(2) In the 1990s, most EU countries experienced only one year of negative growth and after five years real GDP had increased by 5 to 15 %, with the exception of Sweden and Finland which experienced long and deep recessions.
(3) Social situation monitor, Scarring effects of the crisis, Research note 06/2014.
44
Employment and Social Developments in Europe 2014
Chart 1: Real GDP in the EU, euro area and United States (left), and percentage changes over the previous quarter (right)
80
85
90
95
100
105
110
Q1Q4Q3Q2Q1Q4Q3Q2Q1Q4Q3Q2Q1Q4Q3Q2Q1Q4Q3Q2Q1Q4Q3Q2Q1Q4Q3Q2Q1-4
-3
-2
-1
0
1
2
3
4
5
6
EU-28 EU-28USUS
Index 2007=100
2007 2008 2009 2010 2011 2012 2013 2014
Source: Eurostat, National Accounts, data seasonally adjusted [namq_gdp_k].
In the first phase of the crisis (2008–10) the fall in employment in most EU Mem-ber States was significantly less than the decline in economic activity especially when compared with the United States ( 4).
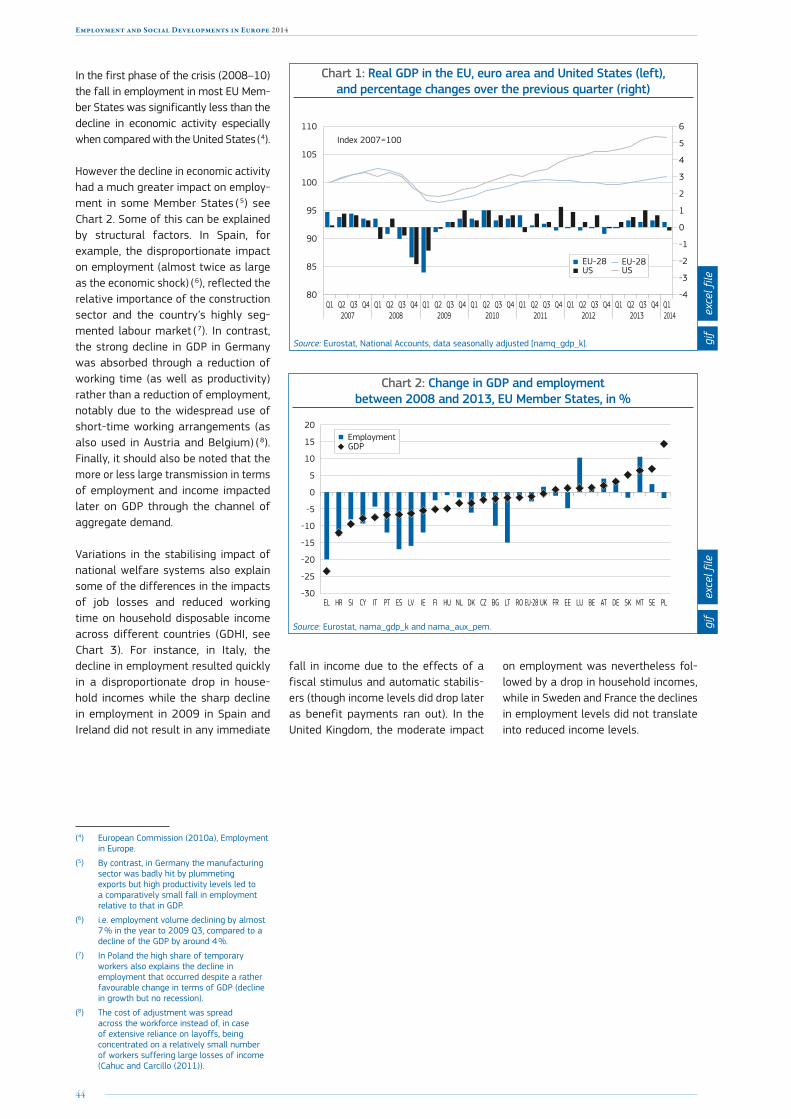
However the decline in economic activity had a much greater impact on employ-ment in some Member States ( 5) see Chart 2. Some of this can be explained by structural factors. In Spain, for example, the disproportionate impact on employment (almost twice as large as the economic shock) ( 6), reflected the relative importance of the construction sector and the country’s highly seg-mented labour market ( 7). In contrast, the strong decline in GDP in Germany was absorbed through a reduction of working time (as well as productivity) rather than a reduction of employment, notably due to the widespread use of short-time working arrangements (as also used in Austria and Belgium) ( 8). Finally, it should also be noted that the more or less large transmission in terms of employment and income impacted later on GDP through the channel of aggregate demand.
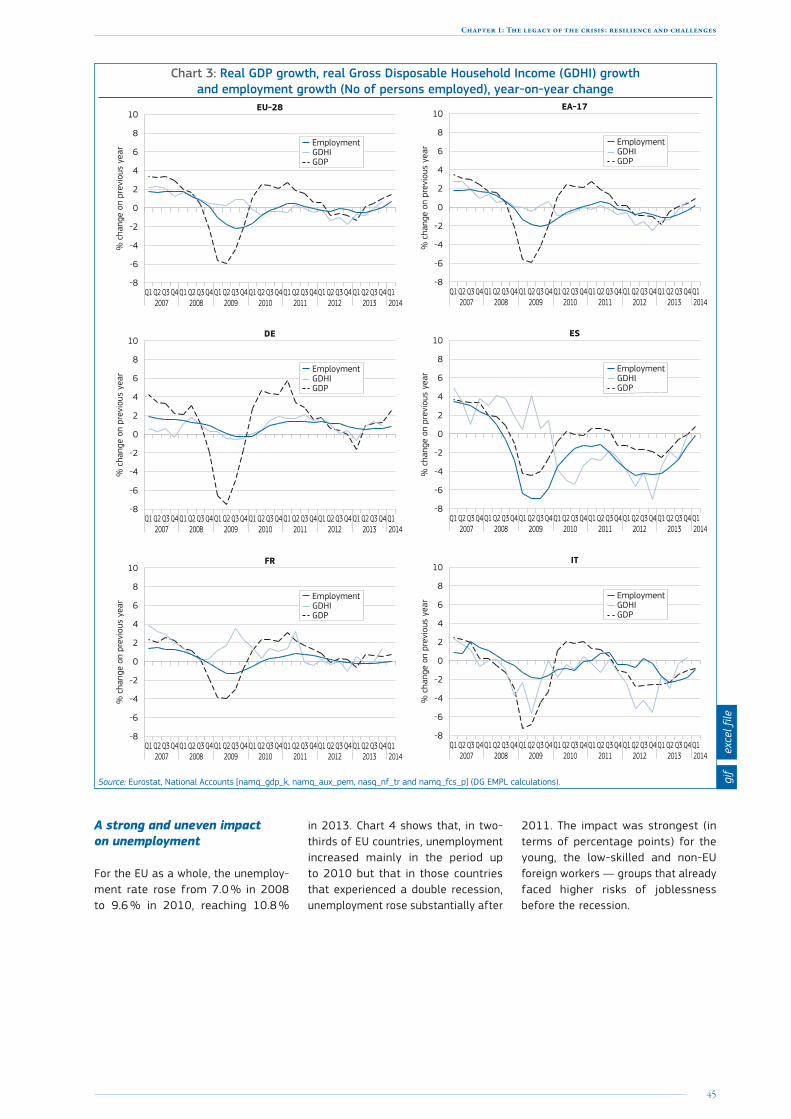
Variations in the stabilising impact of national welfare systems also explain some of the differences in the impacts of job losses and reduced working time on household disposable income across different countries (GDHI, see Chart 3). For instance, in Italy, the decline in employment resulted quickly in a disproportionate drop in house-hold incomes while the sharp decline in employment in 2009 in Spain and Ireland did not result in any immediate
(4) European Commission (2010a), Employment in Europe.
(5) By contrast, in Germany the manufacturing sector was badly hit by plummeting exports but high productivity levels led to a comparatively small fall in employment relative to that in GDP.
(6) i.e. employment volume declining by almost 7 % in the year to 2009 Q3, compared to a decline of the GDP by around 4 %.
(7) In Poland the high share of temporary workers also explains the decline in employment that occurred despite a rather favourable change in terms of GDP (decline in growth but no recession).
(8) The cost of adjustment was spread across the workforce instead of, in case of extensive reliance on layoffs, being concentrated on a relatively small number of workers suffering large losses of income (Cahuc and Carcillo (2011)).
fall in income due to the effects of a fiscal stimulus and automatic stabilis-ers (though income levels did drop later as benefit payments ran out). In the United Kingdom, the moderate impact
on employment was nevertheless fol-lowed by a drop in household incomes, while in Sweden and France the declines in employment levels did not translate into reduced income levels.
Chart 2: Change in GDP and employment between 2008 and 2013, EU Member States, in %
-30
-25
-20
-15
-10
-5
0
5
10
15
20
PLSEMTSKDEATBELUEEFRUKEU-28ROLTBGCZDKNLHUFIIELVESPTITCYSIHREL
EmploymentGDP
Source: Eurostat, nama_gdp_k and nama_aux_pem.
exce
l file
exce
l file
gif
gif
45
Chapter 1: The legacy of the crisis: resilience and challenges
Chart 3: Real GDP growth, real Gross Disposable Household Income (GDHI) growth and employment growth (No of persons employed), year-on-year change
-8
-6
-4
-2
0
2
4
6
8
10
Q1Q4Q3Q2Q1Q4Q3Q2Q1Q4Q3Q2Q1Q4Q3Q2Q1Q4Q3Q2Q1Q4Q3Q2Q1Q4Q3Q2Q1
EU-28
2007 2008 2009 2010 2011 2012 2013 2014
% c
hang
e on
pre
viou
s ye
ar GDHIGDP
Employment
-8
-6
-4
-2
0
2
4
6
8
10
Q1Q4Q3Q2Q1Q4Q3Q2Q1Q4Q3Q2Q1Q4Q3Q2Q1Q4Q3Q2Q1Q4Q3Q2Q1Q4Q3Q2Q1
EA-17
2007 2008 2009 2010 2011 2012 2013 2014
% c
hang
e on
pre
viou
s ye
ar GDHIGDP
Employment
-8
-6
-4
-2
0
2
4
6
8
10
Q1Q4Q3Q2Q1Q4Q3Q2Q1Q4Q3Q2Q1Q4Q3Q2Q1Q4Q3Q2Q1Q4Q3Q2Q1Q4Q3Q2Q1
DE
2007 2008 2009 2010 2011 2012 2013 2014
% c
hang
e on
pre
viou
s ye
ar GDHIGDP
Employment
-8
-6
-4
-2
0
2
4
6
8
10
Q1Q4Q3Q2Q1Q4Q3Q2Q1Q4Q3Q2Q1Q4Q3Q2Q1Q4Q3Q2Q1Q4Q3Q2Q1Q4Q3Q2Q1
ES
2007 2008 2009 2010 2011 2012 2013 2014
% c
hang
e on
pre
viou
s ye
ar GDHIGDP
Employment
-8
-6
-4
-2
0
2
4
6
8
10
Q1Q4Q3Q2Q1Q4Q3Q2Q1Q4Q3Q2Q1Q4Q3Q2Q1Q4Q3Q2Q1Q4Q3Q2Q1Q4Q3Q2Q1
FR
2007 2008 2009 2010 2011 2012 2013 2014
% c
hang
e on
pre
viou
s ye
ar GDHIGDP
Employment
-8
-6
-4
-2
0
2
4
6
8
10
Q1Q4Q3Q2Q1Q4Q3Q2Q1Q4Q3Q2Q1Q4Q3Q2Q1Q4Q3Q2Q1Q4Q3Q2Q1Q4Q3Q2Q1
GDHIGDP
Employment
IT
2007 2008 2009 2010 2011 2012 2013 2014
% c
hang
e on
pre
viou
s ye
ar
Source: Eurostat, National Accounts [namq_gdp_k, namq_aux_pem, nasq_nf_tr and namq_fcs_p] (DG EMPL calculations).
A strong and uneven impact on unemployment
For the EU as a whole, the unemploy-ment rate rose from 7.0 % in 2008 to 9.6 % in 2010, reaching 10.8 %
in 2013. Chart 4 shows that, in two-thirds of EU countries, unemployment increased mainly in the period up to 2010 but that in those countries that experienced a double recession, unemployment rose substantially after
2011. The impact was strongest (in terms of percentage points) for the young, the low-skilled and non-EU foreign workers — groups that already faced higher risks of joblessness before the recession.
exce
l file
gif

46
Employment and Social Developments in Europe 2014
Chart 4: Unemployment rates by EU Member States, 2008, 2010 and 2013 (% of active population, 15–74)
0
5
10
15
20
25
30
ELCYESHRPTITSIBGNLEU-28LUFRPLATBEROFIUKCZSKMTDKSEIEHUDELTLVEE
201320102008
Source: Eurostat, une_rt_a.
The persistence of unemployment (likelihood to remain unemployed after one year) has increased during the crisis with 38 % of people who became unemployed in 2012 still look-ing for a job in 2013, compared to 27 % between 2007/08 ( 9). This per-sistence rate was much higher for the long-term unemployed (63 % between 2012/13, compared to 50 % between 2007/08) confirming previous research findings ( 10).
(9) Persistence rate estimated as the ratio between the number of unemployed with a duration of 12–24 months and those unemployed for fewer than 12 months one year before.
(10) Individual characteristics also matter: those who become long-term unemployed are likely to be those for whom finding a job was initially the most difficult. Cockx and Dejemeppe (2012) shows for various European countries that the duration dependence may be a spurious one.
Chart 5: Exit rate from short-term unemployment (less than one year) into employment between 2012/13 and changes compared to between 2009/10
0
10
20
30
40
50
60
70
ELROHRSKESITPLBGIELTMTHULVCYFRCZNLDKFISESIDEUKEEAT
2009-10 2012-132007-08
Decreased from high level Increased from low level Decreased from low levelMaintained or increased
from high levels
Source: Eurostat, EU-LFS, ad-hoc transition calculations based on longitudinal data. No data for BE, LU and PT. Exceptions to the reference year: NL: 2011/12 instead of 2012/13; AT, HR, PL, SI and UK: 2010/11 instead of 2009/10; DE and LT: 2008/09 instead of 2007/08. Member States with high (low) levels in 2009/10 are those having an exit rate higher (lower) than 39 %. Member States with decreasing (maintaining/increasing) levels are those where the exit rate decreased by more (less) than 1.5 pp between 2009/10 and 2012/13.
While exit rates from short-term unem-ployment into employment ( 11) worsened in almost all Member States between 2007/08 and 2009/10, there have been divergent developments since then. In some countries, the chances to return to employment improved again between 2010 and 2013, while they worsened fur-ther in others. Labour demand is a key factor explaining differences in the exit rates out of short-term unemployment ( 12) although other factors are at play ( 13) such as differences in labour market institu-tions between Member States, see Euro-pean Commission (2012a) and Section 5.
(11) Based on longitudinal data from the EU-LFS.
(12) For instance, for the 22 Member States for which the data is available, there is a positive correlation (+0.59, significant at 1 %) between the exit rate from short-term unemployment (into employment) in 2012-13 and the job vacancy rate in 2012.
(13) Recently (2010–13), changes in employment appear less correlated with the variations of the exit rates out of short-term unemployment into employment than in the initial phase of the recession (2008–10), i.e. equal to 0.70 and 0.92 respectively (both significant at 1 %).
In 2013, the number of long-term unem-ployed (without work for 12 months or longer) exceeded 5 % of the active popu-lation in 2013, almost double the rate of 2008 ( 14) (see Chart 7). Given the slow pace of economic recovery in most coun-tries, there is thus a serious risk that many long-term unemployed will remain with-out a job for a long time. Indeed, transition rates for the long-term unemployed into employment worsened between 2007/08 and 2009/10 in most Member States, and have stayed low since.
(14) In absolute terms, the number of long-term unemployed in the EU-28 increased from 6.2 million in 2008 to 12.3 million in 2013.
exce
l file
gif
exce
l file
gif
47
Chapter 1: The legacy of the crisis: resilience and challenges
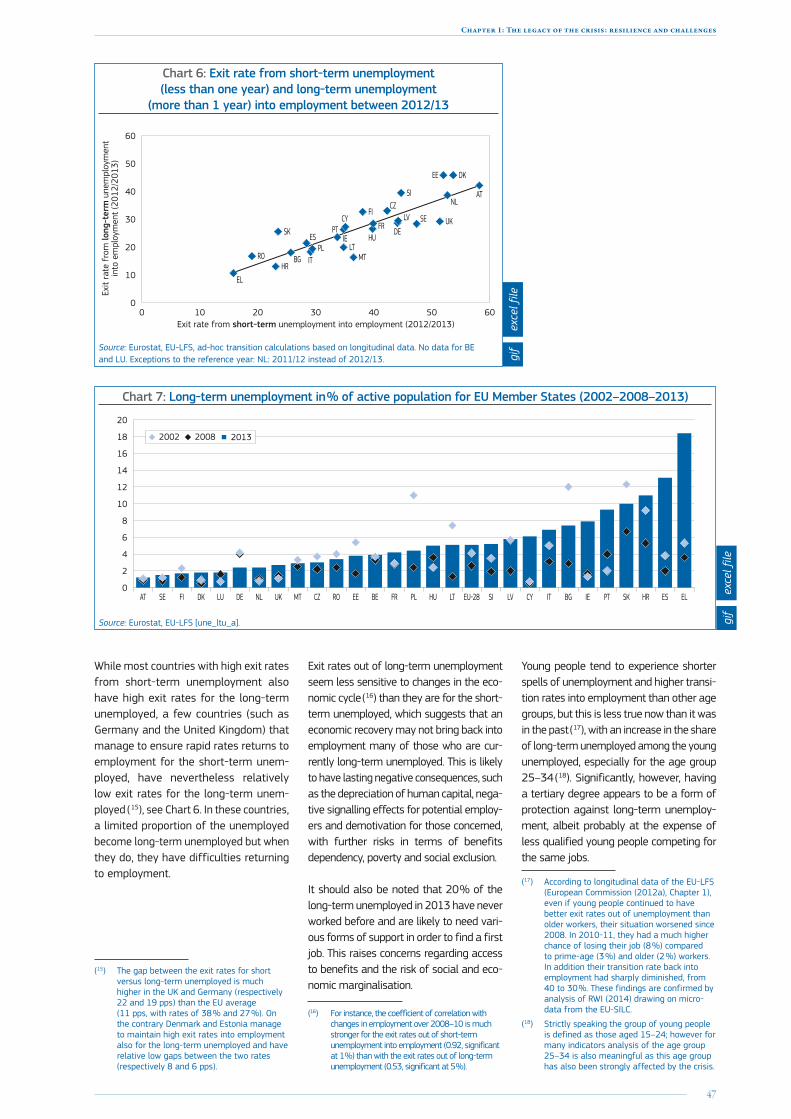
While most countries with high exit rates from short-term unemployment also have high exit rates for the long-term unemployed, a few countries (such as Germany and the United Kingdom) that manage to ensure rapid rates returns to employment for the short-term unem-ployed, have nevertheless relatively low exit rates for the long-term unem-ployed ( 15), see Chart 6. In these countries, a limited proportion of the unemployed become long-term unemployed but when they do, they have difficulties returning to employment.
(15) The gap between the exit rates for short versus long-term unemployed is much higher in the UK and Germany (respectively 22 and 19 pps) than the EU average (11 pps, with rates of 38 % and 27 %). On the contrary Denmark and Estonia manage to maintain high exit rates into employment also for the long-term unemployed and have relative low gaps between the two rates (respectively 8 and 6 pps).
Chart 6: Exit rate from short-term unemployment (less than one year) and long-term unemployment
(more than 1 year) into employment between 2012/13Ex
it ra
te f
rom
long
-ter
m u
nem
ploy
men
tin
to e
mpl
oym
ent
(201
2/20
13)
Exit rate from short-term unemployment into employment (2012/2013)0 10 20 30 40 50 60
0
10
20
30
40
50
60
UK
MT
DE
AT
SE
LT
LV
NL
HUFR
IT
IE
HR
PL
CZ
PT
DK
CY
BG
ES
EE
FI
SI
EL
RO
SK
Source: Eurostat, EU-LFS, ad-hoc transition calculations based on longitudinal data. No data for BE and LU. Exceptions to the reference year: NL: 2011/12 instead of 2012/13.
Exit rates out of long-term unemployment seem less sensitive to changes in the eco-nomic cycle ( 16) than they are for the short-term unemployed, which suggests that an economic recovery may not bring back into employment many of those who are cur-rently long-term unemployed. This is likely to have lasting negative consequences, such as the depreciation of human capital, nega-tive signalling effects for potential employ-ers and demotivation for those concerned, with further risks in terms of benefits dependency, poverty and social exclusion.
It should also be noted that 20 % of the long-term unemployed in 2013 have never worked before and are likely to need vari-ous forms of support in order to find a first job. This raises concerns regarding access to benefits and the risk of social and eco-nomic marginalisation.
(16) For instance, the coefficient of correlation with changes in employment over 2008–10 is much stronger for the exit rates out of short-term unemployment into employment (0.92, significant at 1 %) than with the exit rates out of long-term unemployment (0.53, significant at 5 %).
Chart 7: Long-term unemployment in % of active population for EU Member States (2002–2008–2013)
0
2
4
6
8
10
12
14
16
18
20
ELESHRSKPTIEBGITCYLVSIEU-28LTHUPLFRBEEEROCZMTUKNLDELUDKFISEAT
20132002 2008
Source: Eurostat, EU-LFS [une_ltu_a].
Young people tend to experience shorter spells of unemployment and higher transi-tion rates into employment than other age groups, but this is less true now than it was in the past ( 17), with an increase in the share of long-term unemployed among the young unemployed, especially for the age group 25–34 ( 18). Significantly, however, having a tertiary degree appears to be a form of protection against long-term unemploy-ment, albeit probably at the expense of less qualified young people competing for the same jobs.
(17) According to longitudinal data of the EU-LFS (European Commission (2012a), Chapter 1), even if young people continued to have better exit rates out of unemployment than older workers, their situation worsened since 2008. In 2010-11, they had a much higher chance of losing their job (8 %) compared to prime-age (3 %) and older (2 %) workers. In addition their transition rate back into employment had sharply diminished, from 40 to 30 %. These findings are confirmed by analysis of RWI (2014) drawing on micro-data from the EU-SILC.
(18) Strictly speaking the group of young people is defined as those aged 15–24; however for many indicators analysis of the age group 25–34 is also meaningful as this age group has also been strongly affected by the crisis.
exce
l file
gif
exce
l file
gif
48
Employment and Social Developments in Europe 2014
Chart 8: Youth unemployment in % of active population (aged 15–24)
0
10
20
30
40
50
60
70
ELESHRITCYPTSKBGPLHUIEFRBEROSEEU-28LVLTSIUKFICZEELUMTDKNLATDE
20132008
Source: Eurostat, EU-LFS [lfsa_urgan].
Chart 9: Temporary employment as percentage of the total number of employees
20132007
0
5
10
15
20
25
30
35
ESPLPTSINLSEFIFRDEEU-28CYITHRELDKATBECZIEHULUUKBGSKMTLVLTEERO
Source: Eurostat, EU-LFS [lfsa_etpgan].
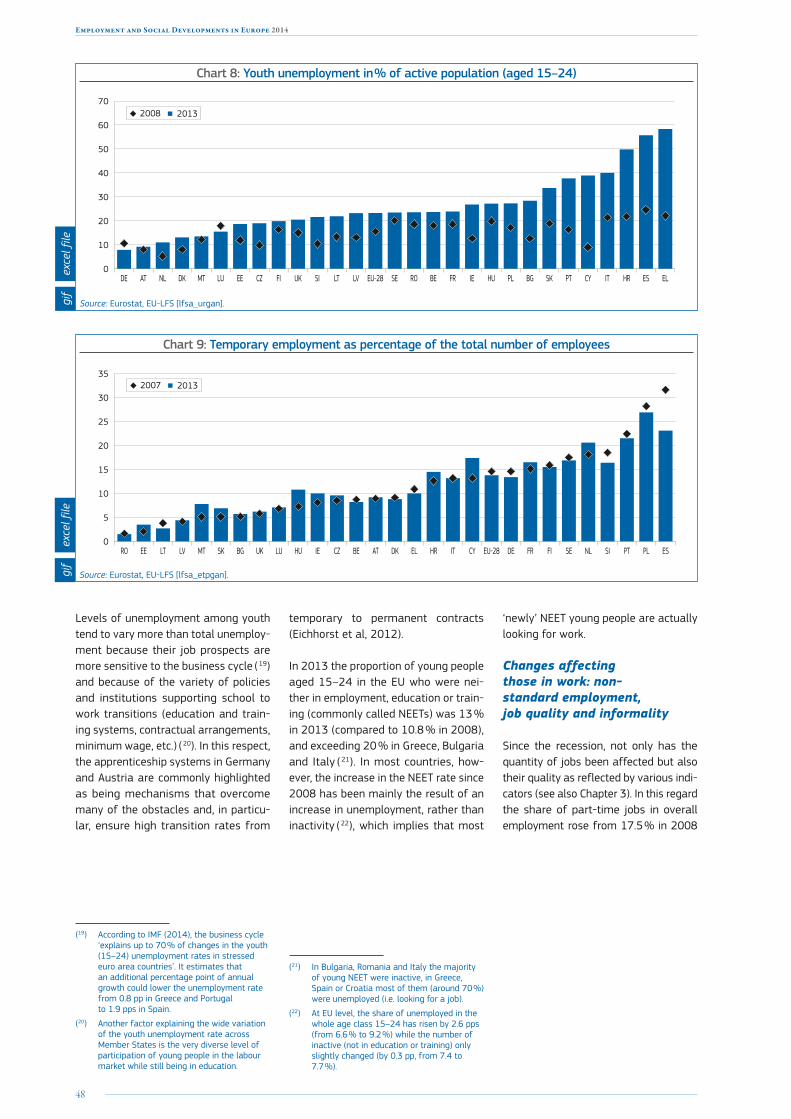
Levels of unemployment among youth tend to vary more than total unemploy-ment because their job prospects are more sensitive to the business cycle ( 19) and because of the variety of policies and institutions supporting school to work transitions (education and train-ing systems, contractual arrangements, minimum wage, etc.) ( 20). In this respect, the apprenticeship systems in Germany and Austria are commonly highlighted as being mechanisms that overcome many of the obstacles and, in particu-lar, ensure high transition rates from
(19) According to IMF (2014), the business cycle ‘explains up to 70 % of changes in the youth (15–24) unemployment rates in stressed euro area countries’. It estimates that an additional percentage point of annual growth could lower the unemployment rate from 0.8 pp in Greece and Portugal to 1.9 pps in Spain.
(20) Another factor explaining the wide variation of the youth unemployment rate across Member States is the very diverse level of participation of young people in the labour market while still being in education.
temporary to permanent contracts (Eichhorst et al, 2012).
In 2013 the proportion of young people aged 15–24 in the EU who were nei-ther in employment, education or train-ing (commonly called NEETs) was 13 % in 2013 (compared to 10.8 % in 2008), and exceeding 20 % in Greece, Bulgaria and Italy ( 21). In most countries, how-ever, the increase in the NEET rate since 2008 has been mainly the result of an increase in unemployment, rather than inactivity ( 22), which implies that most
(21) In Bulgaria, Romania and Italy the majority of young NEET were inactive, in Greece, Spain or Croatia most of them (around 70 %) were unemployed (i.e. looking for a job).
(22) At EU level, the share of unemployed in the whole age class 15–24 has risen by 2.6 pps (from 6.6 % to 9.2 %) while the number of inactive (not in education or training) only slightly changed (by 0.3 pp, from 7.4 to 7.7 %).
‘newly’ NEET young people are actually looking for work.
Changes affecting those in work: non-standard employment, job quality and informality
Since the recession, not only has the quantity of jobs been affected but also their quality as reflected by various indi-cators (see also Chapter 3). In this regard the share of part-time jobs in overall employment rose from 17.5 % in 2008
exce
l file
gif
exce
l file
gif
49
Chapter 1: The legacy of the crisis: resilience and challenges
to 19.5 % in 2013, with an increase in the number of part-time jobs at a time when the number of full-time positions was falling ( 23). Moreover, there has been a sharp increase in the number of men working part-time. The rise in the share of part-time jobs also partly reflected a sectoral composition effect ( 24). At EU level, the share of involuntary part-time workers (those who work part-time because they are unable to find full-time work) has increased strongly between 2007 (22.4 %) and 2013 (29.6 %).
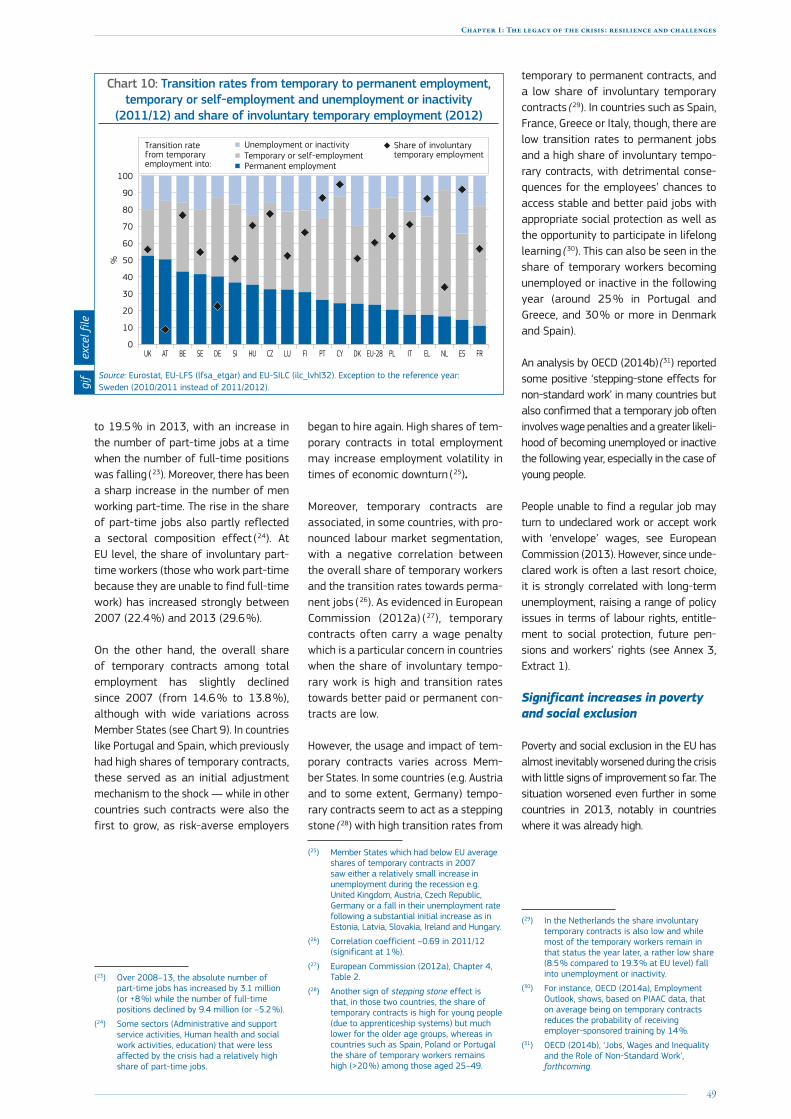
On the other hand, the overall share of temporary contracts among total employment has slightly declined since 2007 (from 14.6 % to 13.8 %), although with wide variations across Member States (see Chart 9). In countries like Portugal and Spain, which previously had high shares of temporary contracts, these served as an initial adjustment mechanism to the shock — while in other countries such contracts were also the first to grow, as risk-averse employers
(23) Over 2008–13, the absolute number of part-time jobs has increased by 3.1 million (or +8 %) while the number of full-time positions declined by 9.4 million (or –5.2 %).
(24) Some sectors (Administrative and support service activities, Human health and social work activities, education) that were less affected by the crisis had a relatively high share of part-time jobs.
began to hire again. High shares of tem-porary contracts in total employment may increase employment volatility in times of economic downturn ( 25).
Moreover, temporary contracts are associated, in some countries, with pro-nounced labour market segmentation, with a negative correlation between the overall share of temporary workers and the transition rates towards perma-nent jobs ( 26). As evidenced in European Commission (2012a) ( 27), temporary contracts often carry a wage penalty which is a particular concern in countries when the share of involuntary tempo-rary work is high and transition rates towards better paid or permanent con-tracts are low.
However, the usage and impact of tem-porary contracts varies across Mem-ber States. In some countries (e.g. Austria and to some extent, Germany) tempo-rary contracts seem to act as a stepping stone ( 28) with high transition rates from
(25) Member States which had below EU average shares of temporary contracts in 2007 saw either a relatively small increase in unemployment during the recession e.g. United Kingdom, Austria, Czech Republic, Germany or a fall in their unemployment rate following a substantial initial increase as in Estonia, Latvia, Slovakia, Ireland and Hungary.
(26) Correlation coefficient –0.69 in 2011/12 (significant at 1 %).
(27) European Commission (2012a), Chapter 4, Table 2.
(28) Another sign of stepping stone effect is that, in those two countries, the share of temporary contracts is high for young people (due to apprenticeship systems) but much lower for the older age groups, whereas in countries such as Spain, Poland or Portugal the share of temporary workers remains high (>20 %) among those aged 25–49.
temporary to permanent contracts, and a low share of involuntary temporary contracts ( 29). In countries such as Spain, France, Greece or Italy, though, there are low transition rates to permanent jobs and a high share of involuntary tempo-rary contracts, with detrimental conse-quences for the employees’ chances to access stable and better paid jobs with appropriate social protection as well as the opportunity to participate in lifelong learning ( 30). This can also be seen in the share of temporary workers becoming unemployed or inactive in the following year (around 25 % in Portugal and Greece, and 30 % or more in Denmark and Spain).
An analysis by OECD (2014b) ( 31) reported some positive ‘stepping-stone effects for non-standard work’ in many countries but also confirmed that a temporary job often involves wage penalties and a greater likeli-hood of becoming unemployed or inactive the following year, especially in the case of young people.
People unable to find a regular job may turn to undeclared work or accept work with ‘envelope’ wages, see European Commission (2013). However, since unde-clared work is often a last resort choice, it is strongly correlated with long-term unemployment, raising a range of policy issues in terms of labour rights, entitle-ment to social protection, future pen-sions and workers’ rights (see Annex 3, Extract 1).
Significant increases in poverty and social exclusion
Poverty and social exclusion in the EU has almost inevitably worsened during the crisis with little signs of improvement so far. The situation worsened even further in some countries in 2013, notably in countries where it was already high.
(29) In the Netherlands the share involuntary temporary contracts is also low and while most of the temporary workers remain in that status the year later, a rather low share (8.5 % compared to 19.3 % at EU level) fall into unemployment or inactivity.
(30) For instance, OECD (2014a), Employment Outlook, shows, based on PIAAC data, that on average being on temporary contracts reduces the probability of receiving employer-sponsored training by 14 %.
(31) OECD (2014b), ‘Jobs, Wages and Inequality and the Role of Non-Standard Work’, forthcoming.
Chart 10: Transition rates from temporary to permanent employment, temporary or self-employment and unemployment or inactivity
(2011/12) and share of involuntary temporary employment (2012)
0
10
20
30
40
50
60
70
80
90
100
FRESNLELITPLEU-28DKCYPTFILUCZHUSIDESEBEATUK
Temporary or self-employmentPermanent employment
Unemployment or inactivityTransition rate from temporary employment into:
Share of involuntary temporary employment
%
Source: Eurostat, EU-LFS (lfsa_etgar) and EU-SILC (ilc_lvhl32). Exception to the reference year: Sweden (2010/2011 instead of 2011/2012).
exce
l file
gif

50
Employment and Social Developments in Europe 2014
Chart 11: Evolution of the risk of poverty or social exclusion, in %
0
5
10
15
20
25
30
35
40
45
201320122011201020092008200720062005
EU-27EU-15
NMS 12South 4
Risk of poverty or social exclusion (target)24 % or 123m people
0
5
10
15
20
25
201320122011201020092008200720062005
At-risk-of-poverty rate (60 % of median)17 % or 83m people
EU-27EU-15
NMS 12South 4
0
5
10
15
20
25
30
35
Severe material deprivation (4+ items)10 % or 48m people
EU-27EU-15
NMS 12South 4
201320122011201020092008200720062005
0
2
4
6
8
10
12
14
Jobless households (zero or very low work intensity)10.5 % of the 0-59 acategory or 40m people
EU-27EU-15
NMS 12South 4
201320122011201020092008200720062005
Source: Eurostat, EU-SILC (peps01, li02, mddd11, lvhl11).
Note: South4 refers to EL, ES, IT and PT.
Chart 12: Risk of poverty and changes in the poverty threshold, % of the population
-40
-30
-20
-10
0
10
20
30
40
50
SKBGSEMTBEPLCZFIFRATDKEEDESILTESHUNLLUROPTITHR*UKLVCYIE*ELEU-27
% o
f th
e po
pula
tion
2008 2013 (2012 if NA) Change in at risk of poverty threshold (2008-2012/13)
Source: Eurostat, EU-SILC (ilc_li01,ilc_li02). *Data for IE and HR refers to 2012.
The main drivers of poverty and social exclusion are seen to be long-term unemployment, labour market seg-mentation and wage polarisation, but also the weakening of the redistributive impact of tax and benefits systems.
Overall, the risk-of-poverty rate has increased in more than ten
Member States since 2008. However, declining levels of household dispos-able incomes in general have led to a reduction in the national poverty lines in Member States such as Latvia and Greece, meaning that decreases in the poverty rate do not neces-sarily indicate any improvement in absolute terms.
As a consequence of this deteriorat-ing situation, poverty defined in terms of severe material deprivation ( 32) has also increased across Europe, and most
(32) Severely materially deprived persons have living conditions severely constrained by a lack of resources. They experience at least 4 out of 9 of the following deprivations: cannot afford i) to pay rent or utility bills, ii) to keep the home adequately warm, iii) to face unexpected expenses, iv) to eat meat, fish or a protein equivalent every second day, v) a week holiday away from home, vi) a car, vii) a washing machine, viii) a colour TV, or ix) a telephone.
exce
l file
gif
exce
l file
gif

51
Chapter 1: The legacy of the crisis: resilience and challenges
strongly in those Member States most affected by the crisis (Spain, Italy, Ire-land, Malta, United Kingdom). In some Eastern/Southern countries where dep-rivation had been improving before the crisis, the trend reversed and material deprivation increased dramatically after the crisis (Lithuania, Latvia, Estonia, Cyprus, Greece, Hungary and to a lesser extent Bulgaria).
Working age adults have been especially affected, reflecting the deterioration of
labour market conditions, with the worst hit countries being Spain, Italy, Greece, the Baltic States, but also the United Kingdom ( 33). Moreover, since many such working age adults live in households with children, child poverty has also risen across Europe as a whole. In contrast, the risk-of-poverty indicator for older people showed a significant decline in most Member States between 2008 and 2013 reflecting the fact that pensions have, to a large extent, remain unchanged during the crisis.
(33) See European Commission (2014a).
Chart 13: Activity rate across EU Member States, 2003, 2008 and 2013, in % of population aged 15–64
55
60
65
70
75
80
85
SENLDKDEUKATFIEEESLVCYPTCZLTEU-28FRSILUSKIEBGELBEPLHUMTROITHR
20132003 2008
Source: Eurostat, EU-LFS [lfsi_act_a].
Chart 14: Activity rate (15–64) compared to 1990 and 2007 levels, for selected countries, in pps
-7
-6
-5
-4
-3
-2
-1
0
1
2
19981997199619951994199319921991
France US ItalyFinlandUKSweden
-4
-3
-2
-1
0
1
2
3
201320122011201020092008
Spain Germany SwedenFinlandUK IrelandUS
Source: OECD. Source: Eurostat, EU-LFS and OECD data for the US.
Due to the combination of life expectancy, lower participation in the labour market and household composition (single parent families), women are at higher risk of poverty or social exclusion than men in all Member States, with the exception of Spain and Portugal.
2.2. Participation in education and in the labour market continued to rise
Economic participation, as measured by the activity rate indicator ( 34), has con-tinued to increase since 2008 in most Member States, in contrast to the experi-ence in past recessions. While the employ-ment rate declined from 65.7 % in 2008 to 64.1 % in 2013 for the EU as a whole, the activity rate increased from 70.7 % in 2008 to 71.9 % in 2013. It implies that the drop in the number of jobs mainly translated into a rising number of unemployed and, only to a limited extent, a rising number of ‘discouraged workers’ (see Section below). This EU experience also contrasts with the decline in activity rate witnessed in the United States since 2008 ( 35).
Reductions in activity rates in previous crises are attributed to a higher share of working-age persons withdrawing
(34) The activity rate measures the share, among the working-age population, of those being economically active, i.e. either in employment or unemployed, according to the ILO definitions. While this indicator counts the total number of people in employment and unemployment and country-comparisons may be influenced by differences in institutional factors (such as incentives to be registered as unemployed), the analysis of changes of activity rate over time remains meaningful, in particular to analyse behavioural changes compared to previous recessions.
(35) Note that for the US, several papers (e.g. Barnes et al (2013)) show that the decline in participation since 2008 reflects, to a great extent, long-term demographic and behavioural changes rather than cyclical developments.
exce
l file
gif
exce
l file
gif

52
Employment and Social Developments in Europe 2014
from the labour market, resulting in their decline between 1990 and 1994 and a very slow return to previous levels, sub-stantially so for Sweden and Finland, while increasing slightly in France (and the United States), see Chart 14. By contrast, since 2007, activity rates have continued to increase in many EU countries, even those strongly affected by the recession.
Increase in activity continued to be driven by women and older workers
The increase in the activity rate since 2008 has mainly been driven by the rising participation of women and older workers throughout the recession see Chart 15. This is seen to be due to a number of factors: structural increases in their activity rate due to cohort effects and rising levels of education; policy measures designed to encour-age increased female and older workers participation( 36); and the fact that the initial labour market shock did not hit women and older workers as strongly as prime-age males.
Chart 17 shows that the decline in activ-ity rate for prime-age men was lim-ited (–0.8 pp) compared to the decline in
(36) The increase in older workers participation over the last decades was also driven by an overall improvement in their health status, see European Commission (2011a), Chapter 5.
their employment rate (–4.8 pps), indicat-ing that they were the group least likely to fall into inactivity if they lost their job. LFS data for 2013 also shows that, if prime-age men become unemployed, they are more likely to receive unemployment ben-efits (43 %) than young people (18 %) or prime-age women (36 %), notably due to their more favourable employment histories. This is one of the factors that promote continuation of job search rather than ‘discouragement’ and inactivity.
Chart 15: Activity rate by group (age and sex), EU-28, 2002–13 (in %)
30
40
50
60
70
80
90
100
201320122011201020092008200720062005200420032002
Men 15-24 Men 25-49 Men 50-64Women 25-49Women 15-24 Women 50-64
75.7
92.6
48.3
64.3
40.9
43.4 44.9
92.0
72.1
39.3
79.7
56.9
Source: Eurostat, EU-LFS, [lfsi_agan].
Chart 16: Change in the activity rate by group (age and sex) in EU-28, 2008–13 compared
to 2002–08, in percentage points
-4
-2
0
2
4
6
8
2002-08 2008-13
15-24 25-49 50-64WomenMenWomenMenWomenMen
7.26.3
3.3
4.5
-1.4
-0.2-0.8
0.2
1.4
2.6
-2.8
-0.6
Source: Eurostat, EU-LFS, [lfsa_argan].
Chart 17: Change in the employment and activity rates by group (age and sex) in EU-28, 2008–13,
in percentage points
-8
-6
-4
-2
0
2
4
6
8
WomenMenWomenMenWomenMen15-24 25-49 50-64
Changes in ER (pps) Changes in AR (pps) 4.9
6.3
3.3
0.9
-1.4
-3.9
-0.8
-4.8
1.4
-1.6-2.8
-6.1
Source: Eurostat, EU-LFS, [lfsa_argan] and [lfsa_ergan].
Since 2008, the activity rates of older workers (55–64) increased substan-tially in most countries even in the most affected countries ( 37) while they had been decreasing during the 1990s recession ( 38). Several changes explain this difference.
• Older workers have been (in com-parison to the 1990s) less affected by job losses (see Chart 18) nota-bly because their educational levels
(37) In Spain, Portugal and Ireland, decreases for men were more than offset by increases for women.
(38) For instance: in the UK (–1.6 pps over 1990–95), Italy (–4.2 pps over 1991–95) and Germany (–2.9 pps over 1992–96) with more pronounced drops for men (respectively –5.8 pps, –7.3 pps and 4.9 pps).
exce
l file
gif
exce
l file
gif
exce
l file
gif

53
Chapter 1: The legacy of the crisis: resilience and challenges
have improved ( 39) and the sectors in which they are employed have changed. Moreover, employers are often reluctant to lay off their most experienced workers, who also often benefit from a better protection (higher severance pay) than younger workers due to longer employment histories ( 40).
• If they become unemployed, older workers are less likely than before to withdraw from the labour market not least because of policies intro-duced over the last two decades to extend working lives, such as reforms in pension schemes (general increase in the statutory retirement age), and early retirement schemes. Moreover, alternative options such as disability schemes have been closed or made less accessible ( 41).
The continued increase in female activity rates also results from a combination of factors.
• Women tend to work in sectors that are less hit by the recession ( 42) (see also European Commission (2013), Chapter 3). This seems to explain most of the better performance of women’s employment during the crisis, while the ‘added-workers’ effects may also have played a part (see Box 1).
• There has been a structural increase in the participation of women, mainly due
(39) Between 1992 and 2008, the overall level of education of older workers increased more quickly than for prime-age workers, even when excluding the effects of the rising level of education among women. EU-LFS data for EU-15 countries shows that the share of low-educated among male older workers dropped sharply, from 53.9 % in 1992 to 32.3 % in 2008 (–21.6 pp) compared to prime age workers (from 40.2 % to 28.2 % or –12.0 pps). The share of tertiary educated persons among older men increased more sharply than among prime-age workers.
(40) The share of older workers under involuntary temporary contract is also much lower (4.4 % among those aged 55–64 compared to 8.1 % for prime-age and 14.7 % for young workers, i.e. EU-LFS data for EU-28 in 2013).
(41) European Commission (2011), Chapter 5.
(42) Female employment was less affected by the recession than male (respectively –0.6 % over 2008–13 against –4.7 %). While the two male-dominated sectors (manufacturing and construction) were strongly affected by the crisis, the two main female-dominated sectors (education and human health and social work) resisted well.
to rising levels of education of women over time ( 43). This has brought the behaviour of women in the labour mar-ket much closer to that of men with a rising share of dual-earner households.
• Measures supporting female par-ticipation such as flexible working arrangements, the removal of finan-cial disincentives for second earners, childcare and elderly care facilities have also played a role, together with measures to retain older women longer in the labour market ( 44). Until 2013, there were no signs of a reversal in the policies supporting female participation (see Section 4)
(43) For instance, among women aged 25–49 (50–64) the share of those with not more than lower secondary education decreased from 41 to 22 % (64 to 38 %) between 1995 and 2013, or –19 pps (–26 pps), to the profit of the medium and high educational groups (based on EU-LFS data on EU-15).
(44) Analysis by age and education confirms that the overall increase in female activity rate is not only due to change in the composition (i.e. increase in average level of education) and affected most sub-groups of women.
although this may no longer be the case in some countries that have applied major fiscal consolidation measures ( 45). Moreover, women tend to be over-represented in public and non-market service sectors that are now becoming more adversely affected by fiscal consolidation in many Member States ( 46).
Moreover, recent trends have not led to a substantial decrease in the large gen-der inequalities in the labour market that persist in many EU Member States to the disadvantage of women, in terms of activity and employment rates as well as in terms of part-time work and earnings.
(45) European Commission (2012b).
(46) European Parliament (2014).
Chart 18: Older workers less affected by job losses since 2008 than in the 1990s: changes in employment rates for prime-age
(25–54) and older (55–64) age groups in 1992–96 and 2008–13, in percentage points, selected Member States
-15
-10
-5
0
5
10
15
2008
-13
1992
-96
2008
-13
1992
-96
2008
-13
1992
-96
2008
-13
1992
-96
2008
-13
1992
-96
2008
-13
1992
-96
2008
-13
1992
-96
2008
-13
1992
-96
25-54 55-64
EU-15 DE ES FR IT FI SE UK
Source: Eurostat, EU-LFS, [lfsi_emp_a].
exce
l file
gif

54
Employment and Social Developments in Europe 2014
Box 1: Some mixed evidence about ‘added-worker effects’ during the recession
A recession can impact on labour market participation of ‘partnered’ women in two ways: (a) it can discourage women from looking for a job or postpone their decision (discouragement effect) or (b) it can foster participation in order to compensate for the job loss of the partner (added-worker effect). It is hard to determine whether the increase in female participation was due partly to the latter — or whether it was entirely caused by other structural factors due to education and cohort effects. Several reports support the added worker hypothesis without being totally conclusive:
• European Commission (2011b) shows that the activity rate of married women with children was more reactive to male unemployment and that it has increased faster since 2008 than for other women*.
• OECD (2012a) shows that in many countries partnered women were more likely to have increased their working hours during the crisis than single women.
• European Commission (2012b) points out that over 2007–09, dual-earner couples had lost ground mainly to the benefit of female breadwinner couples.
• European Commission (2013) shows that over 2007–11, the share of working women with a non-working male partner increased in most Member States.
• Bredtmann et al (2014) found that women whose partner becomes unemployed have a higher chances of entering the labour market and changing from part-time to full-time employment than women whose partner remains employed. The added worker effect varies over both the business cycle and the different welfare regimes within Europe**.
• EU-SILC*** data do not show such added-worker effect, as women’s transitions from inactivity to employment and from part-time to full-time employment do not increase between 2007 and 2012.
While there is no robust evidence of an added-worker effect during the crisis, the stronger share of women in employment, hours worked and earnings and the increasing share of dual-earner households has helped to cushion the impact of the recession on household incomes (OECD (2014c)).
Notes: * However, this is not true for all countries and may be due to other effects — for instance the increase in investment in childcare facilities. ** For instance, for the UK, Bryan and Longhi (2013) found an increase in job searches but only among single earner couples —which does not translate into more success in finding work (consistent with declining job-finding rate), at least in the short-term. *** Eurostat, EU-SILC, [ilc_lvhl30]. Note that these indicators are not available for different groups of women (partnered or not, with or without children).
Limited increase in discouraged workers during the recession
The number of persons available and want-ing to work but not looking for a job ( 47) (the ‘discouraged workers’) increased from 7.4 million in 2008 to 9.3 million in 2013 (or from 3.1 % to 3.8 % of the labour force). This increase was much lower than the increase in unemployment and long-term
(47) These are jobless persons (neither employed nor unemployed) who do not qualify for recording as unemployed (from the ILO definition) because they are not actively looking for a job (anymore), despite the fact that they want to work and are available for work. According to Eurostat, they include ‘discouraged workers but also persons prevented from job seeking due to personal or family circumstances’. However, for convenience, this Section uses the term ‘discouraged workers’ to refer to all the inactive persons wanting to work but not looking for a job.
unemployment ( 48) and can be viewed as a positive sign insofar as it means that unemployed persons continue to look for a job and can potentially benefit from activa-tion or (re)training.
Institutional factors can contribute to limiting the number of discouraged workers. For instance, countries where the share of discouraged workers is the
(48) Since 2008, the number of unemployed increased from 16.8 million to 26.4 million in 2013, and the number of long-term unemployed almost doubled in the same period (from 6.2 million to 12.3 million).
highest tend to be those with relatively limited support for the unemployed or the long-term unemployed ( 49). Gener-ally speaking, the countries that recorded increases in discouraged workers since 2008 ( 50) were those that combined a strong labour market impact of the crisis and relatively weak support services to the unemployed ( 51), whether in terms of spending on active labour market policies or income support.
There can also be other explanatory fac-tors such as the extent to which there are, or are not, incentives to register as unemployed, the link to social assis-tance schemes, or the actual probability of finding a job. The availability of care services for children or dependents may also affect the labour supply given that 36 % of ‘discouraged workers’ in 2013 were women of prime-age (25–54), a group more likely to be affected by issues related to the combination of work and family life. This share was highest in Spain (41 %), Italy (47 %) and Greece (49 %), all countries recognised as being poor performers in terms of supporting improved work-life balance ( 52).
Remaining in education
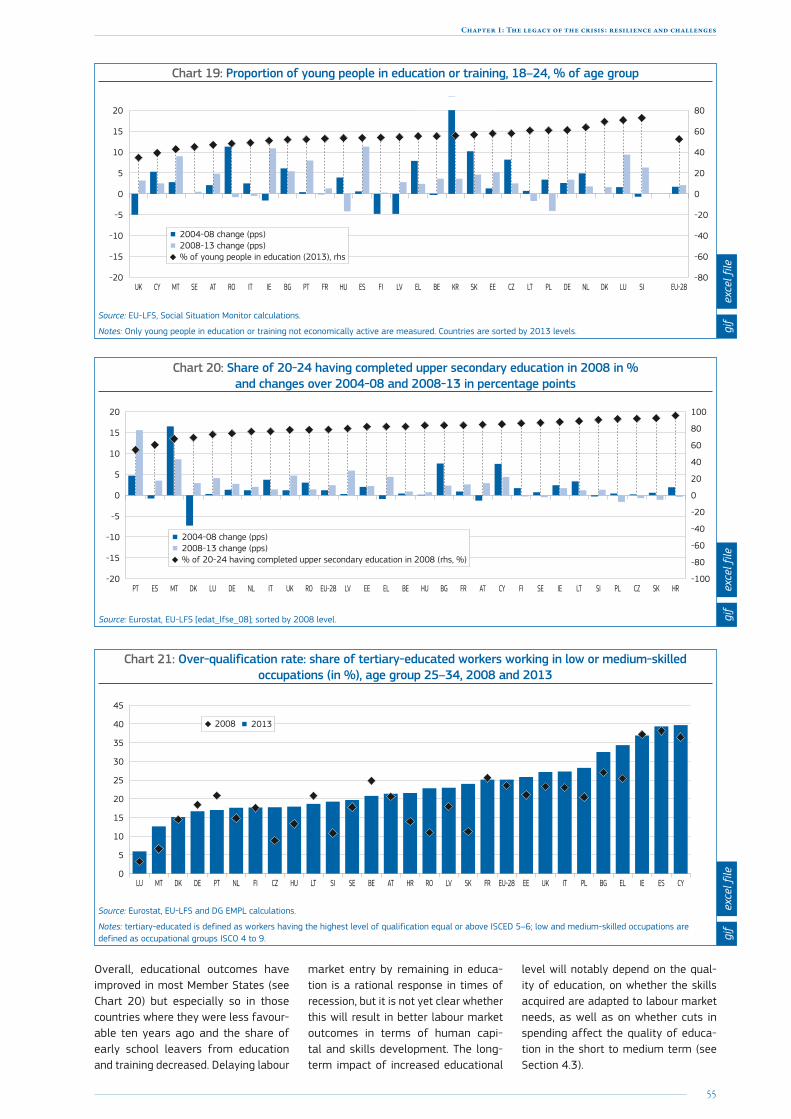
Since 2008, an increasing number of young people have remained in, or have returned to, education, notably within the younger age group (18–24) and especially in Member States where youth unemployment was especially high (Spain, Ireland and Portugal) and where the share of young people in education had been below the EU average in 2004. In some countries however, participation in education has either stalled (Greece, Italy, Romania, the Czech Republic and Slovakia), or even declined (Poland and Hungary).
(49) In 2013, a very low share of long-term unemployed were receiving unemployment benefits (or assistance) in Italy (2 %), Croatia (10 %), Bulgaria (1 %), Latvia (3 %) or Estonia (4 %), all characterised by a higher than average share of discouraged workers –while the receipt rate of benefits was rather high in some of the countries displaying a low share of ‘discouraged workers’ such as France, Germany, Malta, Belgium and Denmark.
(50) Croatia and Cyprus (strong increase) and Finland, Romania, Spain, Italy, Hungary, Greece and Slovenia (significant increase).
(51) According to typology presented in Stovicek and Turrini (2012)
(52) They display high gender employment gaps, high incidence of inactivity due to family obligations as well as relatively insufficient provision of child and/or dependent care facilities (see European Commission (2013), Chapter 3).
55
Chapter 1: The legacy of the crisis: resilience and challenges
Chart 19: Proportion of young people in education or training, 18–24, % of age group
-20
-15
-10
-5
0
5
10
15
20
-80
-60
-40
-20
0
20
40
60
80
EU-28SILUDKNLDEPLLTCZEESKKRBEELLVFIESHUFRPTBGIEITROATSEMTCYUK
2004-08 change (pps)2008-13 change (pps)% of young people in education (2013), rhs
Source: EU-LFS, Social Situation Monitor calculations.
Notes: Only young people in education or training not economically active are measured. Countries are sorted by 2013 levels.
Chart 20: Share of 20-24 having completed upper secondary education in 2008 in % and changes over 2004-08 and 2008-13 in percentage points
-20
-15
-10
-5
0
5
10
15
20
-100
-80
-60
-40
-20
0
20
40
60
80
100
HRSKCZPLSILTIESEFICYATFRBGHUBEELEELVEU-28ROUKITNLDELUDKMTESPT
2004-08 change (pps)2008-13 change (pps)% of 20-24 having completed upper secondary education in 2008 (rhs, %)
Source: Eurostat, EU-LFS [edat_lfse_08]; sorted by 2008 level.
Chart 21: Over-qualification rate: share of tertiary-educated workers working in low or medium-skilled occupations (in %), age group 25–34, 2008 and 2013
0
5
10
15
20
25
30
35
40
45
CYESIEELBGPLITUKEEEU-28FRSKLVROHRATBESESILTHUCZFINLPTDEDKMTLU
20132008
Source: Eurostat, EU-LFS and DG EMPL calculations.
Notes: tertiary-educated is defined as workers having the highest level of qualification equal or above ISCED 5–6; low and medium-skilled occupations are defined as occupational groups ISCO 4 to 9.
Overall, educational outcomes have improved in most Member States (see Chart 20) but especially so in those countries where they were less favour-able ten years ago and the share of early school leavers from education and training decreased. Delaying labour
market entry by remaining in educa-tion is a rational response in times of recession, but it is not yet clear whether this will result in better labour market outcomes in terms of human capi-tal and skills development. The long-term impact of increased educational
level will notably depend on the qual-ity of education, on whether the skills acquired are adapted to labour market needs, as well as on whether cuts in spending affect the quality of educa-tion in the short to medium term (see Section 4.3).
exce
l file
gif
exce
l file
gif
exce
l file
gif
56
Employment and Social Developments in Europe 2014
Chart 22: Income inequality in 2008 and 2013, Gini index
0
5
10
15
20
25
30
35
40
LVPTROPLUKBENLBGLTFRIEDEMTATFISECZSKELESEEITCYHRLUHUDKSIEU-27EU-28
2008 2013*
Gin
i Ind
ex
Increase Stable Decrease
Source: Eurostat, EU-SILC, ilc_di12.
Note: *Data for IE refers to 2012.
Chart 23: Incomes changes at several points of the distribution (1st quintile, median, 10th decile) — 2008–13
-40
-30
-20
-10
0
10
20
30
40
50
SKCZSESIDKLUCYITEEHUESFIATBEFRLTIEELBGPLMTDENLPTUKROLV
First quintile (20 % poorest)Tenth decile (10 % richest)Median incomeCh
ange
bet
wee
n 20
08 a
nd 2
013
(%) Incomes at the bottom
of the distribution decreased less/increased more than
those at the top
Bottom and top incomes decreased/increased
at the same pace
Top incomes increased faster/decreased less than those
at the bottom of distribution
Source: Eurostat, EU-SILC, prices adjusted by consumer prices (HICP), Eurostat.
Note: The graph refers to 20 % lowest incomes and 10 % highest incomes. Asymmetrical percentiles have been chosen for the following reasons. The lowest 10 % incomes are generally considered as difficult to capture (see Atkinson-Marlier 2010). Studies on top incomes generally focus on the upper part of the distribution, often top 1pc incomes or 5pc top incomes (see OECD 2013a). Data for IE refers to 2012.
Returns on investment in education can also be limited if they result in over-qualification. Since 2008, over-qualifi-cation ( 53) has increased, especially for those aged 25–34, as reflected in the difficulties university graduates find in obtaining jobs in line with their quali-fication. For this age group, the rate in 2013 was highest, at over 30 %, in Cyprus, Spain, Ireland, Greece and Bul-garia, where this skill mismatch may have made the labour market less resil-ient to the economic shock. Nevertheless, the rate of over-qualification has also increased in many Central and Eastern Member States which previously had lower than average rates.
(53) Measured as the share of tertiary-educated (ISCED 5–8) workers who are in low or medium-skilled occupations (ISCO 4–9), i.e. that theoretically do not require a tertiary education level.
2.3. Falling incomes and rising market income inequalities put tax and transfers systems under pressure
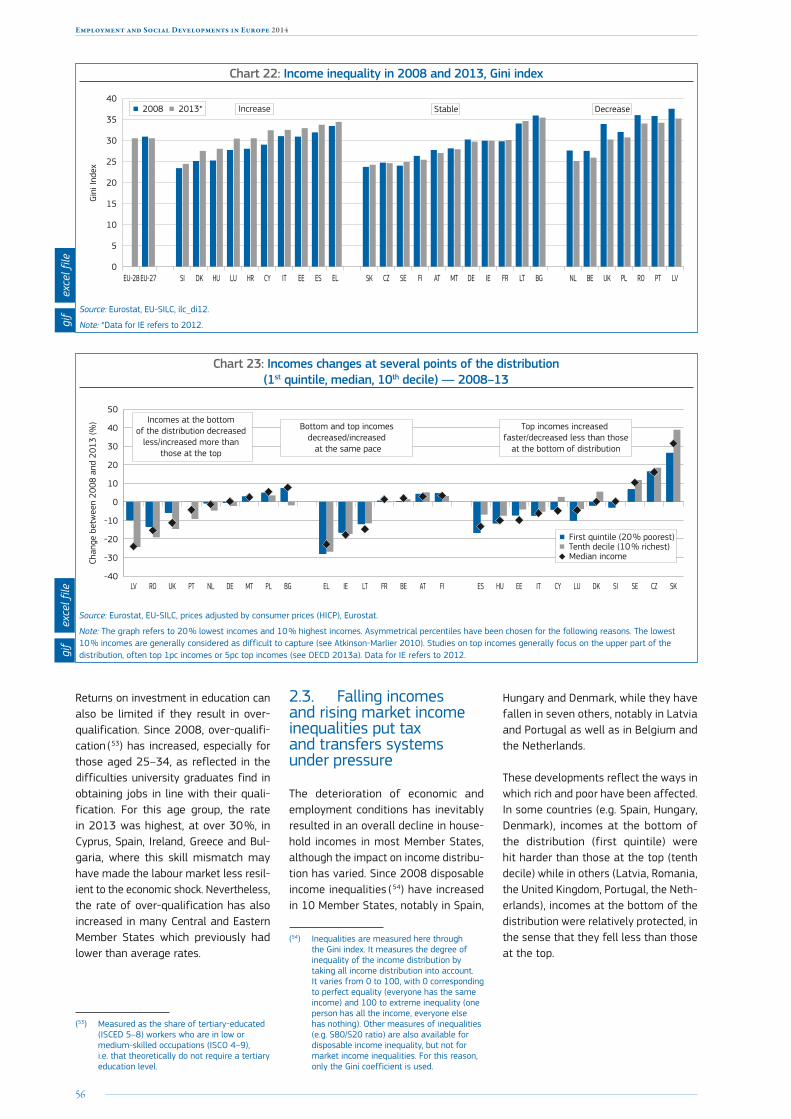
The deterioration of economic and employment conditions has inevitably resulted in an overall decline in house-hold incomes in most Member States, although the impact on income distribu-tion has varied. Since 2008 disposable income inequalities ( 54) have increased in 10 Member States, notably in Spain,
(54) Inequalities are measured here through the Gini index. It measures the degree of inequality of the income distribution by taking all income distribution into account. It varies from 0 to 100, with 0 corresponding to perfect equality (everyone has the same income) and 100 to extreme inequality (one person has all the income, everyone else has nothing). Other measures of inequalities (e.g. S80/S20 ratio) are also available for disposable income inequality, but not for market income inequalities. For this reason, only the Gini coefficient is used.
Hungary and Denmark, while they have fallen in seven others, notably in Latvia and Portugal as well as in Belgium and the Netherlands.
These developments reflect the ways in which rich and poor have been affected. In some countries (e.g. Spain, Hungary, Denmark), incomes at the bottom of the distribution (first quintile) were hit harder than those at the top (tenth decile) while in others (Latvia, Romania, the United Kingdom, Portugal, the Neth-erlands), incomes at the bottom of the distribution were relatively protected, in the sense that they fell less than those at the top.
exce
l file
gif
exce
l file
gif
57
Chapter 1: The legacy of the crisis: resilience and challenges
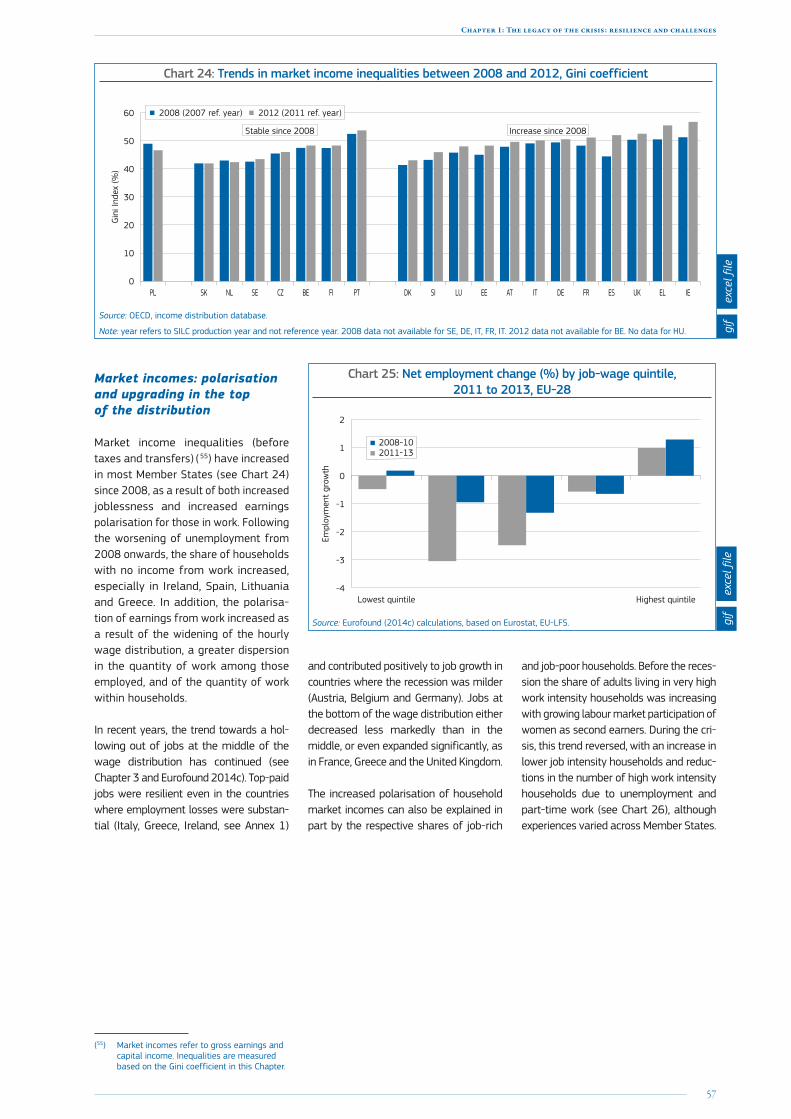
Chart 24: Trends in market income inequalities between 2008 and 2012, Gini coefficient
0
10
20
30
40
50
60G
ini I
ndex
(%)
IEELUKESFRDEITATEELUSIDKPTFIBECZSENLSKPL
2008 (2007 ref. year) 2012 (2011 ref. year)
Stable since 2008 Increase since 2008
Source: OECD, income distribution database.
Note: year refers to SILC production year and not reference year. 2008 data not available for SE, DE, IT, FR, IT. 2012 data not available for BE. No data for HU.
Chart 25: Net employment change (%) by job-wage quintile, 2011 to 2013, EU-28
-4
-3
-2
-1
0
1
2
Highest quintileLowest quintile
2008-102011-13
Empl
oym
ent
grow
th
Source: Eurofound (2014c) calculations, based on Eurostat, EU-LFS.
Market incomes: polarisation and upgrading in the top of the distribution
Market income inequalities (before taxes and transfers) ( 55) have increased in most Member States (see Chart 24) since 2008, as a result of both increased joblessness and increased earnings polarisation for those in work. Following the worsening of unemployment from 2008 onwards, the share of households with no income from work increased, especially in Ireland, Spain, Lithuania and Greece. In addition, the polarisa-tion of earnings from work increased as a result of the widening of the hourly wage distribution, a greater dispersion in the quantity of work among those employed, and of the quantity of work within households.
In recent years, the trend towards a hol-lowing out of jobs at the middle of the wage distribution has continued (see Chapter 3 and Eurofound 2014c). Top-paid jobs were resilient even in the countries where employment losses were substan-tial (Italy, Greece, Ireland, see Annex 1)
(55) Market incomes refer to gross earnings and capital income. Inequalities are measured based on the Gini coefficient in this Chapter.
and contributed positively to job growth in countries where the recession was milder (Austria, Belgium and Germany). Jobs at the bottom of the wage distribution either decreased less markedly than in the middle, or even expanded significantly, as in France, Greece and the United Kingdom.
The increased polarisation of household market incomes can also be explained in part by the respective shares of job-rich
and job-poor households. Before the reces-sion the share of adults living in very high work intensity households was increasing with growing labour market participation of women as second earners. During the cri-sis, this trend reversed, with an increase in lower job intensity households and reduc-tions in the number of high work intensity households due to unemployment and part-time work (see Chart 26), although experiences varied across Member States.
exce
l file
gif
exce
l file
gif

58
Employment and Social Developments in Europe 2014
Chart 26: Changes in the distribution of population by household work intensity (2005–08 and 2008–13) EU-27, in percentage points
-2
-1
0
1
2
3
4
Very high High Medium Low Very low
2005-08 2008-12
EU-27
In p
p
-10
-5
0
5
10
15Germany
Very highHighMediumLowVery low
In p
p
-10
-5
0
5
10
15Poland
Very highHighMediumLowVery low
In p
p
-10
-5
0
5
10
15Spain
Very highHighMediumLowVery low
In p
p
-15
-10
-5
0
5
10
15Greece
Very highHighMediumLowVery low
In p
p
Source: EU-SILC, Eurostat (ilc_lvps03).
exce
l file
gif

59
Chapter 1: The legacy of the crisis: resilience and challenges
The role of tax and transfers in mitigating inequalities increased in most countries
Overall, while social spending had played a significant role in sustaining household incomes in most countries in 2008/2009, this contribution lessened from 2010 onwards ( 56). Nevertheless, the redistributive role of tax and trans-fer systems helped limit the increase in market income inequality (see Chart 27), as expected when a large number of workers lose their jobs. In a few countries, however, market income inequality declined while after-tax and transfers inequality increased.
A Euromod micro-simulation study of 13 EU countries found that the policy changes undertaken between 2008 and 2013 resulted in a reduction of income in aggregate terms which directly con-tributed to increased hardship especially among low income households, whose budgets were already very constrained (De Agostini et al., 2014). Neverthe-less the distributional effects of these changes have been broadly progressive, with some country exceptions, despite increases in VAT rates which are normally judged to be regressive.
But the poverty reduction impact of social transfers declined in one third of countries
While the reduction of poverty that can be attributed to social transfers has changed significantly in a number of Member States since 2008, it has remained at a very low level in Greece, Bulgaria, Romania and Italy where weak or absent safety nets (unemploy-ment benefits and social assistance) are combined with limited support for those at work. In contrast, the impact of social transfers in reducing poverty increased significantly after the crisis in Spain, Latvia, the United Kingdom, Ire-land and Finland.
(56) See European Commission (2013c) and European Commission (2014a). The lessening observed from 2010 is explained by the increase in the number of long-term unemployed losing their entitlements along with the partial phasing-out of the measures put in place to counter the crisis and the tapering off of the impact of social spending in Member States where the economic situation improved.
Changes in the impact of social transfers on reducing poverty may be due to policy changes or to changes in the composi-tion of the population at risk of poverty (e.g. an increased share of unemployed or working poor). In some Member States which had previously had high levels of social transfers, the impact of social transfers on poverty reduction decreased significantly during the recession. This is
especially the case in Sweden, Hungary, Germany, Denmark, Belgium and France (Chart 28). In some other Member States, such as the United Kingdom Spain and Ireland, social transfers contributed to smoothing the impact of the crisis on poverty. Lastly, in some Member States, the impact of transfers on reducing pov-erty has lowered significantly, as in the Czech Republic and Poland.
Chart 27: Changes in market income and disposable income inequalities (2008–12), Gini index
-0.05-0.04-0.03-0.02-0.01
00.010.020.030.040.050.060.070.080.09
SKSEPLESFRATEEDKITSIUKELLUCZIEDKFINLBEPT
Change in market income inequalityChange in disposable income inequality
pp c
hang
e (2
008-
2012
)Redistribution
increasedRedistribution
declined
Source: OECD, income sources database.
Note: Year refers to SILC production year and not reference year. 2008 data not available for SE, DE, IT, FR, IT. 2012 data not available for BE. No data for Hungary.
Chart 28: Evolution of the risk of poverty after and before social transfers 2008–13
-8
-6
-4
-2
0
2
4
6
8
10
ELLUSISKFRLTITIEPTSEHUDEDKPLMTBENLESCYEEUKBGCZATROFILV
Change in poverty after social transfers (2008-13)Change in poverty before social transfers (2008-13)
Poverty after and before transfers decreased
Poverty after and before transfers increased
Poverty before transfers increased or stable,
poverty after transfers decreased
Poverty before transfers decreased or kept
stable, poverty after transfers increased
2008
-13
chan
ge in
pov
erty
rat
es (p
oint
s)
Source: Eurostat EU-SILC (ilc_li02).
Note: 2012 data for IE.
exce
l file
gif
exce
l file
gif

60
Employment and Social Developments in Europe 2014
3. The potential long-term impacts on people and society
The long-term impact of the prolonged recession, and the contribution of policies intended to mitigate its effects, can be reviewed in the following terms:
• The scarring effect of early career unemployment for future employment outcomes
• The ability of households to adapt to adverse economic circumstances, draw-ing on their savings or going into debt, by adjusting their consumption or pulling resources
• The impacts on health and on access to healthcare
• The extent to which declining confi-dence in the ability of public institutions to address problems may impact on social cohesion, weaken democracies, and inhibit effective policy making.
3.1. Scarring effects of unemployment — evidence from most recent data
The scarring effects of early career unemployment on individuals: lessons from the past
There is considerable existing knowledge about ‘scarring effects’ for early career unemployment ( 57) based on research that pre-dates the current recession. Such research shows that, while young people tend to experience spells of unemployment more frequently than adults, they gener-ally face shorter spells of unemployment. In this context, a higher unemployment rate among youth is generally explained by the time needed to make the transi-tion from education to an appropriate job. However, there is evidence that unemploy-ment among young people is less and less a ‘temporary nuisance’ as spells increase in length. Delays in making the transition to working life, and the lack of opportunity to acquire on-the-job skills and knowledge, can have negative consequences for the individual and society as a whole (Euro-found 2012).
(57) The focus is mainly on young people due to the strong impact of the recession and because several authors argue that long-term scarring effects are more likely to occur when unemployment is experimented early in the career, see for instance Bell and Blanchflower (2011).
Chart 29: Employment rate one year after obtaining highest education level (persons 20–29, not in education or training)
in 2008, 2009 and 2013
0
10
20
30
40
50%
60
70
80
90
100
PLUKITFREU-28ESDE
201320092008
Source: Eurostat, LFS, DG EMPL calculations. Year of obtaining highest level of education is the variable HATYEAR.
These ‘scarring effects’ in early stage of a life or career can impact on future employment outcomes, earnings pros-pects, as well on health and general well-being ( 58). This occurs in various ways such as a depreciation (or non-accumulation) of skills, negative signal-ling effects for potential employers, or simply demotivation. A high level of edu-cation tends to attenuate potential scar-ring effects, and impacts on the channels through which they happen. In all cases, it seems that some work experience, even if limited, is key to prevention ( 59). Annex 2 contains an overview of litera-ture on the subject.
Entering the labour market in bad times for a whole generation: attempts to measure current impact
While long-term effects are not yet fully observable, analysing the labour mar-ket trajectories of those who entered the labour market during the crisis compared to the previous generation — as carried out here — can be informative ( 60).
(58) The literature on scarring effects for early-career unemployment has been reviewed in Eurofound (2012); European Commission (2013), Chapter 1; European Commission (2012c); Schmillen and Umkehrer (2013); Scarpetta et al. (2010). Most of the papers claim evidence of ‘true state dependence’ scarring effects in individual unemployment histories but conclusions about the existence and magnitude of the effects somewhat vary.
(59) See recent paper by IAB (2014) as well as Cockx and Picchio (2011) or Doiron and Gørgens (2008).
(60) Such methodological approach differs from most papers on scarring effects as it measures the overall impact on a generation, rather than focusing on the scars for those individuals having experienced unemployment spells.
Studies comparing the outcomes of those entering the labour market in bad times (i.e. when unemployment is high or increasing) to previous or future genera-tions (‘better-off’) ( 61) suggests that the negative effect of being unemployed at entry on future employment rates disap-pears relatively quickly (i.e. in a three-year period), though the catch-up period regarding wages can be longer, or even permanent ( 62).
These somewhat different findings (com-pared to most papers on scarring effects, see Annex 2) may be due to the fact that they are based on data for a whole gen-eration rather than individuals, but they may also reflect the fact that the stigma attached to having been unemployed may be weaker in times of crisis ( 63). However, such ‘scarring effects’ are generally seen in terms of their long-term effects, and findings relating to experiences in the 1980s and 1990s cannot necessarily be relevant to the current period.
Chart 29 shows that, over the period of the recent crisis, the employment rate of young people (aged 20–29 and no longer in education or training) one year after having obtained their highest level
(61) Such comparisons have been documented in numerous countries, notably in Austria, Canada, Germany, Japan, Norway, Sweden and the US, see for example the review of papers conducted by Gaini et al (2012).
(62) See for instance Oreopoulos et al. (2012) for Canada or Kahn (2010), for the US.
(63) For instance, Biewen and Steffes (2010) argue for Germany that ‘if unemployment is relatively high, the stigma connected to it is lower because it is a more widespread phenomenon’. Gaini et al (2012) also found, for France, that ‘unlucky’ young people (i.e. leaving school during a recession) catch up quickly (3 years) in terms of employment with ’lucky’ ones (i.e. who entered the labour market during a boom).
exce
l file
gif
61
Chapter 1: The legacy of the crisis: resilience and challenges
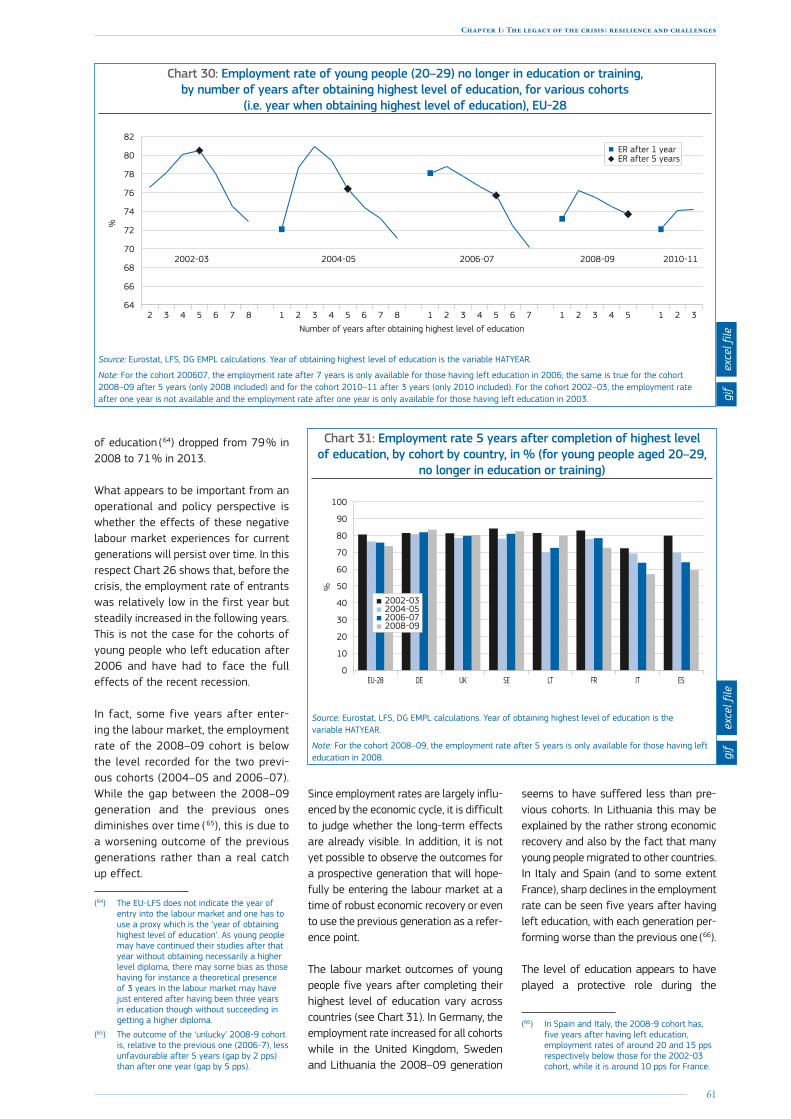
of education ( 64) dropped from 79 % in 2008 to 71 % in 2013.
What appears to be important from an operational and policy perspective is whether the effects of these negative labour market experiences for current generations will persist over time. In this respect Chart 26 shows that, before the crisis, the employment rate of entrants was relatively low in the first year but steadily increased in the following years. This is not the case for the cohorts of young people who left education after 2006 and have had to face the full effects of the recent recession.
In fact, some five years after enter-ing the labour market, the employment rate of the 2008–09 cohort is below the level recorded for the two previ-ous cohorts (2004–05 and 2006–07). While the gap between the 2008–09 generation and the previous ones diminishes over time ( 65), this is due to a worsening outcome of the previous generations rather than a real catch up effect.
(64) The EU-LFS does not indicate the year of entry into the labour market and one has to use a proxy which is the ‘year of obtaining highest level of education’. As young people may have continued their studies after that year without obtaining necessarily a higher level diploma, there may some bias as those having for instance a theoretical presence of 3 years in the labour market may have just entered after having been three years in education though without succeeding in getting a higher diploma.
(65) The outcome of the ‘unlucky’ 2008-9 cohort is, relative to the previous one (2006-7), less unfavourable after 5 years (gap by 2 pps) than after one year (gap by 5 pps).
Chart 30: Employment rate of young people (20–29) no longer in education or training, by number of years after obtaining highest level of education, for various cohorts
(i.e. year when obtaining highest level of education), EU-28
2002-03 2004-05 2006-07 2008-09 2010-11
Number of years after obtaining highest level of education
%
64
66
68
70
72
74
76
78
80
82
321543217654321876543218765432
ER after 1 yearER after 5 years
Source: Eurostat, LFS, DG EMPL calculations. Year of obtaining highest level of education is the variable HATYEAR.
Note: For the cohort 200607, the employment rate after 7 years is only available for those having left education in 2006; the same is true for the cohort 2008–09 after 5 years (only 2008 included) and for the cohort 2010–11 after 3 years (only 2010 included). For the cohort 2002–03, the employment rate after one year is not available and the employment rate after one year is only available for those having left education in 2003.
Chart 31: Employment rate 5 years after completion of highest level of education, by cohort by country, in % (for young people aged 20–29,
no longer in education or training)
0
10
20
30
40
50
60
70
80
90
100
ESITFRLTSEUKDEEU-28
2002-032004-052006-072008-09
%
Source: Eurostat, LFS, DG EMPL calculations. Year of obtaining highest level of education is the variable HATYEAR.
Note: For the cohort 2008–09, the employment rate after 5 years is only available for those having left education in 2008.
Since employment rates are largely influ-enced by the economic cycle, it is difficult to judge whether the long-term effects are already visible. In addition, it is not yet possible to observe the outcomes for a prospective generation that will hope-fully be entering the labour market at a time of robust economic recovery or even to use the previous generation as a refer-ence point.
The labour market outcomes of young people five years after completing their highest level of education vary across countries (see Chart 31). In Germany, the employment rate increased for all cohorts while in the United Kingdom, Sweden and Lithuania the 2008–09 generation
seems to have suffered less than pre-vious cohorts. In Lithuania this may be explained by the rather strong economic recovery and also by the fact that many young people migrated to other countries. In Italy and Spain (and to some extent France), sharp declines in the employment rate can be seen five years after having left education, with each generation per-forming worse than the previous one ( 66).
The level of education appears to have played a protective role during the
(66) In Spain and Italy, the 2008-9 cohort has, five years after having left education, employment rates of around 20 and 15 pps respectively below those for the 2002-03 cohort, while it is around 10 pps for France.
exce
l file
gif
exce
l file
gif

62
Employment and Social Developments in Europe 2014
recession, with the clearest evidence being in France and, to some extent, in Italy, while it is much less true in Spain. Chart 32 suggests that those who obtained a tertiary level education after 2008 have rather similar employment rates to those achieved by previous generations. In con-trast, the outcomes of those having no more than upper secondary education are much worse compared with previous cohorts (Chart 33).
This protective role of higher education has been referred to in several studies drawing on the experience of past recessions, where the impact of unemployment at gradua-tion on future income, life satisfaction and health outcomes being lower for the highly
educated, see Cutler et al (2014). Likewise, a lasting effect of adverse labour market conditions at entry has been found for the low-skilled, but not the mid-skilled or high-skilled, underlining the risk of polarisation and increased inequalities, see Burgess et al (2013).
Another factor impacting the transitions from education to professional life is gen-der. European Commission (2013i) demon-strated that despite the stronger impact of the crisis on the labour market conditions of young men (particularly those aged 15–24) than young women, the latter still face worse labour market conditions over-all, especially in southern and eastern EU Member States, notably due to care and
family responsibilities. Nevertheless, edu-cational attainment is an important factor in employment opportunities for young women and the gender gaps in employ-ment are smaller for young people with a tertiary education.
Chart 32: Employment rate 5 years after completion of highest level of education, by cohort, in % (for young people aged 20–29, no longer in education or training
and having a high level of education)
0
10
20
30
40
50
60
70
80
90
100
ESITFRLTSEUKDEEU-28
2002-032004-052006-072008-09
%
Source: Eurostat, LFS, DG EMPL calculations. Year of obtaining highest level of education is the variable HATYEAR.
Note: For the cohort 2008–09, the employment rate after 5 years is only available for those having left education in 2008.
Chart 33: Employment rate 5 years after completion of highest level of education, by cohort, in % (for young people aged 20–29, no longer in education or training
and having a medium level of education)
0
10
20
30
40
50
60
70
80
90
100
ESITFRLTSEUKDEEU-28
2002-032004-052006-072008-09
%
Source: Eurostat, LFS, DG EMPL calculations. Year of obtaining highest level of education is the variable HATYEAR.
Note: For the cohort 2008–09, the employment rate after 5 years is only available for those having left education in 2008.
Chart 34: Financial distress of people in low-income households Reported financial distress of the lowest quartile (share of adults reporting necessity
to draw on savings and share of adults reporting need to run into debt), 2000–14
0
10
20
30
40
50
60
70
2014
M2
2013
M11
2013
M8
2013
M5
2013
M2
2012
M11
2012
M8
2012
M5
2012
M2
2011
M11
2011
M8
2011
M5
2011
M2
2010
M11
2010
M8
2010
M5
2010
M2
2009
M11
2009
M8
2009
M5
2009
M2
2008
M11
2008
M8
2008
M5
2008
M2
2007
M11
2007
M8
2007
M5
2007
M2
2006
M11
2006
M8
2006
M5
2006
M2
EU PT DE ES EL
%
Source: European Commission DG ECFIN, Business and Consumer Surveys (DG EMPL calculations), data non-seasonally adjusted.
Note: Three-month moving averages.
3.2. Households: running into debt, adjusting consumption and pooling resources
Running into debt
Household debt levels increased signifi-cantly in a number of Euro area countries prior to the onset of the recession (European Commission, 2014d). Household financial
exce
l file
gif
exce
l file
gif
exce
l file
gif
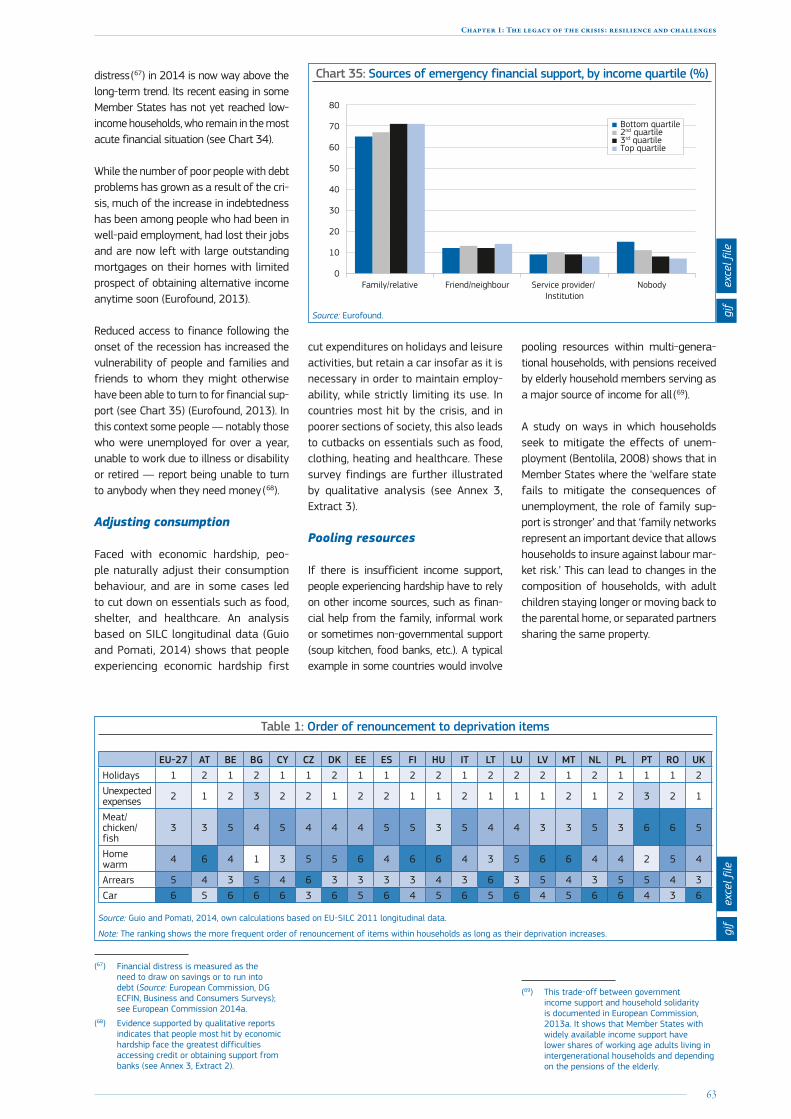
63
Chapter 1: The legacy of the crisis: resilience and challenges
distress ( 67) in 2014 is now way above the long-term trend. Its recent easing in some Member States has not yet reached low-income households, who remain in the most acute financial situation (see Chart 34).
While the number of poor people with debt problems has grown as a result of the cri-sis, much of the increase in indebtedness has been among people who had been in well-paid employment, had lost their jobs and are now left with large outstanding mortgages on their homes with limited prospect of obtaining alternative income anytime soon (Eurofound, 2013).
Reduced access to finance following the onset of the recession has increased the vulnerability of people and families and friends to whom they might otherwise have been able to turn to for financial sup-port (see Chart 35) (Eurofound, 2013). In this context some people — notably those who were unemployed for over a year, unable to work due to illness or disability or retired — report being unable to turn to anybody when they need money ( 68).
Adjusting consumption
Faced with economic hardship, peo-ple naturally adjust their consumption behaviour, and are in some cases led to cut down on essentials such as food, shelter, and healthcare. An analysis based on SILC longitudinal data (Guio and Pomati, 2014) shows that people experiencing economic hardship first
(67) Financial distress is measured as the need to draw on savings or to run into debt (Source: European Commission, DG ECFIN, Business and Consumers Surveys); see European Commission 2014a.
(68) Evidence supported by qualitative reports indicates that people most hit by economic hardship face the greatest difficulties accessing credit or obtaining support from banks (see Annex 3, Extract 2).
cut expenditures on holidays and leisure activities, but retain a car insofar as it is necessary in order to maintain employ-ability, while strictly limiting its use. In countries most hit by the crisis, and in poorer sections of society, this also leads to cutbacks on essentials such as food, clothing, heating and healthcare. These survey findings are further illustrated by qualitative analysis (see Annex 3, Extract 3).
Chart 35: Sources of emergency financial support, by income quartile (%)
0
10
20
30
40
50
60
70
80
NobodyService provider/ Institution
Friend/neighbourFamily/relative
Top quartile3rd quartile2nd quartileBottom quartile
Source: Eurofound.
Pooling resources
If there is insufficient income support, people experiencing hardship have to rely on other income sources, such as finan-cial help from the family, informal work or sometimes non-governmental support (soup kitchen, food banks, etc.). A typical example in some countries would involve
pooling resources within multi-genera-tional households, with pensions received by elderly household members serving as a major source of income for all ( 69).
A study on ways in which households seek to mitigate the effects of unem-ployment (Bentolila, 2008) shows that in Member States where the ‘welfare state fails to mitigate the consequences of unemployment, the role of family sup-port is stronger’ and that ‘family networks represent an important device that allows households to insure against labour mar-ket risk.’ This can lead to changes in the composition of households, with adult children staying longer or moving back to the parental home, or separated partners sharing the same property.
(69) This trade-off between government income support and household solidarity is documented in European Commission, 2013a. It shows that Member States with widely available income support have lower shares of working age adults living in intergenerational households and depending on the pensions of the elderly.
Table 1: Order of renouncement to deprivation items
EU-27 AT BE BG CY CZ DK EE ES FI HU IT LT LU LV MT NL PL PT RO UKHolidays 1 2 1 2 1 1 2 1 1 2 2 1 2 2 2 1 2 1 1 1 2Unexpected expenses 2 1 2 3 2 2 1 2 2 1 1 2 1 1 1 2 1 2 3 2 1
Meat/chicken/fish
3 3 5 4 5 4 4 4 5 5 3 5 4 4 3 3 5 3 6 6 5
Home warm 4 6 4 1 3 5 5 6 4 6 6 4 3 5 6 6 4 4 2 5 4
Arrears 5 4 3 5 4 6 3 3 3 3 4 3 6 3 5 4 3 5 5 4 3Car 6 5 6 6 6 3 6 5 6 4 5 6 5 6 4 5 6 6 4 3 6
Source: Guio and Pomati, 2014, own calculations based on EU-SILC 2011 longitudinal data.
Note: The ranking shows the more frequent order of renouncement of items within households as long as their deprivation increases.
exce
l file
gif
exce
l file
gif

64
Employment and Social Developments in Europe 2014
Across the EU as a whole, there is little evidence that the recession as such led to any major change as regards young peo-ple living with their parents (see Chart 36) although there have been substantial increases (e.g. + 4 percentage points) in the proportion of young people living with their parents in Ireland, Spain, and Greece since 2008. Qualitative research shows that people sometimes have had no other choice than to rely on family solidarity (see Annex 3, Extract 4).
3.3. Impact on health and access to healthcare
The potential long-term impact of the crisis on health determinants (i.e., unem-ployment, quality of work, precarious liv-ing conditions) is threatening to increase health inequalities between social groups and Member States. There is extensive research documenting the negative impact of economic hardship on the health status of individuals, which in a recession may be further exacerbated by greater difficulties in accessing or paying for healthcare.
Many studies report that, during reces-sions, individuals are more likely to suf-fer from depression and stress (Cooper, 2011). Otterbach (2014) also reports, on the basis of long-lasting panel data, that being unemployed or insecure in one’s job has a strong negative effect on life satisfaction and health.
OECD (2014d) also notes evidence of a possible link between the economic crisis and obesity. Many families, especially in the worst hit countries, have been forced to cut food consumption or to switch to lower-priced and less healthy foods. Brenner (2013) identified unemploy-ment as an important risk factor for heart disease mortality at the start of the 2008/9 recession. Stuckler et al. 2011, Reeves et al. 2012 reports a higher sui-cide rate during recessions. In Italy, the suicide rate increased by 10 % among men younger than 65 between 2006 and 2010, with an increase by 25 % within the 50–54 age group ( 70).
(70) Source: Eurostat, Causes of death — crude death rate per 100 000 inhabitants [hlth_cd_acdr].
Chart 36: Access to autonomy: changes in the share of young people living with their parents (2004–13), in percentage points
-10
-8
-6
-4
-2
0
2
4
6
8
10
12
EU-28CYIEESELFRPTHRUKITATLULVNLMTDKSKFIHULTPLEERODE SIBECZBGSE
2004-082008-13
Recent decrease Recent increase
pp c
hang
e (2
004-
13)
Source: Social Situation Monitor, based on LFS data.
Chart 37: Unmet need for healthcare by employment status
0
5
10
15
20
25
30
LVBGROEEELITPLCYPTDEFRHUSEEU-28BEFISKMTLUHRNLLTATDKUKESCZSIIE
Employed personsUnemployed persons
%
Source: EU-SILC, Eurostat. Unmet need for healthcare is measured as the share of individuals renouncing healthcare because of: cost, i.e. the person cannot afford to pay for it (too expensive); the waiting list; or distance or means of transportation ( 1).
(1) This definition also applies to the European Core Health Indicator (ECHI) on Equity of access to healthcare service (ECHI 80) for total population and by educational level.
Chart 38: Correlation of real expenditure per capita on sickness, healthcare, disability and unmet healthcare needs, 2007–11
Perc
enta
ge p
oint
s ch
ange
(200
7-11
) in
unm
et h
ealth
care
nee
d
Growth (2007-11) in real public expenditure per capita in sickness and disability, %
NL
LV
PT
FI
BG
HU
EE
PLCY
LT
IELU
EL ITES
CZ
BEDK
DE
FRMT
AT ROSI
SK
SE
UK
-25 -15 -5 5 15 25 35 45 55-10
-8
-6
-4
-2
0
2
4
Source: ESSPROS for expenditure in sickness, healthcare and disability and EU-SILC, Eurostat for unmet need for healthcare.
The harmful and hazardous use of alcohol and other substances are also key factors in the development of social and health inequalities in the EU, influenced by unemployment and
economic downturns (European Com-mission, 2013, Marmot et al. 2013).
Chart 37 shows that, in many Mem-ber States, the unmet need for
healthcare is much greater among the unemployed than among the employed. Eurofound (2014, forthcoming) also identified situations in which peo-ple lost access to healthcare during
exce
l file
gif
exce
l file
gif
exce
l file
gif
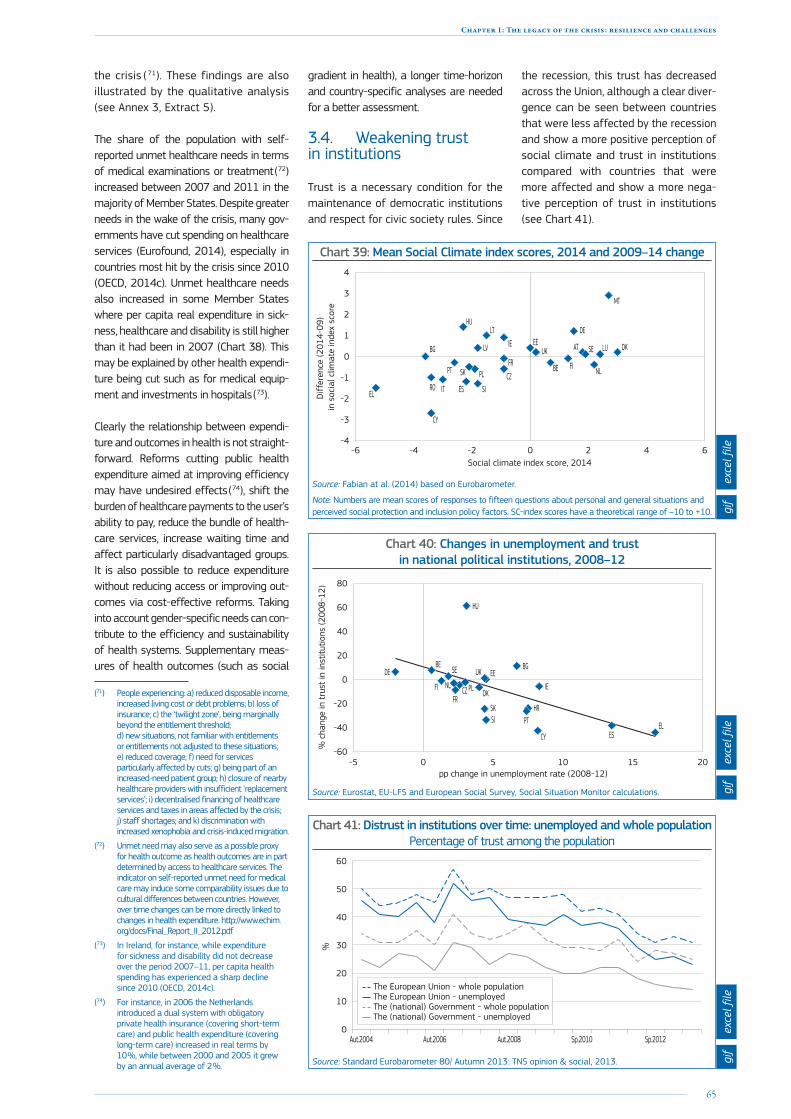
65
Chapter 1: The legacy of the crisis: resilience and challenges
the crisis ( 71). These findings are also illustrated by the qualitative analysis (see Annex 3, Extract 5).
The share of the population with self-reported unmet healthcare needs in terms of medical examinations or treatment ( 72) increased between 2007 and 2011 in the majority of Member States. Despite greater needs in the wake of the crisis, many gov-ernments have cut spending on healthcare services (Eurofound, 2014), especially in countries most hit by the crisis since 2010 (OECD, 2014c). Unmet healthcare needs also increased in some Member States where per capita real expenditure in sick-ness, healthcare and disability is still higher than it had been in 2007 (Chart 38). This may be explained by other health expendi-ture being cut such as for medical equip-ment and investments in hospitals ( 73).
Clearly the relationship between expendi-ture and outcomes in health is not straight-forward. Reforms cutting public health expenditure aimed at improving efficiency may have undesired effects ( 74), shift the burden of healthcare payments to the user’s ability to pay, reduce the bundle of health-care services, increase waiting time and affect particularly disadvantaged groups. It is also possible to reduce expenditure without reducing access or improving out-comes via cost-effective reforms. Taking into account gender-specific needs can con-tribute to the efficiency and sustainability of health systems. Supplementary meas-ures of health outcomes (such as social
(71) People experiencing: a) reduced disposable income, increased living cost or debt problems; b) loss of insurance; c) the ‘twilight zone’, being marginally beyond the entitlement threshold; d) new situations, not familiar with entitlements or entitlements not adjusted to these situations; e) reduced coverage; f) need for services particularly affected by cuts; g) being part of an increased-need patient group; h) closure of nearby healthcare providers with insufficient ‘replacement services’; i) decentralised financing of healthcare services and taxes in areas affected by the crisis; j) staff shortages; and k) discrimination with increased xenophobia and crisis-induced migration.
(72) Unmet need may also serve as a possible proxy for health outcome as health outcomes are in part determined by access to healthcare services. The indicator on self-reported unmet need for medical care may induce some comparability issues due to cultural differences between countries. However, over time changes can be more directly linked to changes in health expenditure. http://www.echim.org/docs/Final_Report_II_2012.pdf
(73) In Ireland, for instance, while expenditure for sickness and disability did not decrease over the period 2007–11, per capita health spending has experienced a sharp decline since 2010 (OECD, 2014c).
(74) For instance, in 2006 the Netherlands introduced a dual system with obligatory private health insurance (covering short-term care) and public health expenditure (covering long-term care) increased in real terms by 10 %, while between 2000 and 2005 it grew by an annual average of 2 %.
gradient in health), a longer time-horizon and country-specific analyses are needed for a better assessment.
3.4. Weakening trust in institutions
Trust is a necessary condition for the maintenance of democratic institutions and respect for civic society rules. Since
the recession, this trust has decreased across the Union, although a clear diver-gence can be seen between countries that were less affected by the recession and show a more positive perception of social climate and trust in institutions compared with countries that were more affected and show a more nega-tive perception of trust in institutions (see Chart 41).
Chart 39: Mean Social Climate index scores, 2014 and 2009–14 change
-6 -4 -2 0 2 4 6-4
-3
-2
-1
0
1
2
3
4
Diff
eren
ce (2
014-
09)
in s
ocia
l clim
ate
inde
x sc
ore
Social climate index score, 2014
NL
AT
PT FI
BG
HU
EELT
LV
PL
LU
CY
IE
MT
EL ESCZ
BE
DK
RO IT
DE
FR
SI
SK
SEUK
Source: Fabian at al. (2014) based on Eurobarometer.
Note: Numbers are mean scores of responses to fifteen questions about personal and general situations and perceived social protection and inclusion policy factors. SC-index scores have a theoretical range of –10 to +10.
Chart 40: Changes in unemployment and trust in national political institutions, 2008–12
% c
hang
e in
tru
st in
inst
itutio
ns (2
008-
12)
pp change in unemployment rate (2008-12)-5 0 5 10 15 20
-60
-40
-20
0
20
40
60
80
NL
PT
FI
BG
HU
EE
PL
HR
CY
IE
ELES
CZ
BE
DK
DE
FR
SISK
SE UK
Source: Eurostat, EU-LFS and European Social Survey, Social Situation Monitor calculations.
Chart 41: Distrust in institutions over time: unemployed and whole population Percentage of trust among the population
%
0
10
20
30
40
50
60
Sp.2012Sp.2010 Aut.2008Aut.2006Aut.2004
The European Union - unemployed
The (national) Government - unemployed
The European Union - whole population
The (national) Government - whole population
Source: Standard Eurobarometer 80/ Autumn 2013: TNS opinion & social, 2013.
exce
l file
gif
exce
l file
gif
exce
l file
gif
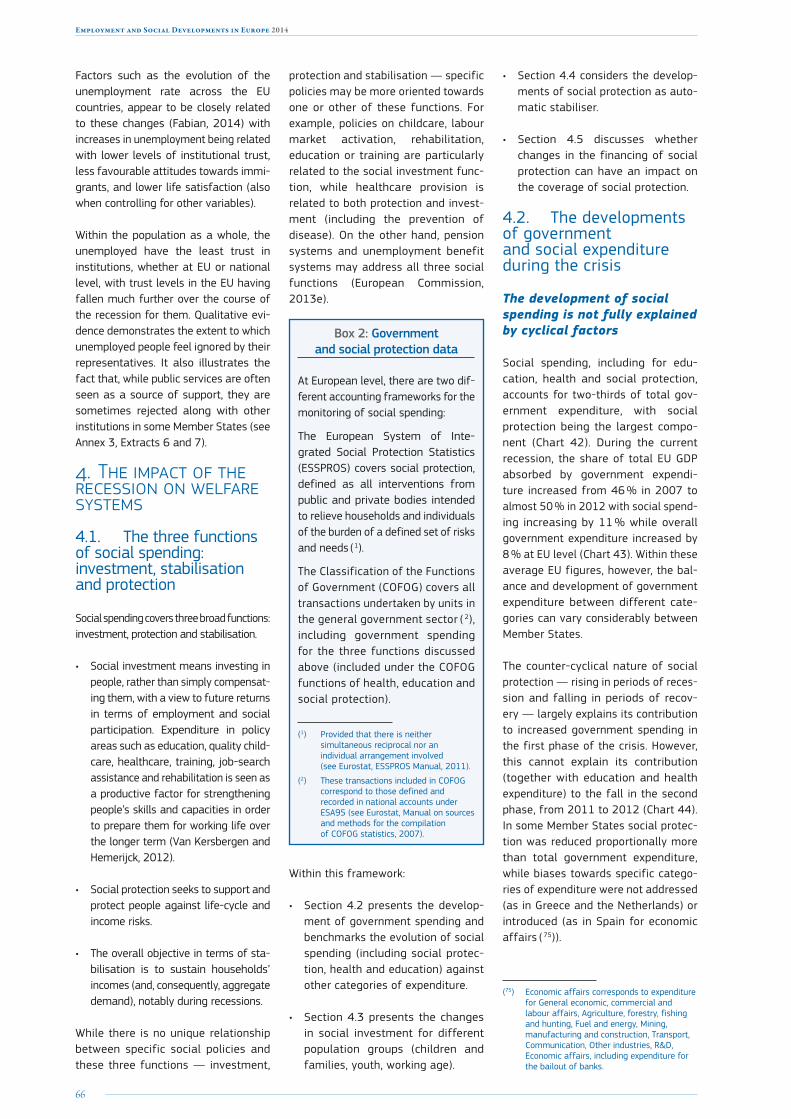
66
Employment and Social Developments in Europe 2014
Factors such as the evolution of the unemployment rate across the EU countries, appear to be closely related to these changes (Fabian, 2014) with increases in unemployment being related with lower levels of institutional trust, less favourable attitudes towards immi-grants, and lower life satisfaction (also when controlling for other variables).
Within the population as a whole, the unemployed have the least trust in institutions, whether at EU or national level, with trust levels in the EU having fallen much further over the course of the recession for them. Qualitative evi-dence demonstrates the extent to which unemployed people feel ignored by their representatives. It also illustrates the fact that, while public services are often seen as a source of support, they are sometimes rejected along with other institutions in some Member States (see Annex 3, Extracts 6 and 7).
4. The impact of the recession on welfare systems
4.1. The three functions of social spending: investment, stabilisation and protection
Social spending covers three broad functions: investment, protection and stabilisation.
• Social investment means investing in people, rather than simply compensat-ing them, with a view to future returns in terms of employment and social participation. Expenditure in policy areas such as education, quality child-care, healthcare, training, job-search assistance and rehabilitation is seen as a productive factor for strengthening people’s skills and capacities in order to prepare them for working life over the longer term (Van Kersbergen and Hemerijck, 2012).
• Social protection seeks to support and protect people against life-cycle and income risks.
• The overall objective in terms of sta-bilisation is to sustain households’ incomes (and, consequently, aggregate demand), notably during recessions.
While there is no unique relationship between specific social policies and these three functions — investment,
protection and stabilisation — specific policies may be more oriented towards one or other of these functions. For example, policies on childcare, labour market activation, rehabilitation, education or training are particularly related to the social investment func-tion, while healthcare provision is related to both protection and invest-ment (including the prevention of disease). On the other hand, pension systems and unemployment benefit systems may address all three social functions (European Commission, 2013e).
Box 2: Government and social protection data
At European level, there are two dif-ferent accounting frameworks for the monitoring of social spending:
The European System of Inte-grated Social Protection Statistics (ESSPROS) covers social protection, defined as all interventions from public and private bodies intended to relieve households and individuals of the burden of a defined set of risks and needs ( 1).
The Classification of the Functions of Government (COFOG) covers all transactions undertaken by units in the general government sector ( 2), including government spending for the three functions discussed above (included under the COFOG functions of health, education and social protection).
(1) Provided that there is neither simultaneous reciprocal nor an individual arrangement involved (see Eurostat, ESSPROS Manual, 2011).
(2) These transactions included in COFOG correspond to those defined and recorded in national accounts under ESA95 (see Eurostat, Manual on sources and methods for the compilation of COFOG statistics, 2007).
Within this framework:
• Section 4.2 presents the develop-ment of government spending and benchmarks the evolution of social spending (including social protec-tion, health and education) against other categories of expenditure.
• Section 4.3 presents the changes in social investment for different population groups (children and families, youth, working age).
• Section 4.4 considers the develop-ments of social protection as auto-matic stabiliser.
• Section 4.5 discusses whether changes in the financing of social protection can have an impact on the coverage of social protection.
4.2. The developments of government and social expenditure during the crisis
The development of social spending is not fully explained by cyclical factors
Social spending, including for edu-cation, health and social protection, accounts for two-thirds of total gov-ernment expenditure, with social protection being the largest compo-nent (Chart 42). During the current recession, the share of total EU GDP absorbed by government expendi-ture increased from 46 % in 2007 to almost 50 % in 2012 with social spend-ing increasing by 11 % while overall government expenditure increased by 8 % at EU level (Chart 43). Within these average EU figures, however, the bal-ance and development of government expenditure between different cate-gories can vary considerably between Member States.
The counter-cyclical nature of social protection — rising in periods of reces-sion and falling in periods of recov-ery — largely explains its contribution to increased government spending in the first phase of the crisis. However, this cannot explain its contribution (together with education and health expenditure) to the fall in the second phase, from 2011 to 2012 (Chart 44). In some Member States social protec-tion was reduced proportionally more than total government expenditure, while biases towards specific catego-ries of expenditure were not addressed (as in Greece and the Netherlands) or introduced (as in Spain for economic affairs ( 75)).
(75) Economic affairs corresponds to expenditure for General economic, commercial and labour affairs, Agriculture, forestry, fishing and hunting, Fuel and energy, Mining, manufacturing and construction, Transport, Communication, Other industries, R&D, Economic affairs, including expenditure for the bailout of banks.

67
Chapter 1: The legacy of the crisis: resilience and challenges
Chart 42: Composition of government expenditure, EU-28 2012
Recreation, culture and religion 2 %Environment, Housing and community amenities 3 %
Defence, Public order and safety 7 %
Economic affairs 8 %
General public services 14 %
Education 11 %
Health 15 %
Social protection 40 %
Source: COFOG.
Notes: General public services corresponds to executive and legislative organs, financial, fiscal, external affairs, foreign economic aid, general services, basic research, R&D general public services, general public services n.e.c., public debt transactions, transfers of a general character between different levels of government.
Chart 43: Share of government and social spending (education, health, social protection) in GDP, EU-27 and EA-18
Expe
nditu
re (%
GD
P)
GD
P gr
owth
(%)
0
10
20
30
40
50
60
-10
-5
0
5
10
15
20
25
30
2012201120102009200820072006200520042003200220012000
EA-18 government expenditure EU-27 government expenditureEU-27 social spending EA-18 social spending EU-27 GDP growthEA-18 GDP growth
Source: COFOG.
Notes: Social spending includes public expenditure in healthcare, education and social protection.
Chart 44: Changes in real government expenditure, EU-27 and EA-17
-4
-3
-2
-1
0
1
2
3
4
5
20122011201020092008200720062011-122008-102001-0720122011201020092008200720062011-122008-102001-07
EU-27 EA-17
Social protectionEducationRecreation, culture and religionHealth
Environment, Housing and community amenitiesEconomic affairsDefence, Public order and safetyGeneral public services
%
Source: COFOG.
After 2010 average unemployment benefits per unemployed person and in-kind (health) benefits were reduced
In the initial phase of the crisis, increases in social expenditure were mostly due to expenditure on sickness and disability sup-port, pension expenditure, unemployment and family expenditure on children, with the rise in pension and family expenditure per beneficiary being partly explained by the lagged effects of the indexation mechanism in place (European Commission, 2013a).
In 2011, however, social protection expendi-ture declined on average in the EU-27 and in most individual Member States, mostly due to a decrease in the average expenditure per unemployed person (itself partly explained by the phasing-out of benefits for the long-term unemployed), as well as by reductions in expenditure on sickness and disability and on average family expenditure per child.
While declines in social expenditure in 2011 affected both cash and in-kind services, in 2012 they were concentrated on in-kind benefits. This is mainly explained by a reduction in in-kind sickness and disability benefits, although in-kind family benefits increased in many Member States despite the reduction in average expenditure per child. Such reductions in in-kind benefits are not reflected in household incomes and measurements of monetary income pov-erty, but they might be reflected in mea-sures of households’ access and provision of services (European Commission, 2013a).
exce
l file
gif
exce
l file
gif
exce
l file
gif

68
Employment and Social Developments in Europe 2014
Chart 45: Real growth of social protection, by function and decomposition, EU-27 (2008–11)
-5
-3
-1
1
3
%
5
7
9
2011201020092008
92% accounted for by the increase in average family expenditure per child
99% accounted for by the increase in the no. of unemployed
61% (in 2008) and 66% (in 2009) accounted for by the increase in average expenditure for over 65 year-olds
94% accounted for by a decrease in average expenditure per unemployed
87% accounted for by the increase in the no. of over 65 year-olds
Social exclusion and housingFamilyUnemployment benefitsSickness and disabilityOld age and survivors
Source: ESSPROS, elaborations from European Commission, 2013a.
Notes: shaded boxes correspond to changes in expenditure not due to socio-demographic factors.
Chart 46: Annual change in real public social expenditure, by cash and in-kind benefits
-2
-1
0
1
2
3
4
%
5
6
20122011201020092008200720062008-122001-05
In kindCash
Source: National Accounts.
4.3. Investing in children and families, young and working-age population
Social investment as a broad policy per-spective emerged in the 1990s with the aim of ensuring the sustainability of the welfare state in the face of new social risks and changing economic needs and chal-lenges. The key aims of social investment expenditure are seen to be to promote active employment and social participation, social cohesion and stability (Van Kersber-gen and Hemerijk, 2012) based on support for the development of human capital and strengthened family links to the economy through employment (Vanderbroucke et al., 2011). As such, the policy focus has been on education, active labour market poli-cies, early childhood education, preventive healthcare, health and safety at work, and retraining and lifelong education (see the Social Investment Package).
Investments in childcare are intended to help reconcile the working and fam-ily life of parents, while improving future educational performance, particularly of disadvantaged children. Investments in education, while primarily intended to enhance the quality of lives of future generations, are also expected to raise skill levels and improve employment out-comes, while reducing inequality and pov-erty. Active labour market measures aim to improve and maintain employability of both the employed and the unemployed.
Box 3: The multiple functions of childcare
There is a growing awareness of the cru-cial importance of addressing early child development in a positive way. Several long-term studies have highlighted the benefit of quality childcare on child development through into adulthood (see European Commission 2014e) — something that is seen as particularly important for the most disadvantaged.
The availability, the quality and the flexibility of childcare is also seen to influence the employment participation decisions of parents. Widely available full-day and after-school care in the Nordic countries and France have made it easier for parents to work full-time if they wish, whereas in Austria, Germany or Luxembourg, kindergartens typically operate short days or have long breaks that may not be compatible with full-time work.
Enrolment hours can also have particu-lar implications for female participation in the labour market. In those Mem-ber States where more women work shorter part-time hours, the offer of a formal care system is also lower. Never-theless, as enrolment can contribute to the achievement of a work-life balance and overcome the trade-off between inactivity and part-time employment, it can still be seen as preferential to no enrolment at all. On the other side, longer enrolment hours of care tend, in practice, to be matched with longer working hours of females.
Finally, an expansion of childcare ser-vices contributes to increasing formal employment opportunities for women.
From a demand-side perspective, they also provide a positive stimulus by reduc-ing costs of labour, mitigating risks for employers of recruiting new workers, and providing training support as well as financial incentives to the self-employed. Even in times of weak labour demand, they may increase employability, help the unem-ployed to remain active with the support
of public employment services, with such measures having been found to have a posi-tive impact as reflected in higher employ-ment rates — see Kluve (2010).
Van Kersbergen and Hemerijk (2012) con-sider that, in the period leading up to the recession, a number of European welfare systems had been developing in the direc-tion of the social investment model, and that this had resulted in increased labour market participation. At the same time, however, this focus on activation may have distracted attention away from policies designed to cover social risks, with the fur-ther risk that the recession could endan-ger the continuing progress of the social investment model. Some authors suggest
exce
l file
gif
exce
l file
gif
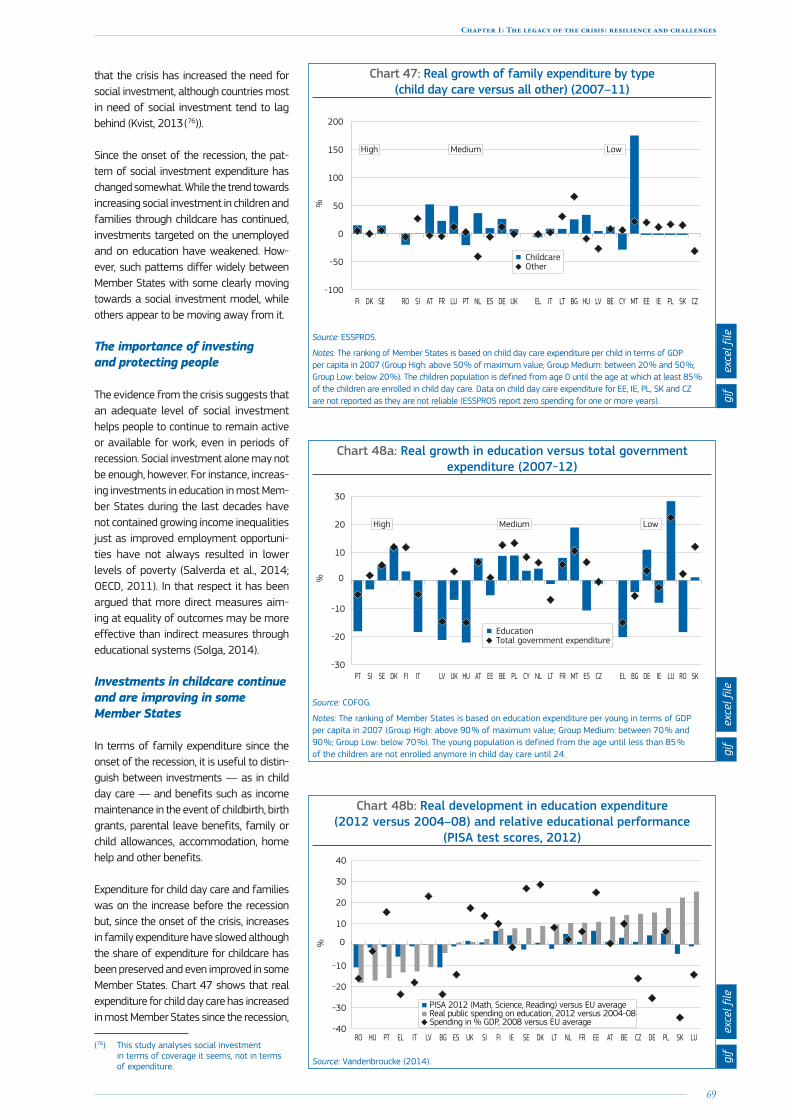
69
Chapter 1: The legacy of the crisis: resilience and challenges
that the crisis has increased the need for social investment, although countries most in need of social investment tend to lag behind (Kvist, 2013 ( 76)).
Since the onset of the recession, the pat-tern of social investment expenditure has changed somewhat. While the trend towards increasing social investment in children and families through childcare has continued, investments targeted on the unemployed and on education have weakened. How-ever, such patterns differ widely between Member States with some clearly moving towards a social investment model, while others appear to be moving away from it.
The importance of investing and protecting people
The evidence from the crisis suggests that an adequate level of social investment helps people to continue to remain active or available for work, even in periods of recession. Social investment alone may not be enough, however. For instance, increas-ing investments in education in most Mem-ber States during the last decades have not contained growing income inequalities just as improved employment opportuni-ties have not always resulted in lower levels of poverty (Salverda et al., 2014; OECD, 2011). In that respect it has been argued that more direct measures aim-ing at equality of outcomes may be more effective than indirect measures through educational systems (Solga, 2014).
(76) This study analyses social investment in terms of coverage it seems, not in terms of expenditure.
Chart 47: Real growth of family expenditure by type (child day care versus all other) (2007–11)
-100
-50
0
50%
100
150
200
CZSKPLIEEEMTCYBELVHUBGLTITELUKDEESNLPTLUFRATSIROSEDKFI
ChildcareOther
High LowMedium
Source: ESSPROS.
Notes: The ranking of Member States is based on child day care expenditure per child in terms of GDP per capita in 2007 (Group High: above 50 % of maximum value; Group Medium: between 20 % and 50 %; Group Low: below 20 %). The children population is defined from age 0 until the age at which at least 85 % of the children are enrolled in child day care. Data on child day care expenditure for EE, IE, PL, SK and CZ are not reported as they are not reliable (ESSPROS report zero spending for one or more years).
Chart 48a: Real growth in education versus total government expenditure (2007-12)
-30
-20
-10
0
10
20
30
SKROLUIEDEBGELCZESMTFRLTNLCYPLBEEEATHUUKLVITFIDKSESIPT
EducationTotal government expenditure
%
High LowMedium
Source: COFOG.
Notes: The ranking of Member States is based on education expenditure per young in terms of GDP per capita in 2007 (Group High: above 90 % of maximum value; Group Medium: between 70 % and 90 %; Group Low: below 70 %). The young population is defined from the age until less than 85 % of the children are not enrolled anymore in child day care until 24.
Chart 48b: Real development in education expenditure (2012 versus 2004–08) and relative educational performance
(PISA test scores, 2012)
-40
-30
-20
-10
0
10
20
30
40
LUSKPLDECZBEATEEFRNLLTDKSEIE FISIUK ES BGLVITELPTHURO
%
Real public spending on education, 2012 versus 2004-08PISA 2012 (Math, Science, Reading) versus EU average
Spending in % GDP, 2008 versus EU average
Source: Vandenbroucke (2014).
Investments in childcare continue and are improving in some Member States
In terms of family expenditure since the onset of the recession, it is useful to distin-guish between investments — as in child day care — and benefits such as income maintenance in the event of childbirth, birth grants, parental leave benefits, family or child allowances, accommodation, home help and other benefits.
Expenditure for child day care and families was on the increase before the recession but, since the onset of the crisis, increases in family expenditure have slowed although the share of expenditure for childcare has been preserved and even improved in some Member States. Chart 47 shows that real expenditure for child day care has increased in most Member States since the recession,
exce
l file
gif
exce
l file
gif
exce
l file
gif
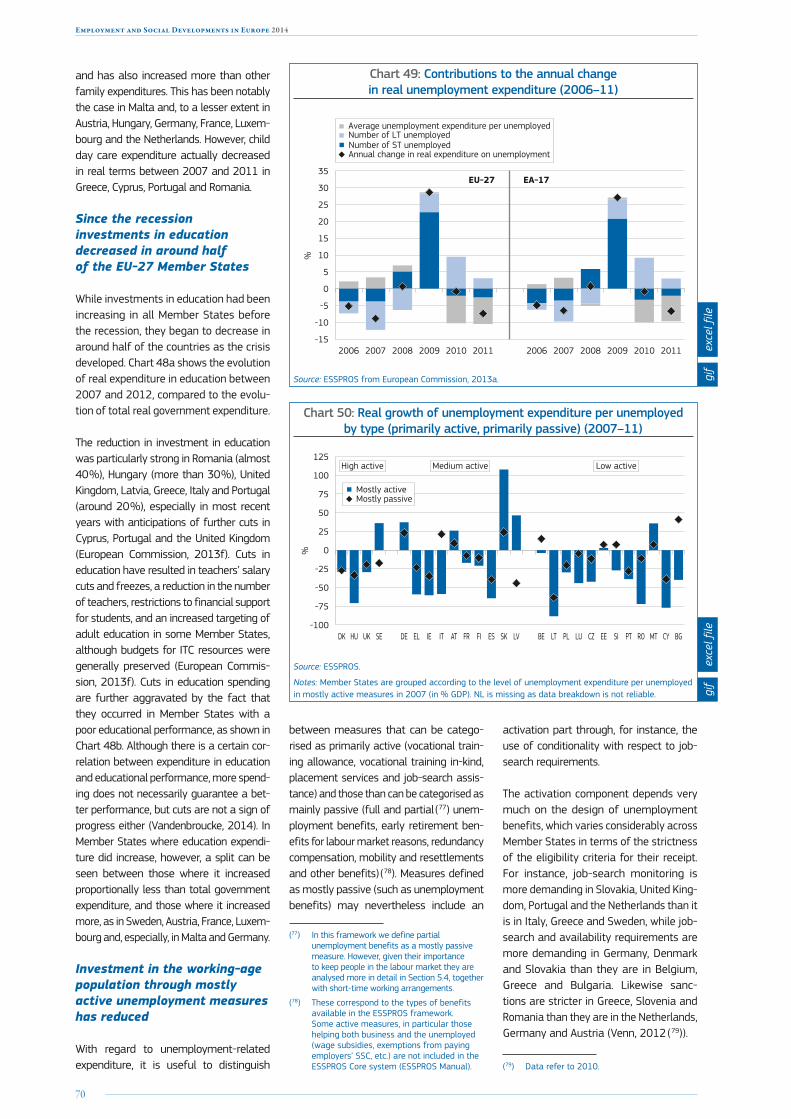
70
Employment and Social Developments in Europe 2014
and has also increased more than other family expenditures. This has been notably the case in Malta and, to a lesser extent in Austria, Hungary, Germany, France, Luxem-bourg and the Netherlands. However, child day care expenditure actually decreased in real terms between 2007 and 2011 in Greece, Cyprus, Portugal and Romania.
Since the recession investments in education decreased in around half of the EU-27 Member States
While investments in education had been increasing in all Member States before the recession, they began to decrease in around half of the countries as the crisis developed. Chart 48a shows the evolution of real expenditure in education between 2007 and 2012, compared to the evolu-tion of total real government expenditure.
The reduction in investment in education was particularly strong in Romania (almost 40 %), Hungary (more than 30 %), United Kingdom, Latvia, Greece, Italy and Portugal (around 20 %), especially in most recent years with anticipations of further cuts in Cyprus, Portugal and the United Kingdom (European Commission, 2013f). Cuts in education have resulted in teachers’ salary cuts and freezes, a reduction in the number of teachers, restrictions to financial support for students, and an increased targeting of adult education in some Member States, although budgets for ITC resources were generally preserved (European Commis-sion, 2013f). Cuts in education spending are further aggravated by the fact that they occurred in Member States with a poor educational performance, as shown in Chart 48b. Although there is a certain cor-relation between expenditure in education and educational performance, more spend-ing does not necessarily guarantee a bet-ter performance, but cuts are not a sign of progress either (Vandenbroucke, 2014). In Member States where education expendi-ture did increase, however, a split can be seen between those where it increased proportionally less than total government expenditure, and those where it increased more, as in Sweden, Austria, France, Luxem-bourg and, especially, in Malta and Germany.
Investment in the working-age population through mostly active unemployment measures has reduced
With regard to unemployment-related expenditure, it is useful to distinguish
between measures that can be catego-rised as primarily active (vocational train-ing allowance, vocational training in-kind, placement services and job-search assis-tance) and those than can be categorised as mainly passive (full and partial ( 77) unem-ployment benefits, early retirement ben-efits for labour market reasons, redundancy compensation, mobility and resettlements and other benefits) ( 78). Measures defined as mostly passive (such as unemployment benefits) may nevertheless include an
(77) In this framework we define partial unemployment benefits as a mostly passive measure. However, given their importance to keep people in the labour market they are analysed more in detail in Section 5.4, together with short-time working arrangements.
(78) These correspond to the types of benefits available in the ESSPROS framework. Some active measures, in particular those helping both business and the unemployed (wage subsidies, exemptions from paying employers’ SSC, etc.) are not included in the ESSPROS Core system (ESSPROS Manual).
activation part through, for instance, the use of conditionality with respect to job-search requirements.
The activation component depends very much on the design of unemployment benefits, which varies considerably across Member States in terms of the strictness of the eligibility criteria for their receipt. For instance, job-search monitoring is more demanding in Slovakia, United King-dom, Portugal and the Netherlands than it is in Italy, Greece and Sweden, while job-search and availability requirements are more demanding in Germany, Denmark and Slovakia than they are in Belgium, Greece and Bulgaria. Likewise sanc-tions are stricter in Greece, Slovenia and Romania than they are in the Netherlands, Germany and Austria (Venn, 2012 ( 79)).
(79) Data refer to 2010.
Chart 49: Contributions to the annual change in real unemployment expenditure (2006–11)
-15
-10
-5
0
5
10%
15
20
25
30
35
Average unemployment expenditure per unemployedNumber of LT unemployedNumber of ST unemployedAnnual change in real expenditure on unemployment
201120102009200820072006201120102009200820072006
EU-27 EA-17
Source: ESSPROS from European Commission, 2013a.
Chart 50: Real growth of unemployment expenditure per unemployed by type (primarily active, primarily passive) (2007–11)
-100
-75
-50
-25
0%
25
50
75
100
125
BGCYMTROPTSIEECZLUPLLTBELVSKESFIFRATITIEELDESEUKHUDK
Mostly activeMostly passive
High active Low activeMedium active
Source: ESSPROS.
Notes: Member States are grouped according to the level of unemployment expenditure per unemployed in mostly active measures in 2007 (in % GDP). NL is missing as data breakdown is not reliable.
exce
l file
gif
exce
l file
gif

71
Chapter 1: The legacy of the crisis: resilience and challenges
While total EU unemployment expenditure had been falling prior to the recession as labour market conditions improved, devel-opments since have been affected by divergent forces — increases in the aver-age level of unemployment expenditure per unemployed person, on the one hand, off-set by reductions in the number of short and, especially, long-term unemployed.
In the first phase of the crisis — from 2008 to 2009 — unemployment expendi-ture across the EU increased, mostly due to the increased number of unemployed (European Commission, 2013a), although it actually fell in Germany as the number of unemployed decreased, but also in Poland — but in the latter case due to a reduction in the average unemploy-ment expenditure per unemployed person (European Commission, 2013a).
During the crisis, however, most Member States reduced real unemploy-ment spending per unemployed person on measures that were primarily active, this being notably the case of Lithuania, Roma-nia and Cyprus, where such spending was already low, and in Hungary. This declining trend is particularly problematic in coun-tries such as Cyprus, Hungary and Bulgaria where the activation component within the standard unemployment benefits system was already very limited ( 80).
In most other Member States, unemploy-ment benefit payments increased pro-portionally more than spending on active measures as unemployment rose and labour demand fell, although expenditure on mostly active unemployment measures did increase in some Member States which had previously invested comparatively less in these types of measures (Estonia and particularly Malta) as well as in Sweden, Germany, Austria, Slovakia and Latvia.
Some countries are evolving towards a social investment model, while others are departing from it
Some of the Member States with relatively high levels of social investment appear to have maintained the resilience of their sys-tems during the recession, as measured in terms of levels of LTU and GDP — this being particularly noticeable in the case in Germany, which managed to decrease LTU. However Chart 51 suggests that, while
(80) Based on Venn (2012) scoring of job-search, monitoring and job sanctions.
social investment may improve resilience, it is also subject to decreasing returns with, for example, the high level of social invest-ment in Denmark seen to be doing more to ensure initial low levels of LTU than to con-tain the effects of economic shocks on LTU.
Table 2 summarises the development in real terms of social investment in specific areas (education, unemployment, family) across Member States since the recession. This assessment of the evolution towards a social investment model takes into account the orientation of welfare systems before the recession, with Member States divided into three groups (low/medium/high), based on the level of investment in child day care per relevant child population, mostly active unemployment expenditure per unemployed and education expenditure per relevant
young population in 2007. The overall score of social investment is measured by assign-ing equal weights to the three areas and the growth over 2007–2011 corresponds to the average growth in the three areas.
Member States that started with low lev-els of social investment and whose invest-ments were subsequently reduced further (Low/Decreased in the Table 2) represent a particular concern. Member States starting from low levels, but where social invest-ments increased, are promising as it seems that they can expect the highest returns. In some Member States, social investment increased in some areas, while not in oth-ers. For instance, in Poland investment in education increased, while it decreased in child day care and active unemployment measures in real terms.
Chart 51: Correlation between social investment (excluding education) and resilience (pp change in LTU / pp change in GDP)
Soci
al in
vest
men
t sc
ore
(exc
l. ed
ucat
ion)
200
7Weaker....... Resilience (pp change LTU/GDP growth)...... Stronger
NL
LVPT
FI
BG
HU
EECYLTIE LU
EL
IT
ES
CZBE
DK
DEFR
MT
AT
ROSI
SK
SE
UK
-1 -0.8 -0.6 -0.4 -0.2 0 0.20
0.1
0.2
0.3
0.4
0.5
0.6
0.7
0.8
0.9
1
Notes: The social investment score is based on 2007 values of child day care and mostly active unemployment expenditure per unemployed, where both areas are assigned equal weight. Resilience is measured by the ratio between the pp change in LTU in 2009–2010 and GDP growth in 2008–2009. PL is not reported in the Chart as it did not have a negative economic shock in this period. For NL the social investment score is based only on education and child day care expenditure as data for mostly active unemployment measures are not reliable in ESSPROS.
Chart 52: Real growth of social expenditure for tertiary education, 2007–12
Real
gro
wth
, 200
7-20
12, %
-40
-20
0
20
40
60
80
100
120
LUFRMTDKEELTSEDENLFISIIEES*CYBGATPLLVCZELPTUKITROHU
TertiaryAll levels
Sources: COFOG.
Notes: 2011 for ES.ex
cel f
ilegi
fex
cel f
ilegi
f

72
Employment and Social Developments in Europe 2014
Table 2: Summary developments in social investment (real terms, 2007–11)
Between 2007 and 2011Investments in 2007 in … Decreased Stable Increased
EducationHigh PT, SI, IT DK, FI, SE
Medium IE, HU, LV, UK, EE, ES LT, CZ BE, MT, NL, AT, PL, CY, FRLow BG, EL, RO SK DE, LU
Active unemployment
High DK, HU, UK SEMedium EL, IE, FR, FI, ES, IT DE, AT, SK, LV
LowRO, CY, LT, CZ, PT, PL,
LU, BE, SI, BGMT, EE
FamilyHigh DK SE, FI
Medium RO, PT SI ES, FR UK, DE, AT, NL, LULow EL, CY EE, IE, PL, SK IT, HU, BE, MT, LV, LT, BG
OverallHigh DK FI SE
Medium EL, ES, HU, IT, PT, RO, SI, UK AT, BE, DE, FR, LU, LV, NLLow BG, CZ, LT, PL, IE, CY EE MT, SK
Notes: In the rows Member States are grouped according to expenditure in child day care per relevant child population, education expenditure per relevant young population and mostly active unemployment expenditure per unemployed in 2007. In the columns Member States are grouped according to the real evolution of expenditure between 2007 and 2011. Stable real growth is defined for changes between 1.5 % and –1.5 % for education expenditure, –4 % and +4 % for mostly active unemployment and family expenditure. The level of overall expenditure in 2007 is based on the social investment score, which assign an equal weight to the three areas. Member States can be in the ‘high’ group only if they do not have ‘low’ expenditure in any of the three areas. The overall trend is based on the average growth in the three areas. For NL the social investment score is based only on education and child day care expenditure as data for mostly active unemployment measures are not reliable in ESSPROS.
During the recession social investments were concentrated more on children than on young people and adults, and also on addressing life-cycle risks (such as par-enthood) than on income groups risks (such as unemployment). Continuing pre-vious trends, investments in children and families have increased in most Mem-ber States, with the exception of Cyprus, Romania, Greece and Portugal.
The majority of Member States with previ-ously medium and low levels of expendi-ture for childcare converged towards the EU average, especially Malta (where an ambitious reform was initiated) and Aus-tria, Luxembourg and the Netherlands. In these Member States, which continue to invest in childcare from low to moder-ate levels, the employment of mothers increased significantly, while previous progress in Cyprus and Portugal in this respect has been reversing.
Likewise, investment in the education of young people has been reducing, in contrast to previous trends, with par-ticularly serious cuts in Greece, Roma-nia and Italy where starting levels were already relatively low. Such cuts in edu-cation expenditure come on top of the effects of the recession itself on young people. Cuts in tertiary education were also severe in some Member States (Chart 52). The combined effect of decreasing expenditure on education and increased number of students entering education — notably appar-ent in Spain, Portugal, Ireland, Estonia — is also liable to adversely affect the
quality of education they are likely to receive ( 81).
Over the course of the crisis, the bal-ance of unemployment measures shifted from active towards passive. This might possibly be justified on the grounds that total spending on active measures such as training may not necessarily need to increase proportionally as the number of newly unemployed people increase. On the other hand, it could equally be the case that governments felt that, as they needed to cut spending in order to meet budgetary targets, this was the easier or more politically acceptable option.
Table 2 summarises the change in the selected dimensions of social invest-ment ( 82) (education, active unemploy-ment measures, childcare) in its final row. It demonstrates that a number of Member States are progressing towards a social investment model, while others are clearly departing from it. In the first group there are a few countries start-ing from already relatively high levels of social investment (SE) and a few from relatively low levels (in particular Malta),
(81) This conclusion needs to be refined as we are talking about a share of young people, not an absolute number.
(82) The inclusion of investments in education in the assessment of the level of social investment (low, medium, high) often change the ranking of Member States with respect to the case in which this expenditure is excluded. In EL, IE, IT, LU, RO and, especially, in AT, DE, ES and NL the inclusion of education worsen the ranking in terms of social investment. In CY, EE, HU, LV, UK and, in particular, PT the inclusion of education improves their ranking in terms of social investment.
but most were coming from medium lev-els of social investment.
The second group consists of Mem-ber States that already had relatively low levels of social investment (especially Czech Republic, Romania and Cyprus), but also by Member States which had pre-viously medium to high levels of social investment. As shown in Chart 51, increas-ing social investment in Member States starting from low levels yields the highest returns in terms of resilience.
4.4. The development of social protection as an automatic stabiliser
Member States with well-functioning welfare systems were more resilient during the recession
Social protection expenditure had been increasing by 2 % a year on average in the period 2001–2005 but, follow-ing the impact of the crisis it increased considerably in 2009 (by 6 %), driven particularly by increased unemployment benefits expenditure, but also by sickness and disability and old age and survivor expenditure. This cyclical growth in social protection spending continued until 2011, but then declined in the face of the per-sistent weakness in the economy.
The decline in social protection by 2012 can thus be seen as the result of both cyclical and structural factors, with part of the decline being explained by the
gif
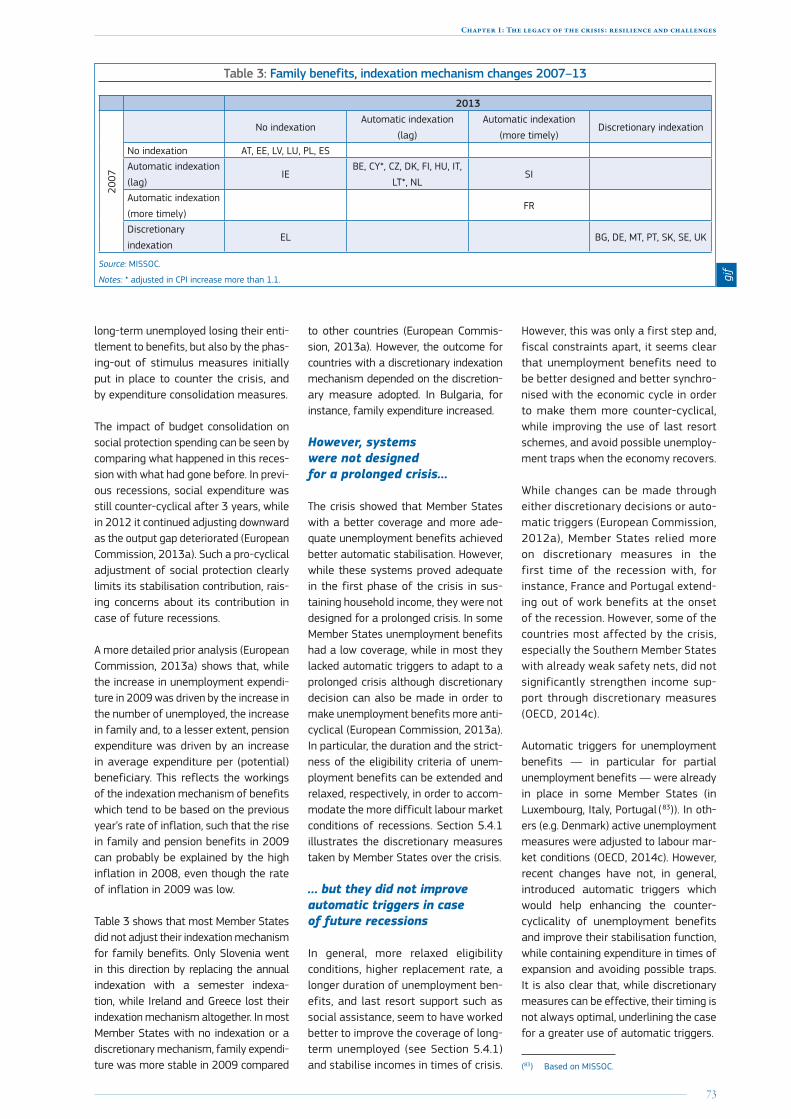
73
Chapter 1: The legacy of the crisis: resilience and challenges
long-term unemployed losing their enti-tlement to benefits, but also by the phas-ing-out of stimulus measures initially put in place to counter the crisis, and by expenditure consolidation measures.
The impact of budget consolidation on social protection spending can be seen by comparing what happened in this reces-sion with what had gone before. In previ-ous recessions, social expenditure was still counter-cyclical after 3 years, while in 2012 it continued adjusting downward as the output gap deteriorated (European Commission, 2013a). Such a pro-cyclical adjustment of social protection clearly limits its stabilisation contribution, rais-ing concerns about its contribution in case of future recessions.
A more detailed prior analysis (European Commission, 2013a) shows that, while the increase in unemployment expendi-ture in 2009 was driven by the increase in the number of unemployed, the increase in family and, to a lesser extent, pension expenditure was driven by an increase in average expenditure per (potential) beneficiary. This reflects the workings of the indexation mechanism of benefits which tend to be based on the previous year’s rate of inflation, such that the rise in family and pension benefits in 2009 can probably be explained by the high inflation in 2008, even though the rate of inflation in 2009 was low.
Table 3 shows that most Member States did not adjust their indexation mechanism for family benefits. Only Slovenia went in this direction by replacing the annual indexation with a semester indexa-tion, while Ireland and Greece lost their indexation mechanism altogether. In most Member States with no indexation or a discretionary mechanism, family expendi-ture was more stable in 2009 compared
to other countries (European Commis-sion, 2013a). However, the outcome for countries with a discretionary indexation mechanism depended on the discretion-ary measure adopted. In Bulgaria, for instance, family expenditure increased.
However, systems were not designed for a prolonged crisis…
The crisis showed that Member States with a better coverage and more ade-quate unemployment benefits achieved better automatic stabilisation. However, while these systems proved adequate in the first phase of the crisis in sus-taining household income, they were not designed for a prolonged crisis. In some Member States unemployment benefits had a low coverage, while in most they lacked automatic triggers to adapt to a prolonged crisis although discretionary decision can also be made in order to make unemployment benefits more anti-cyclical (European Commission, 2013a). In particular, the duration and the strict-ness of the eligibility criteria of unem-ployment benefits can be extended and relaxed, respectively, in order to accom-modate the more difficult labour market conditions of recessions. Section 5.4.1 illustrates the discretionary measures taken by Member States over the crisis.
… but they did not improve automatic triggers in case of future recessions
In general, more relaxed eligibility conditions, higher replacement rate, a longer duration of unemployment ben-efits, and last resort support such as social assistance, seem to have worked better to improve the coverage of long-term unemployed (see Section 5.4.1) and stabilise incomes in times of crisis.
However, this was only a first step and, fiscal constraints apart, it seems clear that unemployment benefits need to be better designed and better synchro-nised with the economic cycle in order to make them more counter-cyclical, while improving the use of last resort schemes, and avoid possible unemploy-ment traps when the economy recovers.
While changes can be made through either discretionary decisions or auto-matic triggers (European Commission, 2012a), Member States relied more on discretionary measures in the first time of the recession with, for instance, France and Portugal extend-ing out of work benefits at the onset of the recession. However, some of the countries most affected by the crisis, especially the Southern Member States with already weak safety nets, did not significantly strengthen income sup-port through discretionary measures (OECD, 2014c).
Automatic triggers for unemployment benefits — in particular for partial unemployment benefits — were already in place in some Member States (in Luxembourg, Italy, Portugal ( 83)). In oth-ers (e.g. Denmark) active unemployment measures were adjusted to labour mar-ket conditions (OECD, 2014c). However, recent changes have not, in general, introduced automatic triggers which would help enhancing the counter-cyclicality of unemployment benefits and improve their stabilisation function, while containing expenditure in times of expansion and avoiding possible traps. It is also clear that, while discretionary measures can be effective, their timing is not always optimal, underlining the case for a greater use of automatic triggers.
(83) Based on MISSOC.
Table 3: Family benefits, indexation mechanism changes 2007–13
201320
07
No indexationAutomatic indexation
(lag)
Automatic indexation
(more timely)Discretionary indexation
No indexation AT, EE, LV, LU, PL, ESAutomatic indexation
(lag)IE
BE, CY*, CZ, DK, FI, HU, IT,
LT*, NLSI
Automatic indexation
(more timely)FR
Discretionary
indexationEL BG, DE, MT, PT, SK, SE, UK
Source: MISSOC.
Notes: * adjusted in CPI increase more than 1.1. gif

74
Employment and Social Developments in Europe 2014
4.5. The development in the financing of social protection: risks and opportunities
The share of social security contributions in the financing of social protection has decreased for both cyclical and structural reasons
Tax-benefit systems work as automatic sta-bilisers, which meant that they had a positive effect in terms of maintaining gross house-hold disposable income in all Member States in the first phase of the crisis. However, this also represented a further challenge to gov-ernment financing as tax revenues declined in line with falling GDP, while expenditure levels did not, although the overall impact of these different adjustments on govern-ment budgets varied greatly between Mem-ber States (Mourre et al., 2013).
Social transfers played an important role throughout Europe (Dolls, 2012) and, dur-ing the first phase of the crisis, the contribu-tion of social transfers to Gross Household Disposable Income was three times greater than taxes, while taxes did not play an effec-tive stabilising role in all Member States (European Commission, 2013a ( 84)). Social security contributions are estimated to be less sensitive to the cycle than indirect taxes, while personal and corporate income taxes are the most sensitive (Mourre et al., 2013).
The crisis accelerated the declining impor-tance of social security contributions in the financing of social protection, although the
(84) See Chapter 6 of European Commission, 2013a.
trend changed in 2011 in the EA-18 Mem-ber States (Chart 53). Those Member States with the option of earmarking taxes have used it to balance the effects of the reduced financing of social protection from social security contributions, but currently only six Member States have this facility ( 85). The sharp decline in the financing of social pro-tection from social security contributions in 2009 was mostly due to cyclical factors but structural factors also contributed.
Indeed, changes in social protection financ-ing did not affect all benefits equally, nor all tax sources with the decreasing impor-tance of social security contributions in total receipts being mostly caused by a declining share of social security contribu-tions being funded by levies on employers (Social Protection Committee, 2014). The shift in financing between 2007 and 2011 was concentrated on pensions and, to a lesser extent, health, while no clear trends are observed in the financing of family and
(85) In Germany the shift from social security contributions to VAT was only politically earmarked.
unemployment benefits (Social Protection Committee, 2014).
In the context of increased pressure on the level of deficits, Member States were recom-mended to shift taxation away from labour, and in particular social security contribution, towards less growth-hampering tax bases such as consumption and property (Euro-pean Commission, 2013g; European Com-mission, 2013h). In 2014, Belgium, Germany, France, Italy, Latvia, Austria, Czech Republic, Spain and, implicitly, France and Germany received a Country Specific Recommenda-tion on shifting the tax burden away from labour, while Hungary and Romania have been recommended to lower the tax burden on labour and NL to reduce tax disincen-tives on labour. Since the beginning of the crisis, Bulgaria, Czech Republic, Denmark, Germany, France, Latvia, the Netherlands, Slovenia, Finland, Sweden and the United Kingdom have reduced the tax wedge on low wage earners ( 86).
(86) The source of this data is the ECFIN Tax and benefits indicators database based on the change between 2008 and 2013/2012 in the tax wedge for a single person without children, with earnings at 67 % of a full-time production worker.
Chart 53: Trends in financing of social protection
1.4
1.5
1.6
1.7
1.8
2011201020092008200720062005
EA-18EU-27
Rela
tive
impo
rtan
ce o
f so
cial
sec
urity
cont
ribut
ion
in t
he f
inan
cing
of
soci
al p
rote
ctio
nw
ith r
espe
ct t
o ge
nera
l tax
atio
n (r
atio
)
Source: ESSPROS.
Chart 54: Trend in the financing of social protection in Spain and Germany
Spain
0.6
0.7
0.8
0.9
1.0
1.1
1.2
2011201020092008200720062005
Evol
utio
n -
base
yea
r 20
05
0.6
0.7
0.8
0.9
1.0
1.1
1.2
2011201020092008200720062005
Germany
GDP
Relative importance of social security contribution in the financing of social protection with respect to general taxation (ratio)Ev
olut
ion
- ba
se y
ear
2005
Source: ESSPROS and National Accounts.
Note: Index year is 2005.
exce
l file
gif
exce
l file
gif
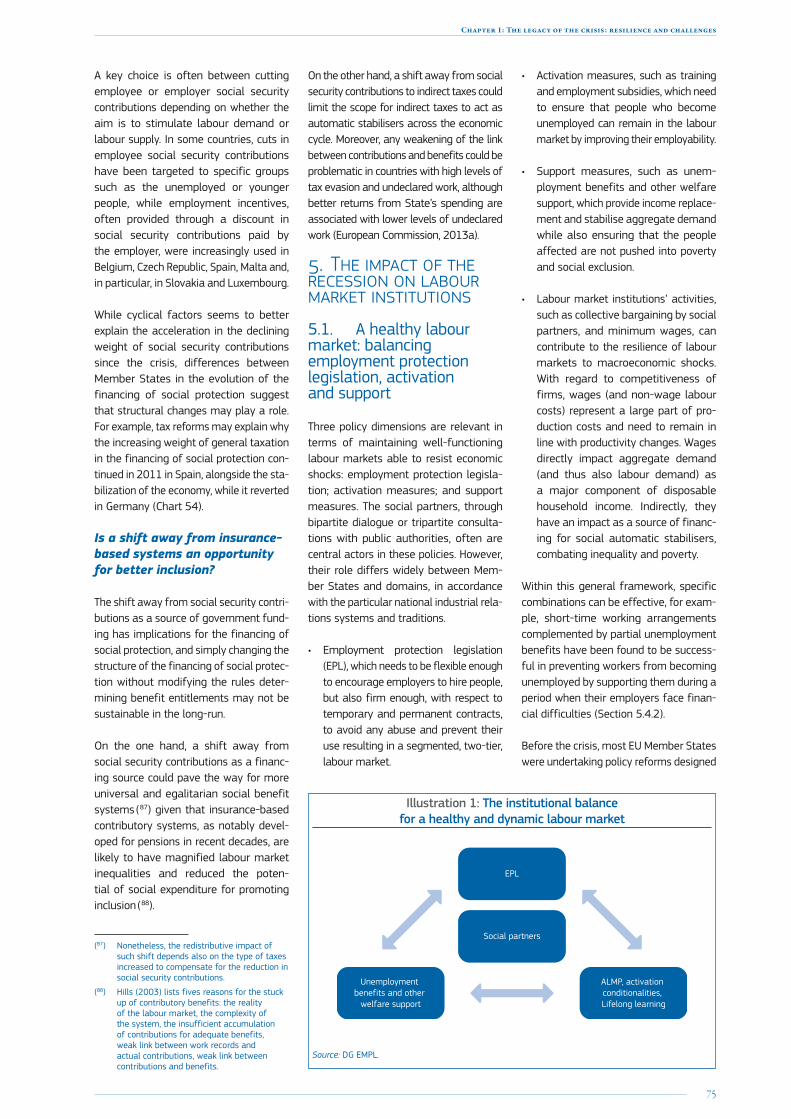
75
Chapter 1: The legacy of the crisis: resilience and challenges
A key choice is often between cutting employee or employer social security contributions depending on whether the aim is to stimulate labour demand or labour supply. In some countries, cuts in employee social security contributions have been targeted to specific groups such as the unemployed or younger people, while employment incentives, often provided through a discount in social security contributions paid by the employer, were increasingly used in Belgium, Czech Republic, Spain, Malta and, in particular, in Slovakia and Luxembourg.
While cyclical factors seems to better explain the acceleration in the declining weight of social security contributions since the crisis, differences between Member States in the evolution of the financing of social protection suggest that structural changes may play a role. For example, tax reforms may explain why the increasing weight of general taxation in the financing of social protection con-tinued in 2011 in Spain, alongside the sta-bilization of the economy, while it reverted in Germany (Chart 54).
Is a shift away from insurance-based systems an opportunity for better inclusion?
The shift away from social security contri-butions as a source of government fund-ing has implications for the financing of social protection, and simply changing the structure of the financing of social protec-tion without modifying the rules deter-mining benefit entitlements may not be sustainable in the long-run.
On the one hand, a shift away from social security contributions as a financ-ing source could pave the way for more universal and egalitarian social benefit systems ( 87) given that insurance-based contributory systems, as notably devel-oped for pensions in recent decades, are likely to have magnified labour market inequalities and reduced the poten-tial of social expenditure for promoting inclusion ( 88).
(87) Nonetheless, the redistributive impact of such shift depends also on the type of taxes increased to compensate for the reduction in social security contributions.
(88) Hills (2003) lists fives reasons for the stuck up of contributory benefits: the reality of the labour market, the complexity of the system, the insufficient accumulation of contributions for adequate benefits, weak link between work records and actual contributions, weak link between contributions and benefits.
On the other hand, a shift away from social security contributions to indirect taxes could limit the scope for indirect taxes to act as automatic stabilisers across the economic cycle. Moreover, any weakening of the link between contributions and benefits could be problematic in countries with high levels of tax evasion and undeclared work, although better returns from State’s spending are associated with lower levels of undeclared work (European Commission, 2013a).
5. The impact of the recession on labour market institutions
5.1. A healthy labour market: balancing employment protection legislation, activation and support
Three policy dimensions are relevant in terms of maintaining well-functioning labour markets able to resist economic shocks: employment protection legisla-tion; activation measures; and support measures. The social partners, through bipartite dialogue or tripartite consulta-tions with public authorities, often are central actors in these policies. However, their role differs widely between Mem-ber States and domains, in accordance with the particular national industrial rela-tions systems and traditions.
• Employment protection legislation (EPL), which needs to be flexible enough to encourage employers to hire people, but also firm enough, with respect to temporary and permanent contracts, to avoid any abuse and prevent their use resulting in a segmented, two-tier, labour market.
• Activation measures, such as training and employment subsidies, which need to ensure that people who become unemployed can remain in the labour market by improving their employability.
• Support measures, such as unem-ployment benefits and other welfare support, which provide income replace-ment and stabilise aggregate demand while also ensuring that the people affected are not pushed into poverty and social exclusion.
• Labour market institutions’ activities, such as collective bargaining by social partners, and minimum wages, can contribute to the resilience of labour markets to macroeconomic shocks. With regard to competitiveness of firms, wages (and non-wage labour costs) represent a large part of pro-duction costs and need to remain in line with productivity changes. Wages directly impact aggregate demand (and thus also labour demand) as a major component of disposable household income. Indirectly, they have an impact as a source of financ-ing for social automatic stabilisers, combating inequality and poverty.
Within this general framework, specific combinations can be effective, for exam-ple, short-time working arrangements complemented by partial unemployment benefits have been found to be success-ful in preventing workers from becoming unemployed by supporting them during a period when their employers face finan-cial difficulties (Section 5.4.2).
Illustration 1: The institutional balance for a healthy and dynamic labour market
ALMP, activation conditionalities, Lifelong learning
Social partners
EPL
Unemployment benefits and other
welfare support
Source: DG EMPL.
Before the crisis, most EU Member States were undertaking policy reforms designed
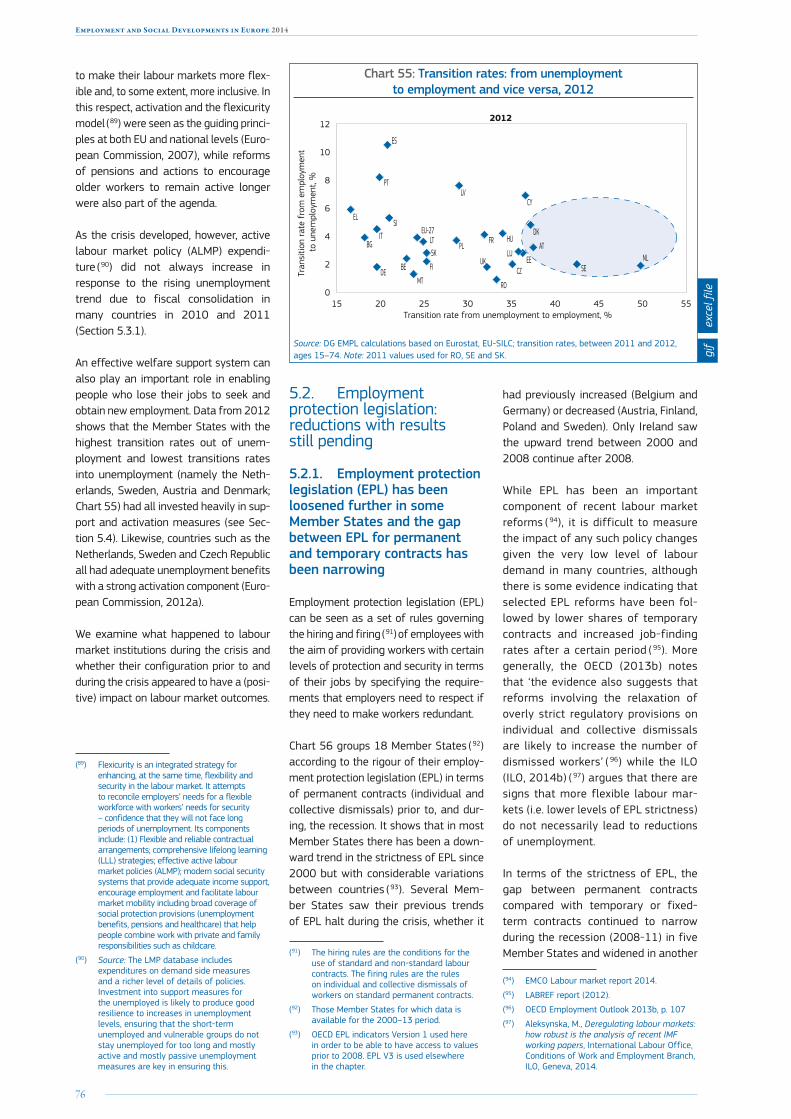
76
Employment and Social Developments in Europe 2014
to make their labour markets more flex-ible and, to some extent, more inclusive. In this respect, activation and the flexicurity model ( 89) were seen as the guiding princi-ples at both EU and national levels (Euro-pean Commission, 2007), while reforms of pensions and actions to encourage older workers to remain active longer were also part of the agenda.
As the crisis developed, however, active labour market policy (ALMP) expendi-ture ( 90) did not always increase in response to the rising unemployment trend due to fiscal consolidation in many countries in 2010 and 2011 (Section 5.3.1).
An effective welfare support system can also play an important role in enabling people who lose their jobs to seek and obtain new employment. Data from 2012 shows that the Member States with the highest transition rates out of unem-ployment and lowest transitions rates into unemployment (namely the Neth-erlands, Sweden, Austria and Denmark; Chart 55) had all invested heavily in sup-port and activation measures (see Sec-tion 5.4). Likewise, countries such as the Netherlands, Sweden and Czech Republic all had adequate unemployment benefits with a strong activation component (Euro-pean Commission, 2012a).
We examine what happened to labour market institutions during the crisis and whether their configuration prior to and during the crisis appeared to have a (posi-tive) impact on labour market outcomes.
(89) Flexicurity is an integrated strategy for enhancing, at the same time, flexibility and security in the labour market. It attempts to reconcile employers’ needs for a flexible workforce with workers’ needs for security – confidence that they will not face long periods of unemployment. Its components include: (1) Flexible and reliable contractual arrangements; comprehensive lifelong learning (LLL) strategies; effective active labour market policies (ALMP); modern social security systems that provide adequate income support, encourage employment and facilitate labour market mobility including broad coverage of social protection provisions (unemployment benefits, pensions and healthcare) that help people combine work with private and family responsibilities such as childcare.
(90) Source: The LMP database includes expenditures on demand side measures and a richer level of details of policies. Investment into support measures for the unemployed is likely to produce good resilience to increases in unemployment levels, ensuring that the short-term unemployed and vulnerable groups do not stay unemployed for too long and mostly active and mostly passive unemployment measures are key in ensuring this.
Chart 55: Transition rates: from unemployment to employment and vice versa, 2012
HU
EE
LV
SI
NLFI
PL
DEMT
PT
LTLU
BE
AT
DKEU-27
SE
ES
CZUK
IT
CY
FR
RO
BG
EL
SK
Tran
sitio
n ra
te f
rom
em
ploy
men
t to
une
mpl
oym
ent,
%Transition rate from unemployment to employment, %
2012
15 20 25 30 35 40 45 50 550
2
4
6
8
10
12
Source: DG EMPL calculations based on Eurostat, EU-SILC; transition rates, between 2011 and 2012, ages 15–74. Note: 2011 values used for RO, SE and SK.
5.2. Employment protection legislation: reductions with results still pending
5.2.1. Employment protection legislation (EPL) has been loosened further in some Member States and the gap between EPL for permanent and temporary contracts has been narrowing
Employment protection legislation (EPL) can be seen as a set of rules governing the hiring and firing ( 91) of employees with the aim of providing workers with certain levels of protection and security in terms of their jobs by specifying the require-ments that employers need to respect if they need to make workers redundant.
Chart 56 groups 18 Member States ( 92) according to the rigour of their employ-ment protection legislation (EPL) in terms of permanent contracts (individual and collective dismissals) prior to, and dur-ing, the recession. It shows that in most Member States there has been a down-ward trend in the strictness of EPL since 2000 but with considerable variations between countries ( 93). Several Mem-ber States saw their previous trends of EPL halt during the crisis, whether it
(91) The hiring rules are the conditions for the use of standard and non-standard labour contracts. The firing rules are the rules on individual and collective dismissals of workers on standard permanent contracts.
(92) Those Member States for which data is available for the 2000–13 period.
(93) OECD EPL indicators Version 1 used here in order to be able to have access to values prior to 2008. EPL V3 is used elsewhere in the chapter.
had previously increased (Belgium and Germany) or decreased (Austria, Finland, Poland and Sweden). Only Ireland saw the upward trend between 2000 and 2008 continue after 2008.
While EPL has been an important component of recent labour market reforms ( 94), it is difficult to measure the impact of any such policy changes given the very low level of labour demand in many countries, although there is some evidence indicating that selected EPL reforms have been fol-lowed by lower shares of temporary contracts and increased job-finding rates after a certain period ( 95). More generally, the OECD (2013b) notes that ‘the evidence also suggests that reforms involving the relaxation of overly strict regulatory provisions on individual and collective dismissals are likely to increase the number of dismissed workers’ ( 96) while the ILO (ILO, 2014b) ( 97) argues that there are signs that more flexible labour mar-kets (i.e. lower levels of EPL strictness) do not necessarily lead to reductions of unemployment.
In terms of the strictness of EPL, the gap between permanent contracts compared with temporary or fixed-term contracts continued to narrow during the recession (2008-11) in five Member States and widened in another
(94) EMCO Labour market report 2014.
(95) LABREF report (2012).
(96) OECD Employment Outlook 2013b, p. 107
(97) Aleksynska, M., Deregulating labour markets: how robust is the analysis of recent IMF working papers, International Labour Office, Conditions of Work and Employment Branch, ILO, Geneva, 2014.
exce
l file
gif
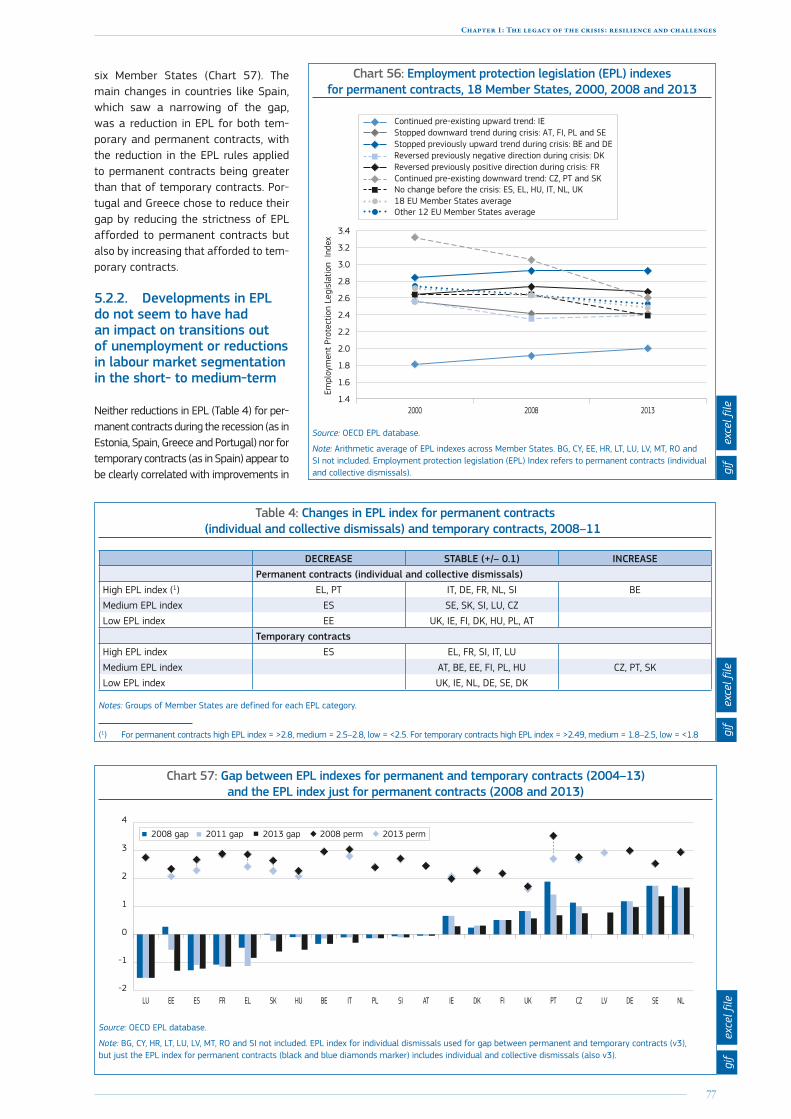
77
Chapter 1: The legacy of the crisis: resilience and challenges
six Member States (Chart 57). The main changes in countries like Spain, which saw a narrowing of the gap, was a reduction in EPL for both tem-porary and permanent contracts, with the reduction in the EPL rules applied to permanent contracts being greater than that of temporary contracts. Por-tugal and Greece chose to reduce their gap by reducing the strictness of EPL afforded to permanent contracts but also by increasing that afforded to tem-porary contracts.
Chart 56: Employment protection legislation (EPL) indexes for permanent contracts, 18 Member States, 2000, 2008 and 2013
1.4
1.6
1.8
2.0
2.2
2.4
2.6
2.8
3.0
3.2
3.4
Continued pre-existing upward trend: IEStopped downward trend during crisis: AT, FI, PL and SEStopped previously upward trend during crisis: BE and DEReversed previously negative direction during crisis: DKReversed previously positive direction during crisis: FRContinued pre-existing downward trend: CZ, PT and SK
Other 12 EU Member States average
No change before the crisis: ES, EL, HU, IT, NL, UK18 EU Member States average
201320082000
Empl
oym
ent
Prot
ectio
n Le
gisl
atio
n In
dex
Source: OECD EPL database.
Note: Arithmetic average of EPL indexes across Member States. BG, CY, EE, HR, LT, LU, LV, MT, RO and SI not included. Employment protection legislation (EPL) Index refers to permanent contracts (individual and collective dismissals).
Table 4: Changes in EPL index for permanent contracts (individual and collective dismissals) and temporary contracts, 2008–11
DECREASE STABLE (+/– 0.1) INCREASEPermanent contracts (individual and collective dismissals)
High EPL index (1) EL, PT IT, DE, FR, NL, SI BEMedium EPL index ES SE, SK, SI, LU, CZLow EPL index EE UK, IE, FI, DK, HU, PL, AT
Temporary contractsHigh EPL index ES EL, FR, SI, IT, LU Medium EPL index AT, BE, EE, FI, PL, HU CZ, PT, SKLow EPL index UK, IE, NL, DE, SE, DK
Notes: Groups of Member States are defined for each EPL category.
(1) For permanent contracts high EPL index = >2.8, medium = 2.5–2.8, low = <2.5. For temporary contracts high EPL index = >2.49, medium = 1.8–2.5, low = <1.8
Chart 57: Gap between EPL indexes for permanent and temporary contracts (2004–13) and the EPL index just for permanent contracts (2008 and 2013)
-2
-1
0
1
2
3
4
NLSEDELVCZPTUKFIDKIEATSIPLITBEHUSKELFRESEELU
2008 gap 2011 gap 2013 gap 2008 perm 2013 perm
Source: OECD EPL database.
Note: BG, CY, HR, LT, LU, LV, MT, RO and SI not included. EPL index for individual dismissals used for gap between permanent and temporary contracts (v3), but just the EPL index for permanent contracts (black and blue diamonds marker) includes individual and collective dismissals (also v3).
5.2.2. Developments in EPL do not seem to have had an impact on transitions out of unemployment or reductions in labour market segmentation in the short- to medium-term
Neither reductions in EPL (Table 4) for per-manent contracts during the recession (as in Estonia, Spain, Greece and Portugal) nor for temporary contracts (as in Spain) appear to be clearly correlated with improvements in
exce
l file
gif
exce
l file
gif
exce
l file
gif

78
Employment and Social Developments in Europe 2014
the transition from unemployment to per-manent or temporary contracts (Chart 58), again underlining the uncertain impact of EPL reforms during a period of weak labour demand and in the short- to medium-term ( 98). Others who increased their EPL for permanent contracts (e.g. Belgium) saw an increase in transitions out of unemployment
(98) Some mild signs of improvement exist when looking at the transitions to permanent employment in 2010-12 for Estonia and in 2010-11 for Portugal.
and into permanent contracts. Nevertheless, there are signs that EPL levels prior to the recession had an impact on the level of the transition rates out of unemployment into permanent employment (r= -0.53, r2= 0.28), with the average transition rates by country (when grouped by EPL levels as illustrated by the green lines in the graph) seem to be better for those with lower EPL.
Despite the narrowing of the EPL gap and the 2012 labour market reforms, there
have been limited signs of an improvement in transition rate out of unemployment in Spain (Chart 5 in Section 2.1). Neverthe-less, some post-reform improvements were seen in 2012 in terms of exit out of unemployment when a distinction is made according to length of unemployment (less than 6 months, 7–12 months, and more than 12 months), and between exits to temporary and permanent contracts ( 99).
(99) OECD (2013b).
Chart 58: Transition rate from unemployment to permanent or temporary employment%
une
mpl
oyed
yea
r be
fore
0
5
10
15
20
25
30
35
40
45
50
EU-27CYLTROBGMTHRLVFRNLBEDEPTITELCZLUSESKSIESDKEEATUKHUFIPL
Low EPL for permanent 1.6 - 2.5
Medium EPL for permanent 2.5 - 2.8
High EPL for permanent >2.8
No EPL index
2012
20082010
To permanent employment
% u
nem
ploy
ed y
ear
befo
re
0
5
10
15
20
25
30
35
EU-27HRCYMTBGROLTLUFRSIESITELPLCZPTSKHUATBEFIEENLSEDKDELVUK
Low EPL for temporary0.3 - 1.8
Medium EPL for temporary1.8 - 2.49
High EPL for temporary>2.5
No EPL index
2012
20082010
To temporary employment
Source: Eurostat, EU-SILC.
Note: The ranking according to EPL level was done using 2008 values, except for LV for which 2012 value was the earliest one available. 2011 value used instead of 2012 for PL, PT, HR, SK, SE, RO, HU and CY. No data available for IE. Reductions of EPL in 2008-11 period indicated by the white bars.
Box4: Mind the Gap: Employment Protection Legislation (EPL) Index for Permanent and Temporary contracts
The EPL index measures the strictness of the employment protection afforded to permanent or temporary contracts. However, the strictness that is measured by this index does not measure protection in the same way for the two forms of contract. For example, the EPL index for temporary contracts does not measure the ease of dismissing a worker, whereas the EPL index for permanent con-tracts focuses primarily on this aspect. On the other hand, the EPL index for temporary contracts focuses on matters such as: when fixed-term contracts are allowed to be used; how many are allowed to run consecutively; and rules concerning agency work — none of which are measured in the index for permanent contracts.
Given the methodological differences in their calculation, care needs to be taken when seeking to interpret or compare the two indices in terms of the protection they afford.
It is somewhat more justifiable to compare the two indexes as a measure of the strictness of the employment protection legislation relating to temporary and permanent contracts. In this case the gap between the two EPL indexes can be seen in terms of the differ-ence in strictness or complexity that an employer must deal with when faced with these two types of contracts. Hence, examining the gap can serve a purpose in terms of seeing whether the reform of employment protection legislation across countries prevents labour segmentation, assuming that smaller gaps between the two indexes shows a reduced distinction between the two types of contracts.
exce
l file
gif
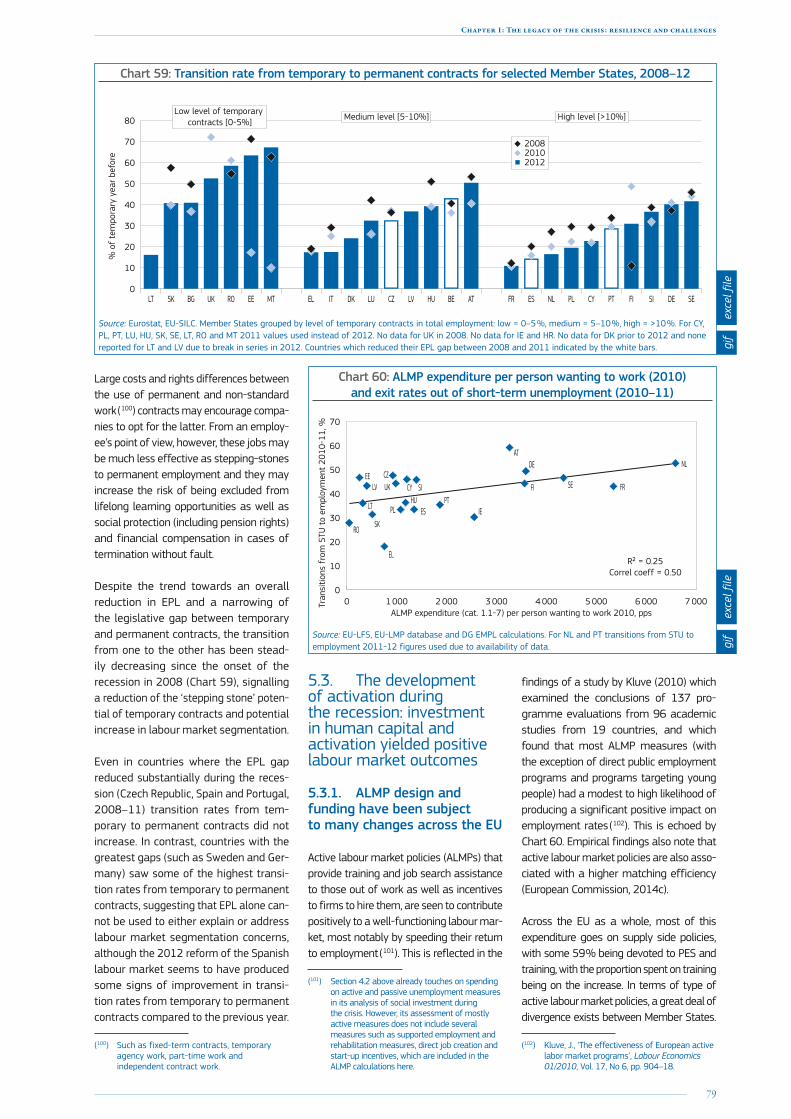
79
Chapter 1: The legacy of the crisis: resilience and challenges
Large costs and rights differences between the use of permanent and non-standard work ( 100) contracts may encourage compa-nies to opt for the latter. From an employ-ee’s point of view, however, these jobs may be much less effective as stepping-stones to permanent employment and they may increase the risk of being excluded from lifelong learning opportunities as well as social protection (including pension rights) and financial compensation in cases of termination without fault.
Despite the trend towards an overall reduction in EPL and a narrowing of the legislative gap between temporary and permanent contracts, the transition from one to the other has been stead-ily decreasing since the onset of the recession in 2008 (Chart 59), signalling a reduction of the ‘stepping stone’ poten-tial of temporary contracts and potential increase in labour market segmentation.
Even in countries where the EPL gap reduced substantially during the reces-sion (Czech Republic, Spain and Portugal, 2008–11) transition rates from tem-porary to permanent contracts did not increase. In contrast, countries with the greatest gaps (such as Sweden and Ger-many) saw some of the highest transi-tion rates from temporary to permanent contracts, suggesting that EPL alone can-not be used to either explain or address labour market segmentation concerns, although the 2012 reform of the Spanish labour market seems to have produced some signs of improvement in transi-tion rates from temporary to permanent contracts compared to the previous year.
(100) Such as fixed-term contracts, temporary agency work, part-time work and independent contract work.
Chart 59: Transition rate from temporary to permanent contracts for selected Member States, 2008–12
% o
f te
mpo
rary
yea
r be
fore
0
10
20
30
40
50
60
70
80
SEDESIFIPTCYPLNLESFRATBEHULVCZLUDKITELMTEEROUKBGSKLT
201220102008
Low level of temporary contracts [0-5%]
Medium level [5-10%] High level [>10%]
Source: Eurostat, EU-SILC. Member States grouped by level of temporary contracts in total employment: low = 0–5 %, medium = 5–10 %, high = >10 %. For CY, PL, PT, LU, HU, SK, SE, LT, RO and MT 2011 values used instead of 2012. No data for UK in 2008. No data for IE and HR. No data for DK prior to 2012 and none reported for LT and LV due to break in series in 2012. Countries which reduced their EPL gap between 2008 and 2011 indicated by the white bars.
Chart 60: ALMP expenditure per person wanting to work (2010) and exit rates out of short-term unemployment (2010–11)
ALMP expenditure (cat. 1.1-7) per person wanting to work 2010, pps
Tran
sitio
ns f
rom
STU
to
empl
oym
ent
2010
-11,
%
NL
LVPT
FIHU
EE
PL
CY
LT IE
EL
ES
CZDE
FR
AT
RO
SI
SK
SEUK
0 1 000 2 000 3 000 4 000 5 000 6 000 7 0000
10
20
30
40
50
60
70
R² = 0.25Correl coeff = 0.50
Source: EU-LFS, EU-LMP database and DG EMPL calculations. For NL and PT transitions from STU to employment 2011-12 figures used due to availability of data.
5.3. The development of activation during the recession: investment in human capital and activation yielded positive labour market outcomes
5.3.1. ALMP design and funding have been subject to many changes across the EU
Active labour market policies (ALMPs) that provide training and job search assistance to those out of work as well as incentives to firms to hire them, are seen to contribute positively to a well-functioning labour mar-ket, most notably by speeding their return to employment ( 101). This is reflected in the
(101) Section 4.2 above already touches on spending on active and passive unemployment measures in its analysis of social investment during the crisis. However, its assessment of mostly active measures does not include several measures such as supported employment and rehabilitation measures, direct job creation and start-up incentives, which are included in the ALMP calculations here.
findings of a study by Kluve (2010) which examined the conclusions of 137 pro-gramme evaluations from 96 academic studies from 19 countries, and which found that most ALMP measures (with the exception of direct public employment programs and programs targeting young people) had a modest to high likelihood of producing a significant positive impact on employment rates ( 102). This is echoed by Chart 60. Empirical findings also note that active labour market policies are also asso-ciated with a higher matching efficiency ( European Commission, 2014c).
Across the EU as a whole, most of this expenditure goes on supply side policies, with some 59 % being devoted to PES and training, with the proportion spent on training being on the increase. In terms of type of active labour market policies, a great deal of divergence exists between Member States.
(102) Kluve, J., ‘The effectiveness of European active labor market programs’, Labour Economics 01/2010, Vol. 17, No 6, pp. 904–18.
exce
l file
gif
exce
l file
gif
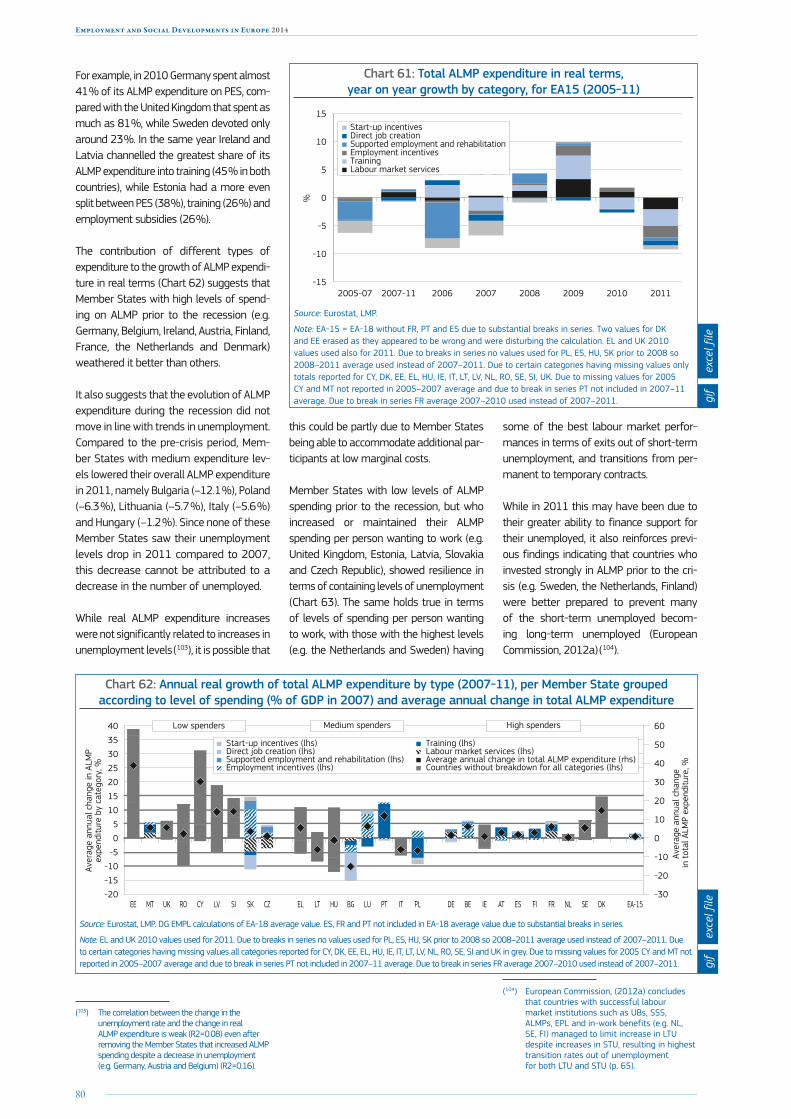
80
Employment and Social Developments in Europe 2014
For example, in 2010 Germany spent almost 41 % of its ALMP expenditure on PES, com-pared with the United Kingdom that spent as much as 81 %, while Sweden devoted only around 23 %. In the same year Ireland and Latvia channelled the greatest share of its ALMP expenditure into training (45 % in both countries), while Estonia had a more even split between PES (38 %), training (26 %) and employment subsidies (26 %).
The contribution of different types of expenditure to the growth of ALMP expendi-ture in real terms (Chart 62) suggests that Member States with high levels of spend-ing on ALMP prior to the recession (e.g. Germany, Belgium, Ireland, Austria, Finland, France, the Netherlands and Denmark) weathered it better than others.
It also suggests that the evolution of ALMP expenditure during the recession did not move in line with trends in unemployment. Compared to the pre-crisis period, Mem-ber States with medium expenditure lev-els lowered their overall ALMP expenditure in 2011, namely Bulgaria (–12.1 %), Poland (–6.3 %), Lithuania (–5.7 %), Italy (–5.6 %) and Hungary (–1.2 %). Since none of these Member States saw their unemployment levels drop in 2011 compared to 2007, this decrease cannot be attributed to a decrease in the number of unemployed.
While real ALMP expenditure increases were not significantly related to increases in unemployment levels ( 103), it is possible that
(103) The correlation between the change in the unemployment rate and the change in real ALMP expenditure is weak (R2=0.08) even after removing the Member States that increased ALMP spending despite a decrease in unemployment (e.g. Germany, Austria and Belgium) (R2=0.16).
this could be partly due to Member States being able to accommodate additional par-ticipants at low marginal costs.
Member States with low levels of ALMP spending prior to the recession, but who increased or maintained their ALMP spending per person wanting to work (e.g. United Kingdom, Estonia, Latvia, Slovakia and Czech Republic), showed resilience in terms of containing levels of unemployment (Chart 63). The same holds true in terms of levels of spending per person wanting to work, with those with the highest levels (e.g. the Netherlands and Sweden) having
some of the best labour market perfor-mances in terms of exits out of short-term unemployment, and transitions from per-manent to temporary contracts.
While in 2011 this may have been due to their greater ability to finance support for their unemployed, it also reinforces previ-ous findings indicating that countries who invested strongly in ALMP prior to the cri-sis (e.g. Sweden, the Netherlands, Finland) were better prepared to prevent many of the short-term unemployed becom-ing long-term unemployed (European Commission, 2012a) ( 104).
(104) European Commission, (2012a) concludes that countries with successful labour market institutions such as UBs, SSS, ALMPs, EPL and in-work benefits (e.g. NL, SE, FI) managed to limit increase in LTU despite increases in STU, resulting in highest transition rates out of unemployment for both LTU and STU (p. 65).
Chart 61: Total ALMP expenditure in real terms, year on year growth by category, for EA15 (2005-11)
-15
-10
-5
0%
5
10
15
2011201020092008200720062007-112005-07
Start-up incentivesDirect job creationSupported employment and rehabilitationEmployment incentivesTrainingLabour market services
Source: Eurostat, LMP.
Note: EA-15 = EA-18 without FR, PT and ES due to substantial breaks in series. Two values for DK and EE erased as they appeared to be wrong and were disturbing the calculation. EL and UK 2010 values used also for 2011. Due to breaks in series no values used for PL, ES, HU, SK prior to 2008 so 2008–2011 average used instead of 2007–2011. Due to certain categories having missing values only totals reported for CY, DK, EE, EL, HU, IE, IT, LT, LV, NL, RO, SE, SI, UK. Due to missing values for 2005 CY and MT not reported in 2005–2007 average and due to break in series PT not included in 2007–11 average. Due to break in series FR average 2007–2010 used instead of 2007–2011.
Chart 62: Annual real growth of total ALMP expenditure by type (2007-11), per Member State grouped according to level of spending (% of GDP in 2007) and average annual change in total ALMP expenditure
Aver
age
annu
al c
hang
e in
ALM
P ex
pend
iture
by
cate
gory
, %
Aver
age
annu
al c
hang
e in
tot
al A
LMP
expe
nditu
re, %
-20
-15
-10
-5
0
5
10
15
20
25
30
35
40
EA-15DKSENLFRFIESATIEBEDEPLITPTLUBGHULTELCZSKSILVCYROUKMTEE-30
-20
-10
0
10
20
30
40
50
60
Start-up incentives (lhs)Direct job creation (lhs)Supported employment and rehabilitation (lhs)Employment incentives (lhs)
Training (lhs)Labour market services (lhs)Average annual change in total ALMP expenditure (rhs)Countries without breakdown for all categories (lhs)
Low spenders Medium spenders High spenders
Source: Eurostat, LMP. DG EMPL calculations of EA-18 average value. ES, FR and PT not included in EA-18 average value due to substantial breaks in series.
Note: EL and UK 2010 values used for 2011. Due to breaks in series no values used for PL, ES, HU, SK prior to 2008 so 2008–2011 average used instead of 2007–2011. Due to certain categories having missing values all categories reported for CY, DK, EE, EL, HU, IE, IT, LT, LV, NL, RO, SE, SI and UK in grey. Due to missing values for 2005 CY and MT not reported in 2005–2007 average and due to break in series PT not included in 2007–11 average. Due to break in series FR average 2007–2010 used instead of 2007–2011.
exce
l file
gif
exce
l file
gif

81
Chapter 1: The legacy of the crisis: resilience and challenges
Chart 63: Average expenditure on active labour market policies (ALMP) including PES client services, per person
wanting to work (in PPS) and growth of real ALMP expenditure per person wanting to work (2007–11)
-80 -60 -40 -20 0 20 40 60 80 100 1200
1 000
2 000
3 000
4 000
5 000
6 000
7 000
8 000
LV
NL
PT
FI
HUEEPL
CY
LT
ESCZ
UK
DE
FR
AT
RO SISK
SE
ALM
P ex
pend
iture
per
per
son
wan
ting
to w
ork
2011
, pps
Change in real ALMP expenditure per person wanting to work 2007-11, %
The size of the bubble represents the average value of the rate of exits out of STU and transition rate from temporary to permanent contracts in 2012
WorstMediumBest
Source: Eurostat, LMP.
Note: No data for BG, DK, EL, HR, IT and MT for 2007 and 2011, and no data for EE in 2007. The 2010 value is used for UK in 2011. Insufficient data for BE, IE and LU.
5.3.2. Lifelong learning in the EU fell slightly during the recession but has recently recovered with potentially positive implications for exit rates out of unemployment and competitiveness
Lifelong learning, measured in terms of par-ticipation in training and education in the previous four weeks, increased relative to periods before the recession, with higher rates in 2013 than in 2008, apart from a slight dip in 2011 (Chart 64). Countries with higher levels of participation in lifelong learning for both the employed and unem-ployed (e.g. Sweden, the Netherlands, United Kingdom, Austria, Denmark) also had bet-ter labour market performances in terms of higher transition rates out of unemployment and lower transition rates from employment into unemployment (Chart 55).
Chart 64: Participation rate in education and training (lifelong learning) (last four weeks) of employed (2008, 2011 and 2013), unemployed (2011) and inactive persons (2011) aged 25–64 in selected countries
0
5
10
15
20
25
30
35
40
45
*DK*SE*FI*FR*NL*UK*LU*ATSIEEEU-28CZESPTMT*DECY*BELVLTIEITPLSKHUEL
2008 empl 2011 empl 2013 empl 2011 unemployed 2011 inactive
% o
f pe
ople
par
ticip
atin
g in
life
long
lear
ning
by
labo
ur s
tatu
s
Source: Lifelong learning data from Eurostat (trng_lfs_02); Member States indicated by * are among the top 25 most competitive countries in the world in 2013, according to the competitiveness ranking from Global Competitiveness Index 2013–14 from the World Economic Forum. Due to breaks in series no data reported for 2008 for CZ, LV, LU, NL and PT, and no data reported for 2008 and 2011 for FR.
Chart 65: Change in real ALMP expenditure on training (%) 2007–11
-150
-100
-50
0
50
100
150
200
250
EECYLVSIMTCZIEDKNLFIATESFRUKBEDESEITBGROLUHUELLTPLSK
Change in real expenditure on training as part of ALMP 2007-11
%
Source: Eurostat, LMP database, DG EMPL calculations. No data for PT due to breaks in series. 2010 values used for UK and EL.
This range of evidence supports the view that there is a positive relationship between investing in lifelong learning and tackling unemployment. In this respect the countries that, between 2008 and 2013, had the largest increases in the proportion of their unemployed who undertook lifelong learn-ing were Estonia and Sweden, which saw their unemployment rates fall in 2010–13 with some of the best transitions out of short-term unemployment (see Chart 5).
exce
l file
gif
exce
l file
gif
exce
l file
gif
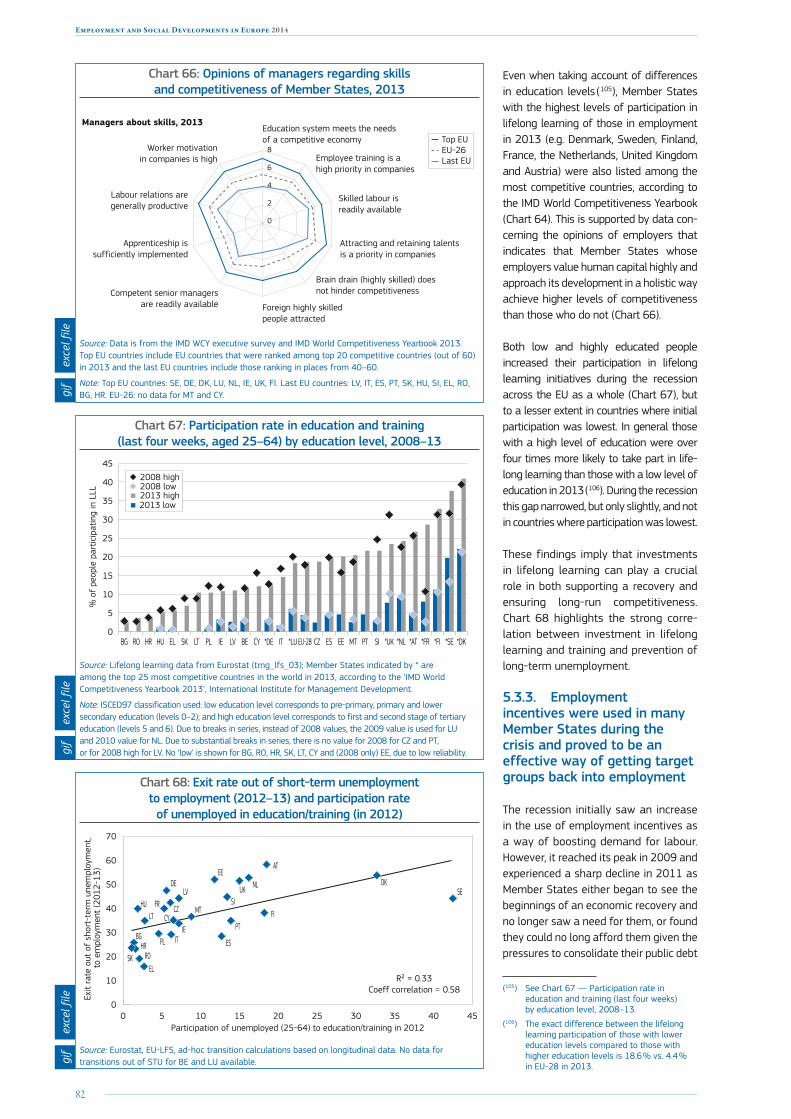
82
Employment and Social Developments in Europe 2014
Chart 66: Opinions of managers regarding skills and competitiveness of Member States, 2013
Top EUEU-26Last EU
2
0
4
6
8Worker motivation in companies is high
Labour relations are generally productive
Apprenticeship is sufficiently implemented
Competent senior managers are readily available Foreign highly skilled
people attracted
Brain drain (highly skilled) does not hinder competitiveness
Attracting and retaining talents is a priority in companies
Skilled labour is readily available
Employee training is a high priority in companies
Education system meets the needs of a competitive economy
Managers about skills, 2013
Source: Data is from the IMD WCY executive survey and IMD World Competitiveness Yearbook 2013. Top EU countries include EU countries that were ranked among top 20 competitive countries (out of 60) in 2013 and the last EU countries include those ranking in places from 40–60.
Note: Top EU countries: SE, DE, DK, LU, NL, IE, UK, FI. Last EU countries: LV, IT, ES, PT, SK, HU, SI, EL, RO, BG, HR. EU-26: no data for MT and CY.
Chart 67: Participation rate in education and training (last four weeks, aged 25–64) by education level, 2008–13
0
5
10
15
20
25
30
35
40
45
*DK*SE*FI*FR*AT*NL*UKSIPTMTEEESCZEU-28*LUIT*DECYBELVIEPLLTSKELHUHRROBG
2013 low
2008 low2008 high
2013 high
% o
f pe
ople
par
ticip
atin
g in
LLL
Source: Lifelong learning data from Eurostat (trng_lfs_03); Member States indicated by * are among the top 25 most competitive countries in the world in 2013, according to the ‘IMD World Competitiveness Yearbook 2013’, International Institute for Management Development.
Note: ISCED97 classification used: low education level corresponds to pre-primary, primary and lower secondary education (levels 0–2); and high education level corresponds to first and second stage of tertiary education (levels 5 and 6). Due to breaks in series, instead of 2008 values, the 2009 value is used for LU and 2010 value for NL. Due to substantial breaks in series, there is no value for 2008 for CZ and PT, or for 2008 high for LV. No ‘low’ is shown for BG, RO, HR, SK, LT, CY and (2008 only) EE, due to low reliability.
Chart 68: Exit rate out of short-term unemployment to employment (2012–13) and participation rate
of unemployed in education/training (in 2012)
Exit
rate
out
of
shor
t-te
rm u
nem
ploy
men
t, t
o em
ploy
men
t (2
012-
13)
Participation of unemployed (25-64) to education/training in 2012
R² = 0.33Coeff correlation = 0.58
0 5 10 15 20 25 30 35 40 450
10
20
30
40
50
60
70
NLLV
PTFI
BG
HU
EE
PLHR
CYLTIE
IT ES
CZ
EL
DKUK
DE
FRMT
AT
RO
SI
SK
SE
Source: Eurostat, EU-LFS, ad-hoc transition calculations based on longitudinal data. No data for transitions out of STU for BE and LU available.
Even when taking account of differences in education levels ( 105), Member States with the highest levels of participation in lifelong learning of those in employment in 2013 (e.g. Denmark, Sweden, Finland, France, the Netherlands, United Kingdom and Austria) were also listed among the most competitive countries, according to the IMD World Competitiveness Yearbook (Chart 64). This is supported by data con-cerning the opinions of employers that indicates that Member States whose employers value human capital highly and approach its development in a holistic way achieve higher levels of competitiveness than those who do not (Chart 66).
Both low and highly educated people increased their participation in lifelong learning initiatives during the recession across the EU as a whole (Chart 67), but to a lesser extent in countries where initial participation was lowest. In general those with a high level of education were over four times more likely to take part in life-long learning than those with a low level of education in 2013 ( 106). During the recession this gap narrowed, but only slightly, and not in countries where participation was lowest.
These findings imply that investments in lifelong learning can play a crucial role in both supporting a recovery and ensuring long-run competitiveness. Chart 68 highlights the strong corre-lation between investment in lifelong learning and training and prevention of long-term unemployment.
5.3.3. Employment incentives were used in many Member States during the crisis and proved to be an effective way of getting target groups back into employment
The recession initially saw an increase in the use of employment incentives as a way of boosting demand for labour. However, it reached its peak in 2009 and experienced a sharp decline in 2011 as Member States either began to see the beginnings of an economic recovery and no longer saw a need for them, or found they could no long afford them given the pressures to consolidate their public debt
(105) See Chart 67 — Participation rate in education and training (last four weeks) by education level, 2008–13.
(106) The exact difference between the lifelong learning participation of those with lower education levels compared to those with higher education levels is 18.6 % vs. 4.4 % in EU-28 in 2013.
exce
l file
gif
exce
l file
gif
exce
l file
gif

83
Chapter 1: The legacy of the crisis: resilience and challenges
levels (Section 5.3.1). Nonetheless, their use relative to other ALMP remained at much the same level as they had been before the recession.
In general, employment incentives in the form of recruitment subsidies are seen to be expensive with their effectiveness depending significantly on their design. In a recent review of studies of a range of ALMPs by the European Employ-ment Observatory (EEO) in 2014, wage subsidies appeared to be one of the most successful techniques in terms of improving the chances of recipients pro-gressing into jobs ( 107). However, Martin and Grubb (2001) had earlier reported that, when evaluations take into account the reaction of firms to the employment subsidies (e.g. deadweight loss, displace-ment, substitution and creaming effects), most programmes only yield small employment gains. Nonetheless, these programmes could have other important functions, such as rotating jobs amongst jobseekers, and ensuring that hard-to-place jobseekers have occasional access to jobs, thereby reducing social exclusion.
The EEO (2014) Review and ECORYS IZA (2012) have both highlighted the criti-cal importance of policy design in deter-mining successful outcomes, while Kluve (2010) found in his large-scale analysis that wage subsidies to private firms and start-up grants were very likely to result in a significantly positive impact on employment rates ( 108).
5.3.4. Job search: relying on public employment services or coping through personal networks
Evidence on the job search techniques used by job seekers tells us that they typically combine several methods; that the search intensity increases with the skill level of the job seekers; and that search intensity decreases with age and the longer people are unemployed. More generally it highlights large national dif-ferences in the type of formal or informal
(107) Stimulating job demand: the design of effective recruitment incentives in Europe, European Employment Observatory Review (EEO Review), 2014
(108) Kluve, J., ‘The effectiveness of European active labor market programs’, Labour Economics 01/2010, Vol. 17, No 6, pp. 904–18.
methods used ( 109) In terms of intensity, higher coverage of unemployment ben-efits, minimum wages and low levels of inequality are associated with greater intensities of job search ( Bachman and Baumgarten, 2012).
Even though direct and informal channels can be very important, half of those who were unemployed in 2013 did contact their public employment services as part of their job-search activity, with this share being somewhat higher among best perform-ers in terms of making the transition from unemployment to employment (Chart 69).
However, people do not only rely on pub-lic employment services and often use their own social networks to find a job. Nearly three-quarters of the unemployed ask friends or relatives when looking for a job, with the share being highest in countries such as Greece, Hungary, Ire-land — which are countries with rela-tively low exit rates out of short-term unemployment. This evidence is also supported and illustrated by the quali-tative analysis (see Annex 3, Extract 7).
(109) In most Mediterranean countries, with the exception of Portugal, direct applications and searches conducted via personal networks are clearly more important than enquiries through public employment offices. The same is also true for Central and Eastern European countries where, apart from Slovakia, the use of direct methods is above the EU average, which may reflect the importance of family ties.
Chart 69: Methods used for seeking work and performance in exits from short-term unemployment, % of people
who declared having used a given method
Study advertisements
Publish or answer advertisements
Ask friends, relatives, trade unions
Apply to employers directly
Contact private employment office
Contact public employment office100
0
5 worst performers (HR, RO, BG, SK, IE)5 best performers (AT, NL, DK, DE, SI)
Source: EU-LFS, 2013.
Note: The performance is captured by ranking Member States across transition from short-term unemployment to employment out of 25 Member States for which the data is available. The 5 best performers are: Austria, the Netherlands, Denmark, Germany and Slovenia. The five worst performers are Croatia, Romania, Bulgaria, Slovakia and Ireland. Results for the transitions from long-term unemployment to employment are not shown but go in the same direction.
At least 18 Member States undertook reforms to their public employment ser-vices during the period 2011 to 2013 (EMCO 2014) with the main aims being to improve targeting (better local deliv-ery, more individualised support, better matching), to extend the reach of the ser-vice (e.g. to better reach the long-term unemployed and marginalised youth), and to improve performance through better monitoring.
The evidence shows that in Mem-ber States with very low levels of expendi-ture dedicated to labour market services (and ALMP in general), the proportion of the unemployed who say that they rely on friends and social networks is highest (see Chart 70). Similarly, in countries that were more impacted by the crisis, including Spain, Italy, Greece and Ireland, searches through informal channels outweigh the use of public employment services.
Comparing the exit rates out of short-term unemployment (Chart 69) and the level of investment in and use of PES (Chart 70), the pattern that emerges is similar to that of ALMP in general, namely that the best performing coun-tries are those which invest the most (e.g. Austria, the Netherlands, Denmark and Germany) and that a high level of contact with public employment services is of limited use unless they have the resources to meet their customer’s needs (e.g. Croatia, Romania, Bulgaria, Slovakia and Ireland).
exce
l file
gif

84
Employment and Social Developments in Europe 2014
Chart 70: PES expenditure per unemployed and methods to find a job
Expenditure in LM services per 1 000 unemployed (Millions Euros)
% o
f un
empl
oyed
who
ask
frie
nds,
rel
ativ
es
or t
rade
uni
ons
to f
ind
a jo
b
0 1 2 3 4 5 6 70
10
20
30
40
50
60
70
80
90
100
NL
HU
DK
DE
AT
SI
SE
UK
LV
PT
FI
EU-28BG
EE
PL
HR
CYLT
IE
LU
ITES
CZ
BE
FRMT
RO
SK
Ask friends, relatives, trade unions
Expenditure in LM services per 1 000 unemployed (Millions Euros)
% o
f un
empl
oyed
who
con
tact
pub
lic
empl
oym
ent
serv
ices
to
find
a jo
b
0 1 2 3 4 5 6 70
10
20
30
40
50
60
70
80
90
100
NL
LVPT FI
EU-28
BG
HU
EE
PL
HR
CY
LT
IE
LU
ITES
CZ
BE
DK
DE
FRMT
AT
RO
SISK
SE
Contact public employment office
Source: LMP, LFS. 2011 expenditure values used for CY, ES, FR, IE, LT, LU, MT, PL, SK. No data available for EL and UK.
5.4. The development of unemployment benefits and short-time working arrangements
5.4.1. Reforms of unemployment benefit systems have included both positive and negative changes
Unemployment benefits serve a dual purpose: they provide direct support for those who suffer a loss of income dur-ing a period of unemployment (which also serves as an automatic financial stabiliser for the economy as a whole), and they help maintain the individual’s continuing employability thus support-ing their re-employment efforts. Nev-ertheless, the type, effective coverage and amount of income support received by the unemployed vary across Mem-ber States, and it does not generally enable them to maintain similar living standards to those they had when they were in work.
When people lose their jobs the first level of protection is unemployment benefits, which are contributory (insurance-based) schemes in most EU Member States. However, variations in eligibility criteria and average time spent in employment, combined with differences in take-up, result in very different levels of receipt of unemployment benefits for the short-term unemployed across Member States, ranging from less than 20 % in Italy, Poland, Slovakia, Bulgaria and Malta to more than 50 % in Belgium, Finland and Germany (Chart 73). In general the receipt of unemployment benefits has a positive relationship with the exit rates out of short-term unemployment.
Chart 71: Coverage rates of unemployment benefits (2010) and exits out of short-term unemployment (2010–11 average)
LV
PT
FI
BG
HU
EE
PL
HR
CY
LT
EL
ITES
CZDK
DEFRMT
AT
RO
SI
SK
SE UK
0 10 20 30 40 50 60 70 800
10
20
30
40
50
60
70
R² = 0.19Coeff correlation = 0.44
Tran
sitio
n ra
te f
rom
STU
to
em
ploy
men
t 201
0-11
, %
Coverage of unemployment benefits for STU 2010, %
Source: EU LFS, DG EMPL calculations. 2012 value used for coverage of UK in 2010. 2011-12 value used for transitions of DE and PT. No data available for BG, IE, LU and NL.
Chart 72: Net replacement rate of unemployment and additional benefits for an unemployed, single person without children, during the early stage of unemployment
and long-term unemployment, year 2012
0
10
20
30
40
50
60
70
80
90
100
CYLVLUBGPTNLCZSIFRSKBEDKDEITESFIEEATIEPLHUSELTUKMTROEL
Initial Phase of unemploymentLong-term unemployed
%
Source: OECD, tax-benefit model.
Note: After tax and including unemployment benefits, social assistance, family and housing benefits in the 60th month of benefit receipt. No data available for CY.
exce
l file
gif
exce
l file
gif
exce
l file
gif

85
Chapter 1: The legacy of the crisis: resilience and challenges
Chart 72 illustrates the amount of ben-efits received by a single person during the early stages of unemployment, and after they have been unemployed for more than 12 months, which shows how replacement rates vary with the dura-tion of unemployment. Such variations between countries are even greater for very long spells of unemployment with many Member States providing only lim-ited support while others maintain high levels of income replacement. Likewise, entitlement rules vary greatly across Member States, whatever the level of benefits, and the share of the unem-ployed who actually receive unemploy-ment benefits, as reported through the EU-LFS, illustrates this diversity.
The level and efficiency of the sup-port provided by unemployment benefit schemes depends on their design and the degree to which they are conditional on engaging in activation measures. Between 2011 and 2013 almost a third of Member States (including Belgium, Spain, Italy, Croatia, Slovenia and United Kingdom) modified their unemployment benefit arrangements primarily by: tight-ening eligibility requirements, reducing the amount of benefits received, intro-ducing means testing, making them conditional on undertaking active job searches and linking the level of ben-efits to the duration of unemployment (EMCO 2014).
These changes impacted more on the long-term unemployed than on the short-term unemployed (Chart 73) with coverage rates in 2013 for the long-term unemployment across the EU as a whole being some 11 pps below pre-crisis levels, although this average outcome resulted from reductions in 12 Mem-ber States against increases in 13 Mem-ber States. This compared with no overall change for the short-term unemployed in the EU as a whole but, again, these results reflect reductions in 8 Mem-ber States and increases in 17 others. Member States with the most generous length of unemployment benefits, such as Belgium, Germany and Finland, saw increased take-up by the unemployed, with increased coverage for the long-term unemployed as they became aware of the possibilities and the need to utilise them due to their prolonged unemploy-ment duration.
Chart 73: Unemployment benefit coverage of short-term and long-term unemployed
0
10
20
30
40
50
60
70
80
90
EU-25ATDEBEFIDKFRESPTEECZLUUKHUELSILVLTCYSEBGHRSKMTPLROIT
201320102007
Short-term unemployed
%
0
10
20
30
40
50
60
70
80
90
100
EU-25ATFIDEBEDKUKFRMTPTESHULULTSEROHRSIELEELVITSKPLBGCYCZ
201320102007
Long-term unemployed
%
Source: Eurostat, EU-LFS, DG EMPL calculations.
Note: IE, HR and NL: not covered. No data for UK in 2010. STU stands for short-term unemployed (less than 12 months) and LTU stands for long-term unemployed (unemployed 12 months or more). EU-25 =EU-28 minus NL, IE, UK (and AT in 2013). The coverage rate is the ratio of the unemployed who received unemployment benefits or assistance and those who did not receive them in each category of unemployment duration (STU and LTU).
Low coverage rates, and low ben-efit rates, not only reflect a lack of
effectiveness of the unemployment ben-efits scheme in protecting people against income shocks, but also imply a limited stabilisation impact on the economy. Likewise, the level of income support will also impact on the effectiveness of activation schemes.
Expansionary measures that increased the opportunity to claim unemployment benefits have included a reduction in the required period of contribution in order to be eligible (e.g. Latvia) and the exten-sion of unemployment benefits to new categories such as non-regular work-ers (e.g. Germany), the self-employed (e.g. Austria), or those who would oth-erwise have exhausted their rights (e.g. Latvia, Spain; ILO, 2014a). Some Member States increased the levels of benefits or provided one-off benefits to some groups (e.g. France, United King-dom). Partial unemployment benefits in order to maintain people in their existing jobs were also introduced (e.g. France,
Germany, the Netherlands and Poland), often following collective bargaining negotiations. Given that these countries are among those whose labour markets proved relatively more resilient to the recession, they highlight the contribu-tion of well-designed unemployment benefit arrangements. In particular, the introduction of partial unemployment benefits is seen to have been an impor-tant policy innovation that helped many Member States weather the recession (ILO 2014a; more detail in Section 5.4.2).
On the other hand, contraction measures taken during the recession included: tightening entitlement condi-tions for unemployment benefits (e.g. Ire-land, United Kingdom); an increase in the number of contributions needed in order to qualify (e.g. Ireland); reductions in the maximum length of period for receiving unemployment benefits (e.g. Czech Republic, Portugal); and reduction in their levels (e.g. Romania) (ILO 2014a).
exce
l file
gif
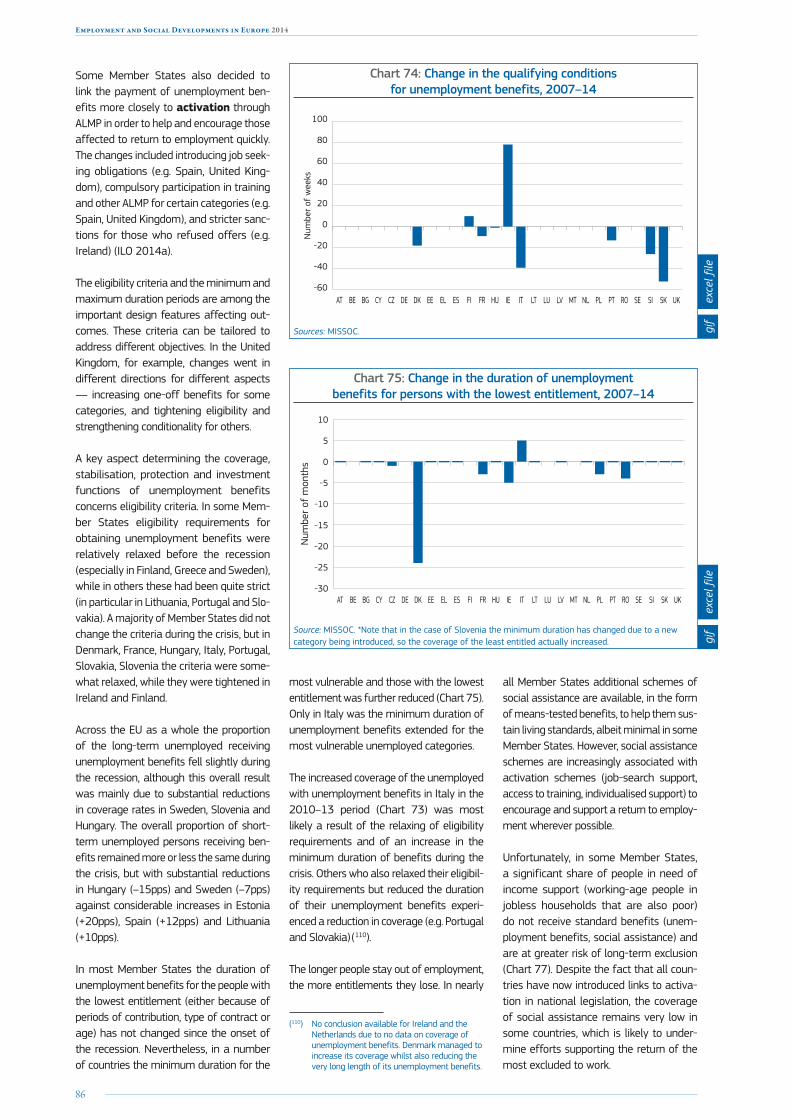
86
Employment and Social Developments in Europe 2014
Some Member States also decided to link the payment of unemployment ben-efits more closely to activation through ALMP in order to help and encourage those affected to return to employment quickly. The changes included introducing job seek-ing obligations (e.g. Spain, United King-dom), compulsory participation in training and other ALMP for certain categories (e.g. Spain, United Kingdom), and stricter sanc-tions for those who refused offers (e.g. Ireland) (ILO 2014a).
The eligibility criteria and the minimum and maximum duration periods are among the important design features affecting out-comes. These criteria can be tailored to address different objectives. In the United Kingdom, for example, changes went in different directions for different aspects — increasing one-off benefits for some categories, and tightening eligibility and strengthening conditionality for others.
A key aspect determining the coverage, stabilisation, protection and investment functions of unemployment benefits concerns eligibility criteria. In some Mem-ber States eligibility requirements for obtaining unemployment benefits were relatively relaxed before the recession (especially in Finland, Greece and Sweden), while in others these had been quite strict (in particular in Lithuania, Portugal and Slo-vakia). A majority of Member States did not change the criteria during the crisis, but in Denmark, France, Hungary, Italy, Portugal, Slovakia, Slovenia the criteria were some-what relaxed, while they were tightened in Ireland and Finland.
Across the EU as a whole the proportion of the long-term unemployed receiving unemployment benefits fell slightly during the recession, although this overall result was mainly due to substantial reductions in coverage rates in Sweden, Slovenia and Hungary. The overall proportion of short-term unemployed persons receiving ben-efits remained more or less the same during the crisis, but with substantial reductions in Hungary (–15pps) and Sweden (–7pps) against considerable increases in Estonia (+20pps), Spain (+12pps) and Lithuania (+10pps).
In most Member States the duration of unemployment benefits for the people with the lowest entitlement (either because of periods of contribution, type of contract or age) has not changed since the onset of the recession. Nevertheless, in a number of countries the minimum duration for the
most vulnerable and those with the lowest entitlement was further reduced (Chart 75). Only in Italy was the minimum duration of unemployment benefits extended for the most vulnerable unemployed categories.
The increased coverage of the unemployed with unemployment benefits in Italy in the 2010–13 period (Chart 73) was most likely a result of the relaxing of eligibility requirements and of an increase in the minimum duration of benefits during the crisis. Others who also relaxed their eligibil-ity requirements but reduced the duration of their unemployment benefits experi-enced a reduction in coverage (e.g. Portugal and Slovakia) ( 110).
The longer people stay out of employment, the more entitlements they lose. In nearly
(110) No conclusion available for Ireland and the Netherlands due to no data on coverage of unemployment benefits. Denmark managed to increase its coverage whilst also reducing the very long length of its unemployment benefits.
all Member States additional schemes of social assistance are available, in the form of means-tested benefits, to help them sus-tain living standards, albeit minimal in some Member States. However, social assistance schemes are increasingly associated with activation schemes (job-search support, access to training, individualised support) to encourage and support a return to employ-ment wherever possible.
Unfortunately, in some Member States, a significant share of people in need of income support (working-age people in jobless households that are also poor) do not receive standard benefits (unem-ployment benefits, social assistance) and are at greater risk of long-term exclusion (Chart 77). Despite the fact that all coun-tries have now introduced links to activa-tion in national legislation, the coverage of social assistance remains very low in some countries, which is likely to under-mine efforts supporting the return of the most excluded to work.
Chart 74: Change in the qualifying conditions for unemployment benefits, 2007–14
-60
-40
-20
0
20
40
60
80
100
UKSKSISEROPTPLNLMTLVLULTITIEHUFRFIESELEEDKDECZCYBGBEATN
umbe
r of
wee
ks
Sources: MISSOC.
Chart 75: Change in the duration of unemployment benefits for persons with the lowest entitlement, 2007–14
Num
ber
of m
onth
s
-30
-25
-20
-15
-10
-5
0
5
10
UKSKSISEROPTPLNLMTLVLULTITIEHUFRFIESELEEDKDECZCYBGBEAT
Source: MISSOC. *Note that in the case of Slovenia the minimum duration has changed due to a new category being introduced, so the coverage of the least entitled actually increased.
exce
l file
gif
exce
l file
gif
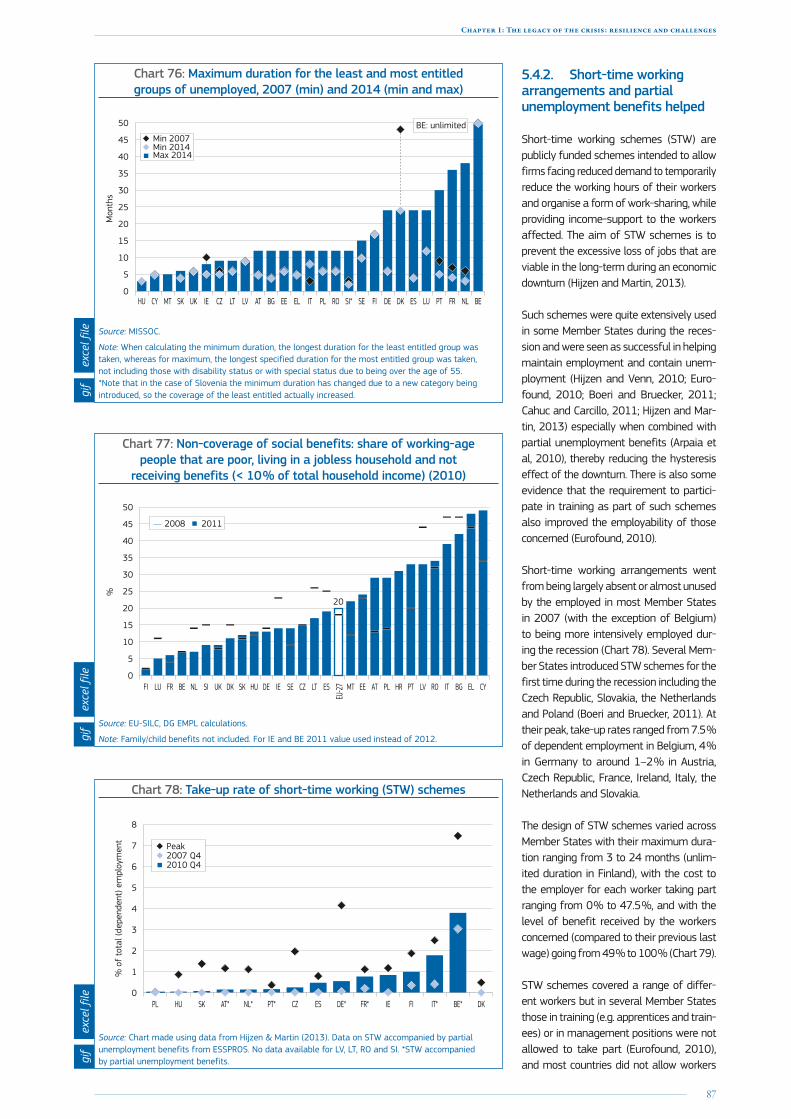
87
Chapter 1: The legacy of the crisis: resilience and challenges
Chart 76: Maximum duration for the least and most entitled groups of unemployed, 2007 (min) and 2014 (min and max)
Mon
ths
0
5
10
15
20
25
30
35
40
45
50
BENLFRPTLUESDKDEFISESI*ROPLITELEEBGATLVLTCZIEUKSKMTCYHU
Min 2014Min 2007
Max 2014
BE: unlimited
Source: MISSOC.
Note: When calculating the minimum duration, the longest duration for the least entitled group was taken, whereas for maximum, the longest specified duration for the most entitled group was taken, not including those with disability status or with special status due to being over the age of 55. *Note that in the case of Slovenia the minimum duration has changed due to a new category being introduced, so the coverage of the least entitled actually increased.
Chart 77: Non-coverage of social benefits: share of working-age people that are poor, living in a jobless household and not
receiving benefits (< 10 % of total household income) (2010)
0
5
10
15
20
25
30
35
40
45
50
CYELBGITROLVPTHRPLATEEMT
EU-2
7ESLTCZSEIEDEHUSKDKUKSINLBEFRLUFI
2008 2011
20
%
Source: EU-SILC, DG EMPL calculations.
Note: Family/child benefits not included. For IE and BE 2011 value used instead of 2012.
Chart 78: Take-up rate of short-time working (STW) schemes
0
1
2
3
4
5
6
7
8
% o
f to
tal (
depe
nden
t) e
mpl
oym
ent
DKBE*IT*FIIEFR*DE*ESCZPT*NL*AT*SKHUPL
2010 Q42007 Q4Peak
Source: Chart made using data from Hijzen & Martin (2013). Data on STW accompanied by partial unemployment benefits from ESSPROS. No data available for LV, LT, RO and SI. *STW accompanied by partial unemployment benefits.
5.4.2. Short-time working arrangements and partial unemployment benefits helped
Short-time working schemes (STW) are publicly funded schemes intended to allow firms facing reduced demand to temporarily reduce the working hours of their workers and organise a form of work-sharing, while providing income-support to the workers affected. The aim of STW schemes is to prevent the excessive loss of jobs that are viable in the long-term during an economic downturn (Hijzen and Martin, 2013).
Such schemes were quite extensively used in some Member States during the reces-sion and were seen as successful in helping maintain employment and contain unem-ployment (Hijzen and Venn, 2010; Euro-found, 2010; Boeri and Bruecker, 2011; Cahuc and Carcillo, 2011; Hijzen and Mar-tin, 2013) especially when combined with partial unemployment benefits (Arpaia et al, 2010), thereby reducing the hysteresis effect of the downturn. There is also some evidence that the requirement to partici-pate in training as part of such schemes also improved the employability of those concerned (Eurofound, 2010).
Short-time working arrangements went from being largely absent or almost unused by the employed in most Member States in 2007 (with the exception of Belgium) to being more intensively employed dur-ing the recession (Chart 78). Several Mem-ber States introduced STW schemes for the first time during the recession including the Czech Republic, Slovakia, the Netherlands and Poland (Boeri and Bruecker, 2011). At their peak, take-up rates ranged from 7.5 % of dependent employment in Belgium, 4 % in Germany to around 1–2 % in Austria, Czech Republic, France, Ireland, Italy, the Netherlands and Slovakia.
The design of STW schemes varied across Member States with their maximum dura-tion ranging from 3 to 24 months (unlim-ited duration in Finland), with the cost to the employer for each worker taking part ranging from 0 % to 47.5 %, and with the level of benefit received by the workers concerned (compared to their previous last wage) going from 49 % to 100 % (Chart 79).
STW schemes covered a range of differ-ent workers but in several Member States those in training (e.g. apprentices and train-ees) or in management positions were not allowed to take part (Eurofound, 2010), and most countries did not allow workers
exce
l file
gif
exce
l file
gif
exce
l file
gif
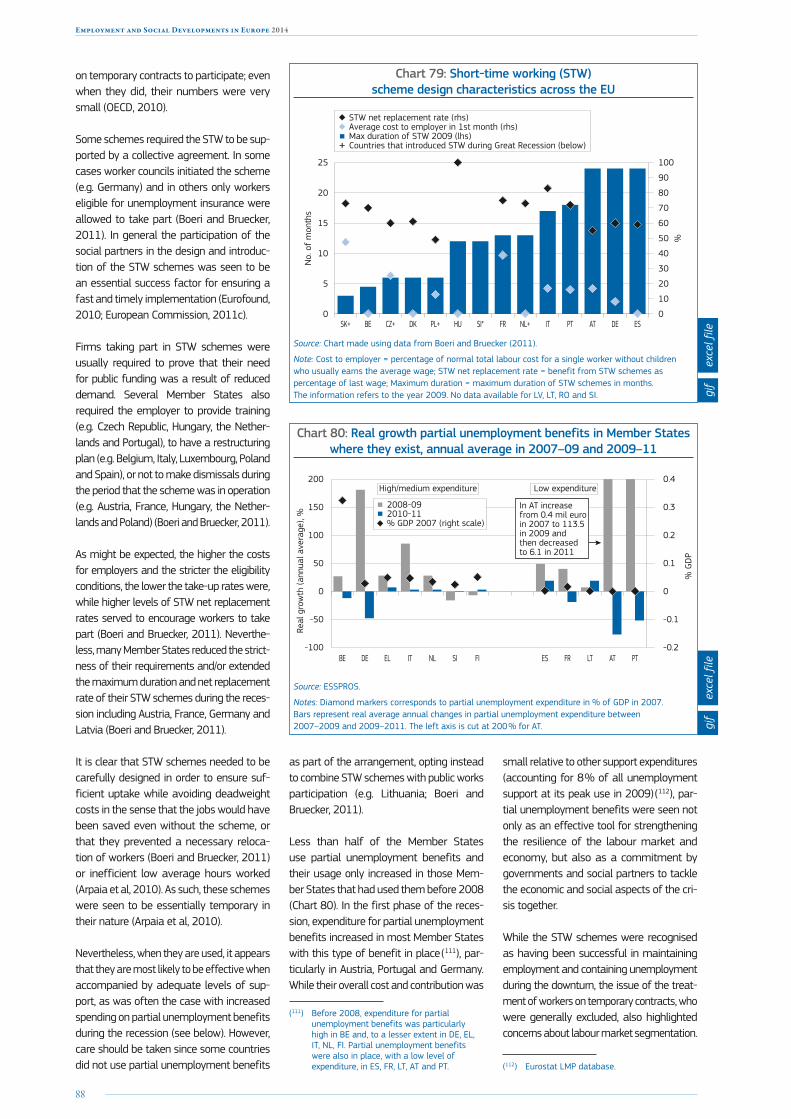
88
Employment and Social Developments in Europe 2014
on temporary contracts to participate; even when they did, their numbers were very small (OECD, 2010).
Some schemes required the STW to be sup-ported by a collective agreement. In some cases worker councils initiated the scheme (e.g. Germany) and in others only workers eligible for unemployment insurance were allowed to take part (Boeri and Bruecker, 2011). In general the participation of the social partners in the design and introduc-tion of the STW schemes was seen to be an essential success factor for ensuring a fast and timely implementation (Eurofound, 2010; European Commission, 2011c).
Firms taking part in STW schemes were usually required to prove that their need for public funding was a result of reduced demand. Several Member States also required the employer to provide training (e.g. Czech Republic, Hungary, the Nether-lands and Portugal), to have a restructuring plan (e.g. Belgium, Italy, Luxembourg, Poland and Spain), or not to make dismissals during the period that the scheme was in operation (e.g. Austria, France, Hungary, the Nether-lands and Poland) (Boeri and Bruecker, 2011).
As might be expected, the higher the costs for employers and the stricter the eligibility conditions, the lower the take-up rates were, while higher levels of STW net replacement rates served to encourage workers to take part (Boeri and Bruecker, 2011). Neverthe-less, many Member States reduced the strict-ness of their requirements and/or extended the maximum duration and net replacement rate of their STW schemes during the reces-sion including Austria, France, Germany and Latvia (Boeri and Bruecker, 2011).
It is clear that STW schemes needed to be carefully designed in order to ensure suf-ficient uptake while avoiding deadweight costs in the sense that the jobs would have been saved even without the scheme, or that they prevented a necessary reloca-tion of workers (Boeri and Bruecker, 2011) or inefficient low average hours worked (Arpaia et al, 2010). As such, these schemes were seen to be essentially temporary in their nature (Arpaia et al, 2010).
Nevertheless, when they are used, it appears that they are most likely to be effective when accompanied by adequate levels of sup-port, as was often the case with increased spending on partial unemployment benefits during the recession (see below). However, care should be taken since some countries did not use partial unemployment benefits
as part of the arrangement, opting instead to combine STW schemes with public works participation (e.g. Lithuania; Boeri and Bruecker, 2011).
Less than half of the Member States use partial unemployment benefits and their usage only increased in those Mem-ber States that had used them before 2008 (Chart 80). In the first phase of the reces-sion, expenditure for partial unemployment benefits increased in most Member States with this type of benefit in place ( 111), par-ticularly in Austria, Portugal and Germany. While their overall cost and contribution was
(111) Before 2008, expenditure for partial unemployment benefits was particularly high in BE and, to a lesser extent in DE, EL, IT, NL, FI. Partial unemployment benefits were also in place, with a low level of expenditure, in ES, FR, LT, AT and PT.
small relative to other support expenditures (accounting for 8 % of all unemployment support at its peak use in 2009) ( 112), par-tial unemployment benefits were seen not only as an effective tool for strengthening the resilience of the labour market and economy, but also as a commitment by governments and social partners to tackle the economic and social aspects of the cri-sis together.
While the STW schemes were recognised as having been successful in maintaining employment and containing unemployment during the downturn, the issue of the treat-ment of workers on temporary contracts, who were generally excluded, also highlighted concerns about labour market segmentation.
(112) Eurostat LMP database.
Chart 79: Short-time working (STW) scheme design characteristics across the EU
0
5
10
15
20
25
No.
of
mon
ths
%
0
10
20
30
40
50
60
70
80
90
100
ESDEATPTITNL+FRSI*HUPL+DKCZ+BESK+
Max duration of STW 2009 (lhs)Countries that introduced STW during Great Recession (below)
Average cost to employer in 1st month (rhs)STW net replacement rate (rhs)
+
Source: Chart made using data from Boeri and Bruecker (2011).
Note: Cost to employer = percentage of normal total labour cost for a single worker without children who usually earns the average wage; STW net replacement rate = benefit from STW schemes as percentage of last wage; Maximum duration = maximum duration of STW schemes in months. The information refers to the year 2009. No data available for LV, LT, RO and SI.
Chart 80: Real growth partial unemployment benefits in Member States where they exist, annual average in 2007–09 and 2009–11
Real
gro
wth
(ann
ual a
vera
ge),
%
% G
DP
-100
-50
0
50
100
150
200
PTATLTFRESFISINLITELDEBE-0.2
-0.1
0
0.1
0.2
0.3
0.4
2010-112008-09
% GDP 2007 (right scale)
In AT increase from 0.4 mil euro in 2007 to 113.5 in 2009 and then decreased to 6.1 in 2011
High/medium expenditure Low expenditure
Source: ESSPROS.
Notes: Diamond markers corresponds to partial unemployment expenditure in % of GDP in 2007. Bars represent real average annual changes in partial unemployment expenditure between 2007–2009 and 2009–2011. The left axis is cut at 200 % for AT.
exce
l file
gif
exce
l file
gif
89
Chapter 1: The legacy of the crisis: resilience and challenges
5.4.3. The stabilisation role of short-time working arrangements and automatic triggers for benefits
Some institutional arrangements have proved relatively effective in limiting the impact of economic shocks. Automatic sta-bilisers, in particular unemployment benefit systems, played an important role in sup-porting incomes in the first phase of the crisis in most Member States. Discretionary measures to temporarily increase the cover-age and adequacy of benefits also proved successful, although Member States with lower coverage and lower levels of benefits were not generally among those introducing such measures.
Short-time working arrangements, sup-ported by partial unemployment benefits, also proved successful in absorbing eco-nomic shocks in their initial stage, although they were not available in all countries (ECFIN, 2013) ( 113). However, not all gov-ernments and social partners opted for short time working arrangements during the recession, just as many also resisted pressures to reduce the level of employ-ment protection on permanent contracts on the grounds that such actions were more likely to lead to job losses than job crea-tion. Another explanation could also be that the extensive use of temporary contracts enabled firms to unilaterally reduce their workforce without recourse to negotiations.
Evidence suggests that, in case of reces-sions, especially if protracted, automatic triggers of benefits and more flexible work-ing arrangements within more stable con-tractual arrangements could improve the resilience of systems. The indexation of ben-efits could also be smoothed over a longer time period in order to better distribute economic resources where most needed.
5.5. The role of social partners: industrial relations and minimum wages
5.5.1. Main developments in industrial relations
The recession had a significant impact on industrial relations in Europe. There is con-siderable diversity in the social dialogue practices of different Member States, including different institutional frameworks with different roles and capacities of the
(113) European Commission, 2013. Labour Market Developments in Europe, European Economy 6, 2013.
main actors (workers’ and employers’ rep-resentatives, as well as the state). Nonethe-less, a number of broad developments can be identified, corresponding to the different phases of the recession.
The initial impact of the crisis affected the private sector in particular. In response, social partners — often with the help of governments — cooperated effectively to limit employment losses through internal flexibility measures and short-time working schemes, as discussed. At this stage, social dialogue was generally recognised as a fac-tor of resilience and adaptation (European Commission, 2011c).
As the crisis deepened and widened, how-ever, social dialogue came under increasing strain. Diverging views emerged between employers and their representative organi-sations and trade unions regarding the most effective exit strategy. Fiscal consolidation measures gave rise to further tensions, particularly in the public sector (European Commission, 2013b).
While European industrial relations were in flux even before the crisis, the crisis appears to have increased the pace of certain devel-opments. The decentralisation of collective wage bargaining — a secular trend since the 1980s — has accelerated since 2007. In 12 Member States, the main bargaining levels are seen to have shifted downwards, with the company level gaining impor-tance vis-à-vis negotiations at industry or cross-industry level. The recentralisation of bargaining in Belgium and Finland is a notable exception.
Recent years have also seen important changes in linkages between bargaining levels, notably increased use of opening and opt-out clauses from collective agree-ments. At the same time, fewer agreements were (legally) extended to cover all workers and employers of a given level. There is also evidence of reduced horizontal coordination between bargaining units (a trend which did not necessarily pre-exist).
Industrial relations are systems, whose settings are interrelated. In this regard, it is notable that countries under financial assis-tance have experienced more changes than others, in a larger number of parameters of their systems (Eurofound, 2014b).
Since 2008, the share of European workers covered by collective bargaining decreased (from 66 % in 2007 to 60 % in 2012). The largest drops occurred in Portugal, Greece
and Spain. Several Central and Eastern European countries experienced decreases from initially low levels. In continental North West Europe, coverage remained high and fairly stable. While national systems appeared to converge slightly prior to the crisis, this trend was reversed.
Countries where social dialogue is well-established and industrial relations systems are strong have proven most resilient during the recent downturn. We can expect social dialogue to play an important part in the durable recovery of the European economy, promoting win-win solutions and the owner-ship of labour market reforms.
Watt (2009) also found, for example, that there was a higher likelihood of equity and social concerns being included in the design of fiscal reforms packages in Mem-ber States when trade unions were involved in the process. In particular, as already noted, the participation of social partners in the design and introduction of the STW schemes has been seen as a crucial factor in ensuring their fast and effective imple-mentation (Eurofound, 2010b).
5.5.2. Minimum wage and wage-setting mechanism developments
Minimum wages are designed to prevent wage competition in low-paid occupations such that wages are too low to prevent pov-erty and social exclusion. From an economic perspective, minimum wages can increase labour costs and thereby reduce levels of employment. Nevertheless, they can also be seen as part of a broader dynamic pro-cess that encourages firms to invest in skill formation and on-the- job-training with a view to raising labour productivity — and strengthening profits.
While some economists consider that minimum wages have adverse effects on employment, as do price rises in any com-petitive market, empirical evidence is mixed. A recent review of empirical minimum wage studies by Holmlund (2013) concluded that minimum wages have ‘negligible employ-ment effects despite having substantial effects on wages’ ( 114). Nevertheless, the possibility that a relatively high minimum wage involves the risk of ‘pricing out’
(114) Holmlund, Bertil, 2013. What do labor market institutions do? (available at https://ideas.repec.org/p/hhs/uunewp/2013_023.html). Working Paper Series (available at https://ideas.repec.org/s/hhs/uunewp.html) 2013:23, Uppsala University, Department of Economics.
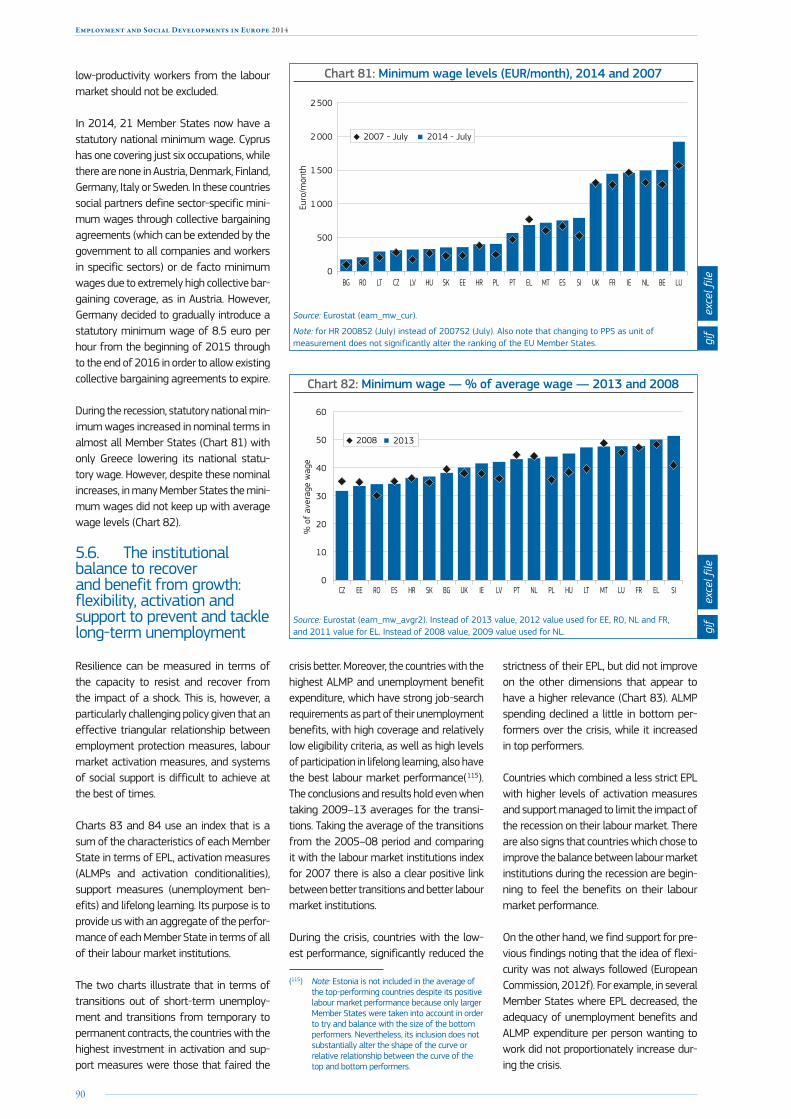
90
Employment and Social Developments in Europe 2014
low-productivity workers from the labour market should not be excluded.
In 2014, 21 Member States now have a statutory national minimum wage. Cyprus has one covering just six occupations, while there are none in Austria, Denmark, Finland, Germany, Italy or Sweden. In these countries social partners define sector-specific mini-mum wages through collective bargaining agreements (which can be extended by the government to all companies and workers in specific sectors) or de facto minimum wages due to extremely high collective bar-gaining coverage, as in Austria. However, Germany decided to gradually introduce a statutory minimum wage of 8.5 euro per hour from the beginning of 2015 through to the end of 2016 in order to allow existing collective bargaining agreements to expire.
During the recession, statutory national min-imum wages increased in nominal terms in almost all Member States (Chart 81) with only Greece lowering its national statu-tory wage. However, despite these nominal increases, in many Member States the mini-mum wages did not keep up with average wage levels (Chart 82).
5.6. The institutional balance to recover and benefit from growth: flexibility, activation and support to prevent and tackle long-term unemployment
Resilience can be measured in terms of the capacity to resist and recover from the impact of a shock. This is, however, a particularly challenging policy given that an effective triangular relationship between employment protection measures, labour market activation measures, and systems of social support is difficult to achieve at the best of times.
Charts 83 and 84 use an index that is a sum of the characteristics of each Member State in terms of EPL, activation measures (ALMPs and activation conditionalities), support measures (unemployment ben-efits) and lifelong learning. Its purpose is to provide us with an aggregate of the perfor-mance of each Member State in terms of all of their labour market institutions.
The two charts illustrate that in terms of transitions out of short-term unemploy-ment and transitions from temporary to permanent contracts, the countries with the highest investment in activation and sup-port measures were those that faired the
crisis better. Moreover, the countries with the highest ALMP and unemployment benefit expenditure, which have strong job-search requirements as part of their unemployment benefits, with high coverage and relatively low eligibility criteria, as well as high levels of participation in lifelong learning, also have the best labour market performance( 115). The conclusions and results hold even when taking 2009–13 averages for the transi-tions. Taking the average of the transitions from the 2005–08 period and comparing it with the labour market institutions index for 2007 there is also a clear positive link between better transitions and better labour market institutions.
During the crisis, countries with the low-est performance, significantly reduced the
(115) Note: Estonia is not included in the average of the top-performing countries despite its positive labour market performance because only larger Member States were taken into account in order to try and balance with the size of the bottom performers. Nevertheless, its inclusion does not substantially alter the shape of the curve or relative relationship between the curve of the top and bottom performers.
strictness of their EPL, but did not improve on the other dimensions that appear to have a higher relevance (Chart 83). ALMP spending declined a little in bottom per-formers over the crisis, while it increased in top performers.
Countries which combined a less strict EPL with higher levels of activation measures and support managed to limit the impact of the recession on their labour market. There are also signs that countries which chose to improve the balance between labour market institutions during the recession are begin-ning to feel the benefits on their labour market performance.
On the other hand, we find support for pre-vious findings noting that the idea of flexi-curity was not always followed (European Commission, 2012f). For example, in several Member States where EPL decreased, the adequacy of unemployment benefits and ALMP expenditure per person wanting to work did not proportionately increase dur-ing the crisis.
Chart 81: Minimum wage levels (EUR/month), 2014 and 2007
0
500
1 000
1 500
2 000
2 500
Euro
/mon
th
LUBENLIEFRUKSIESMTELPTPLHREESKHULVCZLTROBG
2014 - July2007 - July
Source: Eurostat (earn_mw_cur).
Note: for HR 2008S2 (July) instead of 2007S2 (July). Also note that changing to PPS as unit of measurement does not significantly alter the ranking of the EU Member States.
Chart 82: Minimum wage — % of average wage — 2013 and 2008
0
10
20
30
40
50
60
SIELFRLUMTLTHUPLNLPTLVIEUKBGSKHRESROEECZ
20132008
% o
f av
erag
e w
age
Source: Eurostat (earn_mw_avgr2). Instead of 2013 value, 2012 value used for EE, RO, NL and FR, and 2011 value for EL. Instead of 2008 value, 2009 value used for NL.
exce
l file
gif
exce
l file
gif

91
Chapter 1: The legacy of the crisis: resilience and challenges
Chart 83: Labour market institutions index (LMII), average for the top and bottom labour market performers, 2012 and 2007
2007
LLL
UB
EPL
ALMP expenditure
-1.5-2.0
-1.0-0.500.51.01.52.0
2012
LLL
UB
EPL
ALMP expenditure
-1.5-2.0
-1.0-0.500.51.01.52.0
2012
LLL
UB EPL
Activation conditionalities
ALMP expenditure
-1.5-2.0
-1.0-0.500.51.01.52.0
Top LM performers: AT, UK, DE, DK & SEBottom LM performers: EL, ES, PL & IT
ALMP: active labour market policiesLLL: lifelong learningUB: unemployment benefitsEPL: employment protection legislation
Source: ALMP and UB spending data from Eurostat LMP database, Lifelong learning data from Eurostat (trng_lfs_02), data on opinions of managers (part of LLL component) is from IMD WCY executive survey and IMD World Competitiveness Yearbook 2012, eligibility requirements and job-search conditionalities for unemployment benefits are from Venn (2012) and EPL index is from the OECD database.
Notes: The top and bottom LM performers are ranked according to their transitions from temporary to permanent contracts and exits from STU to employment with only large countries used in both groups. The labour market institutions index is a composite Z-score index of EPL (permanent contracts and gap between permanent and temporary contracts v3), ALMP (expenditure in % of GDP and activation/job search conditionalities), lifelong learning (participation rates of total population and opinions of managers about skills from IMD WCY executive survey) and unemployment benefits (expenditure per person wanting to work in PPS, eligibility criteria and coverage). 2008 EPL values were used for 2007 due to availability of data. The EPL values were all turned into negative values so that the lowest EPL gap and lowest EPL value for permanent contracts had the highest Z-score. The eligibility requirements (part of UB indicator) and job-search conditionalities for unemployment benefits have only 2012 data available in both years. The UB spending for 2012 uses 2011 values, expect for EL and UK for whom 2010 values are used. The mean value in 2012 for each indicator is that of the 2007 scores in order to be able to compare the 2012 scores with those of 2007. For 2012 ALMP expenditure 2011 values used for CY, ES, IE, LU, MT and PL, and 2010 values used for EL and UK. For EPL in 2007 for EE, LU and SI, 2008 values were used.
Chart 84: Transitions from temporary to permanent contracts (2011–12) and from short-term unemployment to employment (2012–13)
Tran
sitio
n ra
te f
rom
tem
pora
ry t
o pe
rman
ent
cont
ract
s 20
11-1
2, %
2012
NL
PTFI
HU
EE
PL
EL ITES
CZEU-27
DK
DE
FR
AT
SISK
SEUK
15 20 25 30 35 40 45 50 55 60 65
0
10
20
30
40
50
60
70
80
Transition rate from short-term unemployment to employment 2012-13, %
Worst BestMiddle
Size of bubble represents score of labour market institutions index (LMII)
Source: Transition rate from temporary to permanent contracts from Eurostat, EU-SILC.; transition rate from short-term unemployment to employment from Eurostat, EU-LFS, ad-hoc transition calculations based on longitudinal data.
Note: Blue dotted line marks the EU average. 2010–11 values used for CY, HR, HU, MT, PL, PT, RO, SE and SK for transitions from temporary to permanent contracts and 2010–11 value used for NL short-term unemployment to employment transition. EU-27 average for transitions from temporary to permanent from EU-SILC and for exits out of STU calculated arithmetic average.
The social partners, through bipartite dia-logue or tripartite relations with public authorities, often are central actors in the design, acceptance and successful imple-mentation of these policies. However, their role differs widely between Member States and domains, in accordance with the par-ticular national industrial relations systems and traditions.
Finally, the analysis of the impact of changes in welfare systems on the labour market during the crisis and their interplay with many labour market institutions (Sec-tion 4) highlights the need for a more inte-grated policy approach in order to address new challenges and work towards the goals of a job-rich and inclusive growth. Establish-ing the right balance between the differ-ent functions of the welfare systems, and between benefit systems and labour market institutions, is crucial.
exce
l file
gif
exce
l file
gif

92
Employment and Social Developments in Europe 2014
6. Conclusions
This chapter has taken stock of the impact of the recession on people and institutions, analysed the role of social protection systems and labour market institutions in explaining the various levels of resilience to the crisis, and assessed how well policy changes since 2008 are likely to help the EU to promote a job-rich and inclusive growth as well as being better prepared in the future.
We find that Member States have shown different levels of resilience to the eco-nomic shock experienced across the EU. While employment levels have declined and unemployment increased in most countries, some have managed to limit the worst effects, because of their initial position and/or the policies implemented in reaction to the crisis.
The design of different labour market institutions contributed to mitigate or exacerbate the impact of economic shocks on employment. The effective-ness of automatic stabilisers in sustain-ing incomes of those directly affected and in stabilising the economy depends on the extent to which they provide longer term support in the case of a pro-longed period of weak labour demand, while not creating disincentives to work. At the same time, using the opportunity of the recession to invest in skills and ensure that they are properly used can be crucial in helping maintain an adapta-ble and productive workforce and speed-ing recovery.
In terms of the short- and long-term impacts of the recession, the following points stand out:
• The recession generated large increases in the number of unem-ployed, especially among some specific groups (youth, low-skilled) and long-term unemployment rose in nearly all countries, and doubled overall. The recession also impacted negatively on job quality, notably due to increasing involuntary part-time and temporary employment.
• The large variation across countries in the ability to prevent long-term unemployment (as measured by exit rates out of short-term unemploy-ment) reflects differences both in the severity of economic conditions and in the policies implemented. Supporting
the unemployed through activation, (re)training services, quality of the public employment services, and well-designed income support contributed to a faster recovery.
• Activity rates continued to increase during the recession, with fewer peo-ple leaving the labour market than might have been expected on past experience of periods of high unem-ployment. This contrasts quite signifi-cantly with experiences in previous recessions. It is seen to be driven by the structural rise in participation of women and older workers, supported by policy measures that have not been reversed during the recession.
• Employment rates of young people entering the labour market are cur-rently below pre-recession levels in most countries. This is of particular concern given the known negative consequences of facing unemploy-ment early in a career, although highly educated young people are relatively well protected against such scarring effects.
• Many young people entered or stayed in education, especially in Member States where participation had previously been low and where youth unemployment is currently high. However, the extent to which this will improve their future employ-ment and earnings opportunities will depend on the quality of education, which may be undermined by recent cuts in expenditure.
• Future employment growth will need to be widely shared if it is to contribute to reducing inequalities and prevent-ing long-term exclusion. In the face of declining job opportunities, people have developed multiple strategies for finding work, going beyond the use of public employment services, such as mobilising family ties and social networks, as well as adjusting their quantity of work (part-time, on call, informal work, etc.).
• Unemployment and economic hard-ship has led many households to drastically adjust their expenditure and draw on savings, with many moving into debt. The weakening of social ties or the increased reliance on informal support may undermine integration in society and the labour
market. Moreover, the rise of social exclusion has a very negative impact on public trust in institutions and gov-ernments, contributing to the political uncertainty that already undermines the effectiveness of policy action.
In relating the pre-crisis situation of labour market institutions and patterns of social expenditure to the post-cri-sis outcomes, as well as to the policy changes by Member States since 2008, the following lessons can be drawn:
• The development of social expendi-ture has proved to be an important factor in explaining the resilience of some Member States during the recession. Social protection expendi-ture increased in the first phase of the crisis, absorbing part of the shock in most Member States, thanks to ‘automatic’ stabilisation and to ad-hoc discretionary measures. How-ever, as the recession has persisted, social expenditure has started to be cut back.
• The design and operational character-istics of welfare systems and labour market institutions help explain dif-fering degrees of resilience to eco-nomic shocks across Member States. The transmission of economic shocks to employment and income was smaller in those with a lower share of temporary contracts, a greater availability and use of short-time working arrangements, a stronger investment in labour market activa-tion measures and lifelong learning, as well as widely available unemploy-ment benefits linked to activation, and responsive to the economic cycle.
• The relationship between employ-ment protection legislation (EPL), labour market activation policies and income support changed somewhat during the recession. The loosening of EPL has not been so far a strong predictor of transitions out of unem-ployment or of general labour mar-ket performance, signalling that the effects of EPL reforms during peri-ods of low labour demand may have limited impacts and that they may require longer than the short- and medium-term to have an effect.
• The analysis highlighted that EPL alone cannot explain labour market outcomes but is just one of several

93
Chapter 1: The legacy of the crisis: resilience and challenges
labour market institutions whose reform may need to be utilised to combat unemployment and a dual labour market. Countries display-ing the best returns to employment from short-term unemployment and transitions from temporary to permanent contracts in 2012 were those that had the most developed and balance set of labour market institutions. The best perform-ers combined significantly higher spending in ALMP, stronger acti-vation conditionality, higher par-ticipation in lifelong learning and higher coverage and adequacy of unemployment benefits than the countries with the lowest labour market performance. During the crisis, countries with the lowest per-formance reduced the strictness of their employment protection legis-lation, but they did not improve the other labour market institutions.
• Short-time working schemes accom-panied by partial unemployment ben-efits were extensively used during the early phase of the recession and were successful in maintaining employ-ment and containing unemployment.
• Investments in lifelong learning can play a crucial role in both supporting a recovery and ensuring long-run com-petitiveness. There is a strong positive relationship between the participation rates of the unemployed in educa-tion and training, and their chances to go back to work. Even when con-trolling for differences in education levels, Member States with the high-est levels of participation in lifelong learning and whose employers value and invest in human capital achieve
higher levels of competitiveness than those who do not.
• Faced with a prolonged recession and the increase in long-term unem-ployment most countries did not, or could not, strengthen the automatic stabilisation dimension of their wel-fare systems, thus undermining the effectiveness of social protection. This argues for increasing the respon-siveness of unemployment benefits to the economic cycle, by allowing a temporary increase in the duration of benefits and a relaxation of the eligi-bility criteria during recessions. Other measures, such as minimum income schemes linked to activation and a more responsive indexation of family benefits and pensions may also sup-port these efforts. In times of growth, the eligibility and duration of unem-ployment benefits can be readjusted, just as the pressures to increase labour market flexibility may decrease, in order to limit possible employment disincentives and support the financial sustainability of social expenditure.
• The sustainability of social expendi-ture is influenced by the structure of its financing arrangements. The apparent move away from financing through social security contribution to financing from general taxation may open the way for a more inclu-sive system, but the design of benefit systems also need to be appropri-ately adjusted.
• A number of Member States are pro-gressively moving towards a social investment model that supports all those who wish to participate in the labour market by helping them
achieve their full employment poten-tial throughout their lifetime. In this respect, for example, expenditure on childcare is supporting the active participation of women in the labour market, with countries starting from low levels benefiting the most.
• The evidence from the complex, and mixed, experience of the Mem-ber States during the recession has underlined the importance of ensur-ing balanced and purposeful reforms of both labour market institutions and welfare systems. It showed that, in contrast to experiences in previous recessions, recent policy reforms in areas such as pensions and childcare have helped prevent a massive with-drawal of older workers and women from the labour markets. It showed the successful complementarity of short-time working arrangements and partial unemployment benefits during the crisis. It also highlighted the important role that social partners can play in the successful design and implementation of such schemes.
Adequate levels of social investment, investment in lifelong learning, a greater responsiveness of social expenditure to the economic cycle, and integrated wel-fare reforms supported by well-func-tioning labour markets can contribute to better prepare people and societies to face any future crises, as well as pro-vide the necessary foundations for more productive economies and societies. In this respect, recent efforts to stimulate labour demand, such as the reduction of the tax wedge and incentives to entre-preneurship, can also serve to strengthen the impact of reforms in pursuit of job-rich and inclusive growth.
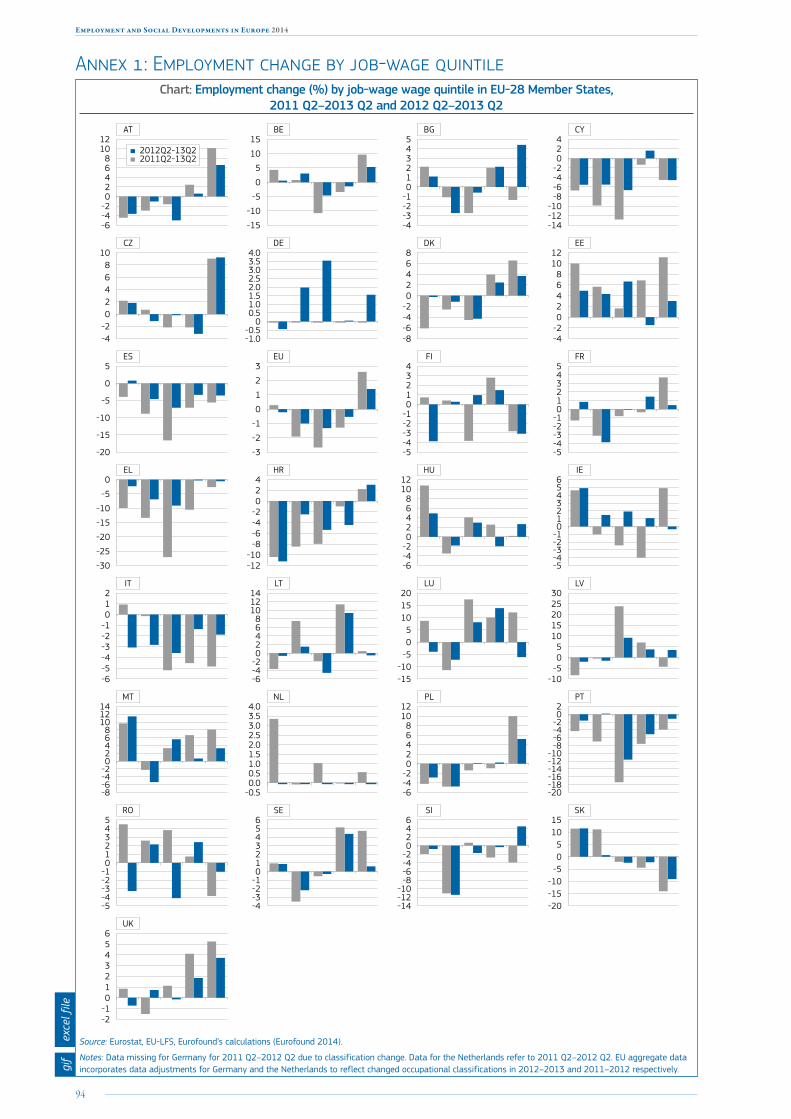
94
Employment and Social Developments in Europe 2014
Annex 1: Employment change by job-wage quintileChart: Employment change (%) by job-wage wage quintile in EU-28 Member States,
2011 Q2–2013 Q2 and 2012 Q2–2013 Q2
AT
-6-4-202468
1012
BE
-15
-10
-5
0
5
10
15BG
-4-3-2-1012345
CY
-14-12-10
-8-6-4-2024
CZ
-4-202468
10DE
-1.0-0.5
00.51.01.52.02.53.03.54.0
DK
-8-6-4-202468
EE
-4-202468
1012
ES
-20
-15
-10
-5
0
5EU
-3
-2
-1
0
1
2
3FI
-5-4-3-2-101234
FR
-5-4-3-2-1012345
EL
-30
-25
-20
-15
-10
-5
0HR
-12-10
-8-6-4-2024
HU
-6-4-202468
1012
IE
-5-4-3-2-10123456
IT
-6-5-4-3-2-1012
LT
-6-4-202468
101214
LU
-15-10
-505
101520
LV
-10-505
1015202530
MT
-8-6-4-202468
101214
NL
-0.50.00.51.01.52.02.53.03.54.0
PL
-6-4-202468
1012
PT
-20-18-16-14-12-10
-8-6-4-202
RO
-5-4-3-2-1012345
SE
-4-3-2-10123456
SI
-14-12-10
-8-6-4-20246
SK
-20-15-10
-505
1015
UK
-2-10123456
2012Q2-13Q22011Q2-13Q2
Source: Eurostat, EU-LFS, Eurofound’s calculations (Eurofound 2014).
Notes: Data missing for Germany for 2011 Q2–2012 Q2 due to classification change. Data for the Netherlands refer to 2011 Q2–2012 Q2. EU aggregate data incorporates data adjustments for Germany and the Netherlands to reflect changed occupational classifications in 2012–2013 and 2011–2012 respectively.
exce
l file
gif
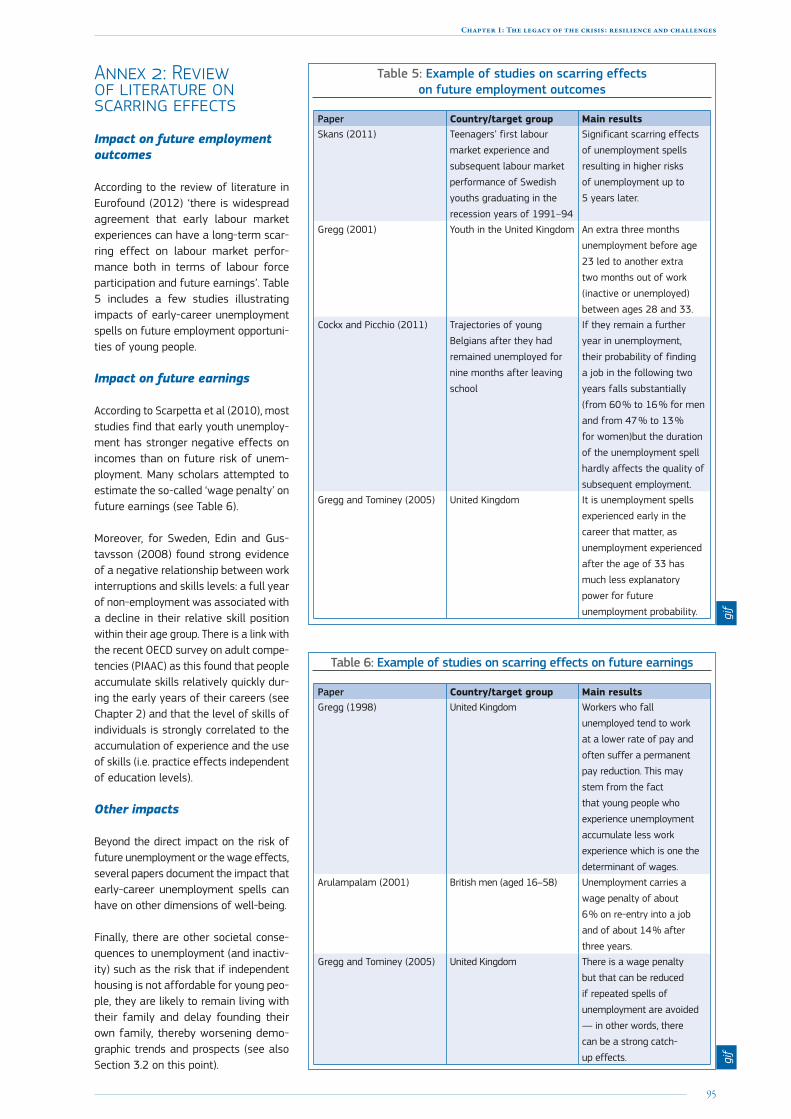
95
Chapter 1: The legacy of the crisis: resilience and challenges
Annex 2: Review of literature on scarring effects
Impact on future employment outcomes
According to the review of literature in Eurofound (2012) ‘there is widespread agreement that early labour market experiences can have a long-term scar-ring effect on labour market perfor-mance both in terms of labour force participation and future earnings’. Table 5 includes a few studies illustrating impacts of early-career unemployment spells on future employment opportuni-ties of young people.
Impact on future earnings
According to Scarpetta et al (2010), most studies find that early youth unemploy-ment has stronger negative effects on incomes than on future risk of unem-ployment. Many scholars attempted to estimate the so-called ‘wage penalty’ on future earnings (see Table 6).
Moreover, for Sweden, Edin and Gus-tavsson (2008) found strong evidence of a negative relationship between work interruptions and skills levels: a full year of non-employment was associated with a decline in their relative skill position within their age group. There is a link with the recent OECD survey on adult compe-tencies (PIAAC) as this found that people accumulate skills relatively quickly dur-ing the early years of their careers (see Chapter 2) and that the level of skills of individuals is strongly correlated to the accumulation of experience and the use of skills (i.e. practice effects independent of education levels).
Other impacts
Beyond the direct impact on the risk of future unemployment or the wage effects, several papers document the impact that early-career unemployment spells can have on other dimensions of well-being.
Finally, there are other societal conse-quences to unemployment (and inactiv-ity) such as the risk that if independent housing is not affordable for young peo-ple, they are likely to remain living with their family and delay founding their own family, thereby worsening demo-graphic trends and prospects (see also Section 3.2 on this point).
Table 5: Example of studies on scarring effects on future employment outcomes
Paper Country/target group Main resultsSkans (2011) Teenagers’ first labour
market experience and
subsequent labour market
performance of Swedish
youths graduating in the
recession years of 1991–94
Significant scarring effects
of unemployment spells
resulting in higher risks
of unemployment up to
5 years later.
Gregg (2001) Youth in the United Kingdom An extra three months
unemployment before age
23 led to another extra
two months out of work
(inactive or unemployed)
between ages 28 and 33.Cockx and Picchio (2011) Trajectories of young
Belgians after they had
remained unemployed for
nine months after leaving
school
If they remain a further
year in unemployment,
their probability of finding
a job in the following two
years falls substantially
(from 60 % to 16 % for men
and from 47 % to 13 %
for women)but the duration
of the unemployment spell
hardly affects the quality of
subsequent employment.Gregg and Tominey (2005) United Kingdom It is unemployment spells
experienced early in the
career that matter, as
unemployment experienced
after the age of 33 has
much less explanatory
power for future
unemployment probability.
Table 6: Example of studies on scarring effects on future earnings
Paper Country/target group Main resultsGregg (1998) United Kingdom Workers who fall
unemployed tend to work
at a lower rate of pay and
often suffer a permanent
pay reduction. This may
stem from the fact
that young people who
experience unemployment
accumulate less work
experience which is one the
determinant of wages. Arulampalam (2001) British men (aged 16–58) Unemployment carries a
wage penalty of about
6 % on re-entry into a job
and of about 14 % after
three years. Gregg and Tominey (2005) United Kingdom There is a wage penalty
but that can be reduced
if repeated spells of
unemployment are avoided
— in other words, there
can be a strong catch-
up effects.
gif
gif

96
Employment and Social Developments in Europe 2014
Table 7: Example of studies on scarring effects on other outcomes
Paper Main resultsBell and Blanchflower (2011) Young people's health status, well-
being and job satisfaction are
impacted negatively through spells of
unemployment, although the effects are
less serious for 'older young people', i.e.
those aged 23 or more.Cutler et al (2014) Review of literature documenting that
cohorts graduating in bad times have
lower wages and poorer health for many
years after graduation, compared to those
graduating in good times.Brenner (2013) Drawing on the 2000–10 period in
EU countries, the paper examines the
relationship between the unemployment
rate and Ischemic Heart Disease (IHD)
mortality rates and concludes that the
unemployment rate has been an important
risk factor for IHD mortality since the start
of the great recession in the EU.Giuliano and Spilimbergo (2009) Macroeconomic conditions (through
witnessing increased unemployment) have
an effect on the young generation: young
people who are aged between 17 and 25
during a recession have less confidence in
public institutions and believe that success
depends more on luck than on effort.
Causes of scarring effects: signalling effects play a role and call for more efforts to provide youths with a first employment experience quickly
The two main channels of scarring effects of early-career unemployment spells are associated with human capi-tal (i.e. deterioration of skills or foregone work experience) on the one hand, and signalling effects (i.e. spells of unemploy-ment give a signal of low productivity to potential employers) on the other. Other explanatory factors include psycho-logical discouragement or habituation effects, theories of job matching where the unemployed accept poorer quality jobs and social work norms that influ-ence individuals’ preferences for work, see Nilsen and Reiso (2011). In the case of young people, the signalling effect for
potential future employers seems to be given a rising explanatory power in the literature. For instance, the substantial effects of early-career unemployment identified by Cockx and Picchio (2011) are caused by ‘the negative signal that prolonged unemployment conveys to potential recruiters’ rather than ‘depre-ciation of human capital’. The authors conclude that “offering employment experience as quickly as possible is more effective” than supply of training.
Doiron and Gørgens (2008), in the case of young Australians with no post-secondary education, point to the fact that the mere fact of being employed matters (and conversely the mere fact of being unemployed has a negative impact). Ignoring these effects can lead to underestimating the impact of labour market policies.
While over-education may also at some point act as a strong negative signal to employers, Baert and Verhaest (2014) provide evidence (based on a field experiment in Belgium with fictitious job applications to real vacancies) of a large stigma effect of unemploy-ment than over-education and argue in favour of fast activation of unem-ployed youth.
Education protects from scarring effects
In their review of existing studies in European countries, Scarpetta et al (2010) point out that ‘the lower the level of initial qualification, the longer the scarring effects are likely to last’. This finding is confirmed by Mosthaf (2014) for Germany and by Dolado el al. (2013) for Spain. This is due to changing labour demand but also to the fact that during the recession different educational groups compete for the same jobs and many jobs requiring low skill levels are taken up by tertiary graduates (Bell and Blanchflower (2011)).
For the United Kingdom, Gregg (2001) looked at cumulated experience of unemployment, highlighting how it is concentrated on a minority of the workforce over extended periods. It concludes that “low educational attain-ment, ability not captured by education, financial deprivation and behavioural problems in childhood raise a person’s susceptibility to unemployment”.
As the context of unemployment spells may differ greatly, scarring effects vary across (education) groups both in magnitude and by the underly-ing mechanism. Signalling effects (to potential future employers) may play a greater role for young people without qualifications — while depreciation of human capital as well as foregone work experience could be relatively stronger for tertiary graduates ( 116).
(116) For instance, Brunner and Kuhn (2009) reports that the labour market conditions at entry have smaller and less persistent effects on the earnings of blue-collar workers than on those of white-collar workers. This differential effect may be explained by the wider wage distribution that can be found among white-collar workers.
gif
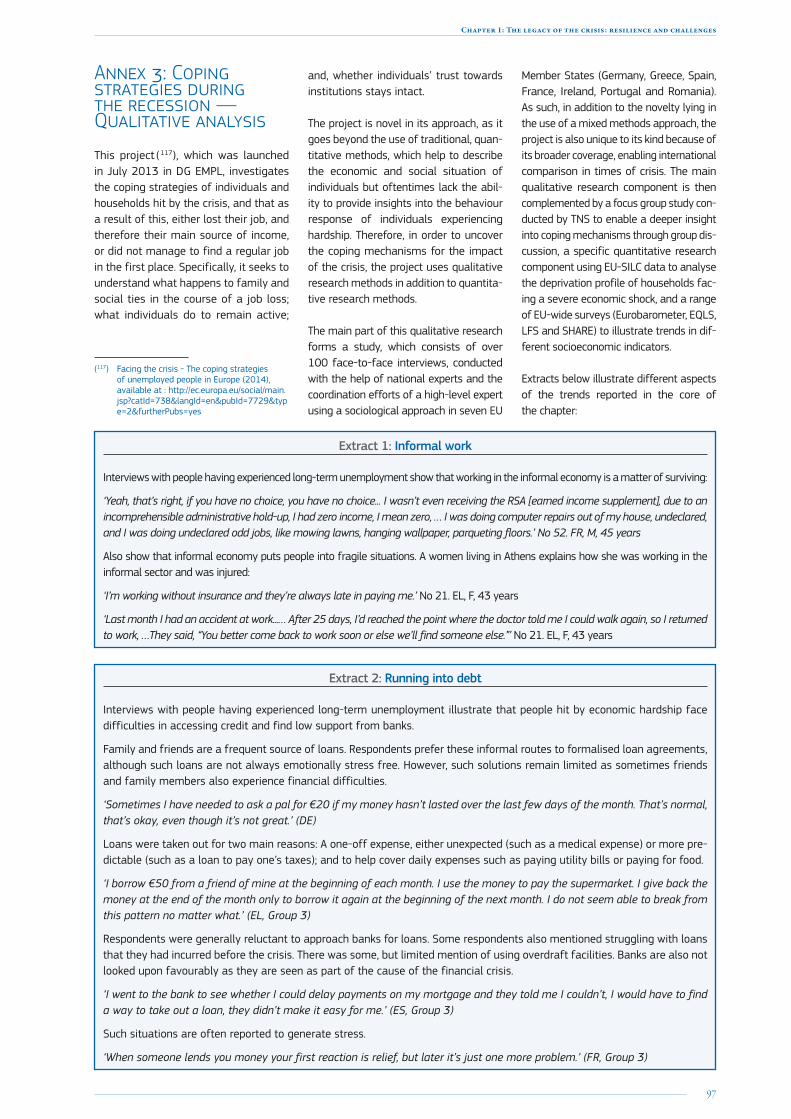
97
Chapter 1: The legacy of the crisis: resilience and challenges
Annex 3: Coping strategies during the recession — Qualitative analysis
This project ( 117), which was launched in July 2013 in DG EMPL, investigates the coping strategies of individuals and households hit by the crisis, and that as a result of this, either lost their job, and therefore their main source of income, or did not manage to find a regular job in the first place. Specifically, it seeks to understand what happens to family and social ties in the course of a job loss; what individuals do to remain active;
(117) Facing the crisis - The coping strategies of unemployed people in Europe (2014), available at : http://ec.europa.eu/social/main.jsp?catId=738&langId=en&pubId=7729&type=2&furtherPubs=yes
and, whether individuals’ trust towards institutions stays intact.
The project is novel in its approach, as it goes beyond the use of traditional, quan-titative methods, which help to describe the economic and social situation of individuals but oftentimes lack the abil-ity to provide insights into the behaviour response of individuals experiencing hardship. Therefore, in order to uncover the coping mechanisms for the impact of the crisis, the project uses qualitative research methods in addition to quantita-tive research methods.
The main part of this qualitative research forms a study, which consists of over 100 face-to-face interviews, conducted with the help of national experts and the coordination efforts of a high-level expert using a sociological approach in seven EU
Member States (Germany, Greece, Spain, France, Ireland, Portugal and Romania). As such, in addition to the novelty lying in the use of a mixed methods approach, the project is also unique to its kind because of its broader coverage, enabling international comparison in times of crisis. The main qualitative research component is then complemented by a focus group study con-ducted by TNS to enable a deeper insight into coping mechanisms through group dis-cussion, a specific quantitative research component using EU-SILC data to analyse the deprivation profile of households fac-ing a severe economic shock, and a range of EU-wide surveys (Eurobarometer, EQLS, LFS and SHARE) to illustrate trends in dif-ferent socioeconomic indicators.
Extracts below illustrate different aspects of the trends reported in the core of the chapter:
Extract 1: Informal work
Interviews with people having experienced long-term unemployment show that working in the informal economy is a matter of surviving:
‘Yeah, that’s right, if you have no choice, you have no choice... I wasn’t even receiving the RSA [earned income supplement], due to an incomprehensible administrative hold-up, I had zero income, I mean zero, … I was doing computer repairs out of my house, undeclared, and I was doing undeclared odd jobs, like mowing lawns, hanging wallpaper, parqueting floors.’ No 52. FR, M, 45 years
Also show that informal economy puts people into fragile situations. A women living in Athens explains how she was working in the informal sector and was injured:
‘I’m working without insurance and they’re always late in paying me.’ No 21. EL, F, 43 years
‘Last month I had an accident at work...… After 25 days, I’d reached the point where the doctor told me I could walk again, so I returned to work, …They said, “You better come back to work soon or else we’ll find someone else.”’ No 21. EL, F, 43 years
Extract 2: Running into debt
Interviews with people having experienced long-term unemployment illustrate that people hit by economic hardship face difficulties in accessing credit and find low support from banks.
Family and friends are a frequent source of loans. Respondents prefer these informal routes to formalised loan agreements, although such loans are not always emotionally stress free. However, such solutions remain limited as sometimes friends and family members also experience financial difficulties.
‘Sometimes I have needed to ask a pal for €20 if my money hasn’t lasted over the last few days of the month. That’s normal, that’s okay, even though it’s not great.’ (DE)
Loans were taken out for two main reasons: A one-off expense, either unexpected (such as a medical expense) or more pre-dictable (such as a loan to pay one’s taxes); and to help cover daily expenses such as paying utility bills or paying for food.
‘I borrow €50 from a friend of mine at the beginning of each month. I use the money to pay the supermarket. I give back the money at the end of the month only to borrow it again at the beginning of the next month. I do not seem able to break from this pattern no matter what.’ (EL, Group 3)
Respondents were generally reluctant to approach banks for loans. Some respondents also mentioned struggling with loans that they had incurred before the crisis. There was some, but limited mention of using overdraft facilities. Banks are also not looked upon favourably as they are seen as part of the cause of the financial crisis.
‘I went to the bank to see whether I could delay payments on my mortgage and they told me I couldn’t, I would have to find a way to take out a loan, they didn’t make it easy for me.’ (ES, Group 3)
Such situations are often reported to generate stress.
‘When someone lends you money your first reaction is relief, but later it’s just one more problem.’ (FR, Group 3)
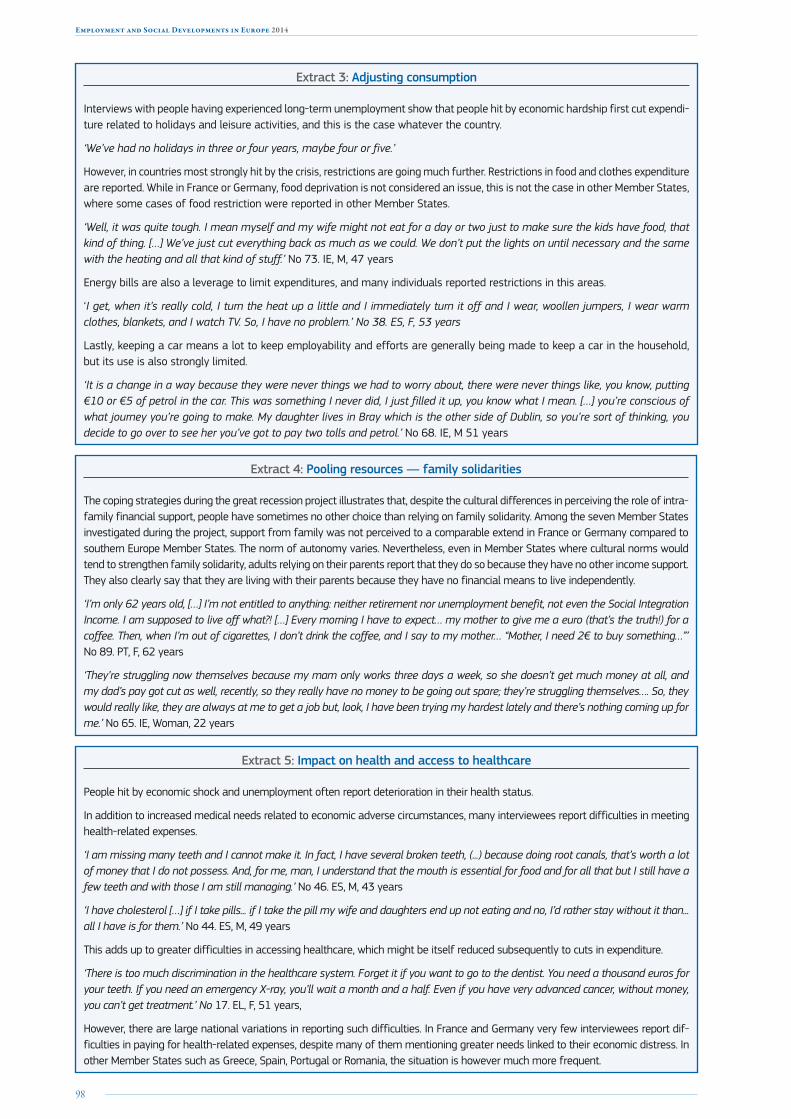
98
Employment and Social Developments in Europe 2014
Extract 3: Adjusting consumption
Interviews with people having experienced long-term unemployment show that people hit by economic hardship first cut expendi-ture related to holidays and leisure activities, and this is the case whatever the country.
‘We’ve had no holidays in three or four years, maybe four or five.’
However, in countries most strongly hit by the crisis, restrictions are going much further. Restrictions in food and clothes expenditure are reported. While in France or Germany, food deprivation is not considered an issue, this is not the case in other Member States, where some cases of food restriction were reported in other Member States.
‘Well, it was quite tough. I mean myself and my wife might not eat for a day or two just to make sure the kids have food, that kind of thing. […] We’ve just cut everything back as much as we could. We don’t put the lights on until necessary and the same with the heating and all that kind of stuff.’ No 73. IE, M, 47 years
Energy bills are also a leverage to limit expenditures, and many individuals reported restrictions in this areas.
‘I get, when it’s really cold, I turn the heat up a little and I immediately turn it off and I wear, woollen jumpers, I wear warm clothes, blankets, and I watch TV. So, I have no problem.’ No 38. ES, F, 53 years
Lastly, keeping a car means a lot to keep employability and efforts are generally being made to keep a car in the household, but its use is also strongly limited.
‘It is a change in a way because they were never things we had to worry about, there were never things like, you know, putting €10 or €5 of petrol in the car. This was something I never did, I just filled it up, you know what I mean. […] you’re conscious of what journey you’re going to make. My daughter lives in Bray which is the other side of Dublin, so you’re sort of thinking, you decide to go over to see her you’ve got to pay two tolls and petrol.’ No 68. IE, M 51 years
Extract 4: Pooling resources — family solidarities
The coping strategies during the great recession project illustrates that, despite the cultural differences in perceiving the role of intra-family financial support, people have sometimes no other choice than relying on family solidarity. Among the seven Member States investigated during the project, support from family was not perceived to a comparable extend in France or Germany compared to southern Europe Member States. The norm of autonomy varies. Nevertheless, even in Member States where cultural norms would tend to strengthen family solidarity, adults relying on their parents report that they do so because they have no other income support. They also clearly say that they are living with their parents because they have no financial means to live independently.
‘I’m only 62 years old, […] I’m not entitled to anything: neither retirement nor unemployment benefit, not even the Social Integration Income. I am supposed to live off what?! […] Every morning I have to expect… my mother to give me a euro (that’s the truth!) for a coffee. Then, when I’m out of cigarettes, I don’t drink the coffee, and I say to my mother… “Mother, I need 2€ to buy something…”’ No 89. PT, F, 62 years
‘They’re struggling now themselves because my mam only works three days a week, so she doesn’t get much money at all, and my dad’s pay got cut as well, recently, so they really have no money to be going out spare; they’re struggling themselves…. So, they would really like, they are always at me to get a job but, look, I have been trying my hardest lately and there’s nothing coming up for me.’ No 65. IE, Woman, 22 years
Extract 5: Impact on health and access to healthcare
People hit by economic shock and unemployment often report deterioration in their health status.
In addition to increased medical needs related to economic adverse circumstances, many interviewees report difficulties in meeting health-related expenses.
‘I am missing many teeth and I cannot make it. In fact, I have several broken teeth, (...) because doing root canals, that’s worth a lot of money that I do not possess. And, for me, man, I understand that the mouth is essential for food and for all that but I still have a few teeth and with those I am still managing.’ No 46. ES, M, 43 years
‘I have cholesterol […] if I take pills... if I take the pill my wife and daughters end up not eating and no, I’d rather stay without it than... all I have is for them.’ No 44. ES, M, 49 years
This adds up to greater difficulties in accessing healthcare, which might be itself reduced subsequently to cuts in expenditure.
‘There is too much discrimination in the healthcare system. Forget it if you want to go to the dentist. You need a thousand euros for your teeth. If you need an emergency X-ray, you’ll wait a month and a half. Even if you have very advanced cancer, without money, you can’t get treatment.’ No 17. EL, F, 51 years,
However, there are large national variations in reporting such difficulties. In France and Germany very few interviewees report dif-ficulties in paying for health-related expenses, despite many of them mentioning greater needs linked to their economic distress. In other Member States such as Greece, Spain, Portugal or Romania, the situation is however much more frequent.

99
Chapter 1: The legacy of the crisis: resilience and challenges
Extract 6: Losing trust in institutions
Qualitative analysis (see Box 1) highlights that, the distrust in institutions expressed by persons unemployed for at least one year ranges from a balanced criticism to an overall rejection.
‘We are paying for things that have nothing to do with us.’ No 75.
Generally speaking, unemployed interviewees are feeling ignored by their representatives. They also share the feeling that they pay disproportionately for economic recovery. Europe is especially seen as a major player in this feeling, together with banks and firms:
‘I think an awful lot went wrong with this country when the government decided that they needed to look good in Europe rather than look good to their own population I suppose.’ No 71
Nevertheless, public services continue to be seen as a tool towards better lives. Cuts in public expenditure severely affect their lives.
‘We don’t trust the politicians anymore, because they have been a total disappointment. We can’t believe a thing they say anymore. [....] There is also this downgrading of education by the government and it forces us to dig our hands into our pockets to pay for extra classes, you know, but meanwhile we pay our taxes and are supposed to have an education system, but this current downgrading of education is very disappointing… The State has even become our predator.’ No 34. EL, M., 55 years
In some countries strongly affected by the great recession, however, the feeling of distrust toward institutions is much more pronounced —sometimes even violent, and embeds all types of institutions.
‘I’ve stopped watching the news. … I’ve stopped worrying about politics. It just tells me that it’s every man for himself in life. Let everyone tend their own garden, that’s how it is, and I’ve put on blinkers and just say keep on going forward because I have a child to raise.’ No 21, F, EL
‘My country simply died. My country, if it continues to be ruled by these people, by the idea of the people who are now govern-ing, my country will die soon.’ No 93, PT
Extract 7: Losing trust in the public employment services
Interviews with people having experienced long-term unemployment show that trust in public employment service is varying across Member States. There is a general feeling ranging from mistrust to defiance.
‘I get very down. There’s days I’ll just be sick of it.[…] I’ve sent out about 500 or 600 CVs […] I got a few interviews, but you go to the interviews and it’s just like I’ve done interview techniques so it’s not a case of I don’t know what I’m doing when I’m in there, it’s just the case that you go for the job […] and then they tell you and then OK and then it’s the whole jumping through hoops that just gets you really down.’ No 72. IE, M, 38 years
100
Employment and Social Developments in Europe 2014
Annex 4: RESCuE project — Patterns of Resilience during Socioeconomic Crises among Households in Europe
As a complement to the qualitative study above, the RESCuE project was launched by Directorate-General for Research and Innovation in April 2014 under the Seventh Framework Pro-gramme (FP7-SSH).
This project has set out to explore the coping strategies of those affected by the crisis at household level. Some parts of the vulnerable population, although experiencing the same living conditions
as others, are developing resilience, which means that they demonstrate social, economic and cultural practices and habits which protect them from suf-fering and harm, and support sustainable patterns of coping and adaption.
This resilience can consist of identity pat-terns, knowledge, family or community relations, and cultural and social as well as economic practices, whether formal or informal. Welfare states, labour markets and economic policies form the ‘environ-ment’ of those resilience patterns.
The RESCuE project’s main questions are directed at understanding the patterns and dimensions of resilience at household level in different types and variations of
European Member and neighbouring States. The project accounts for regional varieties, relevant internal and external conditions and resources as well as influences on these patterns by social, economic or labour market policy as well as legal regulations.
RESCuE has been producing national state-of-the-art reports and will deliver a synthesised, comparative international report in due course (WP 2). The period of extensive field work, consisting mainly of qualitative interviews with households exposed to the effects of the crisis in various states, is also coming to an end soon (WP3). A key mid-term deliverable will be a comparative typology of socio-economic resilience practices of house-holds in Europe.
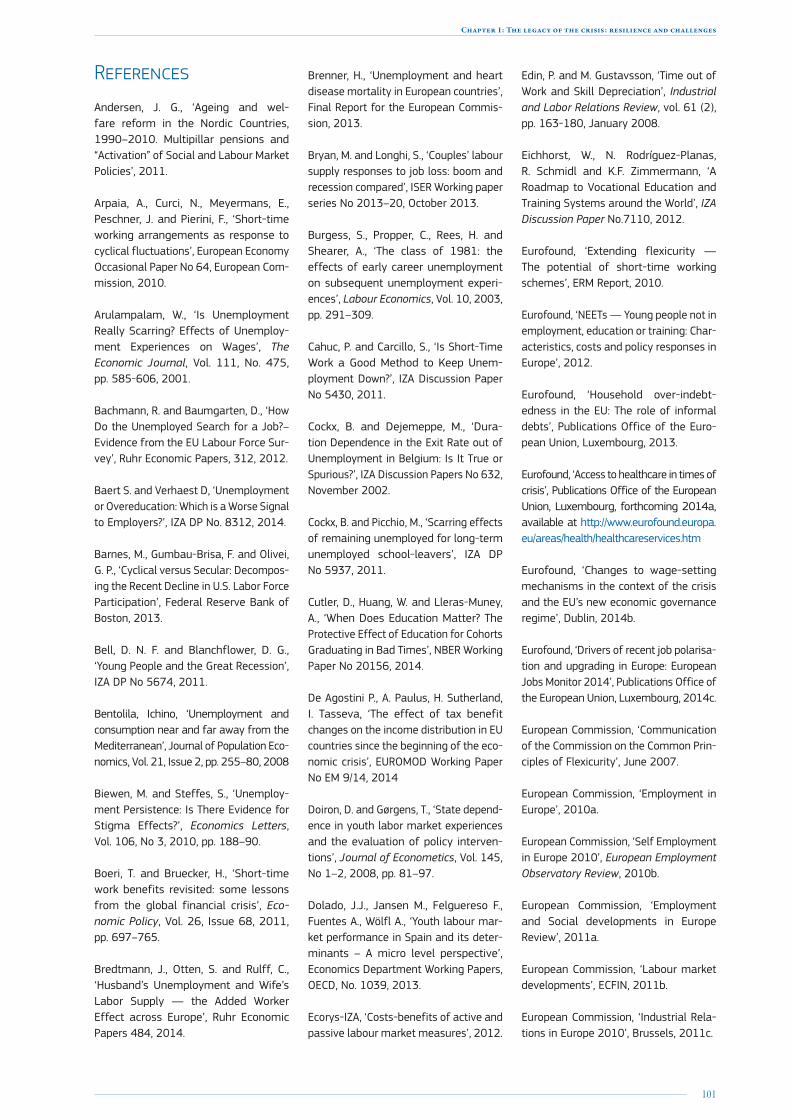
101
Chapter 1: The legacy of the crisis: resilience and challenges
References
Andersen, J. G., ‘Ageing and wel-fare reform in the Nordic Countries, 1990–2010. Multipillar pensions and “Activation” of Social and Labour Market Policies’, 2011.
Arpaia, A., Curci, N., Meyermans, E., Peschner, J. and Pierini, F., ‘Short-time working arrangements as response to cyclical fluctuations’, European Economy Occasional Paper No 64, European Com-mission, 2010.
Arulampalam, W., ‘Is Unemployment Really Scarring? Effects of Unemploy-ment Experiences on Wages’, The Economic Journal, Vol. 111, No. 475, pp. 585-606, 2001.
Bachmann, R. and Baumgarten, D., ‘How Do the Unemployed Search for a Job?–Evidence from the EU Labour Force Sur-vey’, Ruhr Economic Papers, 312, 2012.
Baert S. and Verhaest D, ‘Unemployment or Overeducation: Which is a Worse Signal to Employers?’, IZA DP No. 8312, 2014.
Barnes, M., Gumbau-Brisa, F. and Olivei, G. P., ‘Cyclical versus Secular: Decompos-ing the Recent Decline in U.S. Labor Force Participation’, Federal Reserve Bank of Boston, 2013.
Bell, D. N. F. and Blanchflower, D. G., ‘Young People and the Great Recession’, IZA DP No 5674, 2011.
Bentolila, Ichino, ‘Unemployment and consumption near and far away from the Mediterranean’, Journal of Population Eco-nomics, Vol. 21, Issue 2, pp. 255–80, 2008
Biewen, M. and Steffes, S., ‘Unemploy-ment Persistence: Is There Evidence for Stigma Effects?’, Economics Letters, Vol. 106, No 3, 2010, pp. 188–90.
Boeri, T. and Bruecker, H., ‘Short-time work benefits revisited: some lessons from the global financial crisis’, Eco-nomic Policy, Vol. 26, Issue 68, 2011, pp. 697–765.
Bredtmann, J., Otten, S. and Rulff, C., ‘Husband’s Unemployment and Wife’s Labor Supply — the Added Worker Effect across Europe’, Ruhr Economic Papers 484, 2014.
Brenner, H., ‘Unemployment and heart disease mortality in European countries’, Final Report for the European Commis-sion, 2013.
Bryan, M. and Longhi, S., ‘Couples’ labour supply responses to job loss: boom and recession compared’, ISER Working paper series No 2013–20, October 2013.
Burgess, S., Propper, C., Rees, H. and Shearer, A., ‘The class of 1981: the effects of early career unemployment on subsequent unemployment experi-ences’, Labour Economics, Vol. 10, 2003, pp. 291–309.
Cahuc, P. and Carcillo, S., ‘Is Short-Time Work a Good Method to Keep Unem-ployment Down?’, IZA Discussion Paper No 5430, 2011.
Cockx, B. and Dejemeppe, M., ‘Dura-tion Dependence in the Exit Rate out of Unemployment in Belgium: Is It True or Spurious?’, IZA Discussion Papers No 632, November 2002.
Cockx, B. and Picchio, M., ‘Scarring effects of remaining unemployed for long-term unemployed school-leavers’, IZA DP No 5937, 2011.
Cutler, D., Huang, W. and Lleras-Muney, A., ‘When Does Education Matter? The Protective Effect of Education for Cohorts Graduating in Bad Times’, NBER Working Paper No 20156, 2014.
De Agostini P., A. Paulus, H. Sutherland, I. Tasseva, ‘The effect of tax benefit changes on the income distribution in EU countries since the beginning of the eco-nomic crisis’, EUROMOD Working Paper No EM 9/14, 2014
Doiron, D. and Gørgens, T., ‘State depend-ence in youth labor market experiences and the evaluation of policy interven-tions’, Journal of Econometics, Vol. 145, No 1–2, 2008, pp. 81–97.
Dolado, J.J., Jansen M., Felguereso F., Fuentes A., Wölfl A., ‘Youth labour mar-ket performance in Spain and its deter-minants – A micro level perspective’, Economics Department Working Papers, OECD, No. 1039, 2013.
Ecorys-IZA, ‘Costs-benefits of active and passive labour market measures’, 2012.
Edin, P. and M. Gustavsson, ‘Time out of Work and Skill Depreciation’, Industrial and Labor Relations Review, vol. 61 (2), pp. 163-180, January 2008.
Eichhorst, W., N. Rodríguez-Planas, R. Schmidl and K.F. Zimmermann, ‘A Roadmap to Vocational Education and Training Systems around the World’, IZA Discussion Paper No.7110, 2012.
Eurofound, ‘Extending flexicurity — The potential of short-time working schemes’, ERM Report, 2010.
Eurofound, ‘NEETs — Young people not in employment, education or training: Char-acteristics, costs and policy responses in Europe’, 2012.
Eurofound, ‘Household over-indebt-edness in the EU: The role of informal debts’, Publications Office of the Euro-pean Union, Luxembourg, 2013.
Eurofound, ‘Access to healthcare in times of crisis’, Publications Office of the European Union, Luxembourg, forthcoming 2014a, available at http://www.eurofound.europa.eu/areas/health/healthcareservices.htm
Eurofound, ‘Changes to wage-setting mechanisms in the context of the crisis and the EU’s new economic governance regime’, Dublin, 2014b.
Eurofound, ‘Drivers of recent job polarisa-tion and upgrading in Europe: European Jobs Monitor 2014’, Publications Office of the European Union, Luxembourg, 2014c.
European Commission, ‘Communication of the Commission on the Common Prin-ciples of Flexicurity’, June 2007.
European Commission, ‘Employment in Europe’, 2010a.
European Commission, ‘Self Employment in Europe 2010’, European Employment Observatory Review, 2010b.
European Commission, ‘Employment and Social developments in Europe Review’, 2011a.
European Commission, ‘Labour market developments’, ECFIN, 2011b.
European Commission, ‘Industrial Rela-tions in Europe 2010’, Brussels, 2011c.
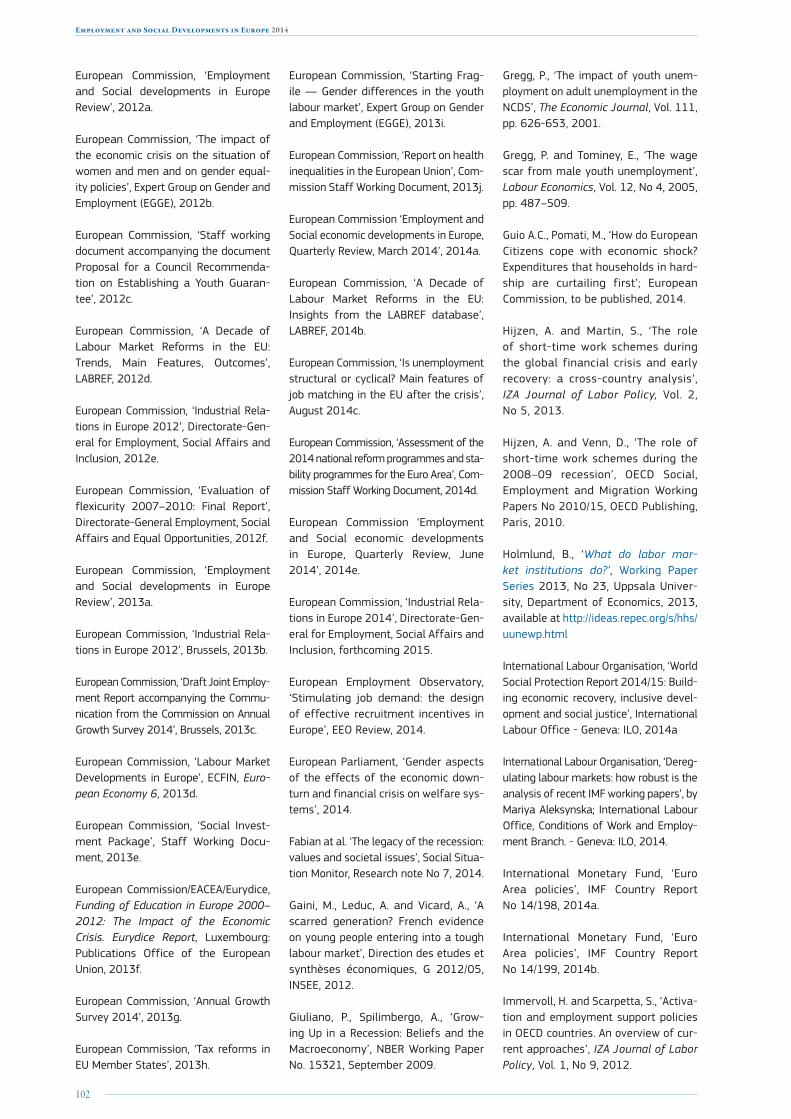
102
Employment and Social Developments in Europe 2014
European Commission, ‘Employment and Social developments in Europe Review’, 2012a.
European Commission, ‘The impact of the economic crisis on the situation of women and men and on gender equal-ity policies’, Expert Group on Gender and Employment (EGGE), 2012b.
European Commission, ‘Staff working document accompanying the document Proposal for a Council Recommenda-tion on Establishing a Youth Guaran-tee’, 2012c.
European Commission, ‘A Decade of Labour Market Reforms in the EU: Trends, Main Features, Outcomes’, LABREF, 2012d.
European Commission, ‘Industrial Rela-tions in Europe 2012’, Directorate-Gen-eral for Employment, Social Affairs and Inclusion, 2012e.
European Commission, ‘Evaluation of flexicurity 2007–2010: Final Report’, Directorate-General Employment, Social Affairs and Equal Opportunities, 2012f.
European Commission, ‘Employment and Social developments in Europe Review’, 2013a.
European Commission, ‘Industrial Rela-tions in Europe 2012’, Brussels, 2013b.
European Commission, ‘Draft Joint Employ-ment Report accompanying the Commu-nication from the Commission on Annual Growth Survey 2014’, Brussels, 2013c.
European Commission, ‘Labour Market Developments in Europe’, ECFIN, Euro-pean Economy 6, 2013d.
European Commission, ‘Social Invest-ment Package’, Staff Working Docu-ment, 2013e.
European Commission/EACEA/Eurydice, Funding of Education in Europe 2000–2012: The Impact of the Economic Crisis. Eurydice Report, Luxembourg: Publications Office of the European Union, 2013f.
European Commission, ‘Annual Growth Survey 2014’, 2013g.
European Commission, ‘Tax reforms in EU Member States’, 2013h.
European Commission, ‘Starting Frag-ile — Gender differences in the youth labour market’, Expert Group on Gender and Employment (EGGE), 2013i.
European Commission, ‘Report on health inequalities in the European Union’, Com-mission Staff Working Document, 2013j.
European Commission ‘Employment and Social economic developments in Europe, Quarterly Review, March 2014’, 2014a.
European Commission, ‘A Decade of Labour Market Reforms in the EU: Insights from the LABREF database’, LABREF, 2014b.
European Commission, ‘Is unemployment structural or cyclical? Main features of job matching in the EU after the crisis’, August 2014c.
European Commission, ‘Assessment of the 2014 national reform programmes and sta-bility programmes for the Euro Area’, Com-mission Staff Working Document, 2014d.
European Commission ‘Employment and Social economic developments in Europe, Quarterly Review, June 2014’, 2014e.
European Commission, ‘Industrial Rela-tions in Europe 2014’, Directorate-Gen-eral for Employment, Social Affairs and Inclusion, forthcoming 2015.
European Employment Observatory, ‘Stimulating job demand: the design of effective recruitment incentives in Europe’, EEO Review, 2014.
European Parliament, ‘Gender aspects of the effects of the economic down-turn and financial crisis on welfare sys-tems’, 2014.
Fabian at al. ‘The legacy of the recession: values and societal issues’, Social Situa-tion Monitor, Research note No 7, 2014.
Gaini, M., Leduc, A. and Vicard, A., ‘A scarred generation? French evidence on young people entering into a tough labour market’, Direction des etudes et synthèses économiques, G 2012/05, INSEE, 2012.
Giuliano, P., Spilimbergo, A., ‘Grow-ing Up in a Recession: Beliefs and the Macroeconomy’, NBER Working Paper No. 15321, September 2009.
Gregg, P., ‘The impact of youth unem-ployment on adult unemployment in the NCDS’, The Economic Journal, Vol. 111, pp. 626-653, 2001.
Gregg, P. and Tominey, E., ‘The wage scar from male youth unemployment’, Labour Economics, Vol. 12, No 4, 2005, pp. 487–509.
Guio A.C., Pomati, M., ‘How do European Citizens cope with economic shock? Expenditures that households in hard-ship are curtailing first’; European Commission, to be published, 2014.
Hijzen, A. and Martin, S., ‘The role of short-time work schemes during the global financial crisis and early recovery: a cross-country analysis’, IZA Journal of Labor Policy, Vol. 2, No 5, 2013.
Hijzen, A. and Venn, D., ‘The role of short-time work schemes during the 2008–09 recession’, OECD Social, Employment and Migration Working Papers No 2010/15, OECD Publishing, Paris, 2010.
Holmlund, B., ‘What do labor mar-ket institutions do?’, Working Paper Series 2013, No 23, Uppsala Univer-sity, Department of Economics, 2013, available at http://ideas.repec.org/s/hhs/uunewp.html
International Labour Organisation, ‘World Social Protection Report 2014/15: Build-ing economic recovery, inclusive devel-opment and social justice’, International Labour Office - Geneva: ILO, 2014a
International Labour Organisation, ‘Dereg-ulating labour markets: how robust is the analysis of recent IMF working papers’, by Mariya Aleksynska; International Labour Office, Conditions of Work and Employ-ment Branch. - Geneva: ILO, 2014.
International Monetary Fund, ‘Euro Area policies’, IMF Country Report No 14/198, 2014a.
International Monetary Fund, ‘Euro Area policies’, IMF Country Report No 14/199, 2014b.
Immervoll, H. and Scarpetta, S., ‘Activa-tion and employment support policies in OECD countries. An overview of cur-rent approaches’, IZA Journal of Labor Policy, Vol. 1, No 9, 2012.
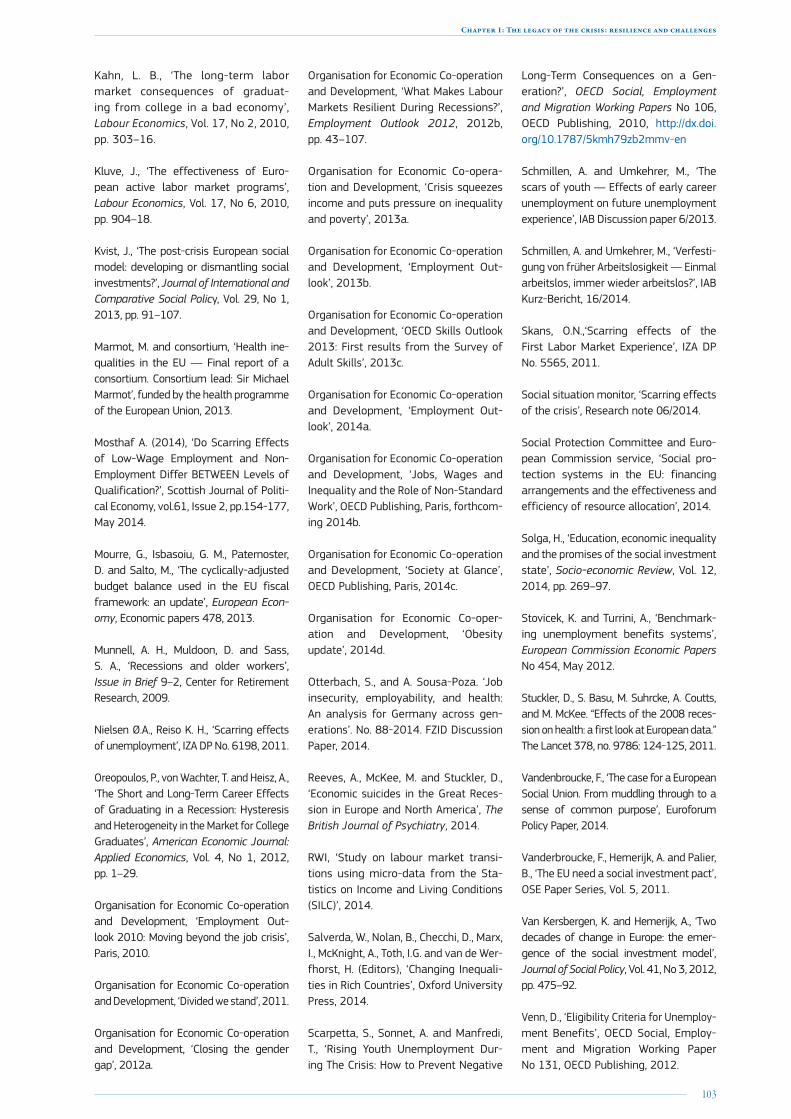
103
Chapter 1: The legacy of the crisis: resilience and challenges
Kahn, L. B., ‘The long-term labor market consequences of graduat-ing from college in a bad economy’, Labour Economics, Vol. 17, No 2, 2010, pp. 303–16.
Kluve, J., ‘The effectiveness of Euro-pean active labor market programs’, Labour Economics, Vol. 17, No 6, 2010, pp. 904–18.
Kvist, J., ‘The post-crisis European social model: developing or dismantling social investments?’, Journal of International and Comparative Social Policy, Vol. 29, No 1, 2013, pp. 91–107.
Marmot, M. and consortium, ‘Health ine-qualities in the EU — Final report of a consortium. Consortium lead: Sir Michael Marmot’, funded by the health programme of the European Union, 2013.
Mosthaf A. (2014), ‘Do Scarring Effects of Low-Wage Employment and Non-Employment Differ BETWEEN Levels of Qualification?’, Scottish Journal of Politi-cal Economy, vol.61, Issue 2, pp.154-177, May 2014.
Mourre, G., Isbasoiu, G. M., Paternoster, D. and Salto, M., ‘The cyclically-adjusted budget balance used in the EU fiscal framework: an update’, European Econ-omy, Economic papers 478, 2013.
Munnell, A. H., Muldoon, D. and Sass, S. A., ‘Recessions and older workers’, Issue in Brief 9–2, Center for Retirement Research, 2009.
Nielsen Ø.A., Reiso K. H., ‘Scarring effects of unemployment’, IZA DP No. 6198, 2011.
Oreopoulos, P., von Wachter, T. and Heisz, A., ‘The Short and Long-Term Career Effects of Graduating in a Recession: Hysteresis and Heterogeneity in the Market for College Graduates’, American Economic Journal: Applied Economics, Vol. 4, No 1, 2012, pp. 1–29.
Organisation for Economic Co-operation and Development, ‘Employment Out-look 2010: Moving beyond the job crisis’, Paris, 2010.
Organisation for Economic Co-operation and Development, ‘Divided we stand’, 2011.
Organisation for Economic Co-operation and Development, ‘Closing the gender gap’, 2012a.
Organisation for Economic Co-operation and Development, ‘What Makes Labour Markets Resilient During Recessions?’, Employment Outlook 2012, 2012b, pp. 43–107.
Organisation for Economic Co-opera-tion and Development, ‘Crisis squeezes income and puts pressure on inequality and poverty’, 2013a.
Organisation for Economic Co-operation and Development, ‘Employment Out-look’, 2013b.
Organisation for Economic Co-operation and Development, ‘OECD Skills Outlook 2013: First results from the Survey of Adult Skills’, 2013c.
Organisation for Economic Co-operation and Development, ‘Employment Out-look’, 2014a.
Organisation for Economic Co-operation and Development, ‘Jobs, Wages and Inequality and the Role of Non-Standard Work’, OECD Publishing, Paris, forthcom-ing 2014b.
Organisation for Economic Co-operation and Development, ‘Society at Glance’, OECD Publishing, Paris, 2014c.
Organisation for Economic Co-oper-ation and Development, ‘Obesity update’, 2014d.
Otterbach, S., and A. Sousa-Poza. ‘Job insecurity, employability, and health: An analysis for Germany across gen-erations’. No. 88-2014. FZID Discussion Paper, 2014.
Reeves, A., McKee, M. and Stuckler, D., ‘Economic suicides in the Great Reces-sion in Europe and North America’, The British Journal of Psychiatry, 2014.
RWI, ‘Study on labour market transi-tions using micro-data from the Sta-tistics on Income and Living Conditions (SILC)’, 2014.
Salverda, W., Nolan, B., Checchi, D., Marx, I., McKnight, A., Toth, I.G. and van de Wer-fhorst, H. (Editors), ‘Changing Inequali-ties in Rich Countries’, Oxford University Press, 2014.
Scarpetta, S., Sonnet, A. and Manfredi, T., ‘Rising Youth Unemployment Dur-ing The Crisis: How to Prevent Negative
Long-Term Consequences on a Gen-eration?’, OECD Social, Employment and Migration Working Papers No 106, OECD Publishing, 2010, http://dx.doi.org/10.1787/5kmh79zb2mmv-en
Schmillen, A. and Umkehrer, M., ‘The scars of youth — Effects of early career unemployment on future unemployment experience’, IAB Discussion paper 6/2013.
Schmillen, A. and Umkehrer, M., ‘Verfesti-gung von früher Arbeitslosigkeit — Einmal arbeitslos, immer wieder arbeitslos?’, IAB Kurz-Bericht, 16/2014.
Skans, O.N.,‘Scarring effects of the First Labor Market Experience’, IZA DP No. 5565, 2011.
Social situation monitor, ‘Scarring effects of the crisis’, Research note 06/2014.
Social Protection Committee and Euro-pean Commission service, ‘Social pro-tection systems in the EU: financing arrangements and the effectiveness and efficiency of resource allocation’, 2014.
Solga, H., ‘Education, economic inequality and the promises of the social investment state’, Socio-economic Review, Vol. 12, 2014, pp. 269–97.
Stovicek, K. and Turrini, A., ‘Benchmark-ing unemployment benefits systems’, European Commission Economic Papers No 454, May 2012.
Stuckler, D., S. Basu, M. Suhrcke, A. Coutts, and M. McKee. “Effects of the 2008 reces-sion on health: a first look at European data.” The Lancet 378, no. 9786: 124-125, 2011.
Vandenbroucke, F., ‘The case for a European Social Union. From muddling through to a sense of common purpose’, Euroforum Policy Paper, 2014.
Vanderbroucke, F., Hemerijk, A. and Palier, B., ‘The EU need a social investment pact’, OSE Paper Series, Vol. 5, 2011.
Van Kersbergen, K. and Hemerijk, A., ‘Two decades of change in Europe: the emer-gence of the social investment model’, Journal of Social Policy, Vol. 41, No 3, 2012, pp. 475–92.
Venn, D., ‘Eligibility Criteria for Unemploy-ment Benefits’, OECD Social, Employ-ment and Migration Working Paper No 131, OECD Publishing, 2012.