CHAPTER 1: THE FATE AND TRANSPORT OF …archive.lib.msu.edu/tic/thesdiss/soldat2007b.pdfCHAPTER 1:...
40
CHAPTER 1: THE FATE AND TRANSPORT OF PHOSPHORUS IN TURFGRASS ECOSYSTEMS ABSTRACT Urban areas have been identified as a major contributor to declining surface water quality, due to phosphorus (P) pollution. Managed turfgrass areas account for a large percentage of pervious land in urban and suburban areas. Phosphorus losses from turfgrass areas may contribute to water quality problems, yet a comprehensive review of P fate in a turfgrass ecosystem is lacking. The main components of the P cycle include inputs of fertilizer and outputs of clippings. According to available data in the literature, these components appear to be balanced with inputs of fertilizer between 3 – 10 kg ha -1 and outputs of clippings from 3 – 9 kg ha -1 . Although, runoff and leaching losses of P have been found to be of little agronomic importance, they can have a major impact on surface water quality. Sediment losses from turf areas are negligible, but runoff and leaching losses of P vary widely depending on rate, source and timing of fertilizer application. Highest runoff and leaching losses of P occurred when rainfall occurred or was simulated shortly after P fertilizer application. Leaching losses of P have historically been considered relatively minor; however, research results indicate that P leaching losses from native soils (0.2 – 0.7 kg ha -1 ) approach those of runoff P losses (generally < 1 kg ha -1 ) from turfgrass systems. One major gap in the knowledge is how P sources other than fertilizer (i.e. soil and tissue) affect runoff and leaching losses of P. 1
Transcript of CHAPTER 1: THE FATE AND TRANSPORT OF …archive.lib.msu.edu/tic/thesdiss/soldat2007b.pdfCHAPTER 1:...
CHAPTER 1: THE FATE AND TRANSPORT OF PHOSPHORUS IN TURFGRASS
ECOSYSTEMS
ABSTRACT
Urban areas have been identified as a major contributor to declining surface
water quality, due to phosphorus (P) pollution. Managed turfgrass areas account for a
large percentage of pervious land in urban and suburban areas. Phosphorus losses from
turfgrass areas may contribute to water quality problems, yet a comprehensive review of
P fate in a turfgrass ecosystem is lacking. The main components of the P cycle include
inputs of fertilizer and outputs of clippings. According to available data in the literature,
these components appear to be balanced with inputs of fertilizer between 3 – 10 kg ha-1
and outputs of clippings from 3 – 9 kg ha-1. Although, runoff and leaching losses of P
have been found to be of little agronomic importance, they can have a major impact on
surface water quality. Sediment losses from turf areas are negligible, but runoff and
leaching losses of P vary widely depending on rate, source and timing of fertilizer
application. Highest runoff and leaching losses of P occurred when rainfall occurred or
was simulated shortly after P fertilizer application. Leaching losses of P have
historically been considered relatively minor; however, research results indicate that P
leaching losses from native soils (0.2 – 0.7 kg ha-1) approach those of runoff P losses
(generally < 1 kg ha-1) from turfgrass systems. One major gap in the knowledge is how
P sources other than fertilizer (i.e. soil and tissue) affect runoff and leaching losses of P.
1
INTRODUCTION
Poor water quality is a widespread problem for many of the nation’s surface
water bodies. Excessive nutrient levels are responsible for water quality impairment in
20% of the rivers and streams, and 50% for lakes and reservoirs (USEPA, 2000).
Eutrophication is the process of nutrient enrichment of an aquatic ecosystem that results
in increased primary production, decreased dissolved oxygen, and decreased
biodiversity. Increased primary production can negatively affect the use of the water as
a drinking water source, and for fisheries, recreation, industry, and agriculture
(Carpenter et al. 1998). There is considerable evidence that P is the limiting nutrient for
primary production in most fresh surface water bodies (Correll, 1998) and thus,
excessive inputs of P results in a decline in surface water quality. Phosphorus can enter
a water body through point sources, typically sewage and industrial outfalls; or through
non-point sources, which arise from spatially ill-defined areas of the landscape.
Agricultural and urban areas are cited as the two most important contributors to non-
point source pollution (Carpenter et al., 1998).
Turfgrass cover in the US has recently been estimated to be 164,000 km2 (Milesi
et al., 2005), or 1.8% of the nation’s land area. For comparison, total harvested cropland
accounts for 19.2% of the nation’s land surface area (National Agriculture Statistics
Service, 2002). In states with large population densities, turfgrass area can exceed 20%
(Milesi et al., 2005). According to surveys conducted in New York, North Carolina, and
Wisconsin, 64 – 90% of turfgrass in these states is found in home lawns (Murphy, 1999;
Wisconsin Agricultural Statistics Service, 2001; New York Agricultural Statistics
Service, 2004). The amount of turfgrass in the US is expected to continue to increase as
suburban areas continue to grow. Given the large (and expanding) amount of area in
2

turfgrass in the US, it is important to understand how turfgrass areas affect water
quality.
In the last few decades a significant amount of research has been conducted on
agricultural losses of P (Sims and Sharpley, 2005). These research results have led to
the development of risk assessment tools and management strategies for reducing P
loss. However, far less work has been conducted on P losses from urban and suburban
areas. It is likely that the differences between agricultural areas and turfgrass areas are
sufficient enough to conclude that risk assessment tools and management strategies
developed to reduce P loss from agricultural areas may not be effective in turfgrass
ecosystems. Such differences include: 1) a much more dense ground cover in turfgrass
systems that results in the majority of P loss as dissolved P rather than particulate P, 2)
the presence of an organic thatch layer in turfgrass systems that, along with the dense
living vegetation, reduces the interaction between runoff and soil P 3) turfgrass soil may
have a greater degree of vertical soil P stratification due to limited soil mixing which
may lead to increased P loss from the soil surface, 4) a network of stable macropores in
undisturbed turfgrass areas which could increase P movement through preferential flow
and reduce runoff P losses, 5) greater resources available to turfgrass managers which
allows for more intensive management for many turfgrass areas (also the opportunity
for more intensive remediation), 6) suburban watershed are often more complex than
agricultural watershed due to presences of impervious surfaces and storm drains, and 7)
a smaller spatial scale where management practices and soil properties can vary
tremendously within a watershed thus making the use of processed-based P transport
models and risk assessment tools more data intensive.
The purpose of this paper is to summarize and synthesize the current knowledge
of fate of phosphorus in turfgrass ecosystems, identify best management practices for
3
reducing P loss from turfgrass areas, and identify relevant knowledge gaps that can
guide future P-related turfgrass research.
TURFGRASS RESPONSE TO APPLIED AND SOIL PHOSPHORUS
Phosphorus is an essential element for all life and plays important role in energy
transfer and is a structural component of DNA and RNA. Along with N, P is a growth-
limiting nutrient in many natural and agricultural environments. Phosphorus availability
to plants is a function of the density and distribution of roots, the concentration of P in
the soil solution, and the ability of the soil to replenish depleted P from the soil solution
(Barber, 1995). In a review of the response of turfgrass to P, Turner and Hummel
(1992) note that growth responses of newly seeded turfgrass to P fertilizer are dramatic;
but growth responses to P fertilizer are infrequent and inconsistent on established turf
areas. To predict whether plants will respond to a P fertilizer application, several
chemical soil P extractants have been developed to estimate potentially plant available
P. Knowledge of how extractable soil P levels relate to turfgrass growth, visual quality,
or P concentration in tissue allows for P fertilizer recommendations to be made based
on soil test P levels. Although the relationship between various agronomic parameters
and soil P levels have been studied by turfgrass scientists (Turner, 1980; Houlihan,
2005; Petrovic et al., 2005), many soil testing labs make fertilizer recommendations
based on data from agronomic crops with modifications as deemed appropriate by
turfgrass scientists (Carrow et al., 2004).
The chemical extractants estimate potential P availability in soil, but do not
consider root distribution and density. Therefore, P in soil will be less available to
newly seeded, sprigged, or sodded turfgrass areas (with small root systems) than in
4

established turfgrass areas with well developed root systems. For this reason, fertilizer
additions of P are required with greater frequency to maximize growth or visual quality
on new turfgrass areas than on established areas. Carroll et al. (2005) found seedling
biomass of Festuca arundinaceae Schreb. increased in response to P fertilizer up to a
Mehlich 3 extractable soil P level of 163 mg kg-1; in contrast, established stands of
turfgrass are not likely to respond to a P fertilizer addition if Mehlich 3 extractable soil
P is > 26 mg kg-1 (Carrow et al., 2004).
Properly calibrated (research-based) soil test interpretations are required to
maximize the efficiency of fertilizer applications. Because turfgrass response to soil and
fertilizer P are dependent on such factors as turfgrass species or cultivar, management
practices, climatic conditions, soil texture, mineralogy, and chemical properties, more
research is required in each of these areas to improve fertilizer recommendations based
on soil test results; however, a comprehensive review of research in this area is beyond
the scope of this review.
PHOSPHORUS CYCLE IN TURFGRASS ECOSYSTEMS
Phosphorus Inputs
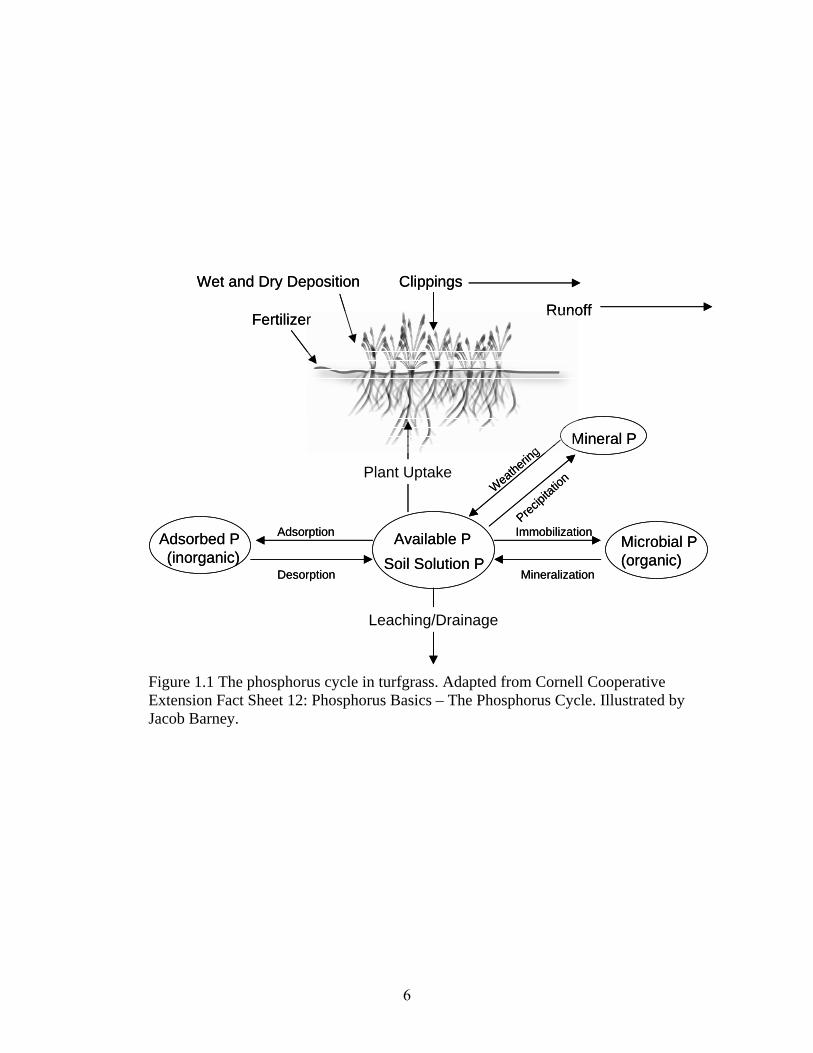
The primary P input to turfgrass systems is surface-applied organic or inorganic
fertilizers (Fig. 1.1). An application of P fertilizer is recommended by professionals
only when an agronomic need is indicated by a soil or tissue test. However, P-free
fertilizers are not always commercially available to non-professional turfgrass
managers. Homeowners usually apply fertilizer to meet N requirements, and therefore,
P is usually applied as well. Following fertilizer label direction of various so-called
“four step programs” will result in the application of 16 – 73 kg P2O5 ha-1 yr-1 (7 – 32
5
Fertilizer
Clippings
Runoff
Soil Solution PAdsorbed P(inorganic)
Microbial P(organic)
Mineral P
Adsorption
Desorption Mineralization
Weathering
Plant Uptake
Leaching/Drainage
ImmobilizationPrec
ipitat
ion
Available P
Wet and Dry Deposition
Fertilizer
Clippings
Runoff
Soil Solution PAdsorbed P(inorganic)
Microbial P(organic)
Mineral P
Adsorption
Desorption Mineralization
Weathering
Plant Uptake
Leaching/Drainage
ImmobilizationPrec
ipitat
ion
Available P
Wet and Dry Deposition
Figure 1.1 The phosphorus cycle in turfgrass. Adapted from Cornell Cooperative Extension Fact Sheet 12: Phosphorus Basics – The Phosphorus Cycle. Illustrated by Jacob Barney.
6
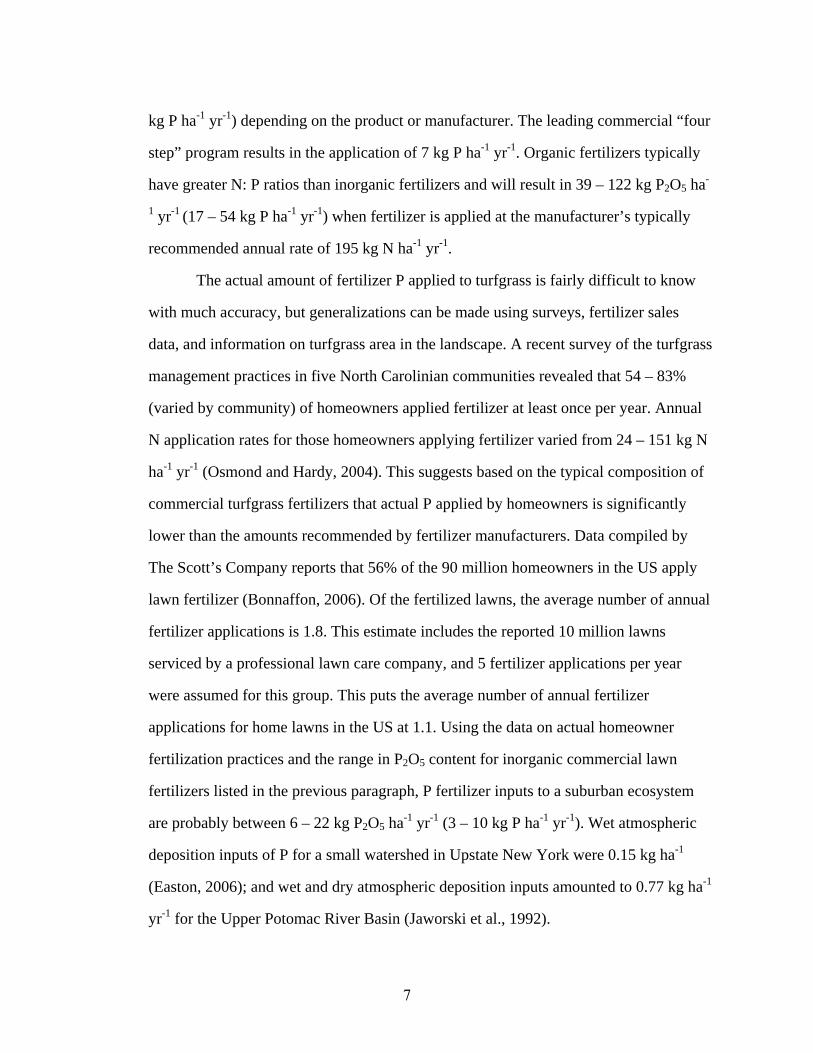
kg P ha-1 yr-1) depending on the product or manufacturer. The leading commercial “four
step” program results in the application of 7 kg P ha-1 yr-1. Organic fertilizers typically
have greater N: P ratios than inorganic fertilizers and will result in 39 – 122 kg P2O5 ha-
1 yr-1 (17 – 54 kg P ha-1 yr-1) when fertilizer is applied at the manufacturer’s typically
recommended annual rate of 195 kg N ha-1 yr-1.
The actual amount of fertilizer P applied to turfgrass is fairly difficult to know
with much accuracy, but generalizations can be made using surveys, fertilizer sales
data, and information on turfgrass area in the landscape. A recent survey of the turfgrass
management practices in five North Carolinian communities revealed that 54 – 83%
(varied by community) of homeowners applied fertilizer at least once per year. Annual
N application rates for those homeowners applying fertilizer varied from 24 – 151 kg N
ha-1 yr-1 (Osmond and Hardy, 2004). This suggests based on the typical composition of
commercial turfgrass fertilizers that actual P applied by homeowners is significantly
lower than the amounts recommended by fertilizer manufacturers. Data compiled by
The Scott’s Company reports that 56% of the 90 million homeowners in the US apply
lawn fertilizer (Bonnaffon, 2006). Of the fertilized lawns, the average number of annual
fertilizer applications is 1.8. This estimate includes the reported 10 million lawns
serviced by a professional lawn care company, and 5 fertilizer applications per year
were assumed for this group. This puts the average number of annual fertilizer
applications for home lawns in the US at 1.1. Using the data on actual homeowner
fertilization practices and the range in P2O5 content for inorganic commercial lawn
fertilizers listed in the previous paragraph, P fertilizer inputs to a suburban ecosystem
are probably between 6 – 22 kg P2O5 ha-1 yr-1 (3 – 10 kg P ha-1 yr-1). Wet atmospheric
deposition inputs of P for a small watershed in Upstate New York were 0.15 kg ha-1
(Easton, 2006); and wet and dry atmospheric deposition inputs amounted to 0.77 kg ha-1
yr-1 for the Upper Potomac River Basin (Jaworski et al., 1992).
7
Phosphorus Outputs
Clipping Removal of Phosphorus
When P is not the growth limiting nutrient, the amount of P removed by
clippings is dependent on the growth rate of the turfgrass which is influenced by
species, temperature, available moisture, and N application rate. Turfgrass tissue
typically contains 3.0 – 5.5 g P kg-1 of dry matter (Jones, 1980). Kussow (unpublished
data) found average clipping production of Poa pratensis L. during the growing season
in WI to be 1,500 – 2,000 kg ha-1 (depending on N fertilization rate). Therefore, in
temperate climates, removing clippings could result in the removal of 5 – 17 kg P ha-1
yr-1. Supporting this calculation, Easton and Petrovic (2004) reported P annual clipping
removal of a mixed stand of P. pratensis L. and Lolium perenne L. in New York to be 4
– 13 kg ha-1 dependent on fertilizer rate and source. If clippings were removed from all
lawns, it appears that outputs might exceed inputs as calculated above. Very little
information exists regarding the percentage of homeowners who actually remove
clippings from their lawns. Osmond and Hardy (2004) found 50% of homeowners in 5
communities in North Carolina collected and removed grass clippings from their lawns.
Based on the rudimentary data available, the primary input (fertilizer) and output
(clippings) of P in turfgrass areas appear to be approximately equal, with estimated
inputs of 3 – 10 kg P ha-1 yr-1 and outputs of 3 – 9 kg P ha-1 yr-1. Although sediment,
runoff, and leaching losses of P are of little importance to the overall P budget, small
losses can have a major impact on water quality. Water bodies vary in sensitivity to P
inputs, making the development of a national standard difficult. However, the
Organization for Economic Cooperation and Development (1982) classifies surface
water with TP concentrations between 0.035 and 0.10 mg L-1 as eutrophic.
8
Sediment Losses in Turfgrass Systems
Dense stands of grass have long been known to be effective at reducing soil
erosion. In 1935 Hugh H. Bennett, regarded by the National Resource Conservation
Service (NRCS) as the father of soil conservation, wrote: “The importance of grass as a
means of controlling erosion is so great that this paper may appropriately be prefaced
with the assertion that where there is a good cover of grass there is no serious problem
of erosion.” (Bennett, 1935). Today, grass buffer strips and vegetated waterways are
two commonly employed best management practices (BMPs) for minimizing sediment
loss from agricultural areas (Sims and Kleinman, 2005). The effectiveness of grassed
waterways and vegetated buffers at reducing sediment and P loss is highly variable and
found to depend on such factors as runoff volume input and physical characteristics of
the site (soil, slope) and grass waterway or buffer strip (width, grass type, density,
management). Vegetated filter strips and waterways function primarily to reduce
erosion and particulate P loads, but also have been shown to decrease soluble P load in
runoff by reducing runoff volume (Abu-Zreig et al., 2003; Fiener and Auerswald,
2003).
When managed properly, turfgrass can form a dense ground cover with shoot
density ranging from 7,500 to 2 million shoots m-2 (Beard and Green, 1994) depending
on turfgrass species selection and primary cultural practices. Therefore, it is no surprise
to learn that sediment loss from turfgrass areas has been found to be very low (Table
1.1). Linde and Watschke (1997) found no detectable sediment in 83% of 237 runoff
samples from creeping bentgrass and perennial ryegrass turf. Kussow (1996) was
unable to detect sediment in runoff on P. pratensis L. turfgrass in WI. In that study the
majority of runoff occurred during snowmelt events. Gross (1990) observed very low
sediment losses (3.2 – 16.2 kg ha-1) in runoff from turfgrass from natural rainfall events.
Gross et al. (1991) used simulated rainfall to generate sediment losses from bare soil
9
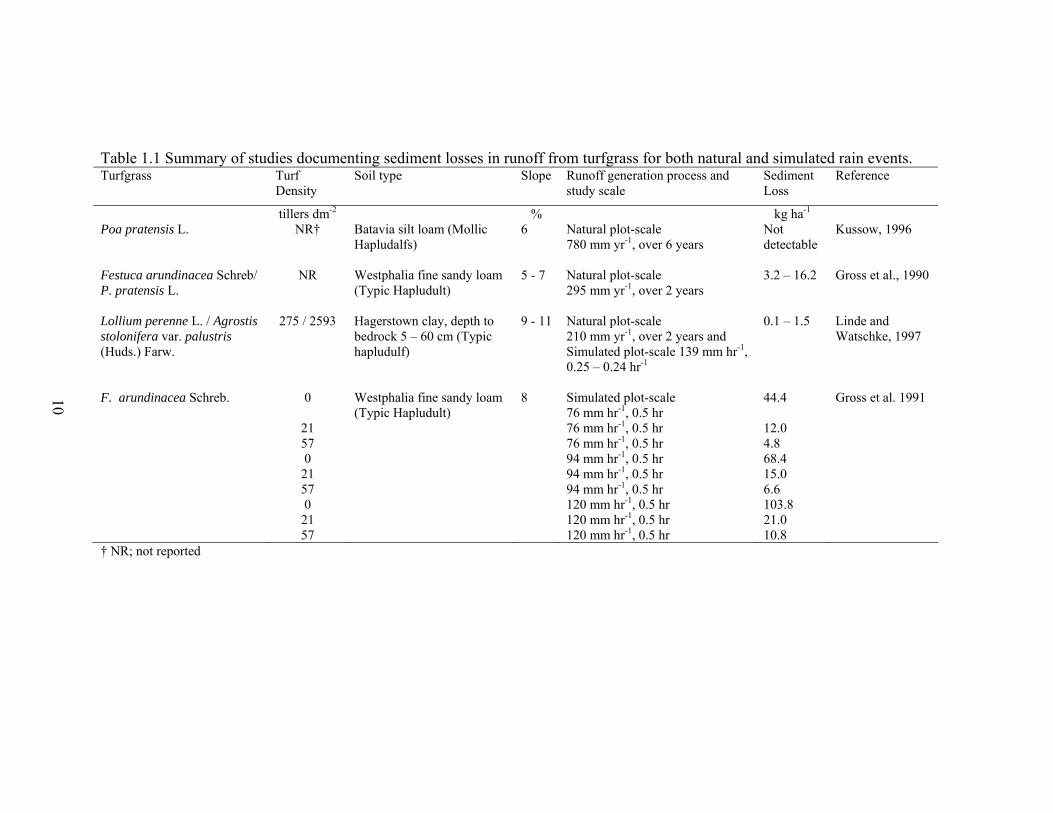
Table 1.1 Summary of studies documenting sediment losses in runoff from turfgrass for both natural and simulated rain events. Turfgrass Turf
Density Soil type Slope Runoff generation process and
study scale Sediment Loss
Reference
tillers dm-2 % kg ha-1 Poa pratensis L. NR† Batavia silt loam (Mollic
Hapludalfs) 6 Natural plot-scale
780 mm yr-1, over 6 years Not detectable
Kussow, 1996
Festuca arundinacea Schreb/ P. pratensis L.
NR Westphalia fine sandy loam (Typic Hapludult)
5 - 7 Natural plot-scale 295 mm yr-1, over 2 years
3.2 – 16.2 Gross et al., 1990
Lollium perenne L. / Agrostis stolonifera var. palustris (Huds.) Farw.
275 / 2593 Hagerstown clay, depth to bedrock 5 – 60 cm (Typic hapludulf)
9 - 11 Natural plot-scale 210 mm yr-1, over 2 years and Simulated plot-scale 139 mm hr-1, 0.25 – 0.24 hr-1
0.1 – 1.5 Linde and Watschke, 1997
F. arundinacea Schreb. 0 Westphalia fine sandy loam
(Typic Hapludult) 8 Simulated plot-scale
76 mm hr-1, 0.5 hr 44.4 Gross et al. 1991
21 76 mm hr-1, 0.5 hr 12.0 57 76 mm hr-1, 0.5 hr 4.8 0 94 mm hr-1, 0.5 hr 68.4 21 94 mm hr-1, 0.5 hr 15.0 57 94 mm hr-1, 0.5 hr 6.6 0 120 mm hr-1, 0.5 hr 103.8 21 120 mm hr-1, 0.5 hr 21.0 57 120 mm hr-1, 0.5 hr 10.8 † NR; not reported
10

and low density turfgrass. They found that even at low turf density (57 tillers dm-1),
sediment loss were reduced by an order of magnitude compared to sediment losses from
bare soil (Table 1.1).
Sediment losses from turfgrass have also been measured on a watershed scale.
Researchers in Kansas monitored stream water quality of a native grassland watershed
before, during, and after construction of an 18-hole golf course (Starrett et al., 2006).
Total suspended solids (TSS) before construction was 477 mg L-1. During construction,
TSS increased to 2,754 mg L-1, and dropped to 550 mg L-1, a 15% increase from the
pre-construction level, during the early stages of golf course operation. Stream
discharge was not monitored; changes in discharge would affect sediment loading.
Runoff Losses in Turfgrass Systems
Runoff research on turfgrass can be sorted into three categories: 1) plot-scale,
worst-case scenario research were runoff is simulated on small plots shortly after a
fertilizer application is made, 2) plot-scale research where runoff is collected from
natural precipitation or rainfall events, and 3) watershed-scale research where runoff
losses from turfgrass areas are estimated by changes in flow and P concentration of a
water body flowing through a turfgrass dominated landscape.
The studies documenting P runoff losses from turfgrass are summarized in Table
1.2. In general, P runoff losses from recently fertilized turfgrass areas have been shown
to vary with rate of application, with greater losses occurring from higher rates of P
application. The P in runoff can be easily traced back to fertilizer when unfertilized
control plots are included in the study. Losses of P from these types of studies have
ranged from < 1 – 18% of fertilizer P applied, with single-event P loads from 0.04 – 3.1
kg ha-1 (Table 1.2).
11
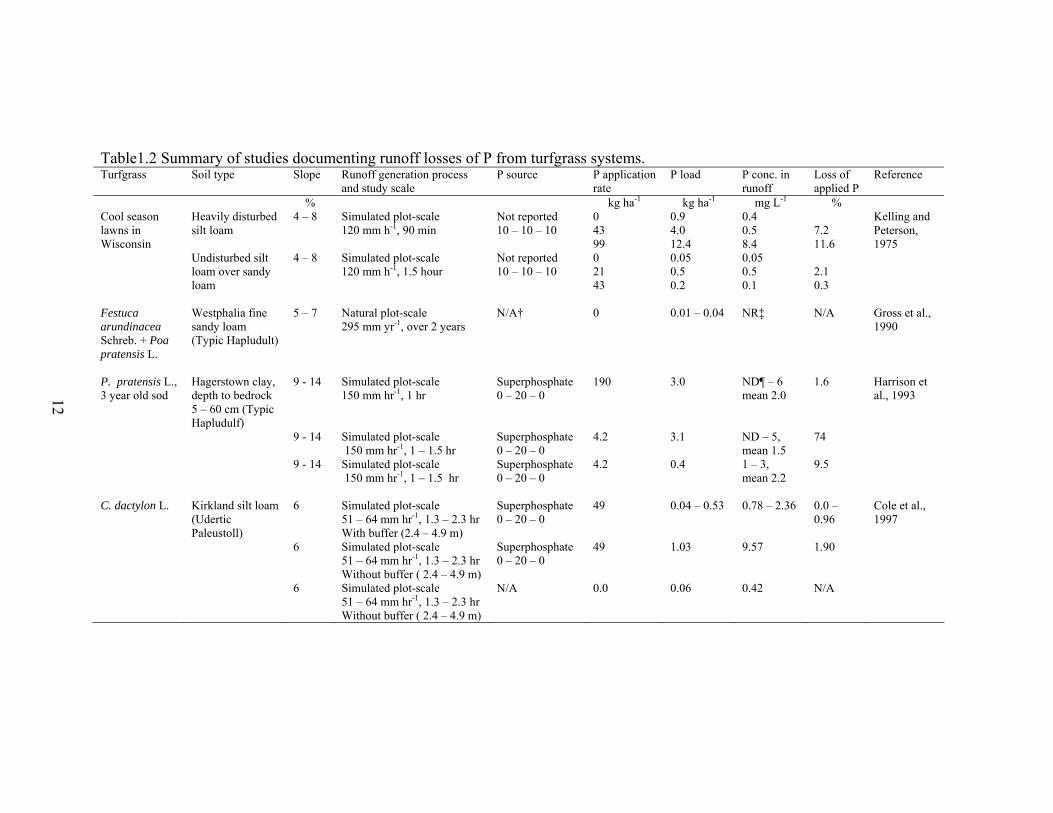
Table1.2 Summary of studies documenting runoff losses of P from turfgrass systems. Turfgrass Soil type Slope Runoff generation process
and study scale P source P application
rate P load P conc. in
runoff Loss of applied P
Reference
% kg ha-1 kg ha-1 mg L-1 % Cool season lawns in Wisconsin
Heavily disturbed silt loam
4 – 8 Simulated plot-scale 120 mm h-1, 90 min
Not reported 10 – 10 – 10
0 43 99
0.9 4.0 12.4
0.4 0.5 8.4
7.2 11.6
Kelling and Peterson, 1975
Undisturbed silt loam over sandy loam
4 – 8 Simulated plot-scale 120 mm h-1, 1.5 hour
Not reported 10 – 10 – 10
0 21 43
0.05 0.5 0.2
0.05 0.5 0.1
2.1 0.3
Festuca arundinacea Schreb. + Poa pratensis L.
Westphalia fine sandy loam (Typic Hapludult)
5 – 7 Natural plot-scale 295 mm yr-1, over 2 years
N/A† 0 0.01 – 0.04 NR‡ N/A Gross et al., 1990
P. pratensis L., 3 year old sod
Hagerstown clay, depth to bedrock 5 – 60 cm (Typic Hapludulf)
9 - 14 Simulated plot-scale 150 mm hr-1, 1 hr
Superphosphate 0 – 20 – 0
190 3.0 ND¶ – 6 mean 2.0
1.6 Harrison et al., 1993
9 - 14 Simulated plot-scale 150 mm hr-1, 1 – 1.5 hr
Superphosphate 0 – 20 – 0
4.2 3.1 ND – 5, mean 1.5
74
9 - 14 Simulated plot-scale 150 mm hr-1, 1 – 1.5 hr
Superphosphate 0 – 20 – 0
4.2 0.4 1 – 3, mean 2.2
9.5
C. dactylon L. Kirkland silt loam
(Udertic Paleustoll)
6 Simulated plot-scale 51 – 64 mm hr-1, 1.3 – 2.3 hr With buffer (2.4 – 4.9 m)
Superphosphate 0 – 20 – 0
49 0.04 – 0.53 0.78 – 2.36 0.0 – 0.96
Cole et al., 1997
6 Simulated plot-scale 51 – 64 mm hr-1, 1.3 – 2.3 hr Without buffer ( 2.4 – 4.9 m)
Superphosphate 0 – 20 – 0
49 1.03 9.57 1.90
6 Simulated plot-scale 51 – 64 mm hr-1, 1.3 – 2.3 hr Without buffer ( 2.4 – 4.9 m)
N/A 0.0 0.06 0.42 N/A
12

Table 1.2 (Continued) Turfgrass Soil type Slope Runoff generation
process and study scale
P source P application rate
P load P conc. in runoff
Loss of applied P
Reference
% kg ha-1 kg ha-1 yr-1 mg L-1 % Lolium perenne L. or Agrostis stolonifera var. palustris (Huds.) Farw.
Hagerstown clay, depth to bedrock 5 – 60 cm (Typic hapludulf)
9- 11 Natural plot-scale 210 mm yr-1, over 2 years
MAP§ 19 – 3 – 19
6 (year 1) 11 (year 2)
0.0 – 0.2 1.6 – 6.6 0 – 1.2 Linde and Watschke, 1997
Simulated plot-scale 139 mm hr-1, 0.25 – 0.24 hr-1
MAP 19 – 3 – 19
6 (year 1) 11 (year 2)
2.1 – 3.1 NR 12.2 – 18.0
C. dactylon L. and L. perenne L.
Several, primarily gravelly loamy sand and silty clay loam
N/A Natural watershed-scale 738 mm 13 mo. -1
Several, primarily MAP and organic
50 kg ha-1 over 13 months
0.33 0.10 – 0.13 14.6 King et al., 2001
C. dactylon L. Boonville fine
sandy loam (Vertic Albaqualf)
8.5 Natural plot-scale 143 mm yr-1, over 2 years
N/A 0 0.22 1.1 – 2.6 N/A Gaudreau et al., 2002
Inorganic P 25 50
0.55 0.88
1.1 – 16.6 1.1 – 30.0
1.3 1.3
Dairy manure 50 100
0.45 0.72
2.4 – 5.5 2.8 – 9.8
0.5 0.5
C. dactylon L. Cecil sandy loam
(Typic Kanhapludult)
5 Simulated plot-scale 27 mm hr-1, 2 hr 4, 24 HAT# 27 mm hr-1, 1 hr 72, 168 HAT
N/A 0 4 HAT 24 HAT 72 HAT 168 HAT
0.12 0.09 0.04 0.04
1.0 0.5 1.1 1.0
N/A
Schuman, 2002
MAP 10 – 10 – 10
5 4 HAT 24 HAT 72 HAT 168 HAT
0.66 0.20 0.08 0.05
4.0 1.1 0.8 1.0
10.9 3.8 0.8 0.2
MAP 10 – 10 – 10
11 4 HAT 24 HAT 72 HAT 168 HAT
1.19 0.44 0.12 0.06
7.0 1.8 1.2 0.8
9.7 3.2 0.7 0.2
13
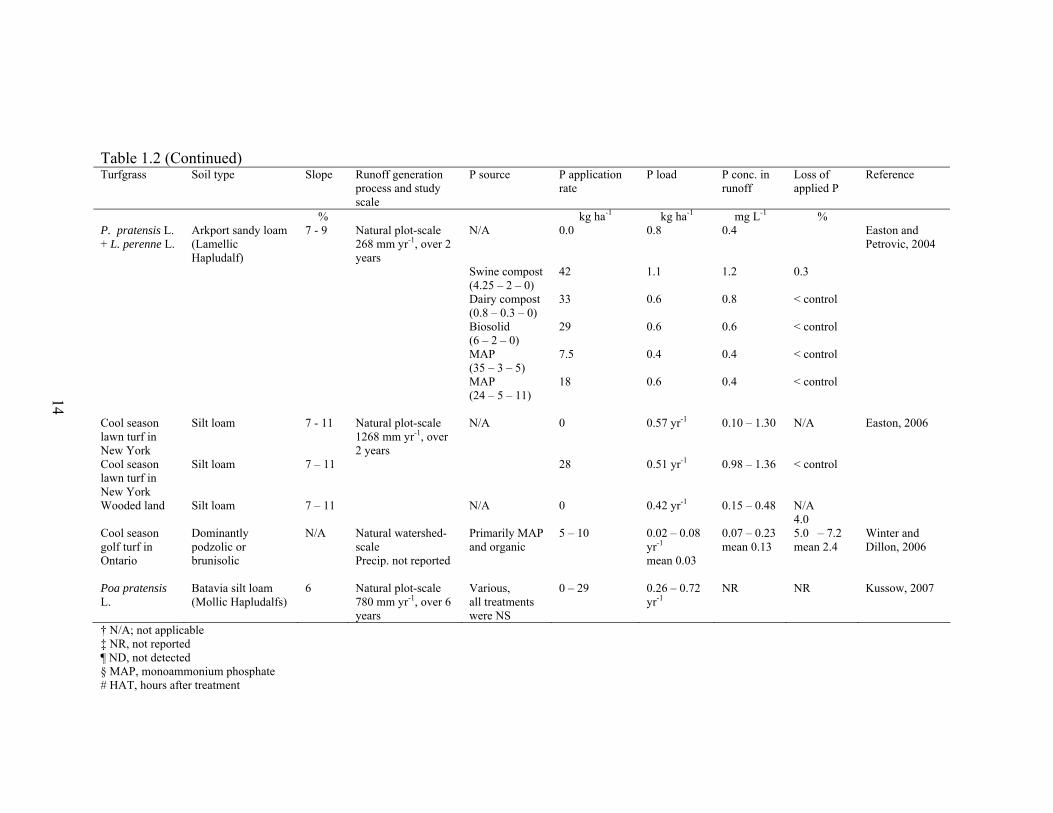
Table 1.2 (Continued) Turfgrass Soil type Slope Runoff generation
process and study scale
P source P application rate
P load P conc. in runoff
Loss of applied P
Reference
% kg ha-1 kg ha-1 mg L-1 % P. pratensis L. + L. perenne L.
Arkport sandy loam (Lamellic Hapludalf)
7 - 9
Natural plot-scale 268 mm yr-1, over 2 years
N/A 0.0 0.8 0.4 Easton and Petrovic, 2004
Swine compost (4.25 – 2 – 0)
42 1.1 1.2 0.3
Dairy compost (0.8 – 0.3 – 0)
33 0.6 0.8 < control
Biosolid (6 – 2 – 0)
29 0.6 0.6 < control
MAP (35 – 3 – 5)
7.5 0.4 0.4 < control
MAP (24 – 5 – 11)
18 0.6 0.4 < control
Cool season lawn turf in New York
Silt loam 7 - 11 Natural plot-scale 1268 mm yr-1, over 2 years
N/A 0 0.57 yr-1 0.10 – 1.30 N/A Easton, 2006
Cool season lawn turf in New York
Silt loam 7 – 11 28 0.51 yr-1 0.98 – 1.36 < control
Wooded land Silt loam 7 – 11 N/A 0 0.42 yr-1 0.15 – 0.48 N/A 4.0 Cool season golf turf in Ontario
Dominantly podzolic or brunisolic
N/A Natural watershed-scale Precip. not reported
Primarily MAP and organic
5 – 10 0.02 – 0.08 yr-1 mean 0.03
0.07 – 0.23 mean 0.13
5.0 – 7.2 mean 2.4
Winter and Dillon, 2006
Poa pratensis L.
Batavia silt loam (Mollic Hapludalfs)
6 Natural plot-scale 780 mm yr-1, over 6 years
Various, all treatments were NS
0 – 29 0.26 – 0.72 yr-1
NR NR Kussow, 2007
† N/A; not applicable ‡ NR, not reported ¶ ND, not detected § MAP, monoammonium phosphate # HAT, hours after treatment
14

Phosphorus runoff losses from natural events at the plot-scale are expectedly
lower than those of the worst-case scenario group. In these types of studies, annual P
loads range from 0.26 – 1.1 kg ha-1 yr-1(Table 1.2). In some cases, phosphorus runoff
losses from unfertilized (no N or P) turfgrass areas have been found to be greater than P
losses from fertilized turfgrass (Table 1.2). The two watershed-scale studies reported
annual P losses from golf courses of 0.02 – 0.33 kg ha-1. These numbers support the
findings of the natural, plot-scale research were annual P runoff losses were shown to
be generally < 1 kg ha-1 (Table 1.2).
The studies conducted under these conditions found that annual P runoff loads
rarely exceed 1 kg ha-1. However, under a worst-case scenario where a major runoff
event immediately follows a P fertilizer application, up to 20% (more likely 10%) of the
applied P can be expected to be lost (Table 1.2). This body of work suggests that P
runoff losses from turfgrass can be minimized by avoiding making fertilizer
applications before expected rainstorms; however, P load is the product of P
concentration in runoff and runoff volume. P loads can be reduced by lowering either P
concentration and/or runoff volume.
Researchers have studied the mechanisms of runoff volume reduction in
turfgrass systems. Gross et al. (1990) seeded tall fescue (Festuca arundinacea Schreb.)
at different rates into a sandy loam soil to achieve a range in turfgrass shoot density.
They then simulated rainfall to force runoff on the plots. No differences in runoff
volume were detected for shoot densities ranging from 867 – 5692 tillers m-2, a range on
the low end of commonly observed turfgrass densities. In contrast, Easton et al. (2005)
found that infiltration increased from 7 to 21 cm hr-1 as turfgrass shoot density increased
from 600 to 1200 shoots dm-1. In their study, fertilized plots had greater shoot densities
and thus exhibited lower runoff volumes and P losses than unfertilized control plots. In
addition to density differences due to fertilization or seeding rates, turfgrass species
15
have inherent differences in shoot density. Linde et al. (1995) observed that creeping
bentgrass reduced runoff losses when compared with perennial ryegrass when both
grasses were mown at fairway height. The authors attributed the reduction in runoff
volume from creeping bentgrass with its greater shoot density which allowed for
increased water infiltration. However, a follow-up study found no differences in runoff
volume for when soil moisture differences between the two species was controlled
(Linde and Watchke, 1997). This suggests that differences in water use among turfgrass
species may be more important than differences in density. Indeed, other researchers
have found soil moisture content to be highly correlated with runoff volume from
turfgrass areas (Shuman 2002, Easton and Petrovic 2004). However, to our knowledge
no studies have been conducted to date that quantify the potential differences in runoff
losses from irrigated and non-irrigated turfs (assuming equal precipitation). One might
anticipate greater runoff from irrigated sites where higher soil moisture is maintained.
In addition to the effects of density and soil moisture on runoff volumes,
researchers have determined that increasing mowing height of grasses can decrease
runoff losses from turfgrass areas (Cole et al., 1997; Moss et al., 2006), despite the fact
that increased mowing height is normally associated with decreased turfgrass shoot
density. This suggests that mowing height has a greater influence on runoff volumes
than shoot density, whether this is due to a reduction in soil moisture (due to greater
ET) or an increase in resistance to flow has not been documented. The assumption that
increased mowing height leads to lower runoff volumes is incorporated into NRCS
Curve Number runoff estimation model for turfgrass (Haith, 2001).
Although it has been observed that turfgrass properties influence runoff
volumes, a recent study demonstrated that runoff in a suburban watershed was as
dependent on soil properties as ground cover (Easton, 2006). Runoff was collected from
plots from 1) high maintenance, fertilized turfgrass, 2) low maintenance, unfertilized
16

turfgrass, and 3) wooded areas. The plots were replicated throughout various areas of a
small suburban watershed. High maintenance turfgrass reduced runoff volume by a
factor of 2 compared to the low-maintenance and wooded areas. However, the variation
in soil properties throughout the watershed had the largest effect on runoff volume.
Runoff volumes differences were up to an order of magnitude greater in areas with
shallow, finer-textured soils than in areas with deeper, sandier soils. These differences
were observed regardless of ground cover. Hamilton and Waddington (1999) found no
significant correlations between infiltration rate and tiller density, soil bulk density, or
soil texture. They hypothesized that excavation procedures and establishment
techniques influenced infiltration/runoff to a much greater extent than the turfgrass
properties. Similarly, Kelling and Peterson (1975) found that lawns growing on soils
heavily disturbed during home construction had infiltration rates of approximately a
third of that of non-disturbed sites. The authors also concluded that P loss was
determined more by the infiltration properties of the soil rather than the amount of
fertilizer applied. Kussow (2007) also concluded that runoff volumes play the largest
role in determining P runoff losses. Recognizing and understanding the properties that
influence runoff will be important for developing BMPs to minimize P loss from a
suburban landscape.
Similar to the landscape-scale runoff processes, temporal runoff losses from
turfgrass areas are poorly understood. Kussow (2007) observed that runoff from
snowmelt on Kentucky bluegrass lawn plots in the upper-Midwest accounted for 87%
of total annual runoff over a 6-year period. During the growing season, he found
increased runoff from turfgrass areas where the subsoil was compacted, but because the
majority of the runoff occurred in the winter when soils were frozen, the differences in
runoff volume between compacted and uncompacted lawns were not significant. This
suggests that BMPs related to snow melt management should be implemented before
17

BMPs related to construction practices in cold climates similar to Wisconsin.
Understanding spatial and temporal runoff losses is critical for developing effective
BMPs.
Leaching Losses of Phosphorus in Turfgrass Systems
Because most soils and subsoils have a high P sorption capacity relative to the
amount of P applied, leaching has been considered a minor pathway for P loss (Sims et
al., 1998). However, under the following circumstances P leaching can become a major
pathway for P loss: fertilized soils with low P sorption capacity (Breeuwsma and Silva,
1992), soils with high organic matter (Duxbury and Pervely, 1978), soils with a large
network of macropores (Geohring et al., 2001), and soils with elevated P levels in the
upper profile due to long-term or large additions of P (Heckrath et al., 1995). Each of
these situations is not uncommon, if not typical, to some turfgrass areas.
Sand is a common construction material for golf course putting greens and
athletic field root zones. In addition to having high infiltrability, sand-based root zones
typically have very low P sorption capacities, receive soluble fertilizers, frequent
irrigation, and have subsurface drainage. To date, the largest amount of research on P
leaching from turfgrass systems has been conducted on sand-based root zones (Table
1.3). Results show that annual P leaching losses from fertilized sandy soils ranged from
0.03 – 18.5 kg ha-1 with P concentrations observed over 13 mg L-1. Although P losses
from irrigated sand-based root zones should not be ignored; they account for
approximately only 0.35% of all turfgrass areas. Sand-based root zones are confined to
high maintenance athletic fields and usually less than 5% of the area of a golf course
(Beard, 2001). Golf courses account for less than 7% of the turfgrass area in the U.S as
estimated by Milesi et al. (2005). These calculations assume 16,000 golf courses in the
US average size of 70 ha).
18
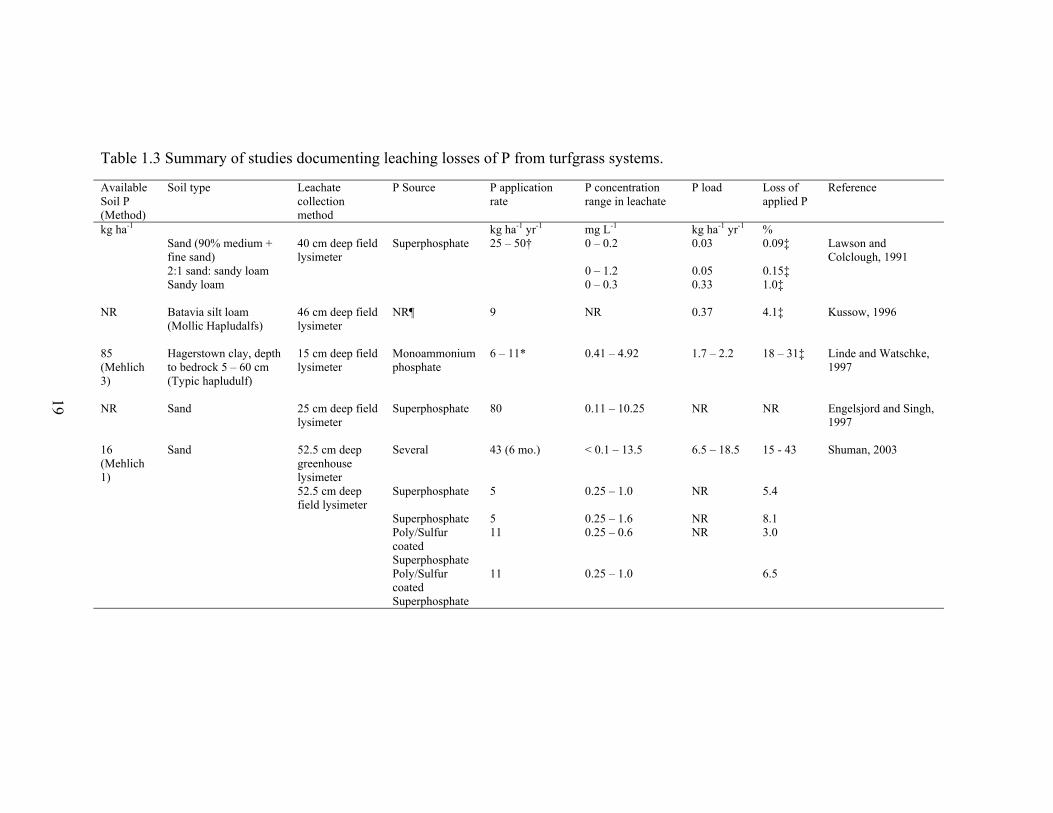
Table 1.3 Summary of studies documenting leaching losses of P from turfgrass systems.
Available Soil P (Method)
Soil type Leachate collection method
P Source P application rate
P concentration range in leachate
P load Loss of applied P
Reference
kg ha-1 kg ha-1 yr-1 mg L-1 kg ha-1 yr-1 % Sand (90% medium +
fine sand) 40 cm deep field lysimeter
Superphosphate 25 – 50† 0 – 0.2 0.03 0.09‡ Lawson and Colclough, 1991
2:1 sand: sandy loam 0 – 1.2 0.05 0.15‡ Sandy loam 0 – 0.3 0.33 1.0‡ NR Batavia silt loam
(Mollic Hapludalfs) 46 cm deep field lysimeter
NR¶ 9 NR 0.37 4.1‡ Kussow, 1996
85 (Mehlich 3)
Hagerstown clay, depth to bedrock 5 – 60 cm (Typic hapludulf)
15 cm deep field lysimeter
Monoammonium phosphate
6 – 11* 0.41 – 4.92 1.7 – 2.2 18 – 31‡ Linde and Watschke, 1997
NR Sand 25 cm deep field
lysimeter Superphosphate 80 0.11 – 10.25 NR NR Engelsjord and Singh,
1997 16 (Mehlich 1)
Sand 52.5 cm deep greenhouse lysimeter
Several 43 (6 mo.) < 0.1 – 13.5 6.5 – 18.5 15 - 43 Shuman, 2003
52.5 cm deep field lysimeter
Superphosphate 5 0.25 – 1.0 NR 5.4
Superphosphate 5 0.25 – 1.6 NR 8.1 Poly/Sulfur
coated Superphosphate
11 0.25 – 0.6 NR 3.0
Poly/Sulfur coated Superphosphate
11 0.25 – 1.0 6.5
19
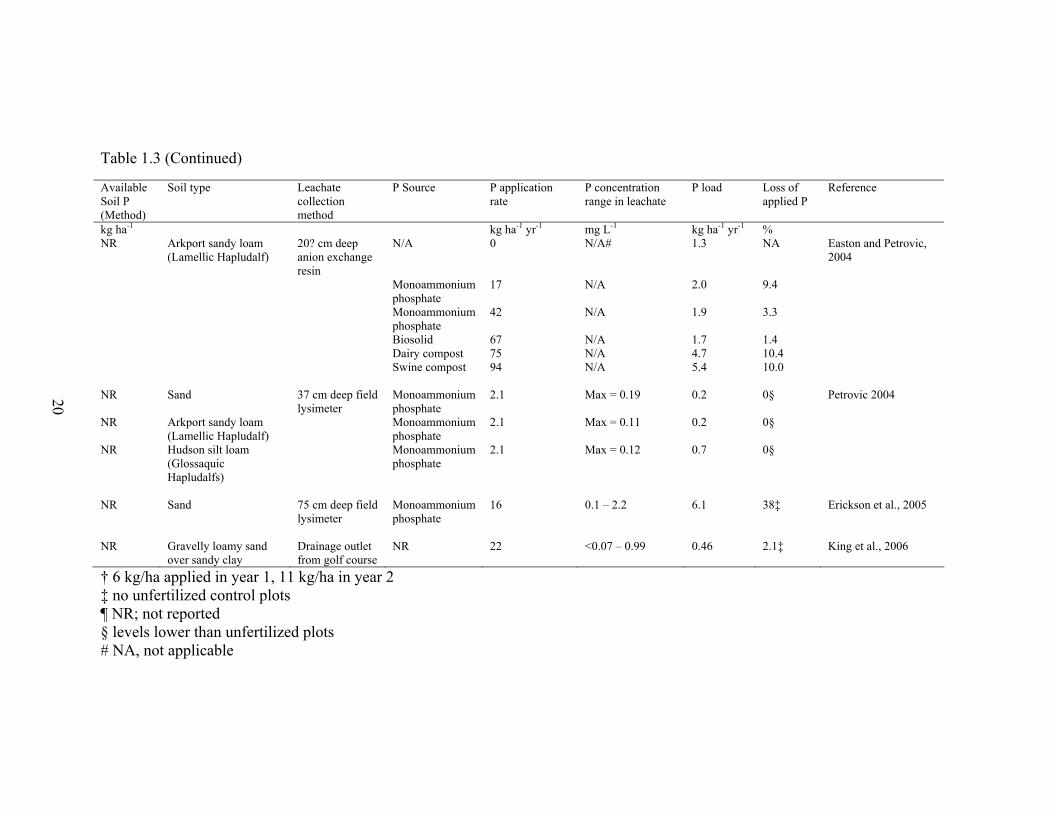
Table 1.3 (Continued)
† 6 kg/ha applied in year 1, 11 kg/ha in year 2 ‡ no unfertilized control plots ¶ NR; not reported § levels lower than unfertilized plots # NA, not applicable
Available Soil P (Method)
Soil type Leachate collection method
P Source P application rate
P concentration range in leachate
P load Loss of applied P
Reference
kg ha-1 kg ha-1 yr-1 mg L-1 kg ha-1 yr-1 % NR Arkport sandy loam
(Lamellic Hapludalf) 20? cm deep anion exchange resin
N/A 0 N/A# 1.3 NA Easton and Petrovic, 2004
Monoammonium phosphate
17 N/A 2.0 9.4
Monoammonium phosphate
42 N/A 1.9 3.3
Biosolid 67 N/A 1.7 1.4 Dairy compost 75 N/A 4.7 10.4 Swine compost 94 N/A 5.4 10.0 NR Sand 37 cm deep field
lysimeter Monoammonium phosphate
2.1 Max = 0.19 0.2 0§ Petrovic 2004
NR Arkport sandy loam (Lamellic Hapludalf)
Monoammonium phosphate
2.1 Max = 0.11 0.2 0§
NR Hudson silt loam (Glossaquic Hapludalfs)
Monoammonium phosphate
2.1 Max = 0.12 0.7 0§
NR Sand 75 cm deep field
lysimeter Monoammonium phosphate
16 0.1 – 2.2 6.1 38‡ Erickson et al., 2005
NR Gravelly loamy sand
over sandy clay Drainage outlet from golf course
NR 22 <0.07 – 0.99 0.46 2.1‡ King et al., 2006
20

Studies examining P leaching in finer-textured soils have found P losses
ranging from 0.2 – 5.4 kg ha-1 (Table 1.3). Easton and Petrovic (2004) observed annual
P leaching losses of 1.3 kg ha-1 for unfertilized turfgrass grown on a sandy loam. In
their study, where P leaching loads were estimated from anion exchange resins buried in
the soil, P loss increased with P fertilization rate. Linde and Watschke (1997) observed
leaching losses of 1.7 – 2.2 kg ha-1 after 28 simulated rain events over 2 years, and six
of the events were preceded by fertilizer applications. Aside from those two studies, P
leaching losses from finer textured soils ranged from 0.2 – 0.7 kg ha-1 (Table 1.3). The
single watershed-scale study reviewed found annual P leaching losses to be 0.46 kg ha-
1. For many of the studies soil P level is not reported and has not been examined as a
factor that may influence P leaching (Table 1.3). Petrovic (2004) found P leaching to be
over 3 times greater from a silt loam than a sand loam or a sand soil; however, the
amount of P leached from fertilized plots was lower than the P leached from the control
plots for all 3 soils. This research demonstrates the need for work on how sources other
than fertilizer (i.e. soil P) affect P leaching from turfgrass areas.
Models have predicted increasing soil organic matter content under well-
maintained turfgrass systems (Milesi et al., 2005; Pouyat et al., 2006); and, researchers
have documented increases in soil organic matter in turfgrass systems over time (Porter
et al., 1980; Qian and Follett, 2002). High soil organic matter content can also be
expected where organic matter (such as compost) is intentionally added to improve soil
physical properties. The use of composted manure to improve urban soils appears to be
on the rise as animal feeding operations look for innovative ways to export large
quantities of manure to meet government-specified water quality goals (Vietor et al.,
2002; Cogger 2005). To date, no work has been conducted on how organic matter
affects P leaching in turfgrass systems, yet many questions remain. For example, what
percentage of soil P is associated with organic matter in turfgrass systems? What is the
21

effect of cultural practices (fertilization, clipping management, irrigation) on that
percentage? And, what is the effect of mineralization of organic matter on P
mobilization in turfgrass systems?
Soils that are infrequently disturbed, like turfgrass soils, are more likely to have
continuous macropores than frequently disturbed soils. Macropores are formed by
macrofauna (e.g. earthworms), plant roots, and soil physical processes such as
shrink/swell, wet/dry, and freeze/thaw cycles (Beven and Germann, 1982). These pores
enhance preferential flow and increase loss of chemicals normally considered to be
relatively immobile in soils by bypassing the majority of pores in the soil matrix
(Camobreco et al., 1996). In addition, preferential flow can occur at soil moisture levels
much below saturation (Andreini and Steenhuis, 1990). Agricultural field research has
observed greater than expected P loss in drainage due to preferential flow pathways
(Heckrath et al., 1995, Beauchemin et al., 1998). Large discrepancies in chemical
transport have been documented between disturbed and undisturbed soil columns from
a turfgrass system (Starrett et al., 1996). Despite the evidence which points to P
leaching being a potentially major pathway in turfgrass systems, relatively little work
has been done in the area. Upon review of Tables 1.2 and 1.3, it is evident that P
leaching losses are of the same scale as P runoff losses. Furthermore, if runoff volumes
from a turfgrass site are low; it follows that P leaching losses might be important to
examine in more detail.
Soil Storage
When inputs exceed outputs, soil storage of P will increase. Applied P reacts
with soil moisture, irrigation, or precipitation to enter the soil solution. Phosphorus in
soil solution is in equilibrium with three distinct pools: 1) P sorbed onto clays and Fe
and Al oxides and hydroxides; 2) secondary P-containing minerals such as Ca, Fe, and
22

Al phosphates, and 3) organic P which includes microorganisms and soil organic matter
(Pierzynski et al., 2005). Plants take up P exclusively from the soil solution; however,
this constitutes a very small fraction of total soil P (Brady and Weil, 2002). When plants
take up soil P from solution, P is replaced from the various pools mentioned above
through either desorption, dissolution, or mineralization (Fig. 1.1). Phosphorus becomes
the growth limiting nutrient when these processes cannot keep up with plant demand. At
this point, fertilizers can be applied to correct this deficiency temporarily.
SOURCES OF P IN RUNOFF AND DRAINAGE FROM TURF
To effectively reduce soluble P concentrations from turfgrass, knowledge of
sources and relative contributions to P in runoff from those sources is required. The
three major sources of P in runoff from turfgrass include fertilizer, soil, and tissue.
Fertilizer
Application Timing
Application timing plays an important role in the fate of P fertilizer. A portion of
the applied P is soluble in water and will be available to runoff. However, as the P
dissolves, it is sorbed by the soil, rendering it much less available to runoff and leaching
loss. Therefore the window between application and dissolution/sorption is critical.
Kelling and Peterson (1975) observed that 10.6% of an applied commercial lawn
fertilizer was lost when followed immediately by an intense simulated rain event (90
minute, 120 mm hr-1). However, by applying a light amount of water without causing
runoff, commonly called watering-in, prior to the simulated storm average fertilizer loss
23
was reduced by an order of magnitude. Very similar results were obtained by Shuman
(2004), who found that watering-in reduced P loss compared to not watering-in the
fertilizer. This phenomenon has been observed in studies collecting natural runoff. For
example Gaudreau et al. (2002) found greater runoff P losses from turfgrass treated with
composted manure or inorganic P fertilizer compared to control plots when runoff
occurred within 3 days of application. However, for the remainder of the runoff events
(occurring 27 – 87 days after treatment), differences in P loss between the treatments
were smaller. Easton and Petrovic (2004) found nutrient concentrations in runoff were
always highest during the first runoff event following fertilization.
Application Rate
Easton and Petrovic (2004) applied 5 different P fertilizers at the same annual
rate on a sandy loam soil, but divided the annual application into 2 or 4 separate
applications. The treatments that received the twice yearly application resulted in an
average increase in P loss in runoff of 4.8%, and a 59% increase in P loss in leachate
compared to the treatments applied 4 times per year, suggesting that individual fertilizer
application rate influences drainage losses to a much greater extent than runoff losses.
Other studies have found P loss in drainage to be directly related to P application rate
(Shuman 2001, 2003). In contrast to Easton and Petrovic (2004) other studies have
shown a direct relationship between runoff P losses and P application rate. When a rain
simulator was used to force runoff 4, 24, 72, and 168 hours after fertilizer application,
Shuman (2002) found P concentrations in runoff to vary directly with fertilizer rate. In
Texas, Gaudreau et al. (2002) also found runoff P loss to vary directly with application
rate for an inorganic and organic source of P during a 2-year study during which 4
runoff events occurred. The differences in these studies may be related to the
24

differences in rainfall patterns. Easton and Petrovic (2004) observed 33 runoff events
over 18 months, several attributed to snowmelt, whereas the other two studies dealt with
a few very intense storms.
Fertilizer Source
In addition to application timing and application rate, the source of P in fertilizer
has been shown to influence P loss in runoff and drainage. Schuman (2001; 2003) found
that a soluble inorganic source of P (monoammonium phosphate, MAP) was more
prone to leaching losses through a sand-based root zone than a controlled release
fertilizer. However, it is unknown if differences between soluble and controlled release
products would be detected on a native soil, or if differences in runoff losses of P would
be evident between soluble and controlled release products.
Probably more important are the differences between inorganic and organic
sources of P. With few exceptions, lawns are fertilized with a complete fertilizer where
N, P, and K are applied together. Because N is the most limiting nutrient for turfgrass
growth and quality, universities (and lawn fertilizer manufactures) will recommend the
fertilizer be applied to achieve an application rate of 0 – 73 kg N ha mo-1 for warm
season grasses and 0 – 39 kg N ha mo-1 for cool season grasses during the growing
season depending on grass species and expected use (Carrow et al., 2001). Therefore, P
applied to home lawns is dependent on the fertilizer’s N: P ratio. In Easton and
Petrovic’s (2004) study, 5 fertilizer sources were applied at an annual rate of 200 kg N
ha-1 which resulted in a range of P2O5 from 17 to 94 kg ha-1. Direct effects of P sources
could not be compared given the different rates of application; however, Gaudreau et al.
(2002) found greater runoff losses from inorganic sources than sod fertilized with dairy
manure at a rate of 100 kg ha-1. In reality homeowners apply fertilizer to meet N
25

requirement and therefore rate and source are difficult to separate. When organic
sources of fertilizer are used, although less soluble, they will likely be applied at higher
rates than conventional lawn fertilizers (often with N: P2O5 > 10) – which can result in
greater total P losses (Easton and Petrovic, 2004). When a fertilizer with a small N: P
ratio is applied, over time soil P levels will elevate, that may become an important
source of P in runoff and drainage water. Organic sources are also known to vary in
availability of P to runoff or leaching losses, meaning organic sources with similar P
content can have different effects on P concentration in runoff and drainage (Ebeling et
al., 2003).
Soil
In agriculture, it has been acknowledged that soil P levels influence P
concentrations in runoff (Sharpley, 1995) and drainage (Heckrath et. al, 1995). Soil P
has been shown to be linearly related to P concentrations in runoff from agriculture or
to exhibit a “change point” in the soil test level above which P concentrations in runoff
and drainage increase at a greater rate than below it. This phenomenon occurs due to
sorption properties of the soil, which are influenced by texture, mineralogy, and
management practices. High soil P in agriculture is usually associated with confined
animal feeding operations (CAFOs) where long term application of animal manure
(with its small N: P ratio) has exceeded crop removal resulting in elevated soil P levels.
Despite the known importance of soil P level on runoff and drainage losses, the
effect of soil P level on P losses in turfgrass systems is largely unknown. The only study
that has attempted to examine the effect of soil P level on P runoff found a poor
correlation (r2 = 0.15) between the two variables across a range of 7 – 73 kg ha-1 Bray-1
P (Barten and Janke, 1997). However, the study was not designed specifically to
26

investigate that relationship and it is premature to draw any conclusions from it. Soldat
(2007) found soil test level was an adequate predictor of P in runoff from turfgrass
across a wide range of soil P levels. However, across the range of soil test levels
common to home lawns in NY, soil test level was not a good indicator of P
concentration in runoff. In agriculture, management plays a very large role in
determining how soil P affects P loss. Turfgrass management practices differ greatly
from those used in agriculture and it will be necessary to understand these relationships
to more effectively reduce P losses from turfgrass areas.
To fully appreciate the relative potential contribution from turfgrass soils in our
urban watersheds, more information is needed on actual soil P levels for turfgrass areas
in the US. Very limited data currently exists, most analyzed from the relatively small
amount of unsolicited (non-random) soil samples sent into testing labs for analysis.
These surveys tend to report that well over half of the lawns have soil P levels above
that which research has shown to be required for optimum growth. A recent report
found that home lawns in the Madison, WI area inherit soil P levels above turfgrass
requirements due to the land being used previously for agriculture. However, current
fertilization practices were demonstrated to result in a decrease in soil P levels over
time (Kreuser and Kussow, 2006). This is consistent with the findings of Bennett et al.
(2004), who found soil P levels of home lawns in the Madison area to be lower than
those of the surrounding cash grain and dairy farms from which the lawn soils were
likely derived.
Tissue
Although direct measurements of the contribution plant tissue to P runoff from
turfgrass areas has yet to be done, plant tissue has been shown to contribute
27
significantly to P in runoff from other crops such as cotton (Sharpley, 1981). A
relatively large amount of P can be concentrated above-ground in turfgrass areas. At
any one time, a typical amount of above-ground turfgrass biomass might be 10,000 kg
ha-1 (Lush, 1990). Turfgrass tissue usually contains 0.30– 0.55% P by weight (Jones,
1980), meaning 30 – 55 kg ha-1 of P exists above-ground, up to 5 – 10% of which may
be water soluble (Tukey, 1970; Sharpley, 1981) and therefore potentially available to
runoff. These figures represent the constant above-ground biomass and do not take into
account clipping production, which can amount to a significant increase in tissue P
available to runoff or leaching. This suggests returning turfgrass clippings to the lawn
could increase P loss in runoff.
Supporting the calculations of water soluble P in turfgrass tissue discussed
above, Kussow (2004) observed that freshly mown P. pratensis L. shoots contain 0.6 kg
ha-1 of water soluble P; an amount that could account for a very substantial portion of
observed runoff losses summarized in Table 1.2. Water soluble P increased when the
turfgrass tissue was dried and frozen. The author concluded that turfgrass tissue likely
accounts for a large amount of P in runoff from turfgrass areas – this is especially true
in areas where snowmelt accounts for a significant proportion of the annual runoff.
REDUCING P LOSS FROM TURFGRASS ECOSYSTEMS
Phosphorus load is the mass of P leaving an outlet and is the product of the
volume of water and the concentration of P in the water. Therefore, the potential for P
loss in turfgrass ecosystems is dependent on two main factors, 1) source factors, (such
as tissue P, soil P levels, and P fertilizer source, timing, and application rate) that
influence the concentration of P in water, and 2) transport factors (such as surface
28
runoff, erosion, subsurface flow, and leaching) that influence the amount of water
leaving a site as runoff or drainage. Therefore, both source and transport factors must be
considered to determine the potential for P loss from a turfgrass ecosystem; and both
should be evaluated when developing BMPs to determine the most effective and
efficient way to reduce P load from a turfgrass area. The highest priority areas, where
high potential for transport intersects with sources areas with a high potential for P loss
to water, need the most intensive management to minimize the environmental impact.
Managing Transport Factors
Reducing transport factors in turfgrass systems is different from transport
reducing factors in agriculture. Lentz et al. (1998) illustrates this point: “Phosphorus
loss via surface runoff and erosion may be reduced by conservation tillage and crop
residue management, buffer strips, riparian zones, terracing, contour tillage, cover crops
and impoundments (e.g., settling basins). Basically, these practices reduce rainfall
impact on the soil surface, reduce surface runoff volume and velocity, and increase soil
resistance to erosion.” However, as previously discussed, a properly maintained stand of
turfgrass will achieve these transport-reducing goals.
Runoff in urban and suburban systems is characterized by an increased volume
of runoff and a greater peak flow with a reduced lag time. The degree to which these
parameters are altered depends on the imperious surface area and rate at which runoff is
conveyed to surface water (McGriff, 1972). Turfgrass areas make up the majority of
pervious land in suburban systems, and therefore play an important role in the
hydrology and water quality of these areas. Runoff from an urban system is dependent
on the percentage of impervious area and the properties of the turfgrass areas. Transport
depends on soil properties and site history. It has been shown that construction practices
29

and compaction both play important roles in transport processes in turfgrass systems
(Kelling and Peterson, 1975; Gregory et al., 2006). It is likely that the greatest gains in
transport reduction from turfgrass areas and urban systems it through minimizing and/or
ameliorating the negative impacts of home construction on soil infiltrability.
Connectivity is another transport issue that is important in urban and suburban
areas. Connectivity describes the degree to which runoff water is connected with the
receiving body. In many urban systems, storm water is collected and transported
directly to a surface water outlet. Routing runoff from roofs and driveways to the turf
area instead of to the storm water system will reduce connectivity and runoff.
Another relatively simple way to manage transport is through soil moisture
management. The potential for runoff increase as soil moisture increases, therefore a
BMP would be to irrigate turfgrass areas on an as needed basis only. However, further
research is needed to quantify the effect of irrigation practices on runoff and leaching
losses of P.
Managing Source Factors
When transport potential is high, management of P sources becomes
increasingly more important in reducing P runoff or leaching losses. Phosphorus
fertilizer should never be applied unless a need is indicated by a tissue or soil test.
Research has found that P loss from fertilizer can be minimized by applying at low rates
and applying a light amount of irrigation following the application. That being said, it is
unlikely that proper fertilization of turfgrass will reduce P loss to environmentally
acceptable levels as sources such as soil P and tissue P may contribute greater amounts
to drainage and runoff losses, respectively. If soil P levels are high, removing and
composting clippings will result in a gradual reduction of soil P levels. However, care is
needed to ensure compost piles do not become point sources of P pollution.
30
More immediate remediation can be conducted through surface-applied soil
amendments. Torbert et al. (2005) found that the application of ferrous sulfate at a rate
of 400 kg ha -1 has the potential to greatly reduce runoff P losses from turfgrass areas.
KNOWLEDGE GAPS AND FUTURE RESEARCH NEEDS
The effect of turfgrass on water quality is an important issue that is
understudied. Several research opportunities exist which will increase our
understanding of P loss and provide effective strategies for reducing P loss from urban
and suburban areas. Perhaps the first priority is to collect accurate information on the
turfgrass management practices (fertilization rates, timing, sources, clipping
management, irrigation) of homeowners and how they relate soil properties and soil P
levels of urban areas. This information will be useful for identifying where immediate
gains can be made through educational outreach programs.
Future research should focus on the spatial and temporal variability of runoff
from turfgrass areas and urban ecosystems in general. The results from these studies
will be more effective for developing targeted BMPs for reducing P loss than plot-scale
studies which are confined to a specific location in a watershed. The importance of
understanding spatial and temporal runoff processes from turfgrass have been
emphasized (Easton, 2006; Kussow 2007), yet more work is needed to be able to
accurately predict P losses in turfgrass areas. Because turfgrass areas account for the
majority of pervious area in urban ecosystems, the infiltration characteristics of the
turfgrass areas affect the hydrology of the urban watershed. Previous research has
highlighted the major impacts that home construction can have on infiltrability of
turfgrass areas. Future research should focus on practices that will allow modern home
construction practices to continue without significantly reducing soil infiltrability. As
31
suburban areas continue to expand in the US, opportunities for implementing
watershed-scale research should be relatively easy to identify in many areas throughout
the US.
Future research efforts should also focus on the relative contribution of P from
fertilizer, soil, and tissue to runoff and drainage losses from turfgrass under a range of
soil types and management regimes. The effect of soil P level on P in runoff and
leaching has particularly been ignored and should be examined in more detail. In
addition to information generated by these studies will be needed to develop BMPs for
achieving reductions in P loss from turfgrass areas.
CONCLUSIONS
Annual fertilizer inputs were estimated to b 3 – 10 kg ha-1 based on a review of
the analysis of typical commercial lawn fertilizers and common homeowner fertilization
practices. These fertilizer inputs are approximately balanced by outputs from clipping
removal (3 – 9 kg ha-1 yr-1), estimated from a homeowner survey in NC. Because of the
large and expanding amount of turfgrass in the US, more information should be
collected regarding homeowner lawn maintenance practices to help assess the water
quality risk associated with lawn maintenance. Unbiased (random) information
regarding soil P levels of lawns is particularly lacking.
Runoff and leaching losses of P have been shown to be very high when runoff or
drainage occurs shortly after a P fertilizer application, with up to 20% of the applied
fertilizer being subject to loss. Research has identified several effective strategies for
minimizing losses associated with P losses following fertilization. These include: 1)
applying P fertilizer only when need is indicated by soil or tissue test, 2) lightly
“watering-in” P fertilizer to speed dissolution into soil, 3) withholding P application
32
before large expected rain events, and 4) maintaining an unfertilized buffer strip
between the fertilized turfgrass and a sensitive area such as an impervious surface or
water body.
A review of the literature found that sediment loss from established turfgrass
areas is very low, even in relatively low density turfgrass areas. Studies collecting
runoff from natural rainfall or snowmelt events have found that P losses from fertilized
and unfertilized turfgrass areas are generally < 1 kg ha-1 yr-1. These losses not dissimilar
to inputs of atmospheric deposition, shown to be between 0.15 and 0.77 kg P ha-1 yr-1.
Leaching losses of P can be substantial in fertilized soils with a low P sorption
capacity, like sand. However, the few studies that measured P losses from finer-textured
soils (greater P sorption capacities) have been shown to be similar in magnitude to
runoff losses – typically < 1 kg ha-1 yr-1. This suggests that more work is required to
understand the potential impact of P leaching on water quality from turfgrass areas,
particularly the effect of soil P on P loss. In addition, future research should also focus
on the spatial and temporal variability of P losses from turfgrass areas.
33
REFERENCES Abu-Zreig, M., R.P. Rudra, H.R. Whiteley, M.N. Lalonde, and N.K. Kaushik. 2003.
Phosphorus removal in vegetated filter strips. J. Environ. Qual. 32:613-619. Andreini, M.S. and T.S. Steenhuis. 1990. Preferential paths of flow under conventional
and conservation tillage. Geoderma. 46:85-102. Barber, S.A. 1995. Soil nutrient bioavailability: A mechanistic approach. John
Wiley & Sons. Barten, J.M., and E. Jahnke. 1997. Suburban lawn runoff water quality in the Twin
Cities Metropolitan Area, 1996 and 1997. Suburban Hennepin Regional Park District, Water Quality Management Division, Maple Plain, MN. 17p.
Beard, J.B. 2001. Turfgrass management for golf courses. John Wiley & Sons. Beard, J.B., and R.L. Green. 1994. The role of turfgrasses in environmental protection
and their benefits to humans. J. Environ. Qual. 23:452-460. Beauchemin, S., R.R. Simard, and D. Cluis. 1998. Forms and concentration of
phosphorus in drainage water of twenty-seven tile-drained soils. J. Environ. Qual. 27:721–728.
Bennett, H.H. 1935. Relation of grass cover to erosion control. J. Am. Soc. Agron.
27:173-179. Bennett, E.M., S.R. Carpenter, and M.K. Clayton. 2004. Soil phosphorus variability:
scale-dependence in an urbanizing agricultural landscape. Landscape Ecology. 20:389-400.
Beven, K., and P. Germann. 1982. Macropores and water flow in soils. Water
Resources Research. 18:1311-1325. Bonnaffon, H. Scott’s proposal for phosphorus reduction in fertilizers. 2006. [Online].
Available at: www.mwcog.org/uploads/committee-documents/v1ldwf420060605122353.ppt.
Brady, N.C., and R.R. Weil. 2002. The nature and properties of soils. 13th ed. Prentice
Hall, Upper Saddle River, NJ. Breeuwsma, A., and S. Silva. 1992. Phosphorus fertilization and environmental effects
in The Netherlands and the Po region (Italy). Rep. 57. Winand Staring Centre, Wageningen, The Netherlands.
34

Carroll, M.J., T.Q. Ngo, and J.M. Krouse. Tall fescue seedling growth in response to phosphorus fertilization. Int. Turfgrass Soc. Res. J. 10:310 - 317.
Carrow, R.N., L. Stowell, W. Gelernter, S. Davis, R.R. Duncan, and J. Skorulski. 2004.
Clarifying soil testing: III. SLAN sufficiency ranges and recommendations. Golf Course Management. 72:194-198.
Carrow, R.N., D.V. Waddington, and P.E. Rieke. 2001. Turfgrass soil fertility and
chemical problems: Assessment and management. Ann Arbor Press. Chelsea, MI.
Camobreco, V.J., B.K. Richards, T.S. Steenhuis, J.H. Peverly, and M.B. McBride.
1996. Movement of heavy metals through undisturbed and homogenized soil columns. Soil Sci. 161:740-750.
Carpenter, S.R., N.F. Caraco, D.L. Correll, R.W. Howarth, A.N. Sharpley, and V.H.
Smith. 1998. Nonpoint pollution of surface waters with phosphorus and nitrogen. Ecological Applications. 8:559-568.
Cogger, C.G. 2005. Potential compost benefits for restoration of soils disturbed by
urban development. Compost Sci. and Utilization. 13:243-251. Cole, J.T., J.H. Baird, N.T. Basta, R.L. Huhnke, D.E. Storm, G.V. Johnson, M.E.
Payton, M.D. Smolen, D.L. Martin, and J.C. Cole. 1997. Influence of buffers on pesticide and nutrient runoff from bermudagrass turf. J. Environ. Qual. 26:1589-1598.
Correll, D.L. 1998. The role of phosphorus in the eutrophication of receiving waters: A
review. J. Environ. Qual. 27:261-266. Duxbury, J.M. and J.H. Perverly. 1978. Nitrogen and phosphorus losses from organic
soils. J. Environ. Qual. 7:566-570. Easton, Z.M. 2006. Landscape impact on suburban runoff: Determining nutrient loading
rates based on land use. Ph.D. Dissertation: Cornell University. Easton, Z.M., and A.M. Petrovic. 2004. Fertilizer source effect on ground and surface
water quality in drainage from turgrass. J. Environ. Qual. 33:645-655. Easton, Z.M., A.M. Petrovic, D.J. Lisk, and I. Larsson-Kovach. 2005. Hillslope position
effect on nutrient and pesticide runoff from turfgrass. Int. Turfgrass Soc. Res. J. 10:121-129.
35
Ebeling, A.M., L.R. Cooperband, and L.G. Bundy. 2003. Phosphorus source effects on soil test phosphorus and forms of phosphorus in soil. Commun. Soil Sci. Plant Anal. 34:1897-1917.
Engelsjord, M.E., and B.R. Singh. 1997. Effects of slow-release fertilizers on growth
and uptake and leaching of nutrients in Kentucky bluegrass turfs established on sand-based root zones. Can. J. Plant Sci. 77:433-444.
Erickson, J.E., J.L. Cisar, G.H. Snyder, and J.C. Volin. 2005. Phosphorus and potassium
leaching under contrasting residential landscape models established on a sandy soil. Crop Sci. 45:546-552.
Fiener, P., and K. Auerswald. 2003. Effectiveness of grassed waterways in reducing
runoff and sediment delivery in agricultural watersheds. J. Environ. Qual. 32:927-936.
Gaudreau, J.E., D.M. Vietor, R.H. White, T.L. Provin, and C.L. Munster. 2002.
Response of turf and quality of water runoff to manure and fertilizer. J. Environ. Qual. 31:1316-1322.
Geohring, L.D., O.V. McHugh, M.T. Walter, T.S. Steenhuis, M.S. Akhtar, and M.F.
Walter. 2001. Phosphorus transport into subsurface drains by macropores after manure applications: Implications for best manure management practices. Soil Sci. 166:896-909.
Gregory, J.H., M.D. Dukes, P.H. Jones, and G.L. Miller. 2006. Effect of urban soil
compaction on infiltration rate. J. Soil Water Conserv. 61:117-124. Gross, C.M., J.S. Angle, R.L. Hill, and M.S. Welterien. 1991. Runoff and sediment
losses from tall fescue under simulated rainfall. J. Environ. Qual. 20:604-607. Gross, C.M., J.S. Angle, and M.S. Welterien. 1990. Nutrient and sediment losses from
turfgrass. J. Environ. Qual. 19:663-668. Haith, D.A. 2001. TurfPQ, A pesticide runoff model for turf. J. Environ. Qual. 30:1033-
1039. Hamilton and Waddington. 1999. Infiltration rates on residential lawns in central
Pennsylvania. J. Soil Water Coserv. 54:564-568. Heckrath, G., P.C. Brookes, P.R. Poulton, and K.W.T. Goulding. 1995. Phosphorus
leaching from soils containing different phosphorus concentrations in the broadbalk experiment. J. Environ. Qual. 24:904-910.
Houlihan, S.M. 2005. Soil test selection and calibration for turfgrass in Wisconsin. M.S.
Thesis: University of Wisconsin – Madison.
36

Jaworski, N.A., P.M. Groffman, A.A. Keller, and J.C. Prager. 1992. A watershed
nitrogen and phosphorus balance: The Upper Potomac River Basin. Estuaries. 15:83-95.
Jones, J.B. 1980. Turf analysis. Golf Course Management. 48:29-32. Kelling and Peterson. 1975. Urban lawn infiltration rates and fertilizer runoff losses
under simulated rainfall. Soil Sci. Soc. Amer. Proc. 39:348-352 King, K.W., R.D. Harmel, H.A. Torbert, and J.C. Balogh. 2001. Impact of turfgrass
system on nutrient loadings to surface water. J. Am. Water Resour. Assoc. 37:629-640.
King, K.W., K.L. Hughes, J.C. Balogh, N.R. Fausey, and R.D. Harmel. 2006. Nitrate-
nitrogen and dissolved reactive phosphorus in subsurface drainage from managed turfgrass. J. Soil Water Conserv. 61:31-40.
Kreuser, W.C., and W.R. Kussow. 2006. Lawn P: Where’d it come from? The Grass
Roots. 35(4):15 – 17. Kussow, W.R. 1996. Runoff and leaching losses of nutrients from Kentucky bluegrass
turf. Wisconsin Turf Research: Results of 1996 Studies Volume XIV. Kussow, W.R. 2004. Phosphorus runoff lossess from lawns. Better Crops 88:12-13. Kussow, W.R. 2007. Nitrogen and soluble phosphorus losses from and upper Midwest
lawn. In A.M. Petrovic and B.P. Horgan (eds.). The fate of turfgrass nutrients and plant protection chemicals in the urban environment. Washington DC: American Chemical Society. (Submitted)
Lawson, D.M., and T.W. Colclough. 1991. Fertiliser nitrogen, phosphorus and
potassium leaching from fine turf growing on three different rootzone materials. J. Sports Turf Res. Institute. 67:145-152.
Lentz, R.D., R.E. Sojka, and C.W. Robbins. 1998. Reducing phosphorus losses from
surface-irrigated fields: Emerging polyacrylamide technology. J. Environ. Qual. 27:305-312.
Linde, D.T., and T.L. Watschke. 1997. Nutrients and sediment in runoff from creeping
bentgrass and perennial ryegrass turfs. J. Environ. Qual. 26:1248-1254. Linde, D.T., T.L. Watschke, A.R. Jarrett, and J.A. Borger. 1995. Surface runoff
assessment from creeping bentgrass and perennial ryegrass turf. Agron. J. 87:176-182.
37
Lush, W.M. 1990. Turf growth and performance evaluation based on turf biomass and density. Agron. J. 82:505-511.
Maguire, R.O., W.J. Chardon, and R.R. Simard. 2005. Assessing potential
environmental impacts of soil phosphorus by soil testing. In J. T. Sims and A. N. Sharpley, eds. Phosphorus: Agriculture and the environment. Agron. Monogr. 46. ASA-CSSA-SSSA, Madison, WI.
McGriff, E.C., Jr., 1972. The effects of urbanization on water quality. J. Environ. Qual.
1:86-89. Milesi, C., S.W. Running, C.D. Elvidge, J.B. Dietz, B.T. Tuttle, and R.R. Nemani.
2005. Mapping and modeling the biogeochemical cycling of turf grasses in the United States. Environ. Manage. 36:426-438.
Moss, J.Q., G.E. Bell, M.A. Kizer, M.E. Payton, H.L Zhang, and D.L. Martin. 2006.
Reducing nutrient runoff from golf course fairways using grass buffer strips of multiple heights. Crop Sci. 46:72-80.
Murphy, Bob. 1999. 1999 North Carolina Turfgrass Survey. 64 pp. Raleigh, NC: North
Carolina Agricultural Statistics. National Agricultural Statistics Service. 2002. Census of Agriculture. United States
Department of Agriculture. Washington, D.C. New York Agricultural Statistics Service. 2004. New York Turfgrass Survey. New
York State Department of Agriculture and Markets. Albany, NY. Organization for Economic Cooperation and Development. 1982. Eutrophication of
waters, monitoring, assessment and control. Organization for Economic Co-operation and Development, Paris.
Osmond, D.L., and D.H. Hardy. 2004. Characterization of turf practices in five North
Carolina communities. J. Environ. Qual. 33:565-575. Petrovic, A.M., D. Soldat, J. Gruttadaurio, and J. Barlow. 2005. Turfgrass growth and
quality related to soil and tissue nutrient content. Int. Turfgrass Soc. Res. J. 10:989 - 997.
Pierzynski et al 2005. 2005. Chemistry, cycling, and potential movement of inorganic
phosphorus in soils. In J. T. Sims and A. N. Sharpley, eds. Phosphorus: Agriculture and the environment. Agron. Monogr. 46. ASA-CSSA-SSSA, Madison, WI.
38
Porter, K.S., D.R. Bouldin, S. Pacenka, R.S. Kossack, C.A. Shoemaker, and A.A. Pucci, Jr. 1980. Studies to assess the fate of nitrogen applied to turf: Part I. Research project technical complete report. OWRT Project A-086-NY. Cornell University, Ithaca, NY.
Pouyat, R.V., I.D. Yesilonis, and D.J. Nowak. 2006. Carbon storage by urban soils in
the United States. J. Environ. Qual. 35:1566-1575. Qian, Y., and R. F. Follett. 2002. Assessing soil carbon sequestration in turfgrass
systems using long-term soil testing data. Agron. J. 94:930-935. Reddy, K.R. 1985. Soluble phosphorus release from organic soils. Agric. Ecosyst.
Environ. 8:73-82. Sharpley, A.N. 1981. The contribution of phosphorus leached from crop canopy to
losses in surface runoff. J. Environ. Qual. 10:160-165. Sharpley, A.N. 1995. Dependence of runoff phosphorus on extractable soil phosphorus.
J. Environ. Qual. 24:920-926. Shuman, L.M. 2001. Phosphate and nitrate movement through simulated golf greens.
Water Air Soil Pollut. 128:1-11. Shuman, L.M. 2002. Phosphorus and nitrate nitrogen in runoff following fertilizer
application to turfgrass. J. Environ. Qual. 31:1710-1715. Shuman, L.M. 2003. Fertilizer source effects on phosphate and nitrate leaching through
simulated golf greens. Environ. Pollut. 125:413-421. Shuman, L.M. 2004. Runoff of nitrate nitrogen and phosphorus from turfgrass after
watering-in. Commun. Soil Sci. Plant Anal. 35:9-24. Sims, J.T., and P.J.A. Kleinman. 2005. Managing agricultural phosphorus for
environmental protection. In J. T. Sims and A. N. Sharpley, eds. Phosphorus: Agriculture and the environment. Agron. Monogr. 46. ASA-CSSA-SSSA, Madison, WI.
Sims, J.T. and A.N. Sharpley. 2005. Phosphorus: Agriculture and the Environment.
Agron. Monogr. 46. ASA, CSSA, SSSA, Madison, WI. Sims, J.T., R.R. Simard, and B.C. Joern. 1998. Phosphorus loss in agricultural drainage:
Historical perspective and current research. J. Environ. Qual. 27:277-293. Starrett, S.K., N.E. Christians, and T.A. Austin. 1996. Comparing dispersivities and soil
chloride concentrations of turfgrass-covered undisturbed and disturbed soils columns. J. Hydrology. 180:21-29.
39
Starrett, S., Y Su, T. Heier, J. Klein, and J. Holste. 2006. USGA Turfgrass and Environmental Research Online. 5:1-8.
Torbert, H.A., K.W. King, and R.D. Harmel. 2005. Impact of soil amendments on
reducing phosphorus losses from runoff in sod. J. Environ. Qual. 34:1415-1421. Tukey, H.B. 1970. The leaching of substances from plants. Annu. Rev. Plant Physiol.
21:305-324. Turner, T.R. 1980. Soil test calibration studies for turfgrasses. Ph.D. Dissertation: The
Pennsylvania State University. Turner, T.R. and N.W. Hummel. 1992. Nutritional requirements and fertilization. p 385
– 439. In D.V. Waddington et al. (eds.). Turfgrass, Agronomy Monograph No. 32. ASA, CSSA and SSSJ. Madison, WI.
USEPA (United States Environmental Protection Agency). 2002. National water quality
inventory 2000 report to congress. EPA-F-00-005. Office of Water, Washington DC.
Vietor, D.M., E.N. Griffith, R.H. White, T.L. Provin, J.P. Muir, and J.C. Read. 2002.
Export of manure phosphorus and nitrogen in turfgrass sod. J. Environ. Qual. 31:1731-1738.
Winter, J.G., and P.J. Dillon. 2006. Export of nutrients from golf courses on the
Precambrian Shield. Environ. Pollution. 141:550-554. Wisconsin Agricultural Statistics Service. 2001. 1999 Wisconsin Turfgrass Industry
Survey. Wisconsin Department of Agriculture, Trade and Consumer Protection. Madison, WI.
40