Chapter 1 · Chapter Objectives •Economics defined •Role of economic theory •Microeconomics...
245
Limits, Alternatives, and Choices Chapter 1 McGraw-Hill/Irwin Copyright © 2009 by The McGraw-Hill Companies, Inc. All rights reserved.
Transcript of Chapter 1 · Chapter Objectives •Economics defined •Role of economic theory •Microeconomics...

Limits,
Alternatives,
and Choices
Chapter 1
McGraw-Hill/Irwin Copyright © 2009 by The McGraw-Hill Companies, Inc. All rights reserved.

Chapter Objectives
• Economics defined
• Role of economic theory
• Microeconomics vs. macroeconomics
• Resource scarcity and the economizing problem
• Production possibilities model
1-2
Economics Defined
• Economic wants exceed
productive capacity
• Social science concerned with
making optimal choices under
conditions of scarcity
1-3
The Economic Perspective
• Thinking like an economist
• Key features:
–Scarcity and choice
–Purposeful behavior
–Marginal analysis
1-4

Scarcity and Choice
• Resources are scarce
• Choices must be made
• There is no free lunch
• Opportunity cost
1-5

Purposeful Behavior
• Rational self-interest
• Individuals and utility
• Firms and profit
• Desired outcomes
1-6

Marginal Analysis
• Marginal benefit
• Marginal cost
• Marginal means extra
• Comparison of marginal benefit
and marginal cost
1-7

Economic Models
• The scientific method
• Cause and effect
• Economic principles
• Simplification of reality
• Other-things-equal assumption
• Graphical expression
1-8

Macro vs. Micro
• Macroeconomics
–Aggregate
• Microeconomics
–Individual Units
• Positive Economics
• Normative Economics
1-9

Individual’s Economizing Problem
• Limited income
• Unlimited wants
• A budget line
• Tradeoffs & opportunity costs
• Make best choice possible
• Change in income
1-10

A Budget Line
6
5
4
3
2
1
0
0
2
4
6
8
10
12
DVDs$20
Books$10
12
10
8
6
4
2
02 4 6 8 10 12 14
$120 Budget
Income = $120
Pdvd = $20= 6
Income = $120
Pb = $10= 12
Attainable
Unattainable
Quantity of Paperback Books
Qu
an
tity
of
DV
Ds
1-11
Society’s Economizing Problem
• Scarce resources
–Land
–Labor
–Capital
–Entrepreneurial Ability
• Factors of production
1-12
Production Possibilities Model
• Illustrate production choices
• Assumptions:
–Full employment
–Fixed resources
–Fixed technology
–Two goods
1-13
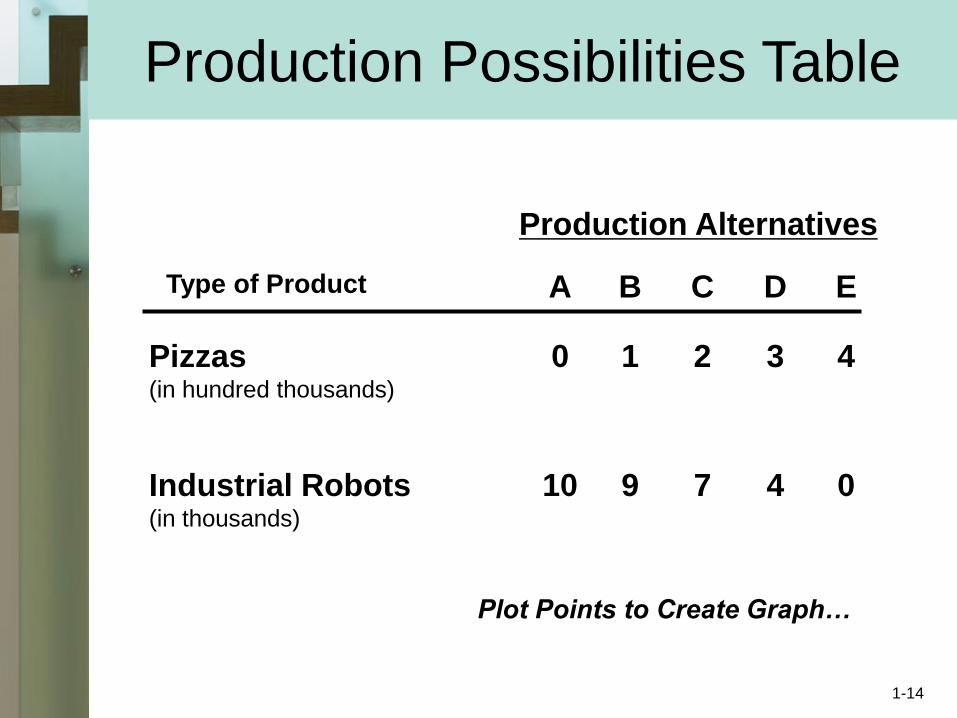
Type of Product
Pizzas(in hundred thousands)
Industrial Robots(in thousands)
Production Alternatives
A B C D E
10 9 7 4 0
0 1 2 3 4
Plot Points to Create Graph…
Production Possibilities Table
1-14
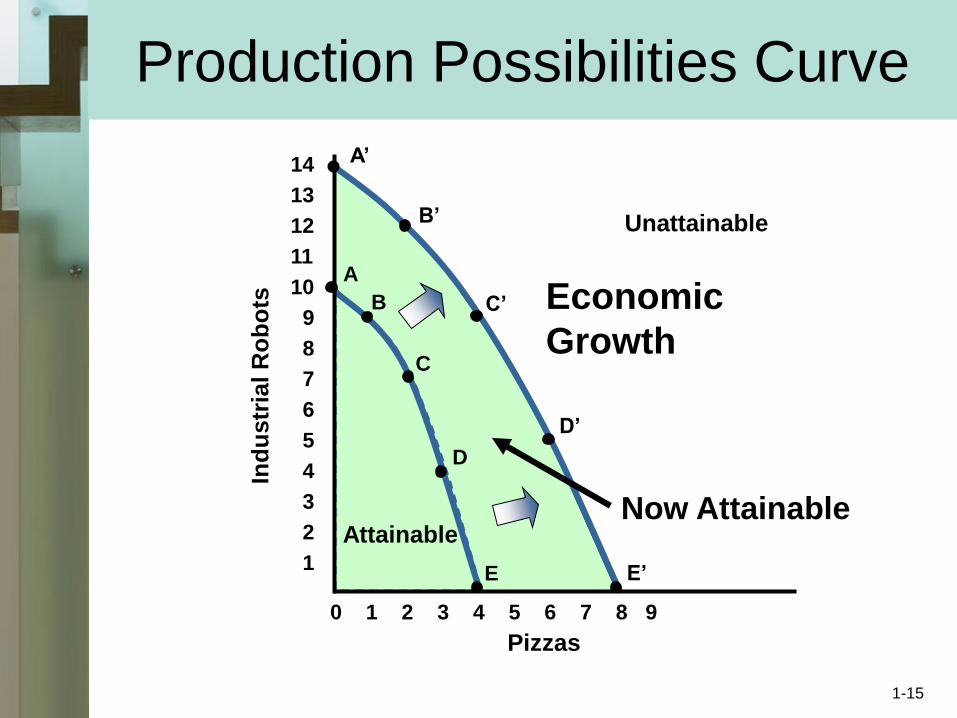
Production Possibilities Curve
Pizzas
Ind
ustr
ial R
ob
ots
Attainable
0 1 2 3 4 5 6 7 8 9
14
13
12
11
10
9
8
7
6
5
4
3
2
1
Unattainable
A
B
C
D
E
Economic
Growth
Now Attainable
A’
B’
C’
D’
E’
1-15
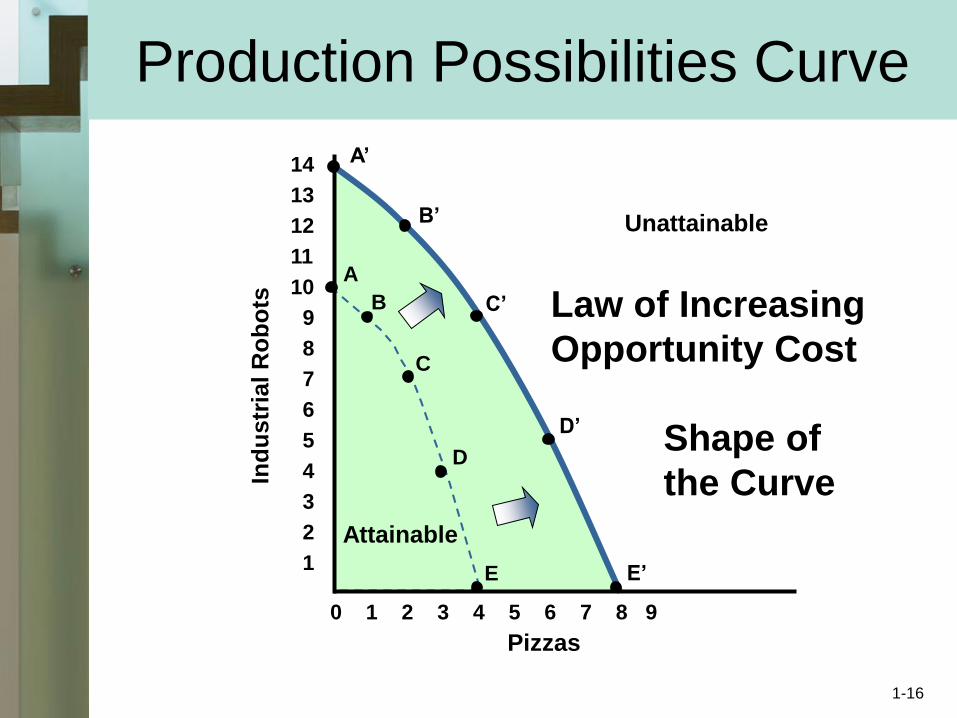
Production Possibilities Curve
Pizzas
Ind
ustr
ial R
ob
ots
Attainable
0 1 2 3 4 5 6 7 8 9
14
13
12
11
10
9
8
7
6
5
4
3
2
1
Unattainable
A
B
C
D
E
Law of Increasing
Opportunity Cost
A’
B’
C’
D’
E’
Shape of
the Curve
1-16

Production Possibilities Curve
Pizzas
Ind
ustr
ial R
ob
ots
Under or
Unemployment
0 1 2 3 4 5 6 7 8 9
14
13
12
11
10
9
8
7
6
5
4
3
2
1
Unattainable
A’
B’
C’
D’
E’
U
1-17

The Future Economy
• Consequences of unemployment
• Economic growth
–More resources
–Better quality resources
–Technological advances
1-18
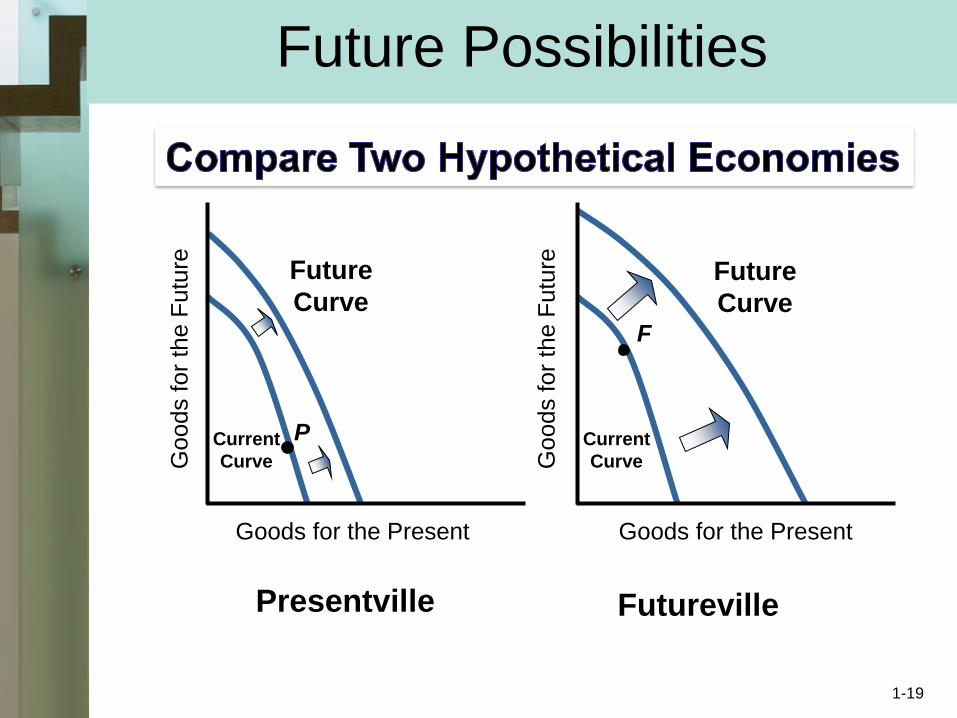
Future Possibilities
Goods for the Present
Goods fo
r th
e F
utu
re
Goods fo
r th
e F
utu
reGoods for the Present
P
F
Current
Curve
Current
Curve
Future
CurveFuture
Curve
Presentville Futureville
1-19
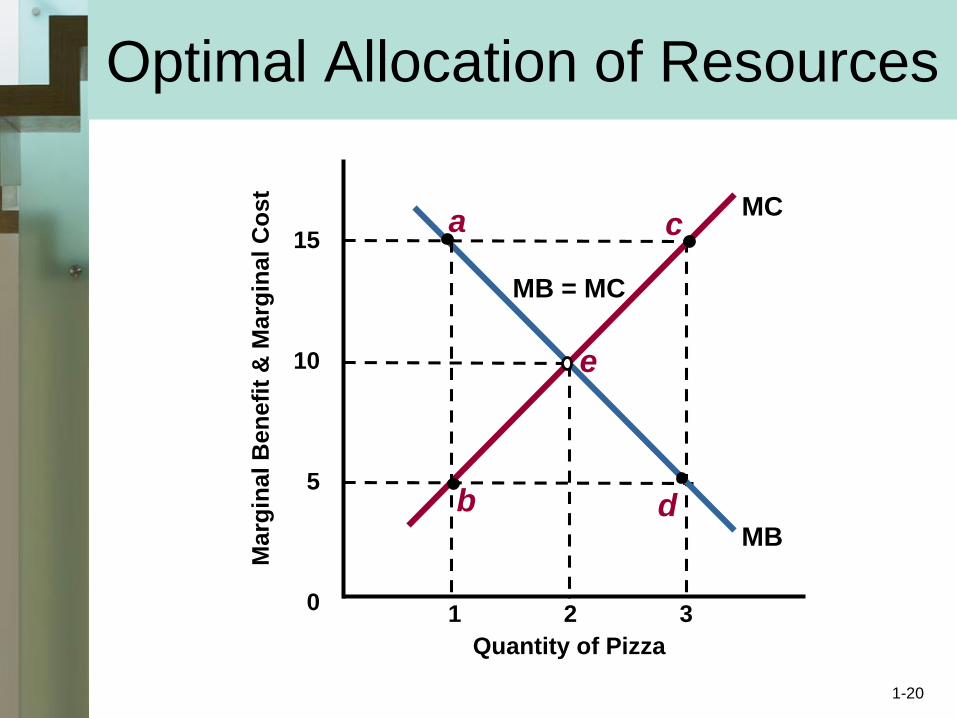
Optimal Allocation of Resources
15
10
5
01 2 3
a
b
c
d
e
MB = MC
MC
MB
Quantity of Pizza
Marg
inal B
en
efi
t &
Marg
inal
Co
st
1-20
Key Terms
• economics
• economic perspective
• opportunity cost
• utility
• marginal analysis
• scientific method
• economic principle
• other-things-equal assumption
• macroeconomics
• aggregate
• microeconomics
• positive economics
• normative economics
• economizing problem
• budget line
• economic resources
• land
• labor
• capital
• investment
• entrepreneurial ability
• factors of production
• consumer goods
• capital goods
• production possibilities curve
• law of increasing opportunity costs
• economic growth 1-21

The Market
System and the
Circular Flow
1-22

The Market System
and the
Circular Flow
Chapter 2
McGraw-Hill/Irwin Copyright © 2009 by The McGraw-Hill Companies, Inc. All rights reserved.
Chapter Objectives
• Economic systems
• Market system characteristics
• Market system questions
–what, how, and who
• Change and progress in the market system
• The circular flow model
2-24

Economic Systems
• Set of institutional arrangements
• Coordinating mechanism
• Differ based on:
–Who owns the factors of production
–What method directs economic
activity
2-25

Economic Systems
• The market system
–Private ownership
–Markets
• The command system
–Government ownership
–Central planning board
2-26

Index of Economic Freedom
Free MostlyFree
MostlyUnfree
Repressed
1- Hong Kong
3- Ireland
5- United States
20- Belgium
31- Spain
48- France
101- Brazil
126- China
134- Russia
148- Venezuela
156- Cuba
157- North Korea
Ranking of 157 countries for 2008
2-27

Market System Characteristics
• Private property
• Freedom of enterprise and choice
• Self-interest
• Competition
• Markets and prices
2-28
Market System Characteristics
• Technology and capital goods
• Specialization
–Division of labor
–Geographic specialization
• Use of money
• Active, limited government
2-29

Market System Questions
• What will be produced?
–consumer sovereignty
–dollar votes
• How will goods be produced?
–technology
–resource cost
2-30
Market System Questions
• Who gets the output?
–willingness to pay
• How is change accommodated?
–self-interest
• How is progress promoted?
–technological advance
–capital accumulation
2-31
The Invisible Hand
• 1776 Wealth of Nations byAdam Smith
–Unity of private and social interest
• Virtues of the market system
–Efficiency
–Incentives
–Freedom
2-32

The Command System
• Soviet Union, Eastern Europe, China
• System was a failure
• The coordination problem
–Set output targets for all goods
• The incentive problem
–No adjustments for shortage or surplus
2-33

Circular Flow
Resource
Market
Product
Market
Businesses Households
2-34

Circular Flow
Resource
Market
Product
Market
Businesses Households
2-35

Circular Flow
Resource
Market
Product
Market
Businesses Households
Figure 2.2; page 40
2-36
Key Terms
• economic system
• command system
• market system
• private property
• freedom of enterprise
• freedom of choice
• self-interest
• competition
• market
• specialization
• division of labor
• medium of exchange
• barter
• money
• consumer sovereignty
• dollar votes
• creative destruction
• “invisible hand”
• circular flow diagram
• resource market
• product market2-37

Next Chapter Preview…
Demand, Supply,
and the Market
Equilibrium
2-38

Demand, Supply, and Market Equilibrium
Chapter 3
Copyright © 2009 by The McGraw-Hill Companies, Inc. All rights reserved.McGraw-Hill/Irwin
Chapter Objectives
• Demand and its determinants
• Supply and its determinants
• Supply, demand, & market equilibrium
• Changes in supply and demand
• Government-set prices
3-40

A Market
• Interaction between buyers
and sellers
• Buyers demand goods
• Sellers supply goods
• Assumptions
–Standardized good
–Competitive market
3-41
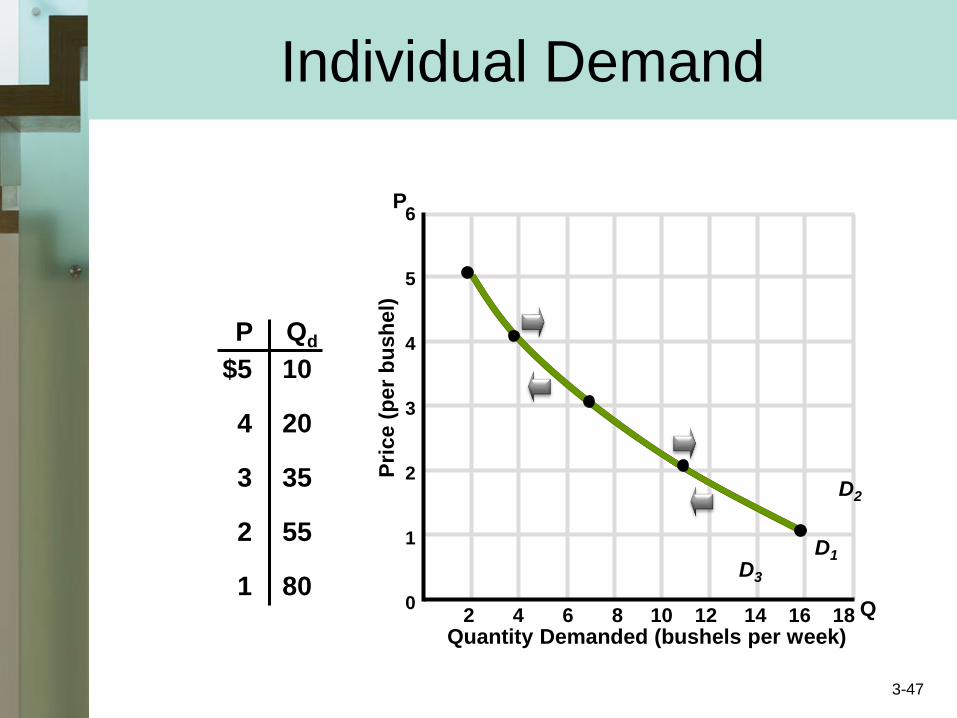
Demand
• Schedule or curve
• Amount consumers willing
and able to purchase at a
given price
• Other things equal
• Individual demand
• Market demand
3-42
Law of Demand
• Other things equal, as price
falls quantity demanded
rises
• Explanations:
–Diminishing marginal utility
–Income effect
–Substitution effect
3-43
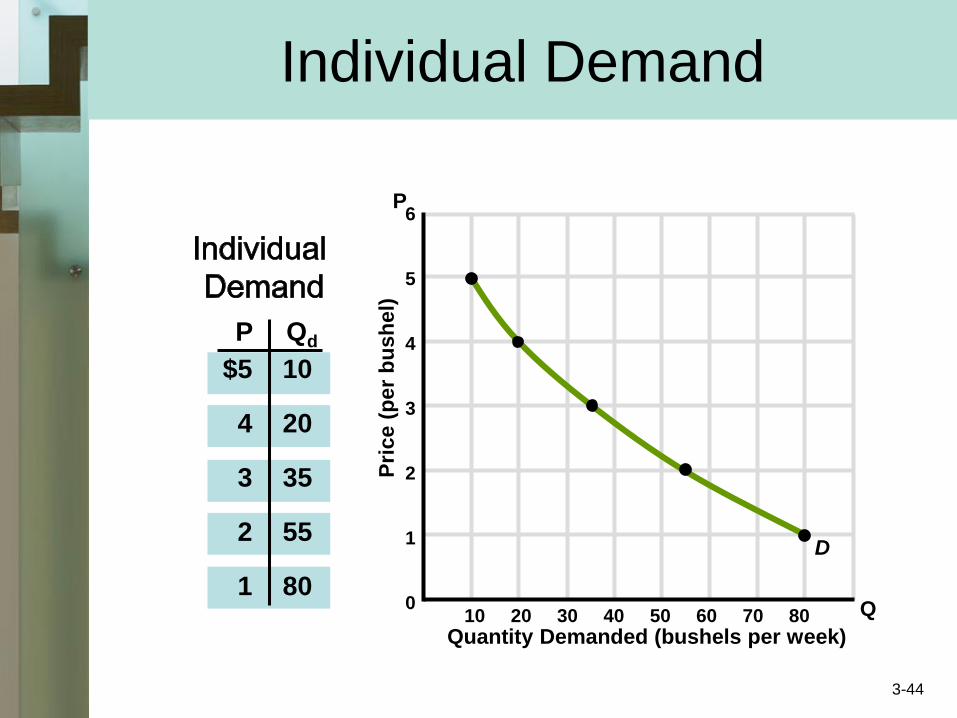
Individual Demand
6
5
4
3
2
1
010 20 30 40 50 60 70 80
Quantity Demanded (bushels per week)
Pri
ce (
per
bu
sh
el)
P Qd
$5
4
3
2
1
10
20
35
55
80
P
Q
D
3-44

Determinants of Demand
• Factors that shift the demand curve
• Cause more or less to be bought at any possible price
• Increase or decrease in demand
• Tastes
• Number of buyers
3-45

Determinants of Demand
• Income
–Normal goods
–Inferior goods
• Price of related goods
–Substitute good
–Complementary good
–Unrelated goods
• Consumer expectations3-46
Individual Demand
6
5
4
3
2
1
0
Quantity Demanded (bushels per week)
Pri
ce (
per
bu
sh
el)
P Qd
$5
4
3
2
1
10
20
35
55
80
P
Q
D1
2 4 6 8 10 12 14 16 18
D2
D3
3-47

Individual Demand
6
5
4
3
2
1
0
Quantity Demanded (bushels per week)
Pri
ce (
per
bu
sh
el)
P Qd
$5
4
3
2
1
10
20
35
55
80
P
Q
D1
2 4 6 8 10 12 14 16 18
D2
D3
Change in Demand
Change in Quantity
Demanded
3-48
Supply
• Schedule or curve
• Amount producers willing
and able to sell at a given
price
• Individual supply
• Market supply
3-49

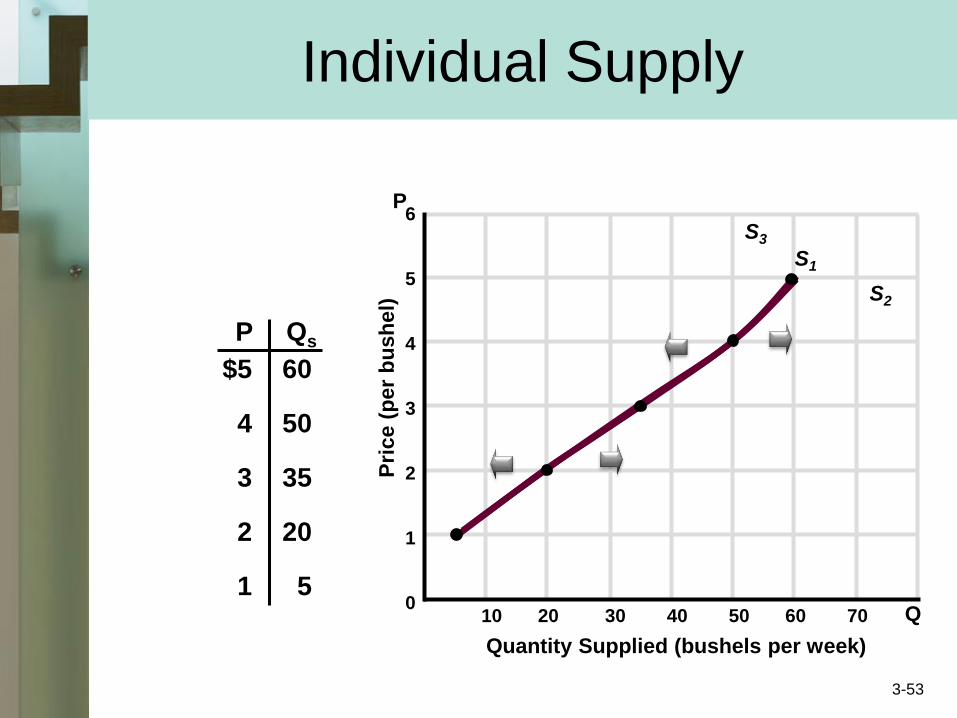
Law of Supply
• Other things equal, as price
rises the quantity supplied
rises
• Explanations:
–Revenue implications
–Marginal cost
3-50

Individual Supply
6
5
4
3
2
1
0
Quantity Supplied (bushels per week)
Pri
ce (
per
bu
sh
el)
P Qs
$5
4
3
2
1
60
50
35
20
5
P
Q
S1
10 20 30 40 50 60 70
3-51
Determinants of Supply
• Resource prices
• Technology
• Taxes and subsidies
• Prices of other goods
• Producer expectations
• Number of sellers
3-52
Individual Supply
6
5
4
3
2
1
0
Quantity Supplied (bushels per week)
Pri
ce (
per
bu
sh
el)
P Qs
$5
4
3
2
1
60
50
35
20
5
P
Q
S1
S2
S3
10 20 30 40 50 60 70
3-53
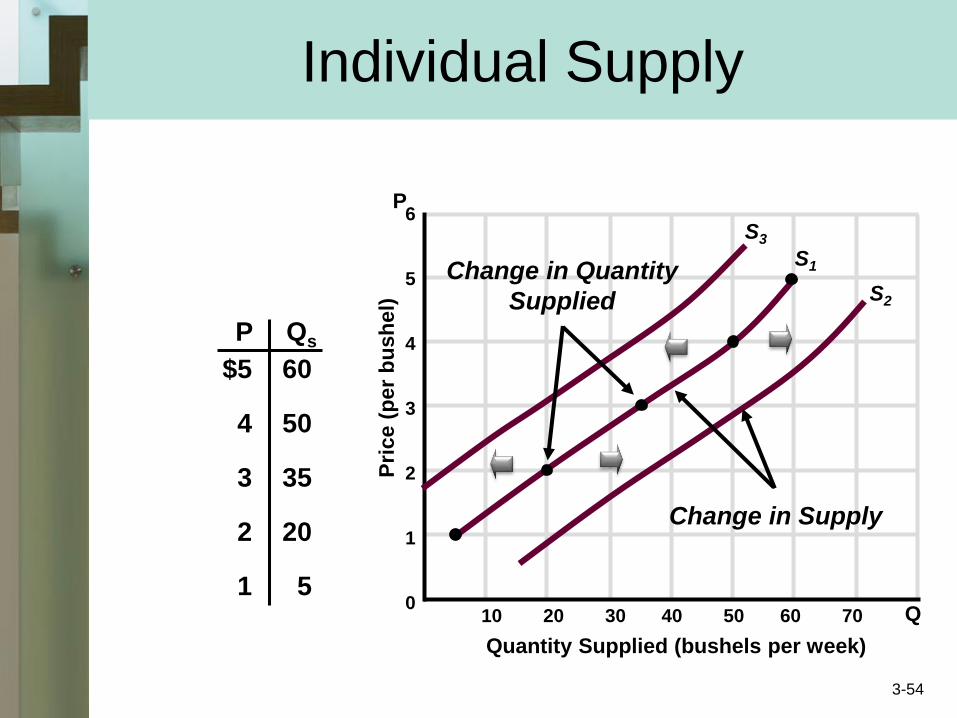
Individual Supply
6
5
4
3
2
1
0
Quantity Supplied (bushels per week)
Pri
ce (
per
bu
sh
el)
P Qs
$5
4
3
2
1
60
50
35
20
5
P
Q
S1
S2
S3
10 20 30 40 50 60 70
Change in Quantity
Supplied
Change in Supply
3-54
Market Equilibrium
• Equilibrium price and quantity
• Surplus and shortage
• Rationing function of price
• Efficient allocation
–Productive efficiency
–Allocative efficiency
3-55
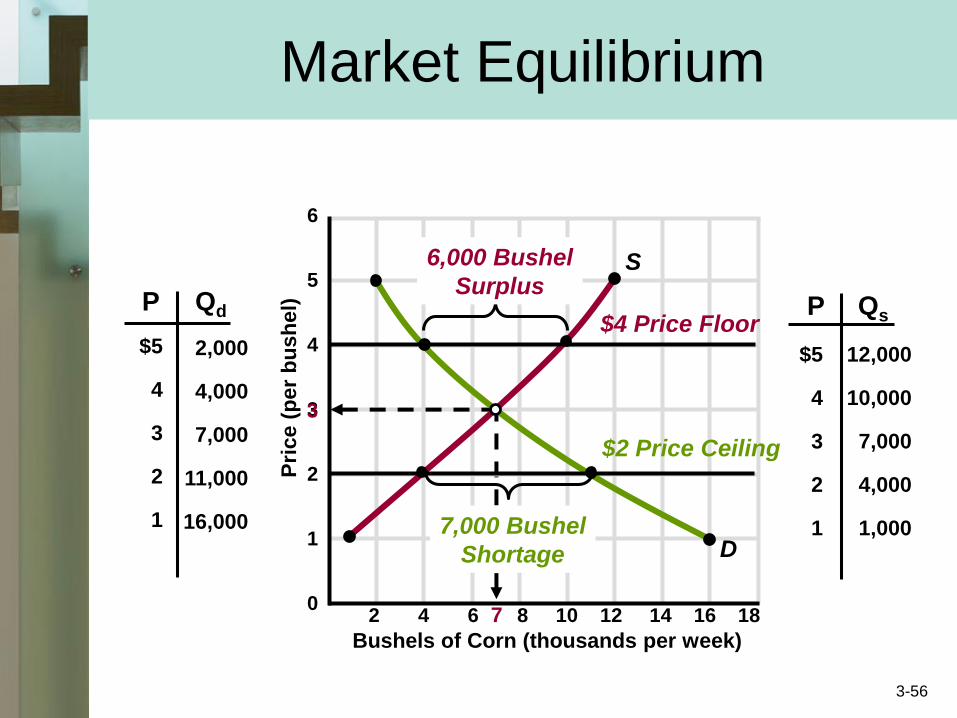
Market Equilibrium
6
5
4
3
2
1
02 4 6 8 10 12 14 16 18
Bushels of Corn (thousands per week)
Pri
ce (
per
bu
sh
el)P Qd
$5
4
3
2
1
2,000
4,000
7,000
11,000
16,000
P Qs
$5
4
3
2
1
12,000
10,000
7,000
4,000
1,000
7
3
D
S
$4 Price Floor
6,000 Bushel
Surplus
$2 Price Ceiling
7,000 Bushel
Shortage
3-56

Market Equilibrium
• Change in demand
–Shift of the demand curve
• Change in supply
–Shift of the supply curve
• Change in equilibrium price and
quantity
3-57

Market Equilibrium
• Supply increase; Demand decrease
• Supply decrease; Demand increase
• Supply increase; Demand increase
• Supply decrease; Demand decrease
Price Quantity
?
?
?
?3-58
Government-Set Prices
• Price ceilings on gasoline
–Rationing problem
–Black markets
• Rent controls
• Price floors on wheat
–Optimal allocation of
resources
3-59
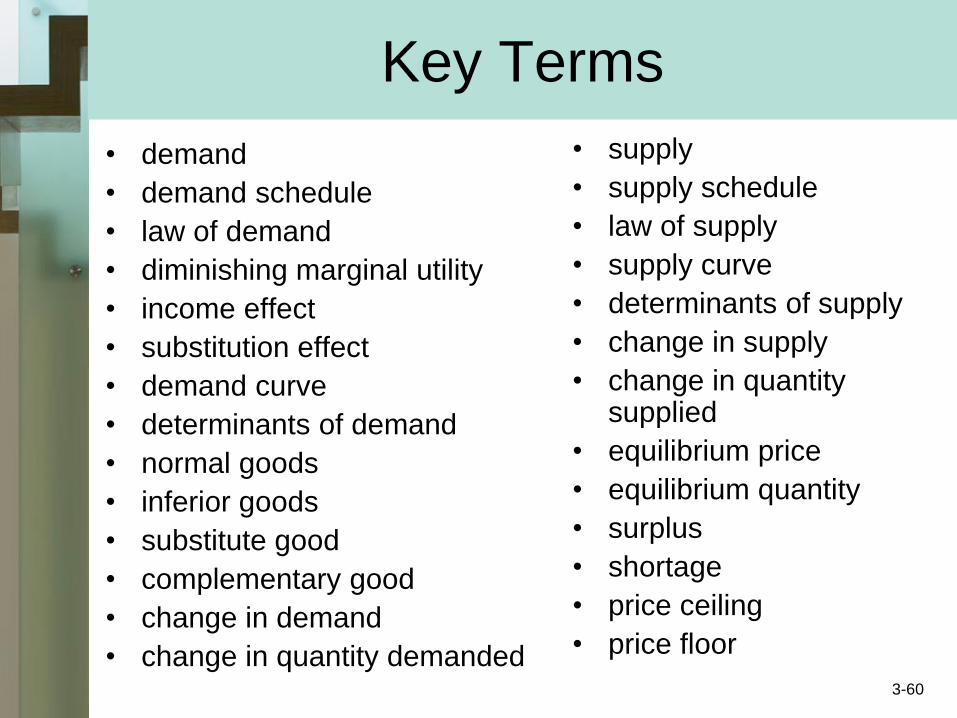
Key Terms
• demand
• demand schedule
• law of demand
• diminishing marginal utility
• income effect
• substitution effect
• demand curve
• determinants of demand
• normal goods
• inferior goods
• substitute good
• complementary good
• change in demand
• change in quantity demanded
• supply
• supply schedule
• law of supply
• supply curve
• determinants of supply
• change in supply
• change in quantity supplied
• equilibrium price
• equilibrium quantity
• surplus
• shortage
• price ceiling
• price floor
3-60

Elasticity, Consumer
Surplus, and
Producer Surplus
Chapter 6
McGraw-Hill/Irwin Copyright © 2009 by The McGraw-Hill Companies, Inc. All rights reserved.
Chapter Objectives
• Price elasticity of demand
• The total revenue test
• Price elasticity of supply
• Cross elasticity of demand
• Income elasticity of demand
• Consumer & producer surplus
• Efficiency losses
6-62

Price Elasticity of Demand
• Measuring responsiveness to price changes
• Elastic demand–Large change in quantity
purchased for given price change
• Inelastic demand–Small change in quantity
purchased for given price change
6-63

Interpretations of Elasticity
Elastic Demand
Inelastic Demand
Unit Elasticity
Ed = .04
.02= 2
Ed = .01
.02= .5
Ed = .02
.02= 1
6-64

Price Elasticity of Demand
• Why use percentages?
–Unit free measure
–Compare responsiveness across
products
• Elimination of the (-) sign
• Extreme cases
–Perfectly inelastic demand
–Perfectly elastic demand6-65
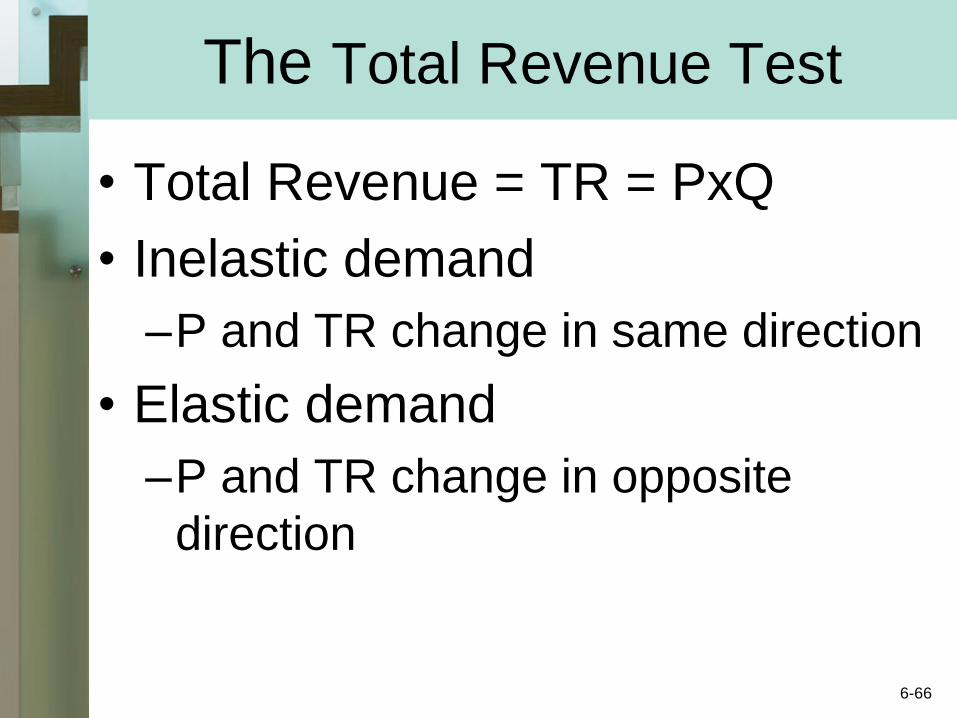
The Total Revenue Test
• Total Revenue = TR = PxQ
• Inelastic demand
–P and TR change in same direction
• Elastic demand
–P and TR change in opposite
direction
6-66
]]]]]]]
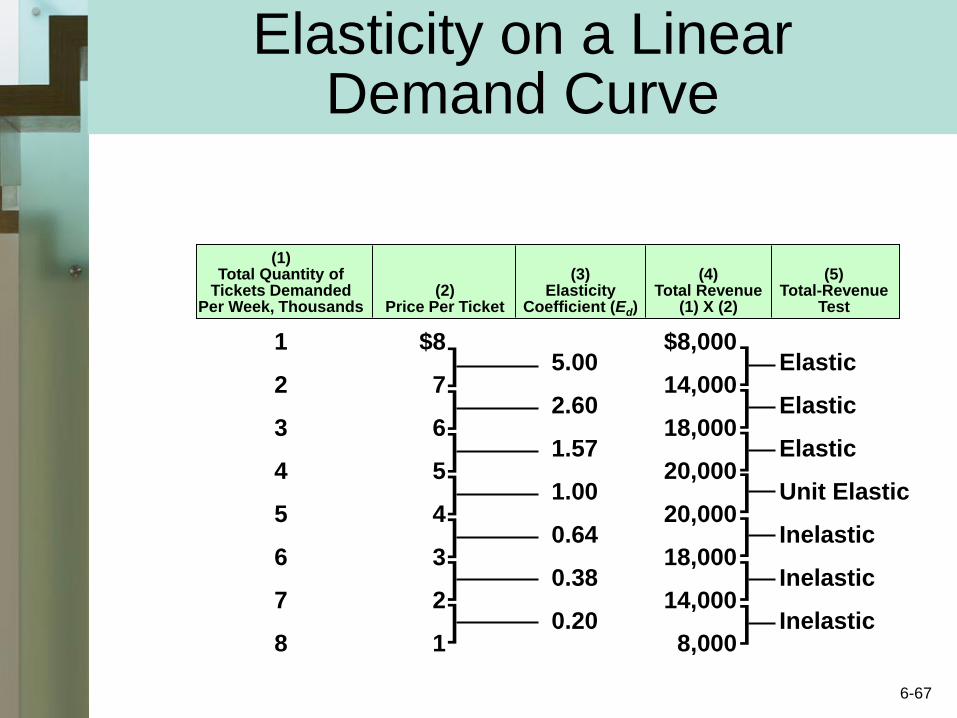
Elasticity on a Linear Demand Curve
1
2
3
4
5
6
7
8
$8
7
6
5
4
3
2
1
5.00
2.60
1.57
1.00
0.64
0.38
0.20
$8,000
14,000
18,000
20,000
20,000
18,000
14,000
8,000
Elastic
Elastic
Elastic
Unit Elastic
Inelastic
Inelastic
Inelastic
(1)Total Quantity of
Tickets DemandedPer Week, Thousands
(2)Price Per Ticket
(3)Elasticity
Coefficient (Ed)
(4)Total Revenue
(1) X (2)
(5)Total-Revenue
Test
]]]]]]]
6-67

Determinants of Elasticity
• Substitutability
–More substitutes, more elastic demand
• Proportion of income
–Price relative to income
• Luxuries versus necessities
–Luxuries are more elastic
• Time
–More elastic in the long run 6-68

Price Elasticity of Supply
Percentage Change in Quantity
Supplied of Product X
Percentage Change in Price
of Product X
Es =
Responsiveness to price
changes by producers
6-69
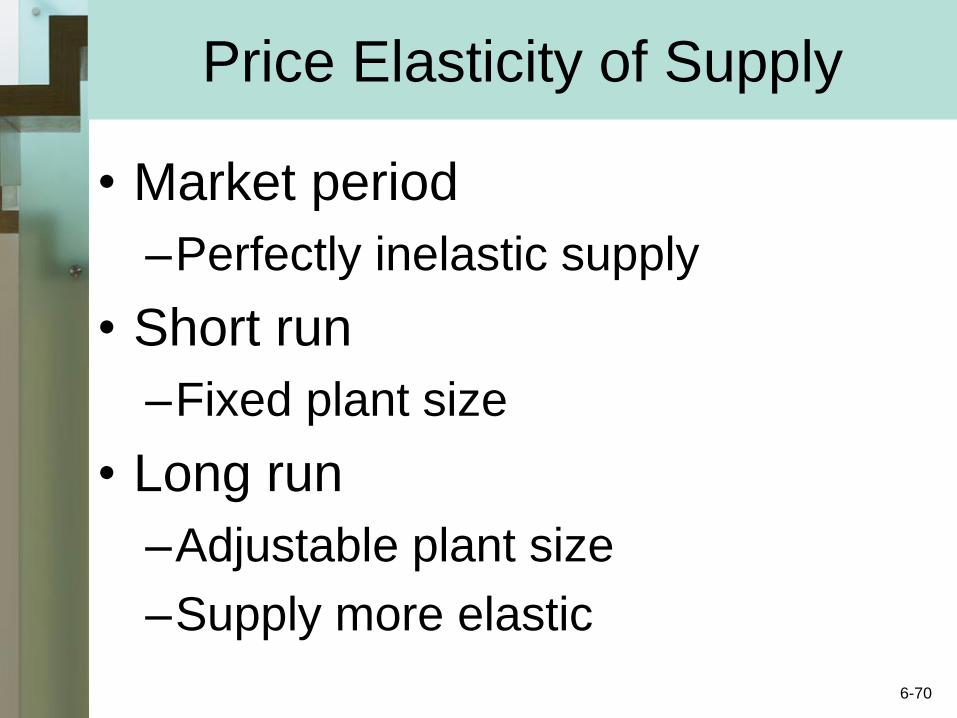
Price Elasticity of Supply
• Market period
–Perfectly inelastic supply
• Short run
–Fixed plant size
• Long run
–Adjustable plant size
–Supply more elastic
6-70

Price Elasticity of Supply
• Applications
• Antiques and reproductions
–Limited, inelastic supply
–Strong demand
–Resulting high price
• Volatile gold prices
–Inelastic supply
–Shifting demand6-71
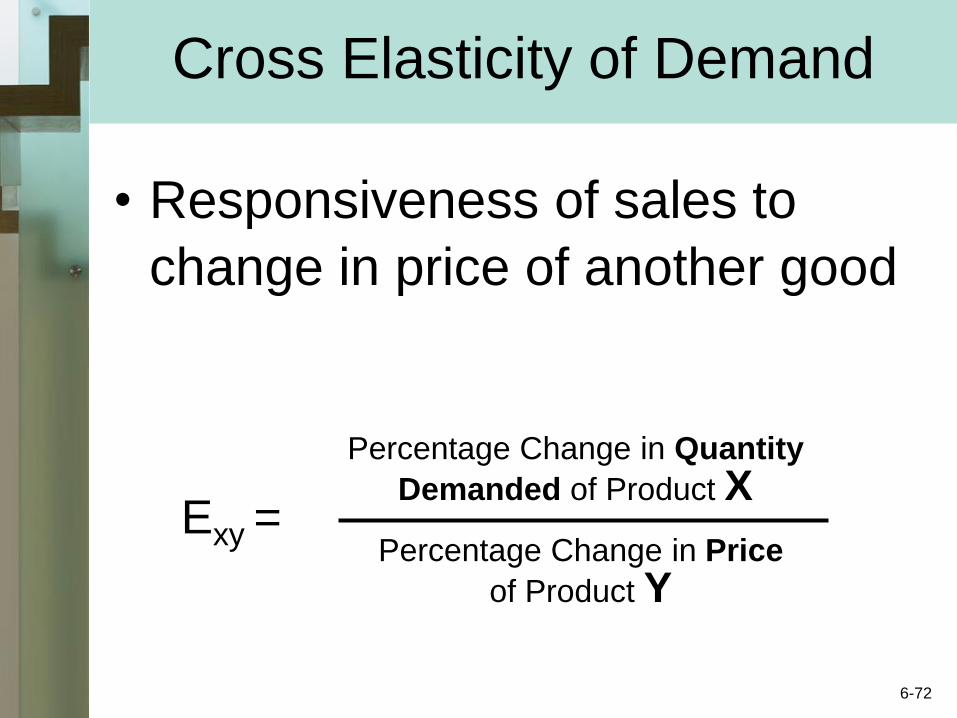
Cross Elasticity of Demand
• Responsiveness of sales to
change in price of another good
Percentage Change in Quantity
Demanded of Product X
Percentage Change in Price
of Product Y
Exy =
6-72
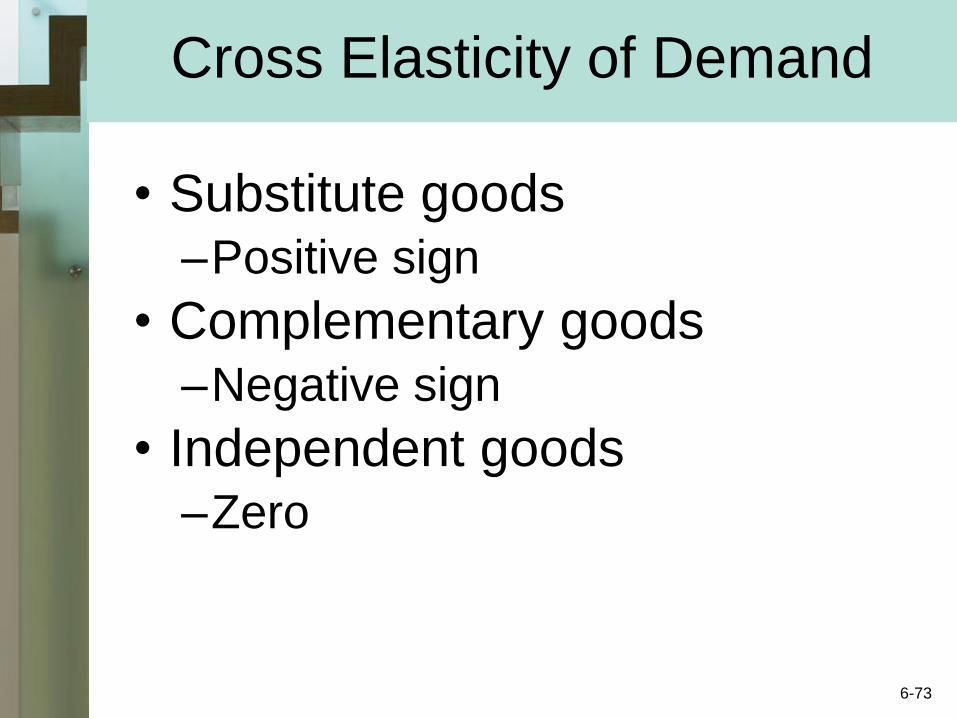
Cross Elasticity of Demand
• Substitute goods–Positive sign
• Complementary goods–Negative sign
• Independent goods–Zero
6-73
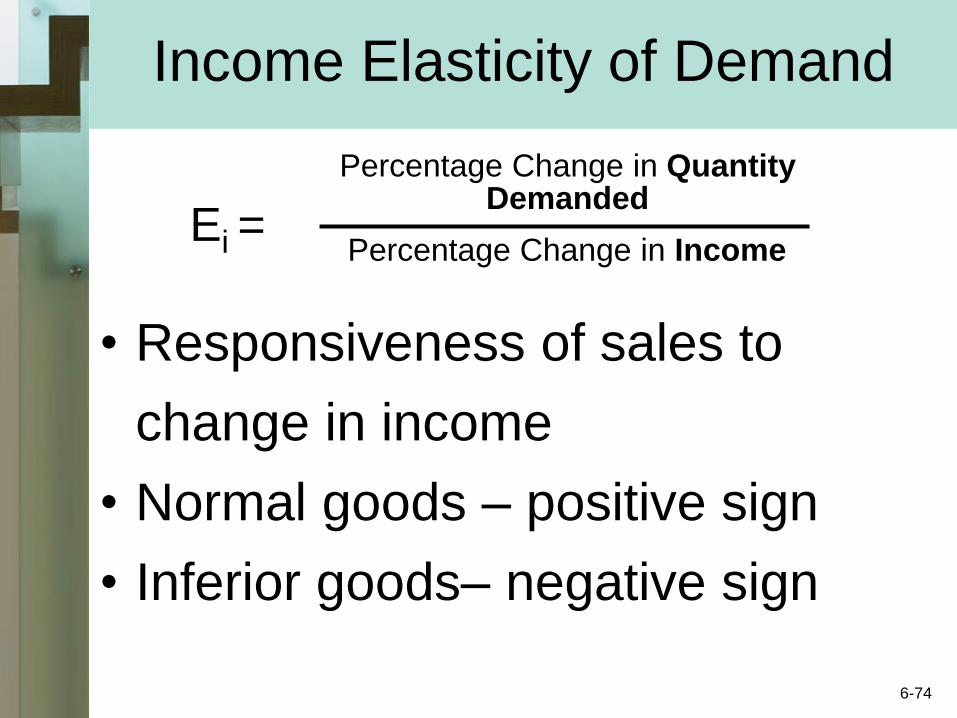
Income Elasticity of Demand
• Responsiveness of sales to
change in income
• Normal goods – positive sign
• Inferior goods– negative sign
Percentage Change in QuantityDemanded
Percentage Change in IncomeEi =
6-74

Key Terms
• price elasticity of demand
• midpoint formula• elastic demand• inelastic demand• unit elasticity• perfectly inelastic
demand• perfectly elastic
demand• total revenue (TR)• total-revenue test
• price elasticity of supply
• market period• short run• long run• cross elasticity of
demand• income elasticity of
demand• consumer surplus• producer surplus• efficiency losses
(deadweight losses)6-75

Next Chapter Preview…
Consumer Behavior
6-76

Consumer Behavior
Chapter 7

Chapter Objectives
• Total utility and marginal utility
• Law of diminishing marginal utility
• Marginal utility-to-price ratios
• Deriving the demand curve
• Income and substitution effects
• Appendix: the indifference curve model
7-78
Utility
• Diminishing marginal utility (again)
• Satisfaction obtained from consumption
• Three characteristics
–Differs from usefulness
–Subjective
–Difficult to quantify
7-79
Utility
• Total utility–Total satisfaction from a specific
quantity
• Marginal utility–Extra satisfaction from an
additional unit
• Law of diminishing marginal utility –Explains downward sloping
demand7-80

Utility Graphically
0
10
20
30
10
8642
0-2
1 2 3 4 5 6 7
1 2 3 4 5 6 7
To
tal
Uti
lity
(U
tils
)M
arg
inal
Uti
lity
(U
tils
)
(1)Tacos
ConsumedPer Meal
(2)Total
Utility,Utils
(3)Marginal
Utility,Utils
0
1
2
3
4
5
6
7
0
10
18
24
28
30
30
28
]]]]]]]
10
8
6
4
2
0
-2
TU
MU
Total Utility
Marginal Utility
Units Consumed Per Meal
Units Consumed Per Meal
7-81
Theory of Consumer Behavior
• Key dimensions of the consumer problem
–Rational behavior
–Preferences
–Budget constraint
–Prices
7-82
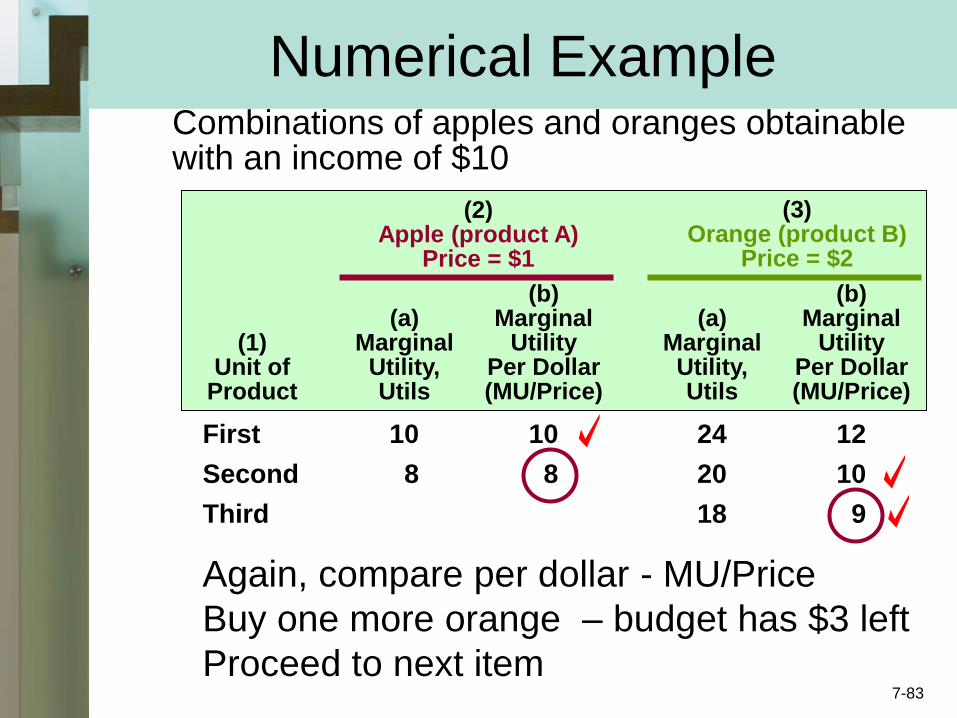
Numerical ExampleCombinations of apples and oranges obtainable with an income of $10
(1)Unit of
Product
(a)Marginal
Utility,Utils
(a)Marginal
Utility,Utils
(b)Marginal
UtilityPer Dollar(MU/Price)
(b)Marginal
UtilityPer Dollar(MU/Price)
(2)Apple (product A)
Price = $1
(3)Orange (product B)
Price = $2
First
Second
Third
Fourth
Fifth
Sixth
Seventh
10
8
7
6
5
4
3
24
20
18
16
12
6
4
10
8
7
6
5
4
3
12
10
9
8
6
3
2
Again, compare per dollar - MU/Price
Buy one more orange – budget has $3 left
Proceed to next item 7-83

Numerical ExampleCombinations of apples and oranges obtainable with an income of $10
(1)Unit of
Product
(a)Marginal
Utility,Utils
(a)Marginal
Utility,Utils
(b)Marginal
UtilityPer Dollar(MU/Price)
(b)Marginal
UtilityPer Dollar(MU/Price)
(2)Apple (product A)
Price = $1
(3)Orange (product B)
Price = $2
First
Second
Third
Fourth
Fifth
Sixth
Seventh
10
8
7
6
5
4
3
24
20
18
16
12
6
4
10
8
7
6
5
4
3
12
10
9
8
6
3
2
Again, compare per dollar - MU/Price
Buy one of each – budget exhausted7-84
Key Terms
• Law of diminishing marginal utility
• Utility
• Total utility
• Marginal utility
• Rational behavior
• Budget constraint
• Utility maximizing rule
• Income effect
• Substitution effect
7-85

Next Chapter Preview…
The Costs ofProduction
7-86
The Costs of
Production
Chapter 8
Chapter Objectives
• Explicit and implicit costs
• Law of diminishing returns
• Fixed and variable costs
• Total, average, and marginal costs
• The firm’s size in the long run
8-88
Economic Costs
• Equal to opportunity costs
• Explicit + implicit costs
• Explicit costs
–Monetary payments
• Implicit costs
–Value of next best use
–Self-owned resources
–Self-employed resources8-89

Profit
• Accounting profit
–Total revenue less explicit cost
• Normal profit
–Equal to implicit cost
• Economic or pure profit
–Total revenue less economic cost
8-90

Profits Compared
Economic
Profit
Accounting
Costs (Explicit
Costs Only)
Accounting
Profit
Explicit
Costs
Implicit Costs(Including a
Normal Profit)
Eco
no
mic
(Op
po
rtu
nit
y)
Co
sts
To
tal R
even
ue
Economic Accounting
8-91
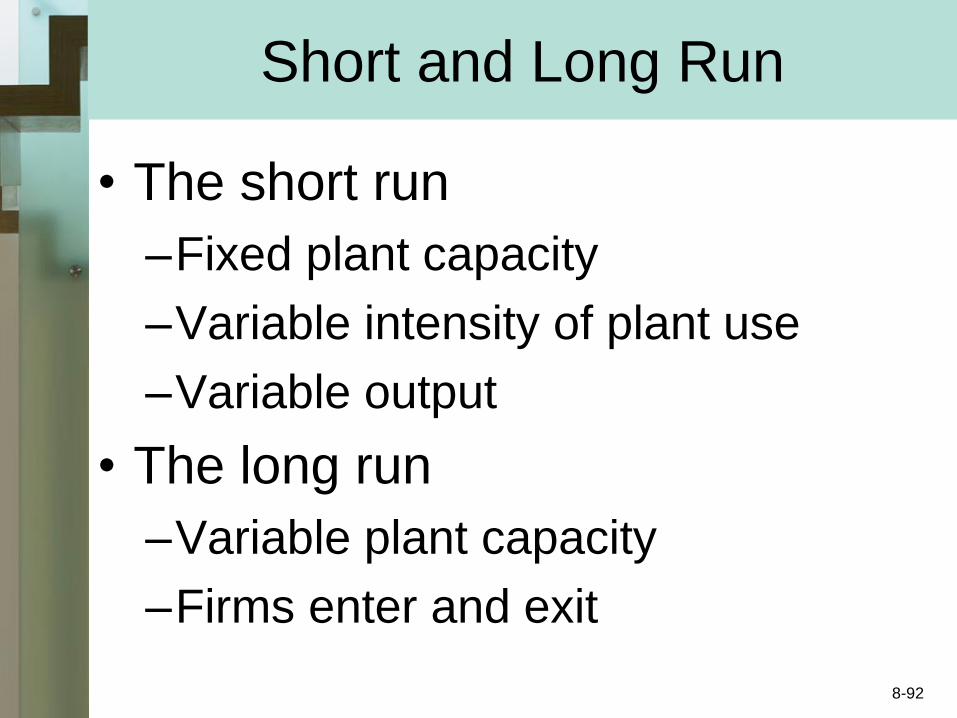
Short and Long Run
• The short run
–Fixed plant capacity
–Variable intensity of plant use
–Variable output
• The long run
–Variable plant capacity
–Firms enter and exit
8-92

Production Relationships
• Total product (TP)
• Marginal product (MP)
• Average product (AP)
Average ProductTotal Product
Units of Labor=
Marginal ProductChange in Total Product
Change in Labor Input=
8-93
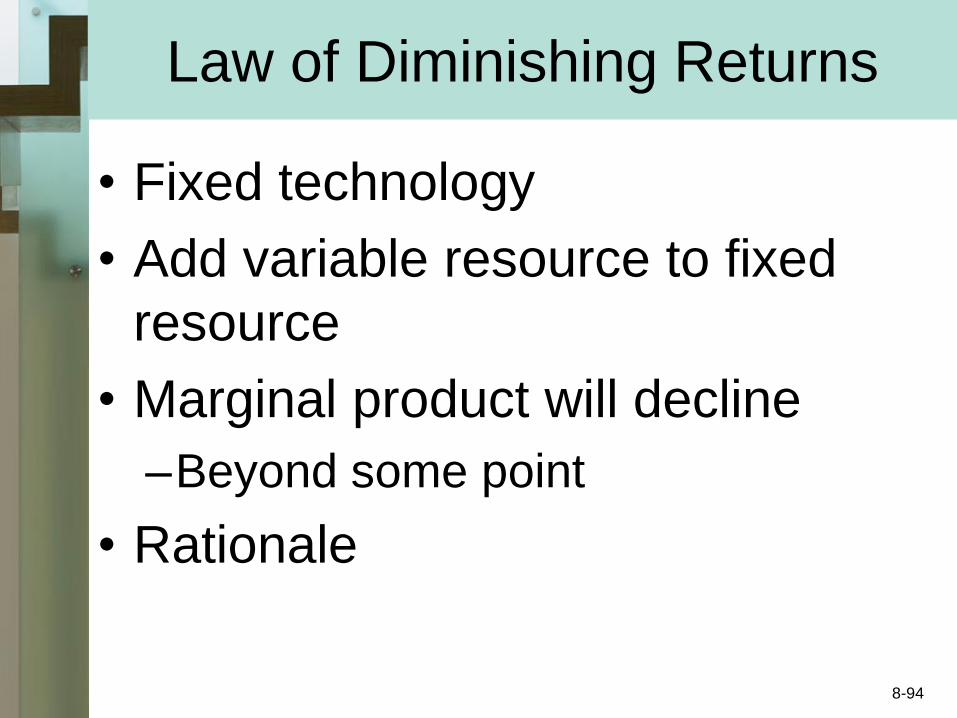
Law of Diminishing Returns
• Fixed technology
• Add variable resource to fixed
resource
• Marginal product will decline
–Beyond some point
• Rationale
8-94
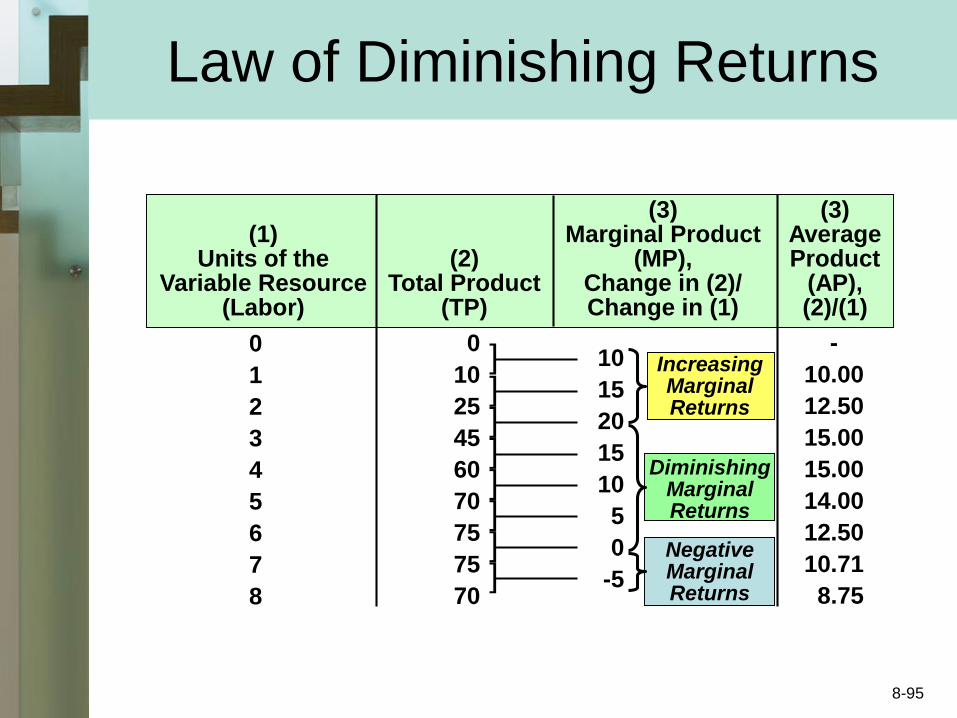
IncreasingMarginalReturns
Law of Diminishing Returns
(1)Units of the
Variable Resource(Labor)
(2)Total Product
(TP)
(3)Marginal Product
(MP),Change in (2)/Change in (1)
(3)AverageProduct
(AP),(2)/(1)
0
1
2
3
4
5
6
7
8
0
10
25
45
60
70
75
75
70
10
15
20
15
10
5
0
-5
-
10.00
12.50
15.00
15.00
14.00
12.50
10.71
8.75
]]]]]]]]
DiminishingMarginalReturns
NegativeMarginalReturns
8-95
0
10
20
30
To
tal
Pro
du
ct,
TP
1 2 3 4 5 6 7 8 9
20
10
Marg
inal
Pro
du
ct,
MP
1 2 3 4 5 6 7 8 9
TP
MP
AP
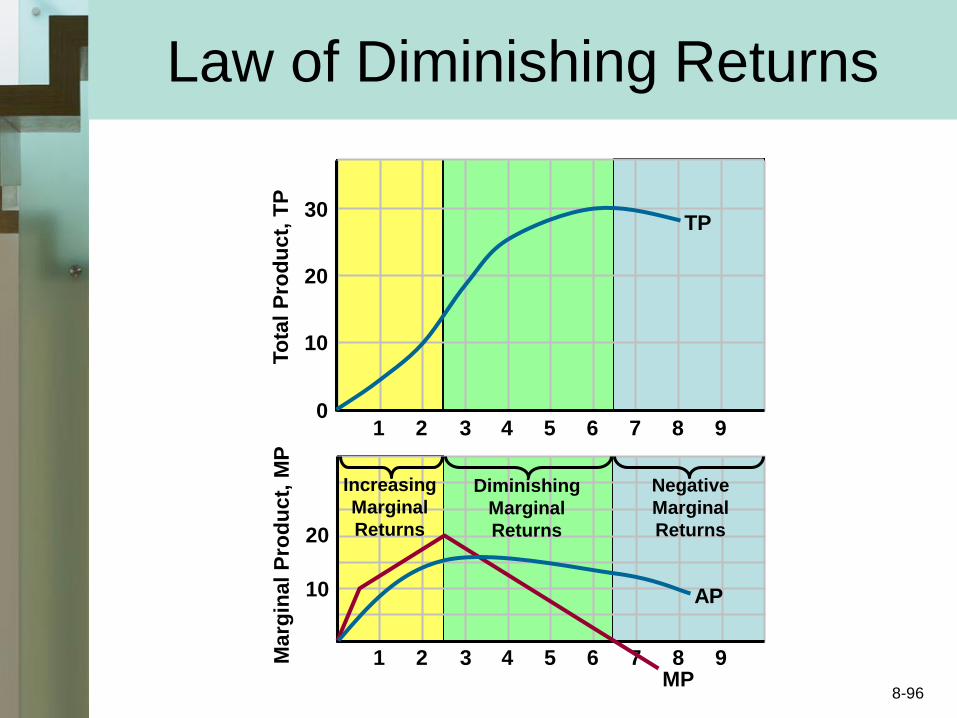
Increasing
Marginal
Returns
Diminishing
Marginal
Returns
Negative
Marginal
Returns
Law of Diminishing Returns
8-96

Short-Run Production Costs
• Fixed Costs
–Do not vary with output
• Variable Costs
–Materials, most labor
• Total Cost
–TC = TFC + TVC
8-97
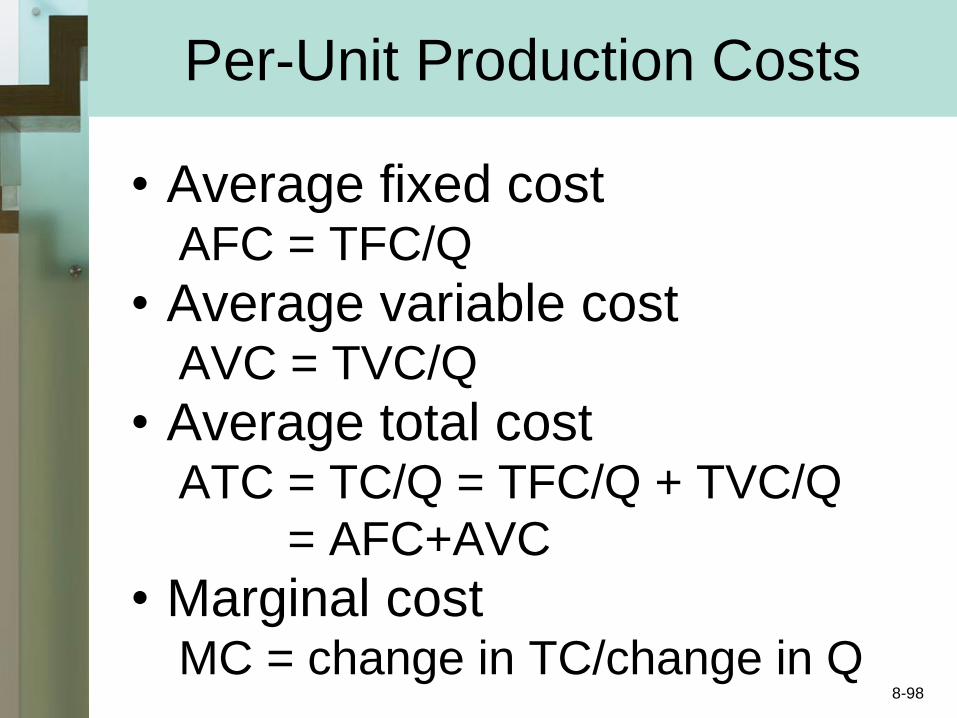
Per-Unit Production Costs
• Average fixed cost AFC = TFC/Q
• Average variable costAVC = TVC/Q
• Average total cost ATC = TC/Q = TFC/Q + TVC/Q
ATC = AFC+AVC
• Marginal costMC = change in TC/change in Q
8-98
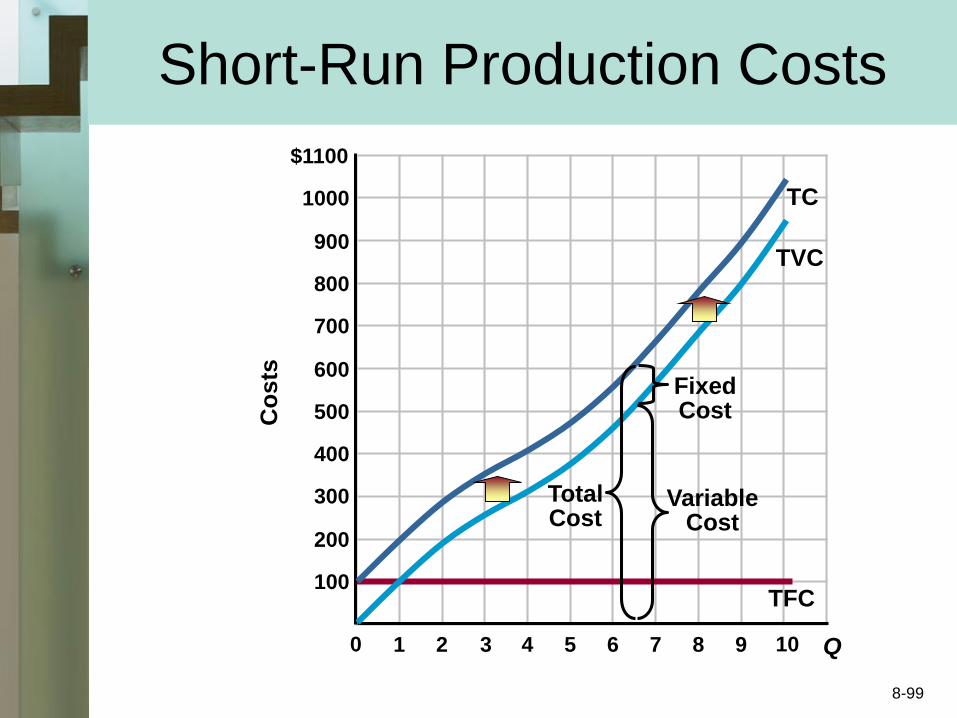
Short-Run Production Costs
Co
sts
1 2 3 4 5 6 7 8 9 100 Q
100
200
300
400
500
600
700
800
900
1000
$1100
TFC
TC
TVC
TotalCost
VariableCost
FixedCost
8-99
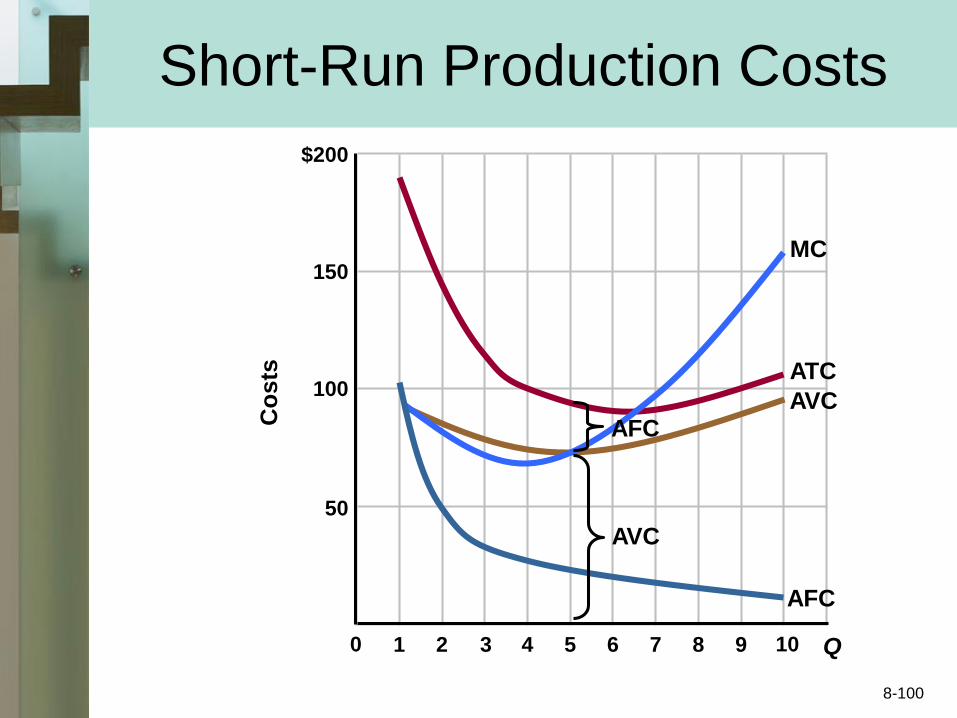
Short-Run Production Costs
Co
sts
1 2 3 4 5 6 7 8 9 100 Q
50
100
150
$200
AFC
MC
ATC
AVC
AVC
AFC
8-100

Production Relationships
• Marginal cost and diminishing returns
• Marginal cost and marginal product
• Marginal cost and average variable
cost
• Marginal cost and average total cost
• Production curves and cost curves
• Shifts in cost curves
8-101

Avera
ge P
rod
uct
an
d
Marg
inal
Pro
du
ct
Co
st
(Do
llars
)
Graphical Relationships
MP
AP
MCAVC
Quantity of Output
Quantity of Labor
Production Curves
Cost Curves
8-102
Long-Run Production Costs
• Choose your plant size
• Minimize ATC
• Different ATC curves
–Short run
• Long run ATC
–Envelope of short run ATC
8-103
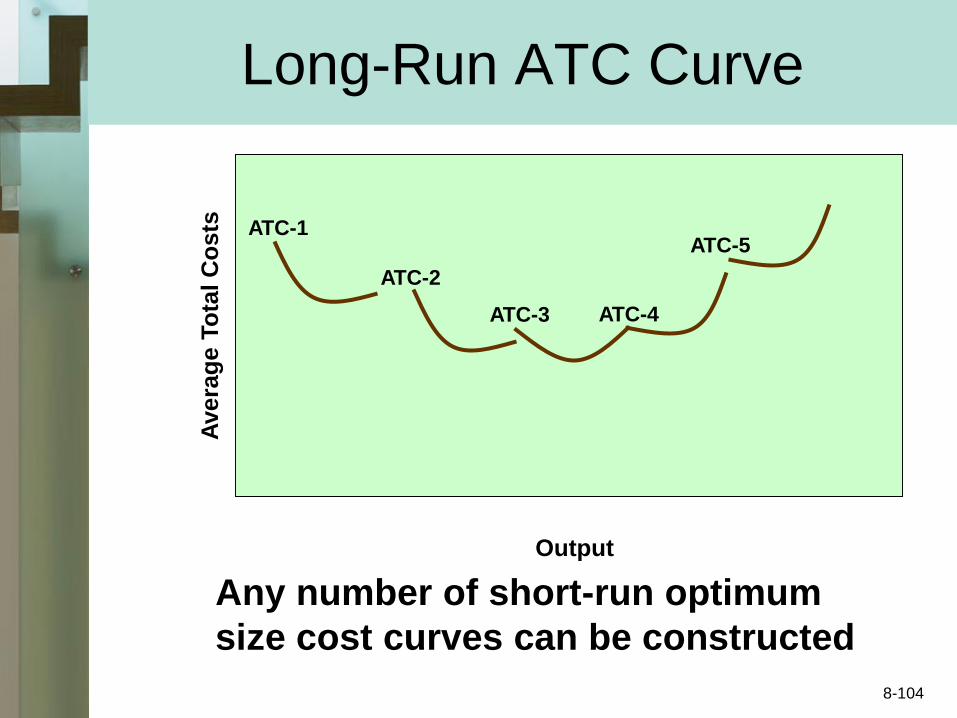
Long-Run ATC Curve
Ave
rag
e T
ota
l C
osts ATC-1
ATC-2
ATC-3 ATC-4
ATC-5
Output
Any number of short-run optimum
size cost curves can be constructed
8-104
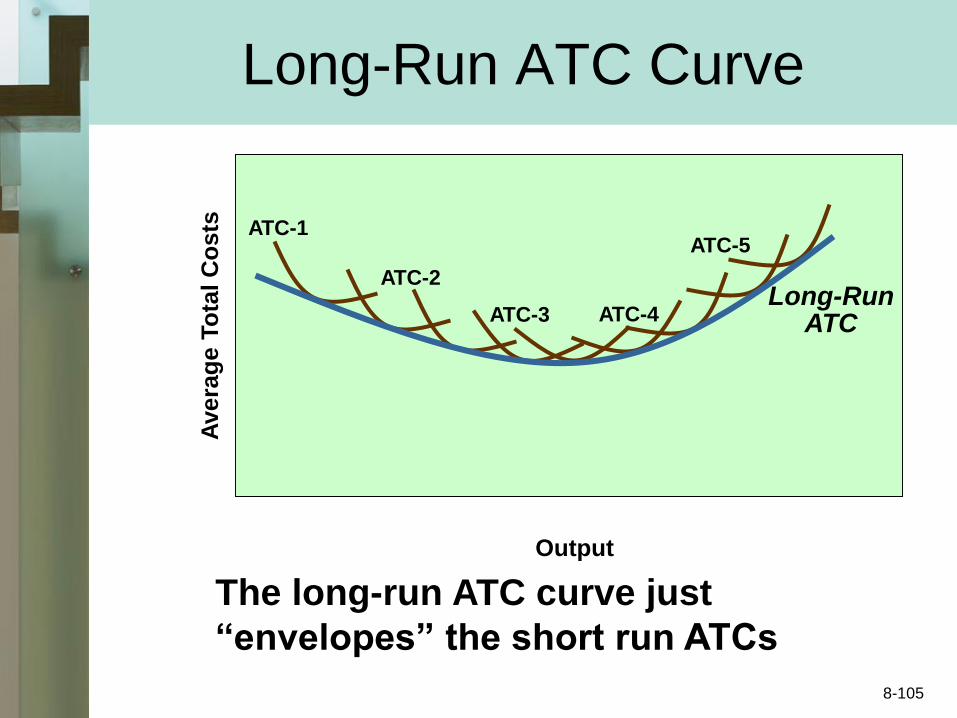
Long-Run ATC Curve
Long-RunATC
Ave
rag
e T
ota
l C
osts ATC-1
ATC-2
ATC-3 ATC-4
ATC-5
Output
The long-run ATC curve just
“envelopes” the short run ATCs
8-105

Long-Run ATC Shapes
Output
Long-run ATC curve where economies
of scale exist
Ave
rag
e T
ota
l C
osts
Long-RunATC
Economies
Of Scale
Constant Returns
To Scale
Diseconomies
Of Scale
q1 q2
8-106
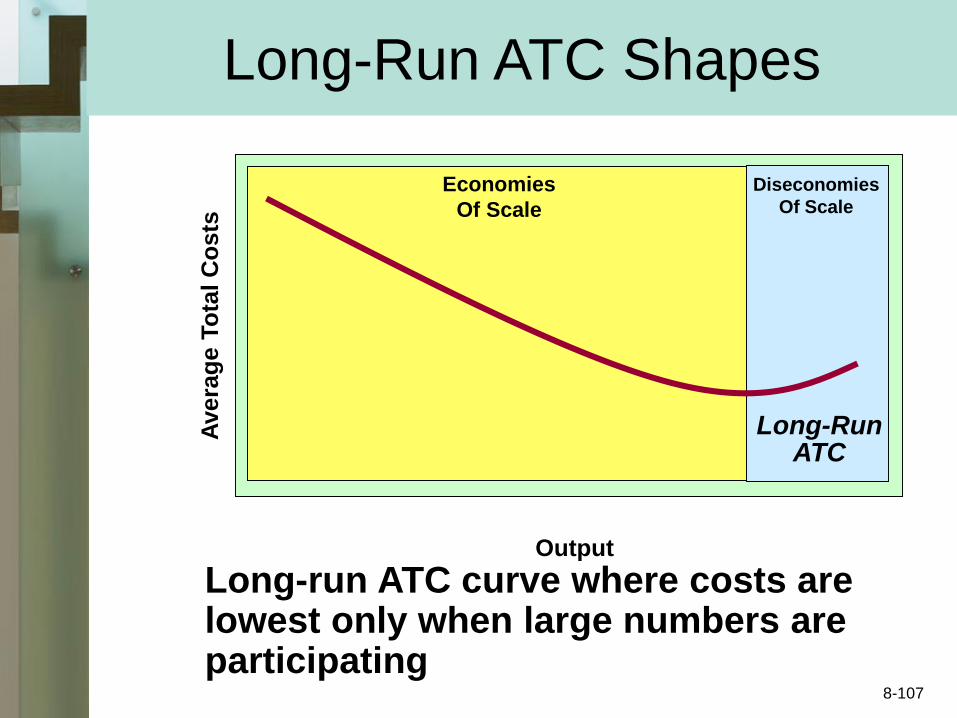
Output
Long-run ATC curve where costs arelowest only when large numbers areparticipating
Ave
rag
e T
ota
l C
osts
Economies
Of Scale
Diseconomies
Of Scale
Long-RunATC
Long-Run ATC Shapes
8-107
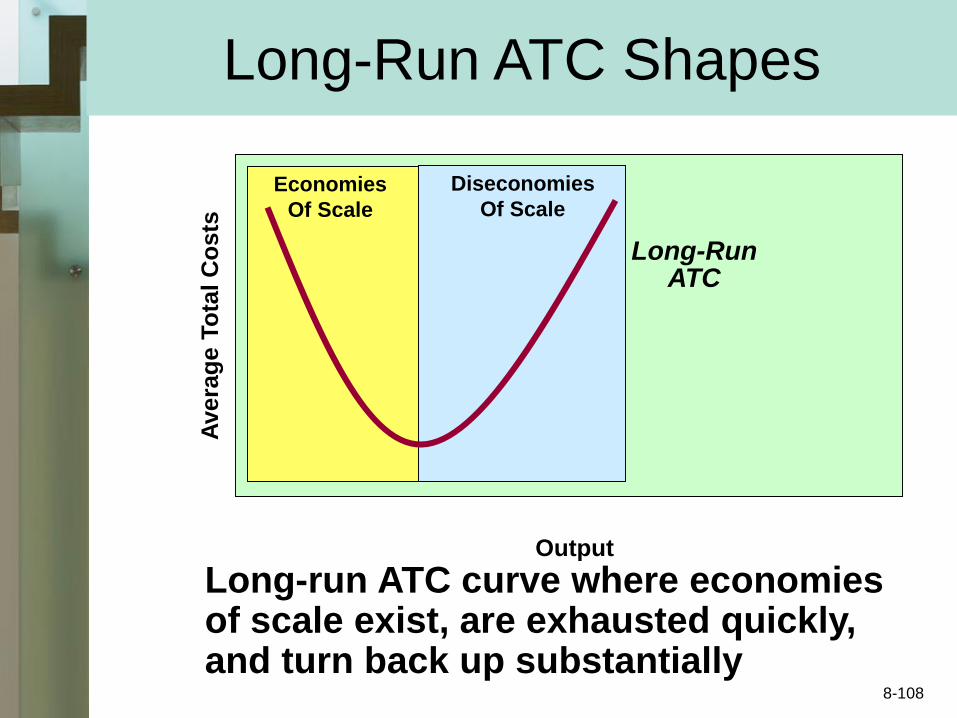
Output
Long-run ATC curve where economiesof scale exist, are exhausted quickly,and turn back up substantially
Ave
rag
e T
ota
l C
osts
Long-RunATC
Economies
Of Scale
Diseconomies
Of Scale
Long-Run ATC Shapes
8-108
Key Terms
• economic (opportunity) cost
• explicit costs
• implicit costs
• normal profit
• economic profit
• short run
• long run
• total product (TP)
• marginal product (MP)
• average product (AP)
• law of diminishing returns
• fixed costs
• variable costs
• total cost
• average fixed cost (AFC)
• average variable cost (AVC)
• average total cost (ATC)
• marginal cost (MC)
• economies of scale
• diseconomies of scale
• constant returns to scale
• minimum efficient scale (MES)
• natural monopoly
8-109

Next Chapter Preview…
PureCompetition
8-110

Pure
Competition
Chapter 9
Chapter Objectives
• The four basic market models• Conditions for pure competition• Profit maximization for
competitive firms• The competitive firm supply
curve• Industry entry and exit• Industry cost structure• Economic efficiency
9-112
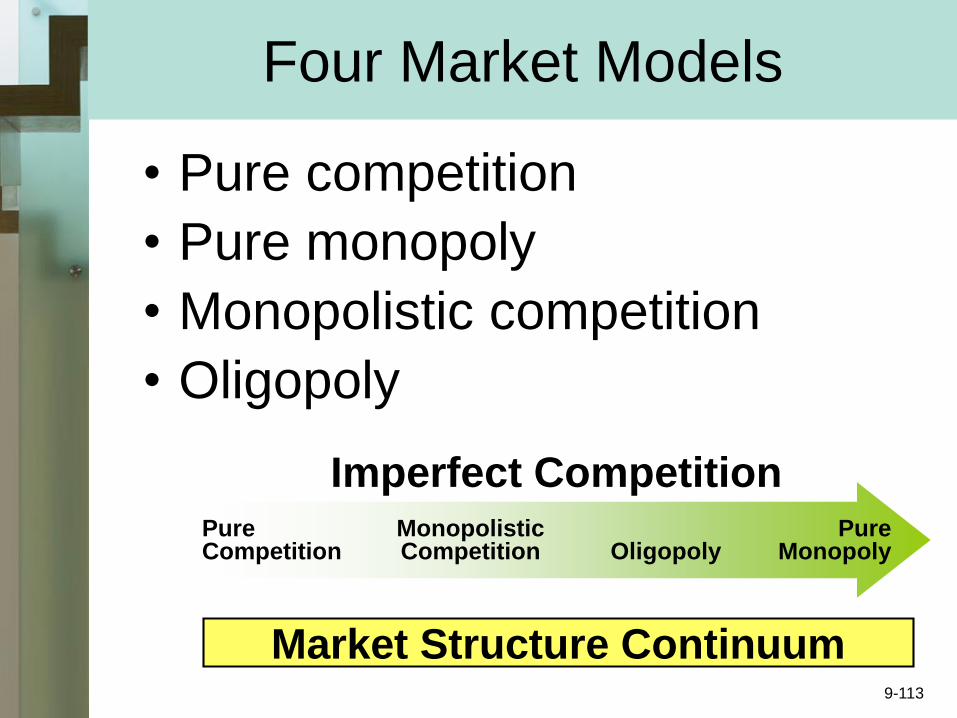
Four Market Models
• Pure competition
• Pure monopoly
• Monopolistic competition
• Oligopoly
Market Structure Continuum
PureCompetition
MonopolisticCompetition Oligopoly
PureMonopoly
Imperfect Competition
9-113

Pure Competition
• Very large numbers
• Standardized product
• “Price takers”
• Free entry and exit
• Perfectly elastic demand
–Average revenue
–Marginal revenue
–Price 9-114

Firm’sDemandSchedule(AverageRevenue)
Firm’sRevenue
Data
Pure Competition
Pri
ce a
nd
Reven
ue
2 4 6 8 10 12
131
262
393
524
655
786
917
1048
$1179
Quantity Demanded (Sold)
D = MR = AR
TR
P QD TR MR
$131
131
131
131
131
131
131
131
131
131
131
0
1
2
3
4
5
6
7
8
9
10
$0
131
262
393
524
655
786
917
1048
1179
1310
$131
131
131
131
131
131
131
131
131
131
]
]]]]
]
]
]
]
]
9-115
Short Run Profit Maximization
• Market price is given
• Three questions:
–Should the product be produced?
–If so, in what amount?
–What economic profit (loss) will
be realized?
9-116
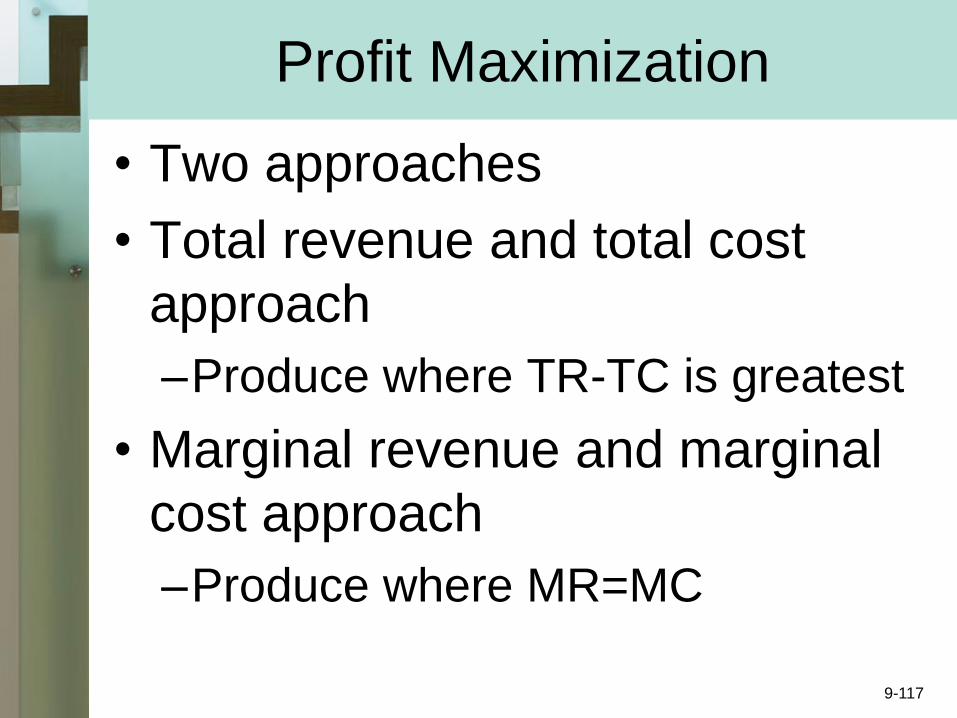
Profit Maximization
• Two approaches
• Total revenue and total cost
approach
–Produce where TR-TC is greatest
• Marginal revenue and marginal
cost approach
–Produce where MR=MC
9-117
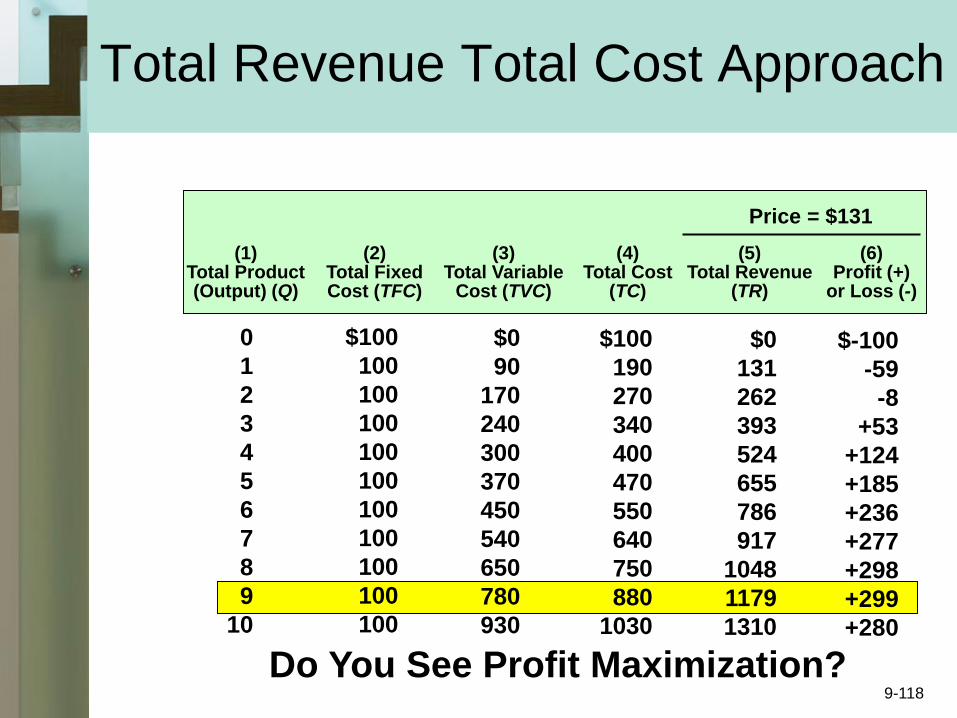
Total Revenue Total Cost Approach
(1)Total Product(Output) (Q)
(2)Total FixedCost (TFC)
(3)Total Variable
Cost (TVC)
(4)Total Cost
(TC)
(5)Total Revenue
(TR)
(6)Profit (+)
or Loss (-)
Price = $131
0
1
2
3
4
5
6
7
8
9
10
$100
100
100
100
100
100
100
100
100
100
100
$0
90
170
240
300
370
450
540
650
780
930
$100
190
270
340
400
470
550
640
750
880
1030
$0
131
262
393
524
655
786
917
1048
1179
1310
$-100
-59
-8
+53
+124
+185
+236
+277
+298
+299
+280
Now Let’s Graph The Results…Do You See Profit Maximization?9-118
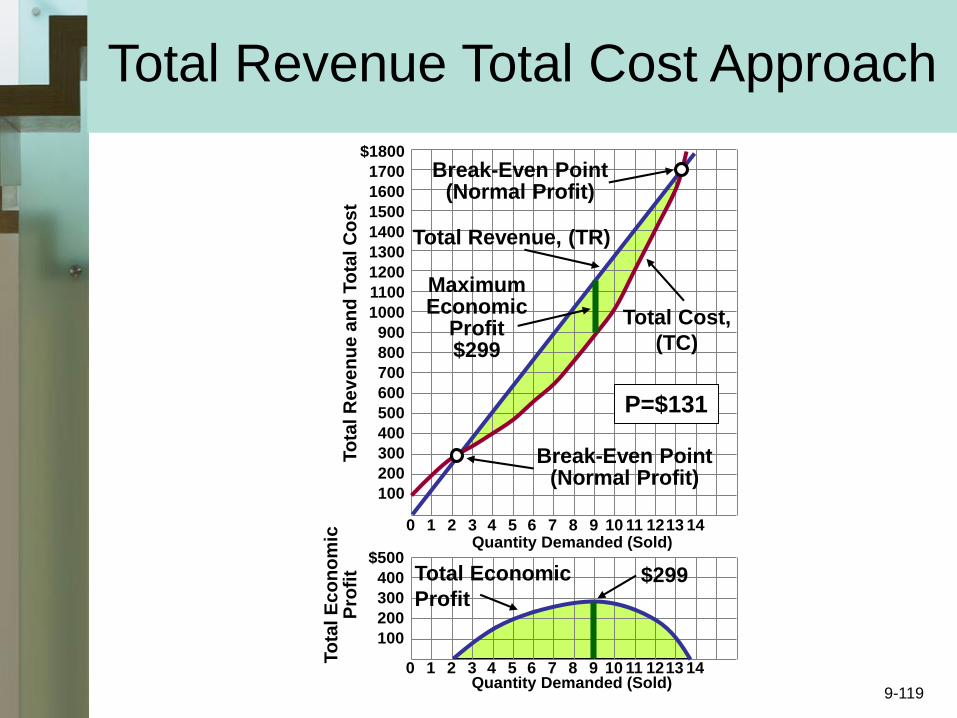
10 2 3 4 5 6 7 8 9 10 11 1213 14
10 2 3 4 5 6 7 8 9 10 11 1213 14
$1800
1700
1600
1500
1400
1300
1200
1100
1000
900
800
700
600
500
400
300
200
100
$500
400
300
200
100
To
tal R
eve
nu
e a
nd
To
tal C
os
tTo
tal E
co
no
mic
Pro
fit
Quantity Demanded (Sold)
Quantity Demanded (Sold)
Total Revenue, (TR)
Break-Even Point(Normal Profit)
Break-Even Point(Normal Profit)
MaximumEconomic
Profit$299
Total Economic
Profit$299
P=$131
Total Cost,
(TC)
Total Revenue Total Cost Approach
9-119
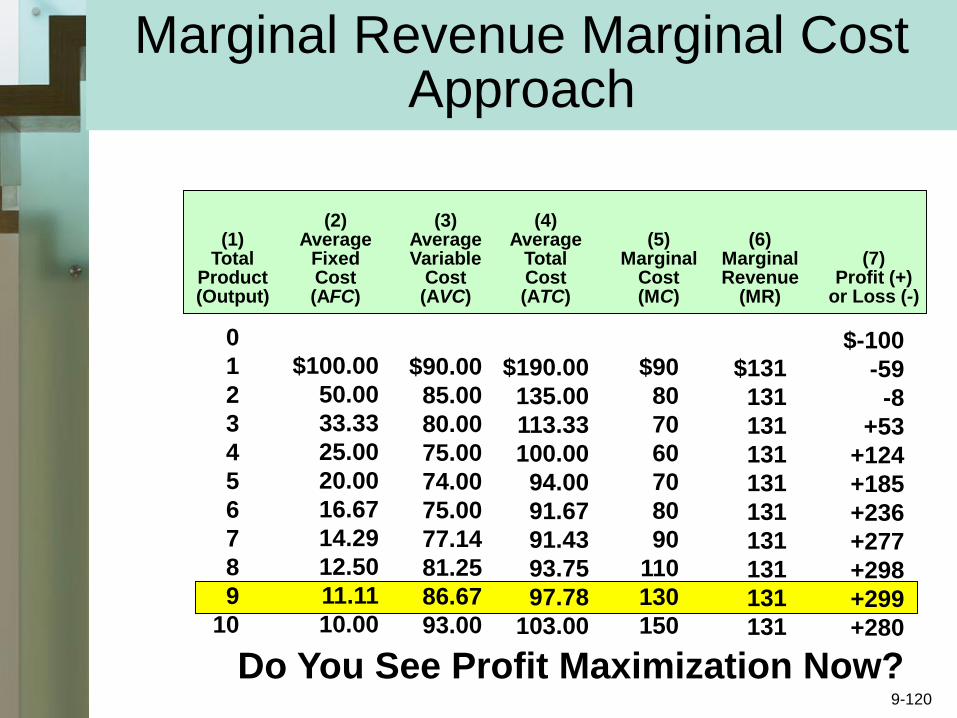
Marginal Revenue Marginal Cost Approach
(1)Total
Product(Output)
(2)Average
FixedCost(AFC)
(3)AverageVariable
Cost(AVC)
(4)Average
TotalCost(ATC)
(6)MarginalRevenue
(MR)
(7)Profit (+)
or Loss (-)
0
1
2
3
4
5
6
7
8
9
10
$100.00
50.00
33.33
25.00
20.00
16.67
14.29
12.50
11.11
10.00
$90.00
85.00
80.00
75.00
74.00
75.00
77.14
81.25
86.67
93.00
$190.00
135.00
113.33
100.00
94.00
91.67
91.43
93.75
97.78
103.00
$131
131
131
131
131
131
131
131
131
131
$-100
-59
-8
+53
+124
+185
+236
+277
+298
+299
+280
No Surprise - Now Let’s Graph It…Do You See Profit Maximization Now?
(5)Marginal
Cost(MC)
$90
80
70
60
70
80
90
110
130
150
9-120

Co
st
an
d R
even
ue
$200
150
100
50
01 2 3 4 5 6 7 8 9 10
Output
Economic Profit MR = P
MCMR = MC
AVC
ATC
P=$131
A=$97.78
Marginal Revenue Marginal Cost Approach
9-121

Short Run Profit Maximization
• Produce where MR (=P) = MC
• Suffer loss, still produce?
• Yes if loss is less than fixed cost
–Cover variable cost
• Shut down if loss greater than
fixed cost
• Produce if P > min AVC9-122
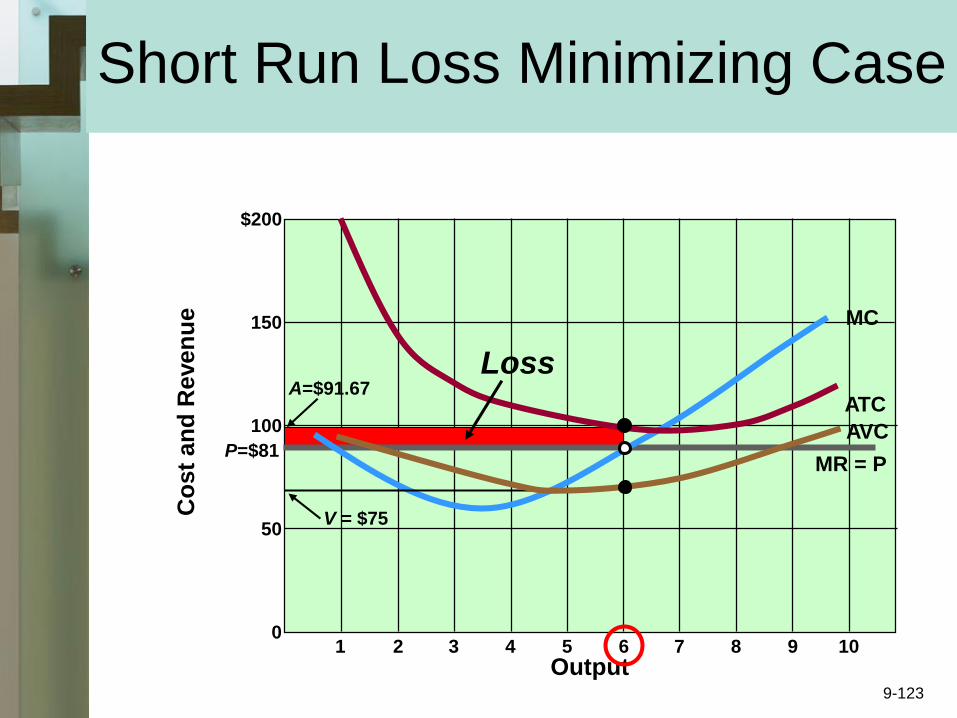
Lower the Price to $81 and
Observe the Results!
Co
st
an
d R
even
ue
$200
150
100
50
01 2 3 4 5 6 7 8 9 10
Output
Loss
Short Run Loss Minimizing Case
MR = P
MC
AVC
ATC
P=$81
A=$91.67
V = $75
9-123

Lower the Price Further to
$71 and Observe the Results!
Co
st
an
d R
even
ue
$200
150
100
50
01 2 3 4 5 6 7 8 9 10
Output
Short Run Shut Down Case
MR = P
MC
AVC
ATC
P=$71
Short-Run Shut Down PointP < Minimum AVC
$71 < $74
V = $74
9-124
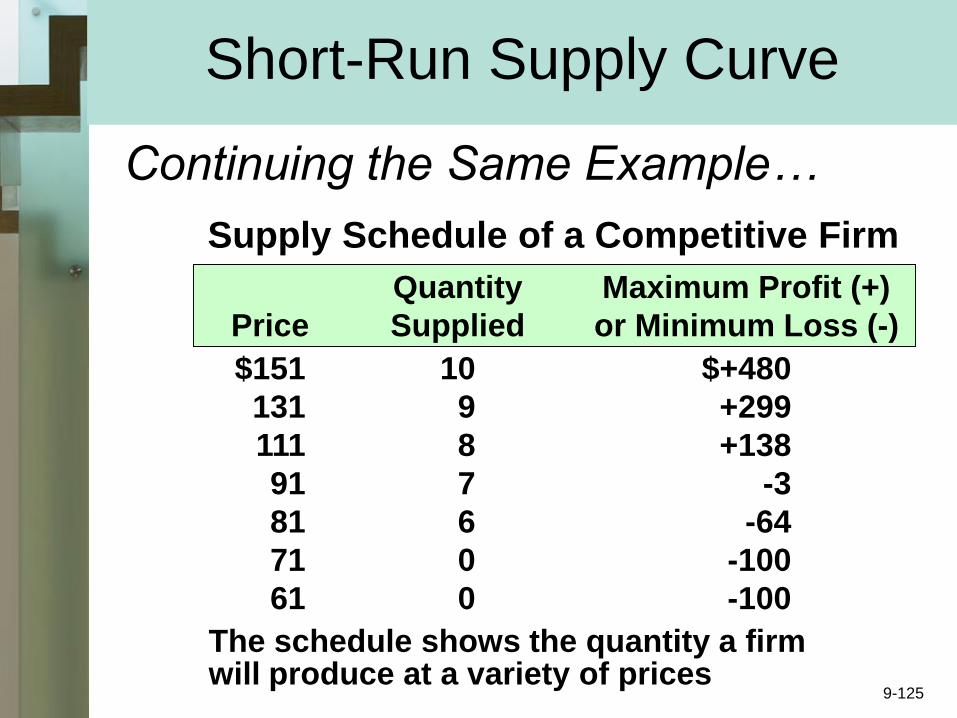
Short-Run Supply Curve
Continuing the Same Example…
Supply Schedule of a Competitive Firm
Price
Quantity
Supplied
Maximum Profit (+)
or Minimum Loss (-)
$151
131
111
91
81
71
61
10
9
8
7
6
0
0
$+480
+299
+138
-3
-64
-100
-100
The schedule shows the quantity a firmwill produce at a variety of prices
9-125

Short-Run Supply Curve
Firms produce where MR=MC
P1
0
Co
st
an
d R
even
ues (
Do
llars
)
Quantity Supplied
MR1
P2 MR2
P3 MR3
P4 MR4
P5 MR5
MC
AVC
ATC
Q2 Q3 Q4 Q5
This Price is Below AVCAnd Will Not Be Produced
a
b
c
d
e
9-126

Short-Run Supply Curve
P1
0
Co
st
an
d R
even
ues (
Do
llars
)
Quantity Supplied
MR1
P2 MR2
P3 MR3
P4 MR4
P5 MR5
MC
AVC
ATC
Q2 Q3 Q4 Q5
a
b
c
d
e
MC Above AVC Becomesthe Short-Run Supply Curve S
Examine the MC for the Competitive Firm
Break-even(Normal Profit) Point
Shut-Down Point (If P is Below)
Firms produce where MR=MC
9-127
Firm and Industry Supply
• Changes in firm supply
–Shifts in marginal cost
–Input price or technology
• The industry (total) supply curve
–Sum of individual supply
• Industry supply and demand
–Determine market price
9-128

Single Firm Industryp P
p P0 0
Firm and Industry Supply
Economic
Profit
d
ATC
AVC
s = MC
$111 $111
D
S = ∑ MC’s
8 8000
Competitive firm must take the price that isEstablished by industry supply and demand
9-129
Long Run Profit Maximization
• Assumptions
–Entry and exit only
–Identical costs
–Constant-cost industry
• Goal of the analysis
–In the long run, P = min ATC
–Entry eliminates profits
–Exit eliminates losses9-130
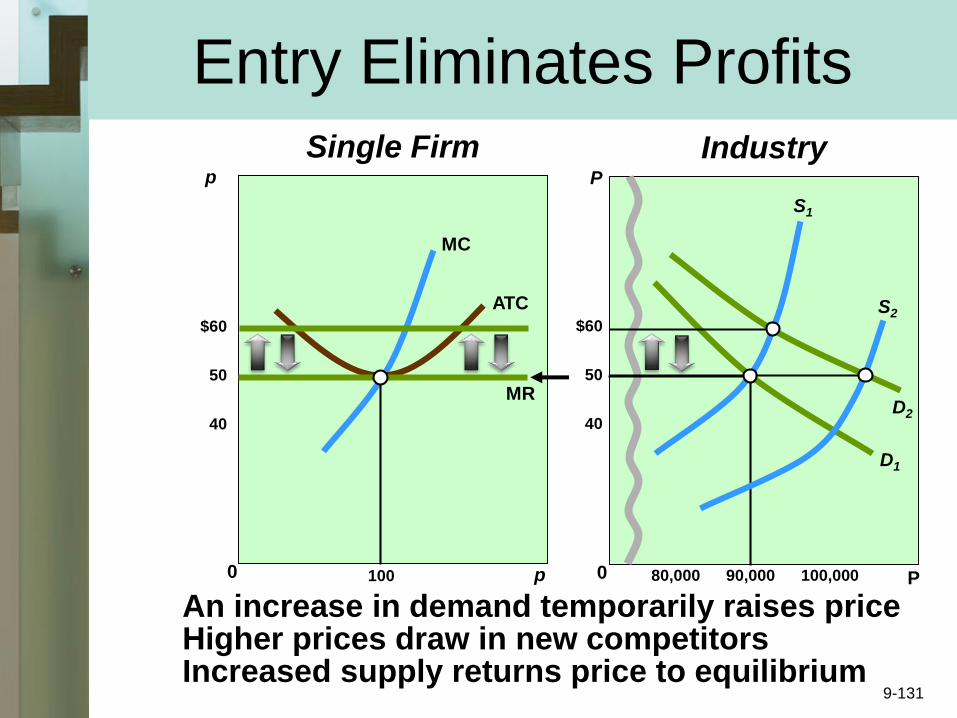
Single Firm Industryp P
p P0 0100 90,00080,000 100,000
Entry Eliminates Profits
ATC
MR
MC
$60
50
40
D1
S1
An increase in demand temporarily raises priceHigher prices draw in new competitorsIncreased supply returns price to equilibrium
D2
$60
50
40
S2
9-131
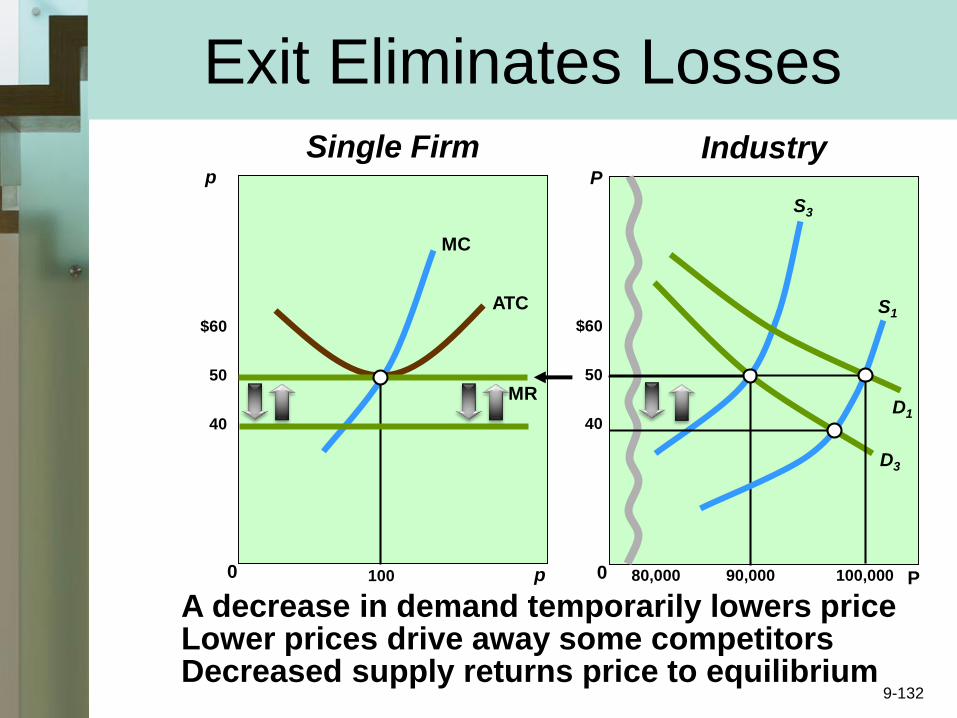
Single Firm Industryp P
p P0 0100 90,00080,000 100,000
Exit Eliminates Losses
ATC
MR
MC
$60
50
40
D3
S3
A decrease in demand temporarily lowers priceLower prices drive away some competitorsDecreased supply returns price to equilibrium
D1
$60
50
40
S1
9-132
Pure Competition and Efficiency
• Productive efficiency
P = minimum ATC
• Allocative efficiency
P = MC
• Maximum consumer and producer surplus
• Dynamic adjustments
• “Invisible Hand” revisited 9-133

Key Terms
• pure competition• pure monopoly• monopolistic
competition• oligopoly• imperfect
competition• price taker• average revenue• total revenue• marginal revenue• break-even point• MR=MC rule• short-run supply
curve
• long-run supply curve
• constant-cost industry
• increasing-cost industry
• decreasing-cost industry
• productive efficiency
• allocative efficiency• consumer surplus• producer surplus
9-134

Next Chapter Preview…
PureMonopoly
9-135

Pure Monopoly
Chapter 10

Chapter Objectives
• Characteristics of pure
monopoly
• Profit-maximizing output and
price
• Economic effects of monopoly
• Charging different prices in
different markets
10-137
Characteristics of Monopoly
• Single seller
• No close substitutes
• “Price maker”
• Blocked entry
• Nonprice competition
10-138

Examples of Monopoly
• Regulated or natural monopolies–electricity
• Near monopolies–Western Union–Frisbee–De Beers
• Geographic monopolies–Professional sport teams
• Dual objectives of study
10-139

Barriers to Entry
• Economies of scale
• Legal barriers to entry
–Patents
–Licenses
• Ownership or control of
essential resources
• Pricing and other strategic
barriers to entry10-140
Monopoly Demand
• Assumptions:
–Monopoly status is secure
–No government regulation
–Single-price monopolist
• Face down-sloping demand
–Entire market demand
10-141

0 1 2 3 4 5 6
$142
132
122
112
102
92
82
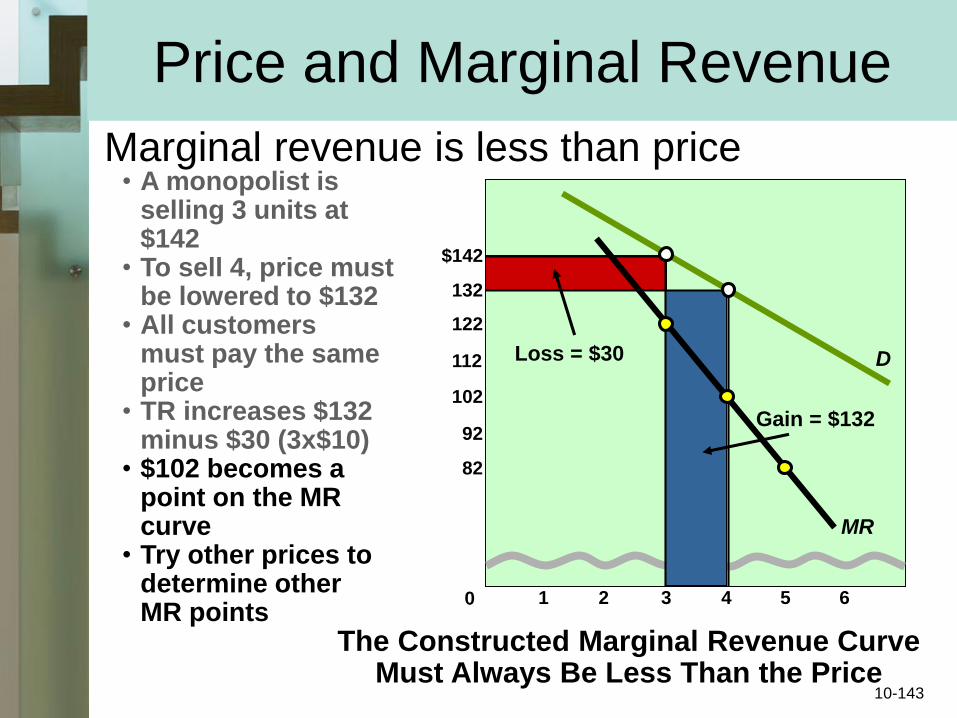
Price and Marginal Revenue
Marginal revenue is less than price
D
• A monopolist isselling 3 units at$142
• To sell 4, price mustbe lowered to $132
• All customers must pay the sameprice
• TR increases $132 minus $30 (3x$10)
Gain = $132
Loss = $30
10-142
0 1 2 3 4 5 6
$142
132
122
112
102
92
82
D
• A monopolist isselling 3 units at$142
• To sell 4, price mustbe lowered to $132
• All customers must pay the sameprice
• TR increases $132 minus $30 (3x$10)
• $102 becomes a point on the MR curve
• Try other prices todetermine other MR points
Gain = $132
Loss = $30
The Constructed Marginal Revenue CurveMust Always Be Less Than the Price
MR
Price and Marginal Revenue
Marginal revenue is less than price
10-143
Down-Sloping Demand
• Marginal revenue < price
–To increase sales, must lower price
• Firm is a price maker
–Choose P,Q combination
• Operate in the elastic region
–Marginal revenue > 0
–Total-revenue test (recall)
10-144
Profit Maximization
• Output-price determination
–Marginal revenue marginal cost
rule
–Same cost definitions
• No supply curve
10-145
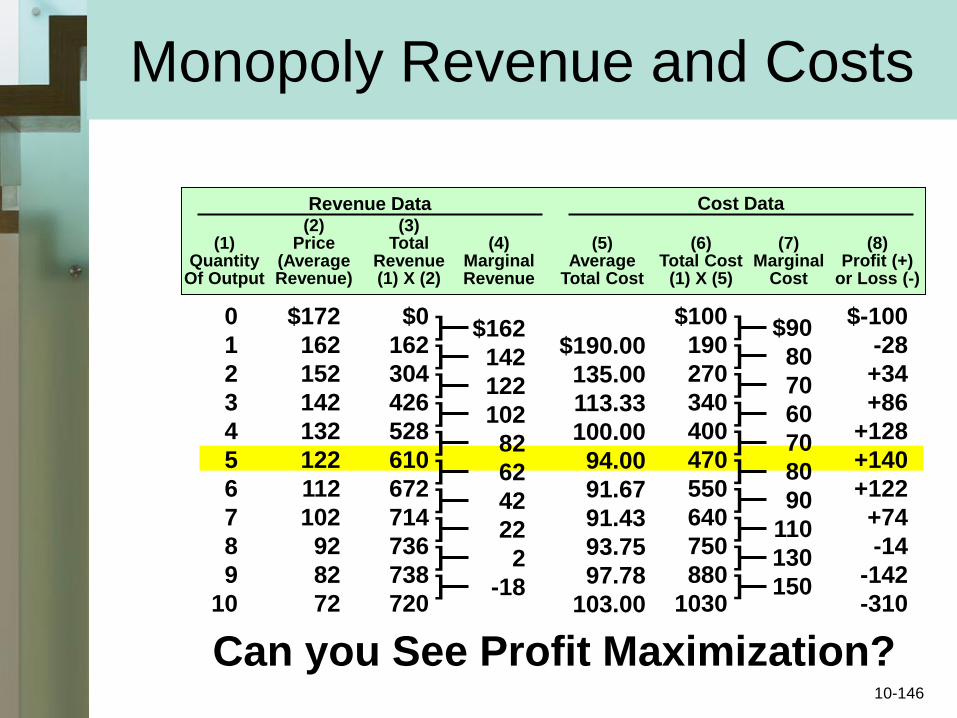
Monopoly Revenue and Costs
(1)Quantity
Of Output
(2)Price
(AverageRevenue)
(3)Total
Revenue(1) X (2)
(4)MarginalRevenue
(5)Average
Total Cost
(6)Total Cost
(1) X (5)
(7)Marginal
Cost
(8)Profit (+)
or Loss (-)
0
1
2
3
4
5
6
7
8
9
10
$172
162
152
142
132
122
112
102
92
82
72
$0
162
304
426
528
610
672
714
736
738
720
$162
142
122
102
82
62
42
22
2
-18
$190.00
135.00
113.33
100.00
94.00
91.67
91.43
93.75
97.78
103.00
$100
190
270
340
400
470
550
640
750
880
1030
$90
80
70
60
70
80
90
110
130
150
$-100
-28
+34
+86
+128
+140
+122
+74
-14
-142
-310
Revenue Data Cost Data
]]]]]]]]]]
]]]]]]]]]]
Can you See Profit Maximization?10-146

$200
150
100
50
0
$750
500
250
0
2 4 6 8 10 12 14 16 18
2 4 6 8 10 12 14 16 18
Pri
ce
To
tal
Reven
ue
Monopoly Revenue and Costs
Elastic InelasticDemand and Marginal-Revenue Curves
Total-Revenue Curve
DMR
TR
10-147

Profit Maximization
0
$200
175
150
125
25
100
75
50
Pri
ce,
Co
sts
, an
d R
even
ue
1 2 3 4 5 6 7 8 9 10
Quantity
D
MR
ATC
MC
MR=MC
Pm=$122
A=$94
EconomicProfit
10-148
Misconceptions
• Not the highest price
• Total, not unit, profit
• Possibility of losses
10-149
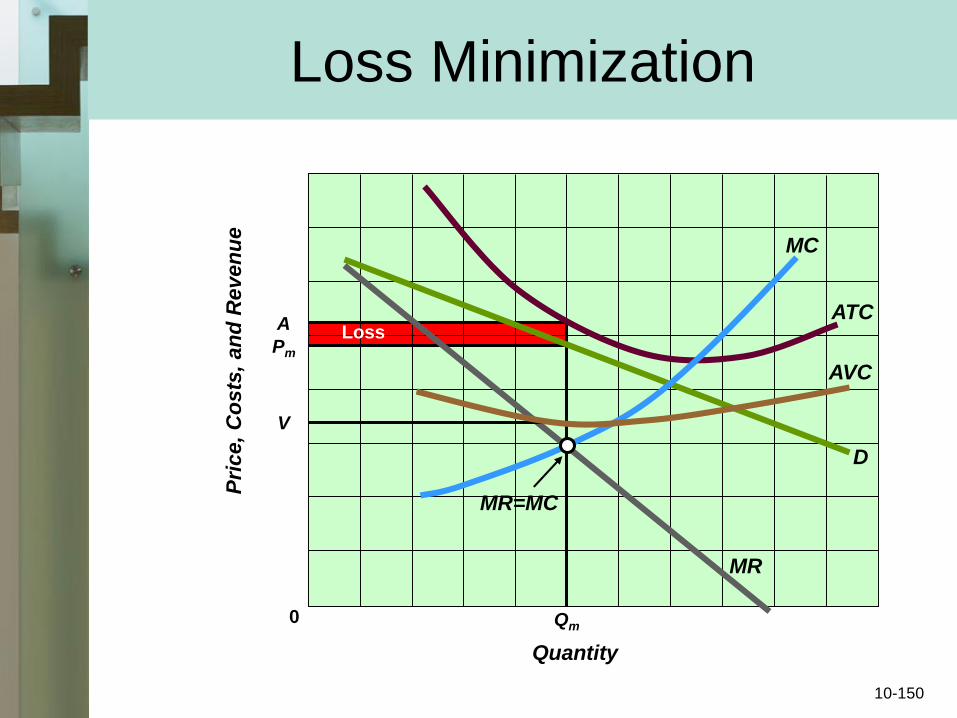
Loss Minimization
0
Pri
ce,
Co
sts
, an
d R
even
ue
Quantity
D
MR
ATC
MC
MR=MC
Loss
AVC
Pm
Qm
V
A
10-150
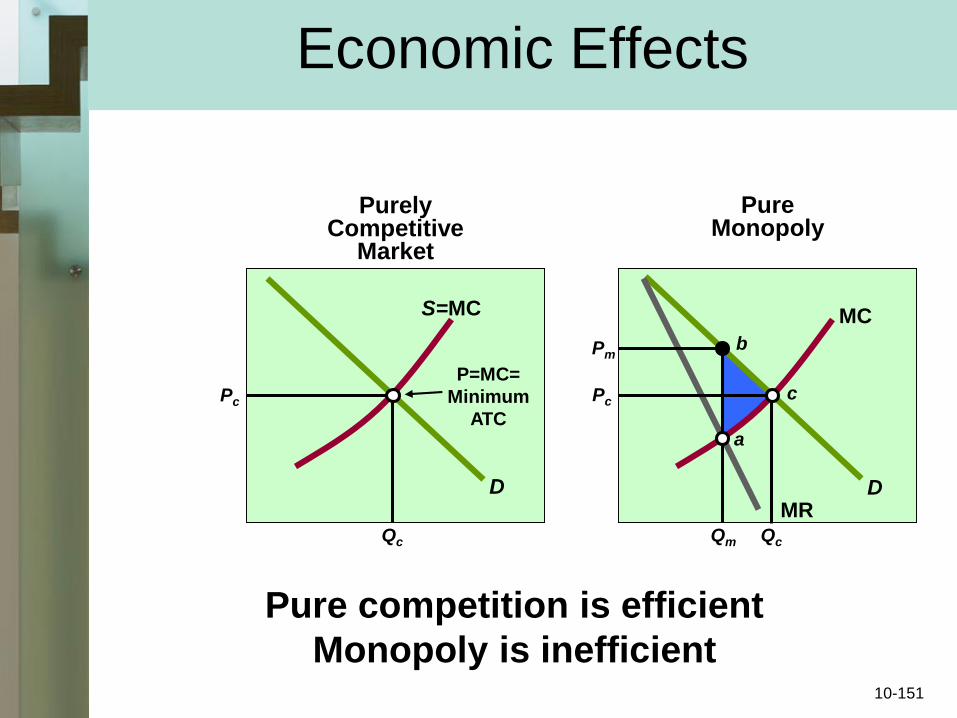
Economic Effects
PurelyCompetitive
Market
PureMonopoly
D D
S=MC MC
P=MC=
Minimum
ATC
MR
Pc
Qc
Pc
Pm
QcQm
Pure competition is efficient
Monopoly is inefficient
a
b
c
10-151
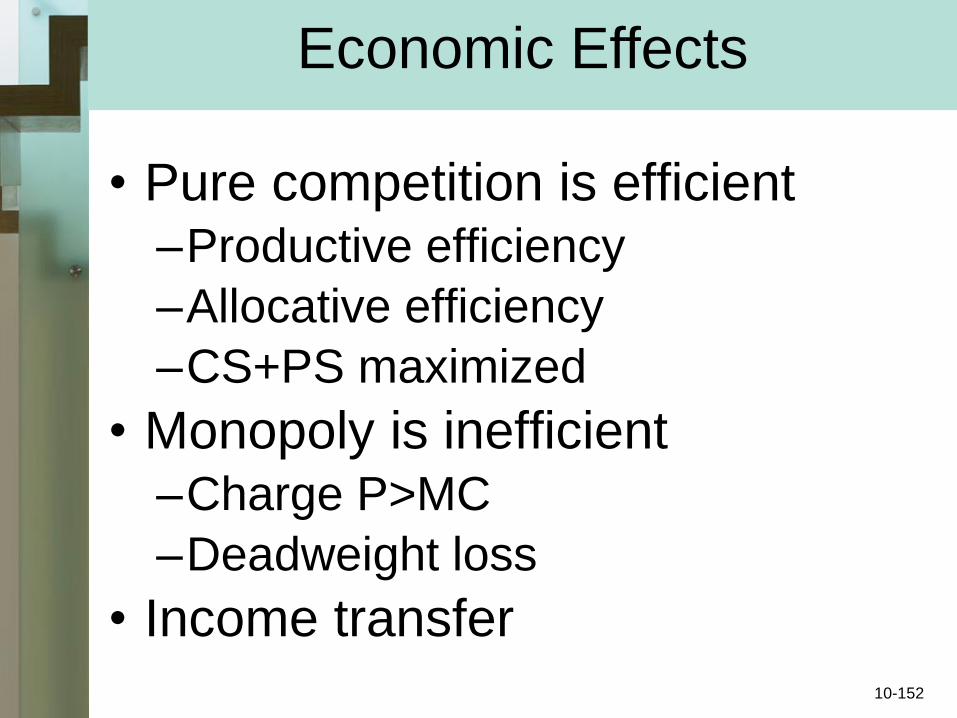
• Pure competition is efficient–Productive efficiency
–Allocative efficiency
–CS+PS maximized
• Monopoly is inefficient–Charge P>MC
–Deadweight loss
• Income transfer
Economic Effects
10-152

Price Discrimination
• Three forms– Charge each customer max
willingness to pay
– Charge one price for first unit and a lower price for subsequent units
– Charge different customers different prices
10-153
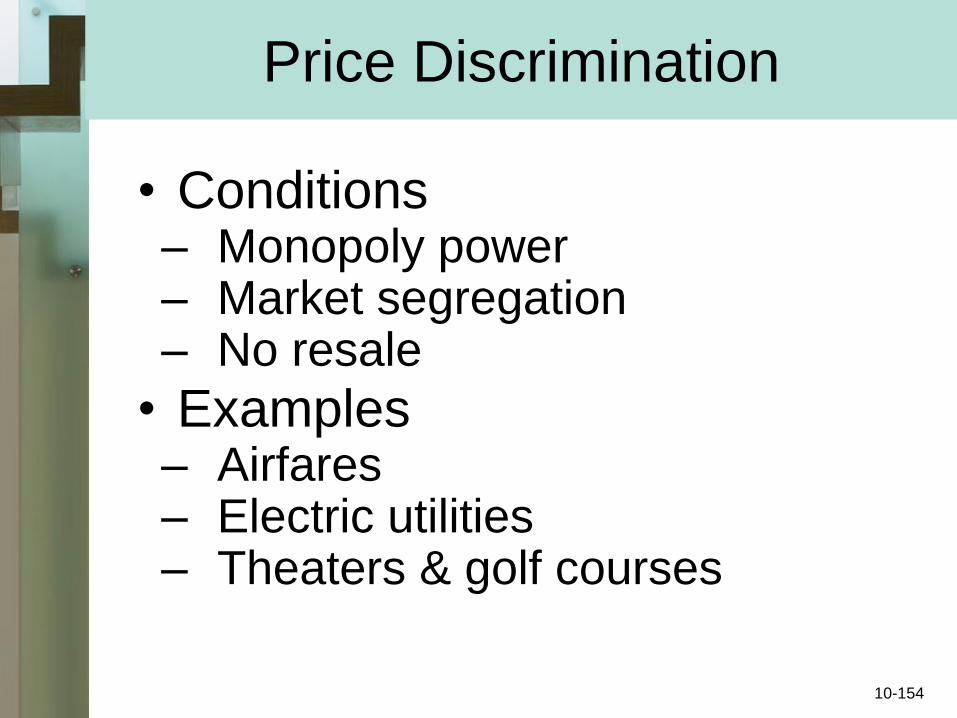
• Conditions– Monopoly power– Market segregation– No resale
• Examples– Airfares– Electric utilities– Theaters & golf courses
Price Discrimination
10-154
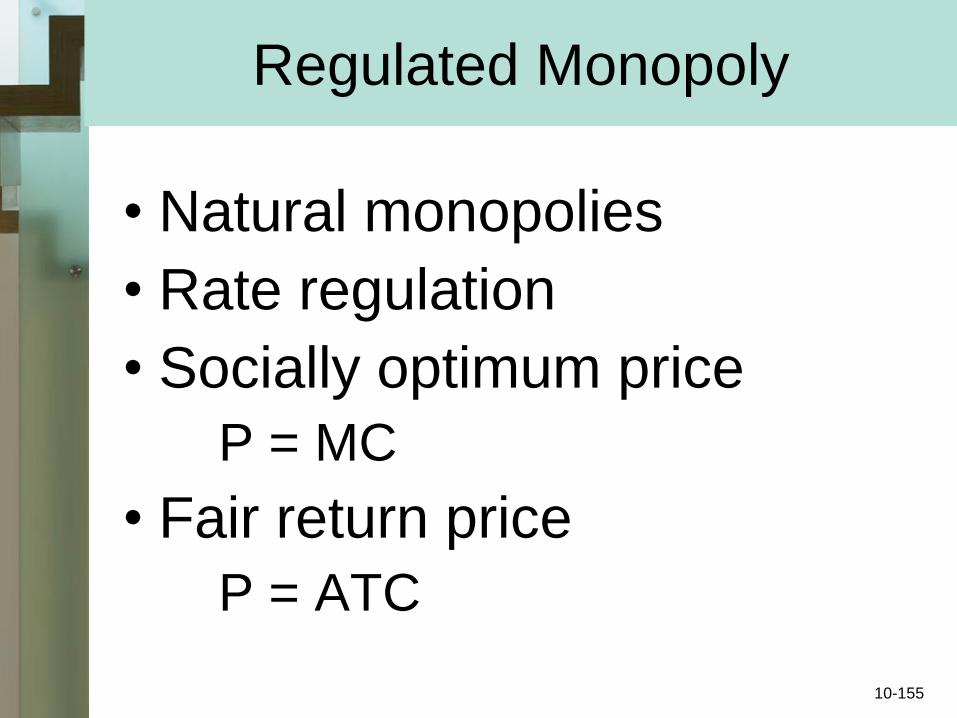
Regulated Monopoly
• Natural monopolies
• Rate regulation
• Socially optimum price
P = MC
• Fair return price
P = ATC
10-155

0
Pri
ce a
nd
Co
sts
(D
ollars
)
Quantity
Dilemma of Regulation
MonopolyPrice
Fair-ReturnPrice
SociallyOptimal
Price
Pr
D
r
f
b
aPf
Pm
Qm Qf Qr
MR
MC
ATC
Regulated Monopoly
10-156

Key Terms
• pure monopoly
• barriers to entry
• simultaneous consumption
• network effects
• X-inefficiency
• rent-seeking behavior
• price discrimination
• socially optimal price
• fair-return price10-157

Next Chapter Preview…
Monopolistic Competitionand Oligopoly
10-158

Monopolistic Competition and Oligopoly
Chapter 11
McGraw-Hill/Irwin Copyright © 2009 by The McGraw-Hill Companies, Inc. All rights reserved.

Chapter Objectives
• Characteristics of monopolistic competition
• Normal profit in the long run
• Characteristics of oligopoly
• Game theory
• The oligopolist’s kinked demand curve
• Collusion among oligopolists
• The effects of advertising
11-160

Monopolistic Competition
• Large number of sellers–Small market shares
–No collusion
–Independent action
• Differentiated Products–Product attributes
–Service
–Location
–Brand names and packaging
–Some control over price 11-161
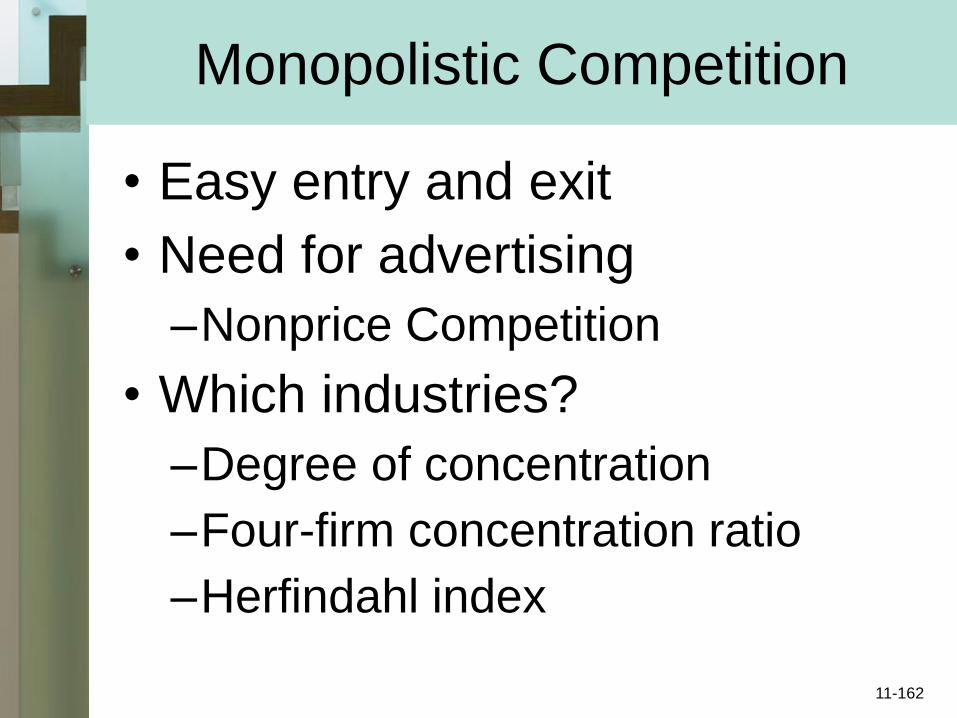
• Easy entry and exit
• Need for advertising
–Nonprice Competition
• Which industries?
–Degree of concentration
–Four-firm concentration ratio
–Herfindahl index
Monopolistic CompetitionMonopolistic Competition
11-162

• Firm’s demand curve–Highly elastic
• Short run profit or loss–Produce where MR=MC
• Long run normal profit–Entry and exit
• Inefficient• Product variety
Monopolistic Competition
11-163

Short-Run Profits
Quantity
Pri
ce
an
d C
os
ts
MR = MC
MC
MR
D1
ATC
Economic
Profit
Q1
A1
P1
0
Monopolistic Competition
11-164

Short-Run Losses
Quantity
Pri
ce
an
d C
os
ts
MR = MC
MC
MR
D2
ATC
Loss
Q2
A2
P2
0
Monopolistic Competition
11-165

Long-Run Equilibrium
Quantity
Pri
ce
an
d C
os
ts
MR = MC
MC
MR
D3
ATC
Q3
P3= A3
0
Monopolistic Competition
11-166

Quantity
Pri
ce
an
d C
os
ts
MR = MC
MC
MR
D3
ATC
Q30
P3= A3
P=MC=Min ATC for pure competition (recall)
P4
Q4
Price is Lower
Excess Capacity at
Minimum ATC
Monopolistic competition is not efficient
Monopolistic Competition
11-167

Oligopoly
• A few large producers
• Homogeneous or differentiated products
• Control over price–Mutual interdependence
–Strategic behavior
• Entry barriers
• Mergers
11-168

Three Oligopoly Models
• Kinked-demand curve
• Collusive pricing
• Price leadership
• Why three models?
–Diversity of oligopolies
–Complications of interdependence
11-169

Kinked-Demand Curve
• Noncollusive oligopoly
• Strategies
–Match price changes
–Ignore price changes
• Combined strategy
• Price inflexibility
• The kinked-demand curve
11-170
Pri
ce
Pri
ce
an
d C
os
tsQuantity Quantity
0 0
P0
MR2
D2
D1
MR1
e
f
g
Rivals IgnorePrice Increase
Rivals MatchPrice Decrease
Q0
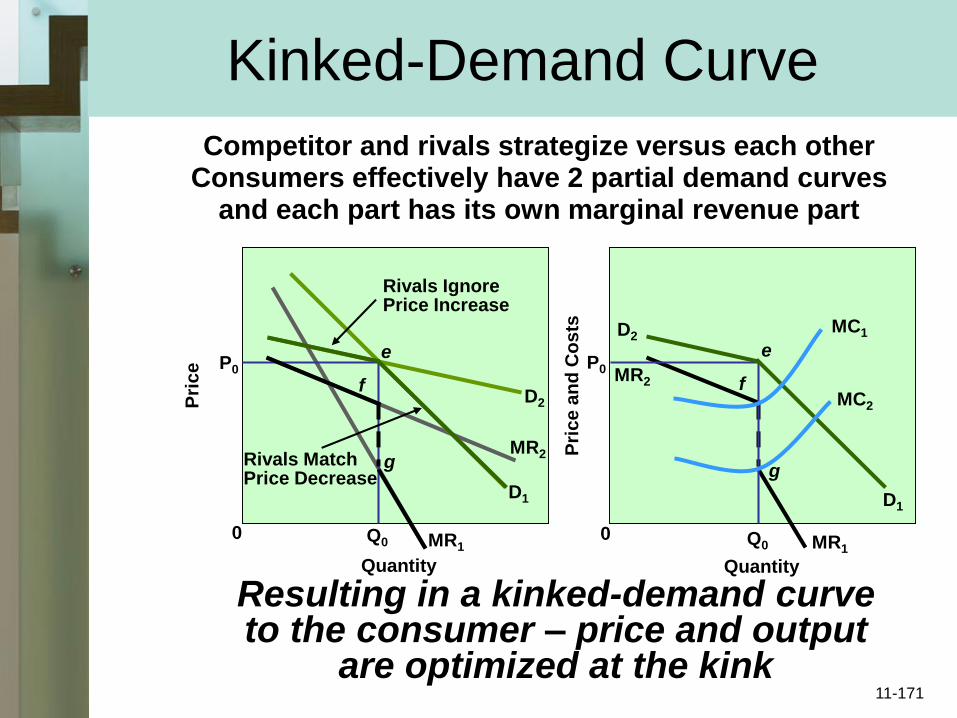
Competitor and rivals strategize versus each otherConsumers effectively have 2 partial demand curves
and each part has its own marginal revenue part
MR2
D2
D1
MR1Q0
MC1
MC2
P0
Resulting in a kinked-demand curve to the consumer – price and output
are optimized at the kink
e
f
g
Kinked-Demand Curve
11-171
Pri
ce a
nd
Co
sts
Quantity
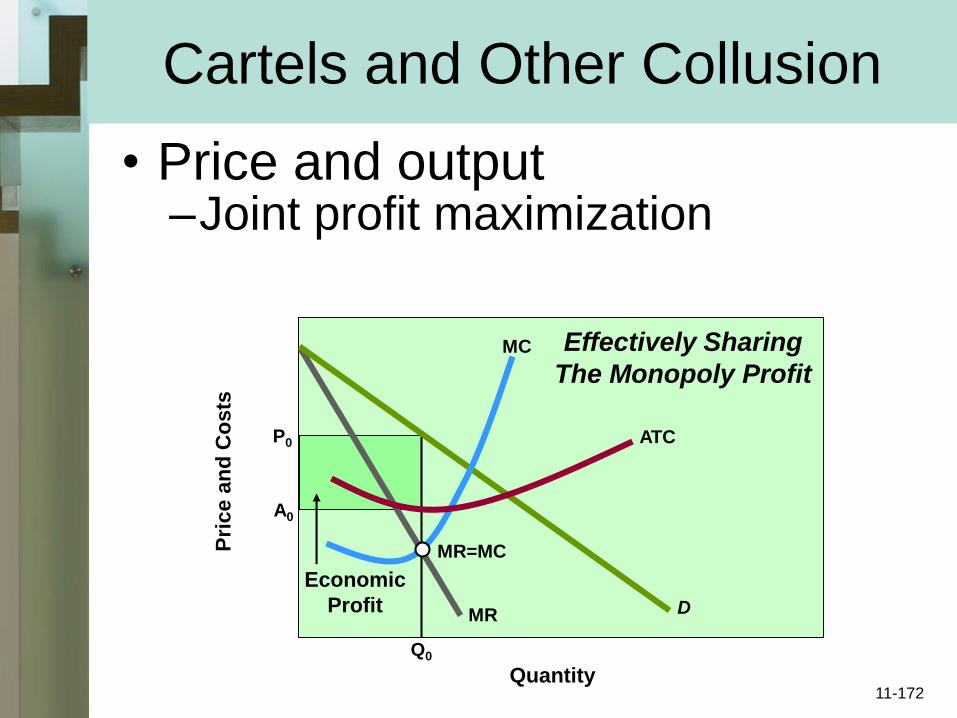
Cartels and Other Collusion
• Price and output–Joint profit maximization
D
MR=MC
ATC
MC
MR
P0
A0
Q0
Economic
Profit
Effectively Sharing
The Monopoly Profit
11-172

The OPEC Cartel
Source: A. T. Kearney, Foreign Policy
Iran 3,843,000Kuwait 2,538,000Venezuela 2,368,000Iraq 2,297,000
Nigeria 2,183,000UAE 2,117,000Angola 1,804,000Libya 1,737,000Algeria 1,417,000Qatar 848,000Indonesia 843,000Ecuador 530,000
Daily oil production (barrels) , November 2008
Saudi Arabia 8,904,000
11-173
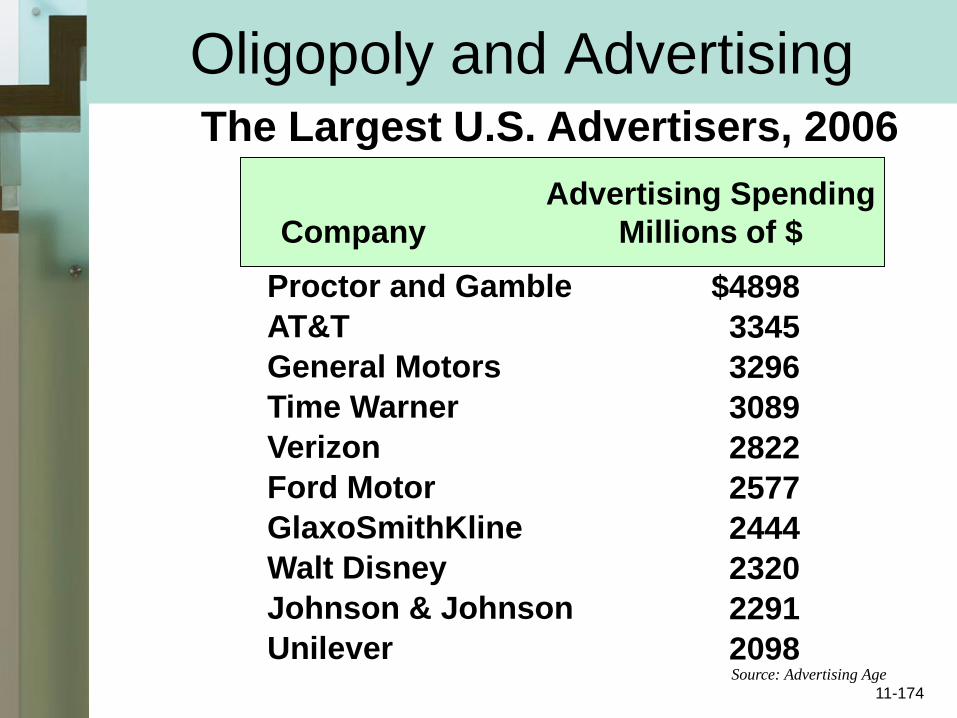
Oligopoly and AdvertisingThe Largest U.S. Advertisers, 2006
Company
Advertising Spending
Millions of $
Proctor and Gamble
AT&T
General Motors
Time Warner
Verizon
Ford Motor
GlaxoSmithKline
Walt Disney
Johnson & Johnson
Unilever
$4898
3345
3296
3089
2822
2577
2444
2320
2291
2098Source: Advertising Age
11-174

World’s Top 10 Brand Names, 2007
Source: Interbrand
Coca-Cola
Microsoft
IBM
General Electric
Nokia
Toyota
Intel
McDonald’s
Disney
Mercedes-Benz
Oligopoly and Advertising
11-175
Oligopoly and Efficiency
• Not productively efficient
• Not allocatively efficient
• Tendency to share the monopoly profit
• Qualifications–Increased foreign competition
–Limit pricing
–Technological advance
11-176
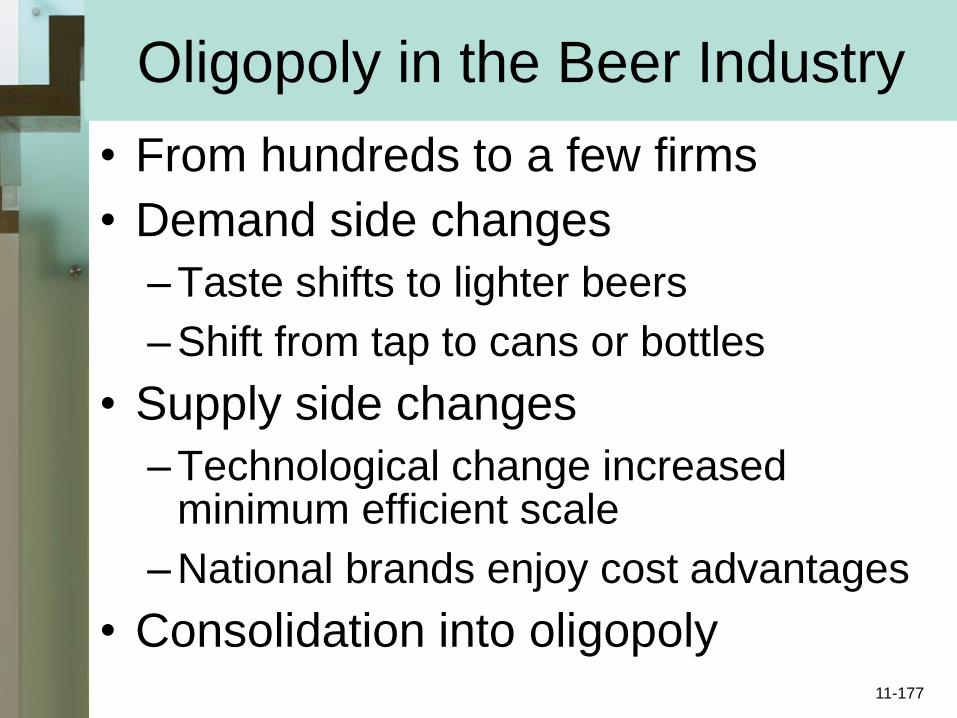
Oligopoly in the Beer Industry
• From hundreds to a few firms
• Demand side changes
– Taste shifts to lighter beers
– Shift from tap to cans or bottles
• Supply side changes
– Technological change increased minimum efficient scale
– National brands enjoy cost advantages
• Consolidation into oligopoly11-177

Key Terms
• monopolistic competition
• product differentiation
• nonprice competition
• four-firm concentration ratio
• Herfindahl index
• excess capacity
• oligopoly
• homogeneous oligopoly
• differentiated oligopoly
• strategic behavior
• mutual interdependence
• interindustry
competition
• import competition
• game theory
• collusion
• kinked-demand curve
• price war
• cartel
• price leadership
11-178

Copyright 2008 The McGraw-Hill Companies6-1
Assessing the
Economy’s
Performance
Two
Approaches to
GDP
Expenditure
Approach
GDP
Approaches
Compared
Income
Approach
Nominal vs.
Real GDP
Shortcomings
of GDP
Last Word
Key Terms
End Show
6Measuring
Domestic Output
and National
Income
Copyright 2008 The McGraw-Hill Companies6-2
Assessing the
Economy’s
Performance
Two
Approaches to
GDP
Expenditure
Approach
GDP
Approaches
Compared
Income
Approach
Nominal vs.
Real GDP
Shortcomings
of GDP
Last Word
Key Terms
End Show
Chapter Objectives• How GDP is Defined and
Measured
• Relationships Between GDP, Net Domestic Product, National Income, Personal Income, and Disposable Income
• The Nature and Function of a GDP Price Index
• The Difference Between Nominal GDP and Real GDP
• Some Limitations of the GDP Measure
Copyright 2008 The McGraw-Hill Companies6-3
Assessing the
Economy’s
Performance
Two
Approaches to
GDP
Expenditure
Approach
GDP
Approaches
Compared
Income
Approach
Nominal vs.
Real GDP
Shortcomings
of GDP
Last Word
Key Terms
End Show
Assessing Economy’s Performance
• Financial Transactions
Excluded–Public Transfer
Payments
–Private Transfer
Payments
–Stock (and Bond) Market
Transactions
• Second Hand Sales
Copyright 2008 The McGraw-Hill Companies6-4
Assessing the
Economy’s
Performance
Two
Approaches to
GDP
Expenditure
Approach
GDP
Approaches
Compared
Income
Approach
Nominal vs.
Real GDP
Shortcomings
of GDP
Last Word
Key Terms
End Show
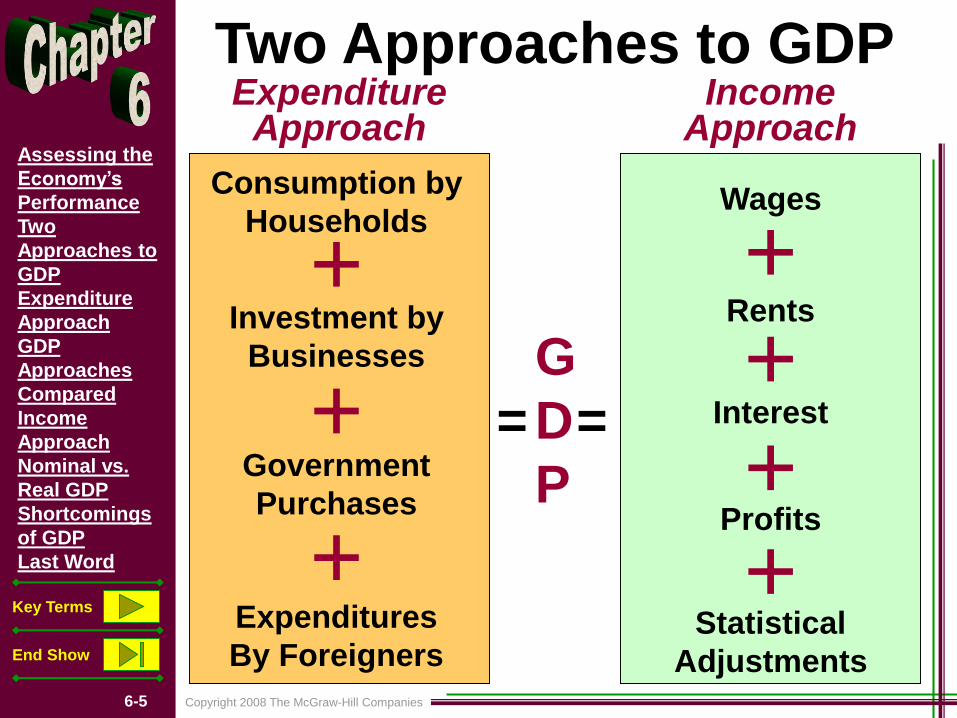
Two Approaches to GDP
• Income Approach–Wages
–Rental Incomes
–Interest Incomes
–Profits
• Expenditure Approach–Final-Product or Value-
Added
–The Sum of the Money
Spent to Buy the Output
Copyright 2008 The McGraw-Hill Companies6-5
Assessing the
Economy’s
Performance
Two
Approaches to
GDP
Expenditure
Approach
GDP
Approaches
Compared
Income
Approach
Nominal vs.
Real GDP
Shortcomings
of GDP
Last Word
Key Terms
End Show
Two Approaches to GDPExpenditure
ApproachIncome
Approach
G
D
P
= =
+Consumption by
Households
Investment by
Businesses
Government
Purchases
Expenditures
By Foreigners
+
+
++
+
Wages
Rents
Interest
Profits
Statistical
Adjustments
+

Copyright 2008 The McGraw-Hill Companies6-6
Assessing the
Economy’s
Performance
Two
Approaches to
GDP
Expenditure
Approach
GDP
Approaches
Compared
Income
Approach
Nominal vs.
Real GDP
Shortcomings
of GDP
Last Word
Key Terms
End Show
Expenditure ApproachGovernment Purchases
• Expenditures for Goods and
Services
• Expenditures for Social
Capital
Net Exports
Xn = Exports (X) – Imports (M)
Putting It All Together:
GDP = C + I + G + XnGDP= $8,746 + 2,105 + 2,363 - 727 = $12,487
in 2005
G
Xn

Copyright 2008 The McGraw-Hill Companies6-7
Assessing the
Economy’s
Performance
Two
Approaches to
GDP
Expenditure
Approach
GDP
Approaches
Compared
Income
Approach
Nominal vs.
Real GDP
Shortcomings
of GDP
Last Word
Key Terms
End Show
GDP Approaches Compared
Compensation
Rents
Interest
Proprietor’s Income
Corporate Profits
Taxes on Production and
Imports
National Income
Net Foreign Factor Income
Statistical Discrepancy
Consumption of Fixed
Capital
Gross Domestic Product
$ 7125
73
498
939
1352
917
$10,904
-34
43
1574
$ 12,487
Personal Consumption (C)
Gross Private Domestic
Investment (Ig)
Government Purchases (G)
Net Exports (Xn)
Gross Domestic Product
Accounting Statement for the U.S. Economy, 2005in Billions
ReceiptsExpenditures Approach
AllocationsIncome Approach
$ 8746
2105
2363
-727
$ 12,487

Copyright 2008 The McGraw-Hill Companies6-8
Assessing the
Economy’s
Performance
Two
Approaches to
GDP
Expenditure
Approach
GDP
Approaches
Compared
Income
Approach
Nominal vs.
Real GDP
Shortcomings
of GDP
Last Word
Key Terms
End Show
The Income Approach
Gross Domestic Product (GDP)
Consumption of Fixed Capital
Net Domestic Profit (NDP)
Statistical Discrepancy
Net Foreign Factor Income
National Income (NI)
Taxes on Production and Imports
Social Security Contributions
Corporate Income Taxes
Undistributed Corporate Profits
Transfer Payments
Personal Income (PI)
Personal Taxes
Disposable Income (DI)
$ 12,487
-1,574
$ 10,913
-43
34
$ 10,904
-917
-871
-378
-460
+1,970
$ 10,248
-1,210
$ 9,038
Income Relationships – United States, 2005
Copyright 2008 The McGraw-Hill Companies6-9
Assessing the
Economy’s
Performance
Two
Approaches to
GDP
Expenditure
Approach
GDP
Approaches
Compared
Income
Approach
Nominal vs.
Real GDP
Shortcomings
of GDP
Last Word
Key Terms
End Show
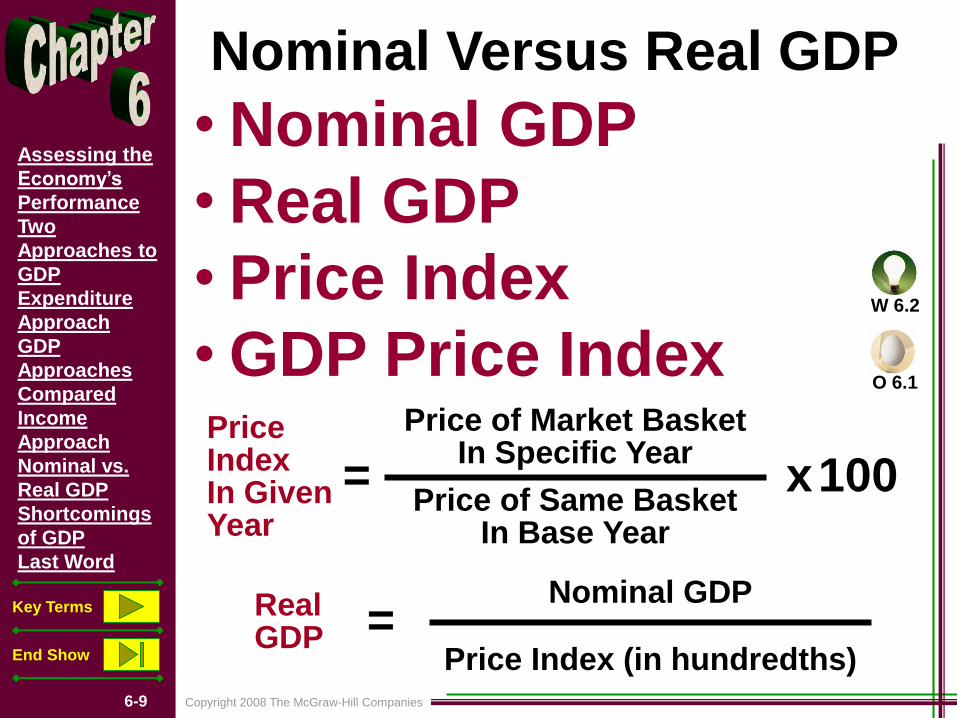
Nominal Versus Real GDP
• Nominal GDP
• Real GDP
• Price Index
• GDP Price IndexPriceIndexIn GivenYear
= x100
Price of Market BasketIn Specific Year
Price of Same BasketIn Base Year
RealGDP =
Nominal GDP
Price Index (in hundredths)
O 6.1
W 6.2
Copyright 2008 The McGraw-Hill Companies6-10
Assessing the
Economy’s
Performance
Two
Approaches to
GDP
Expenditure
Approach
GDP
Approaches
Compared
Income
Approach
Nominal vs.
Real GDP
Shortcomings
of GDP
Last Word
Key Terms
End Show
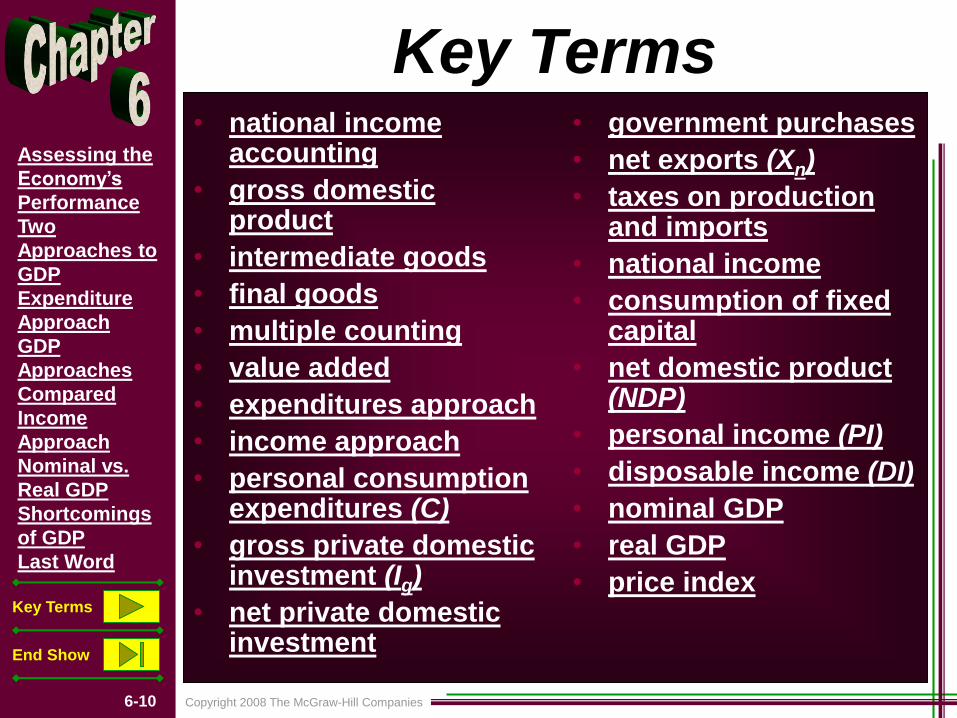
Key Terms• national income
accounting
• gross domestic product
• intermediate goods
• final goods
• multiple counting
• value added
• expenditures approach
• income approach
• personal consumption expenditures (C)
• gross private domestic investment (Ig)
• net private domestic investment
• government purchases
• net exports (Xn)
• taxes on production and imports
• national income
• consumption of fixed capital
• net domestic product (NDP)
• personal income (PI)
• disposable income (DI)
• nominal GDP
• real GDP
• price index

Copyright 2008 The McGraw-Hill Companies7-1
Economic
Growth
The Business
Cycle
Unemployment
Labor Force
Composition
Types of
Unemployment
Unequal
Burdens
Inflation
Consumer Price
Index (CPI)
Types of
Inflation
Inflation
Premium
Last Word
Key Terms
End Show
7Introduction to Economic Growth and Instability
Copyright 2008 The McGraw-Hill Companies7-2
Economic
Growth
The Business
Cycle
Unemployment
Labor Force
Composition
Types of
Unemployment
Unequal
Burdens
Inflation
Consumer Price
Index (CPI)
Types of
Inflation
Inflation
Premium
Last Word
Key Terms
End Show
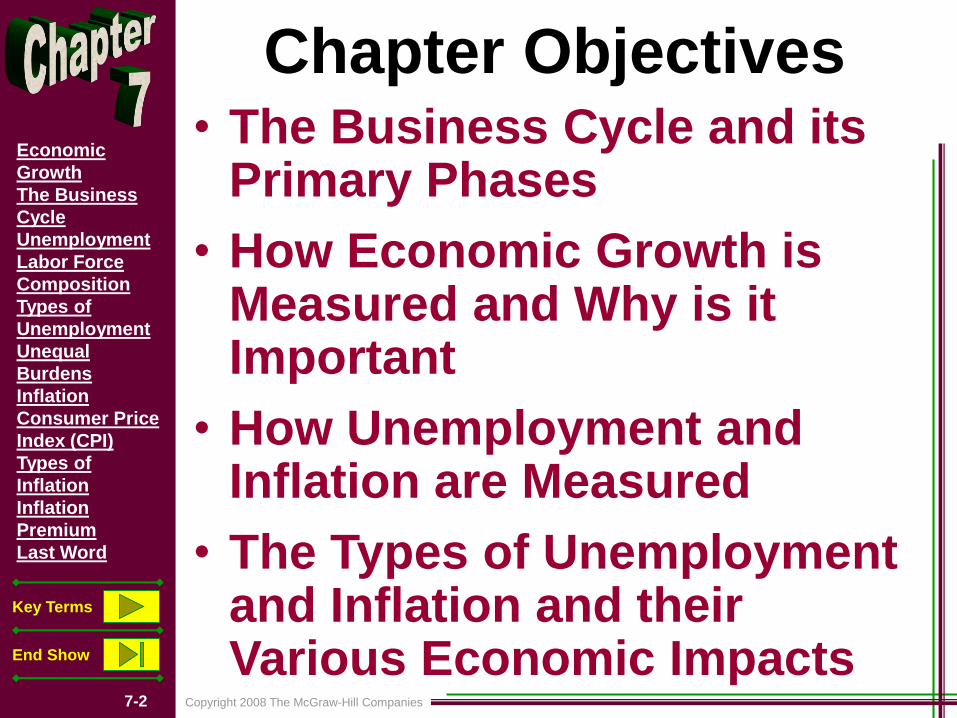
Chapter Objectives• The Business Cycle and its
Primary Phases
• How Economic Growth is Measured and Why is it Important
• How Unemployment and Inflation are Measured
• The Types of Unemployment and Inflation and their Various Economic Impacts
Copyright 2008 The McGraw-Hill Companies7-3
Economic
Growth
The Business
Cycle
Unemployment
Labor Force
Composition
Types of
Unemployment
Unequal
Burdens
Inflation
Consumer Price
Index (CPI)
Types of
Inflation
Inflation
Premium
Last Word
Key Terms
End Show
Economic Growth
• Increase in Real GDP
• Increase in Real GDP Per
Capita
• Growth as a Goal
• Arithmetic of Growth
–Rule of 70
Approximate
number of years
required to double
real GDP
=70
annual percentage rate
of growth
W 7.1
Copyright 2008 The McGraw-Hill Companies7-4
Economic
Growth
The Business
Cycle
Unemployment
Labor Force
Composition
Types of
Unemployment
Unequal
Burdens
Inflation
Consumer Price
Index (CPI)
Types of
Inflation
Inflation
Premium
Last Word
Key Terms
End Show
Economic Growth
• Main Sources of Growth• Increases in Inputs• Increases in Resource
Productivity• Productivity Defined• Productivity in the United
States– Improved Products and
Services–Added Leisure–Other Impacts

Copyright 2008 The McGraw-Hill Companies7-5
Economic
Growth
The Business
Cycle
Unemployment
Labor Force
Composition
Types of
Unemployment
Unequal
Burdens
Inflation
Consumer Price
Index (CPI)
Types of
Inflation
Inflation
Premium
Last Word
Key Terms
End Show
Selected Growth Rates
Source: Economic Report of the President, 2006
-4
-2
0
2
4
6
U.S.
Germany
France
Japan
U.K.
Italy
1997 1999 2001 2003 2005
Perc
en
tag
e C
han
ge (
an
nu
al
rate
)
GLOBAL PERSPECTIVE

Copyright 2008 The McGraw-Hill Companies7-6
Economic
Growth
The Business
Cycle
Unemployment
Labor Force
Composition
Types of
Unemployment
Unequal
Burdens
Inflation
Consumer Price
Index (CPI)
Types of
Inflation
Inflation
Premium
Last Word
Key Terms
End Show
The Business Cycle
Level
of
Real O
utp
ut
Time
Peak
Peak
Peak
Trough
Trough
O 7.1Phases of the Business Cycle
Cyclical Impact:Durables and Nondurables

Copyright 2008 The McGraw-Hill Companies7-7
Economic
Growth
The Business
Cycle
Unemployment
Labor Force
Composition
Types of
Unemployment
Unequal
Burdens
Inflation
Consumer Price
Index (CPI)
Types of
Inflation
Inflation
Premium
Last Word
Key Terms
End Show
Unemployment
• Twin Problems of the Business
Cycle– Unemployment
– Inflation
• Measurement of Unemployment
• Labor Force
• Unemployment Rate– Part-Time Employment
– Discouraged Workers
Unemployment RateUnemployed
Labor Force= x 100
W 7.2

Copyright 2008 The McGraw-Hill Companies7-8
Economic
Growth
The Business
Cycle
Unemployment
Labor Force
Composition
Types of
Unemployment
Unequal
Burdens
Inflation
Consumer Price
Index (CPI)
Types of
Inflation
Inflation
Premium
Last Word
Key Terms
End Show
Unemployment
Under 16And/or
Institutionalized(70.5 Million)
Labor Force, Employment, and Unemployment, 2005
Total
Population
(296.6 Million)
Not inLabor Force(76.8 Million)
Employed(141.7 Million)
Labor
Force
(149.3 Million)
Unemployed(7.6 Million)
Copyright 2008 The McGraw-Hill Companies7-9
Economic
Growth
The Business
Cycle
Unemployment
Labor Force
Composition
Types of
Unemployment
Unequal
Burdens
Inflation
Consumer Price
Index (CPI)
Types of
Inflation
Inflation
Premium
Last Word
Key Terms
End Show
Unemployment
• Types of Unemployment–Frictional Unemployment
–Structural Unemployment
–Cyclical Unemployment
• Full Employment Defined
• Full-Employment Rate of
Unemployment
• Natural Rate of
Unemployment (NRU)

Copyright 2008 The McGraw-Hill Companies7-10
Economic
Growth
The Business
Cycle
Unemployment
Labor Force
Composition
Types of
Unemployment
Unequal
Burdens
Inflation
Consumer Price
Index (CPI)
Types of
Inflation
Inflation
Premium
Last Word
Key Terms
End Show
UnemploymentActual and Potential GDP and the Unemployment Rate
5,000
6,000
7,000
8,000
9,000
10,000
11,000
12,000
1985 1987 1989 1991 1993 1995 1997 1999 2001 2003 20051985 1987 1989 1991 1993 1995 1997 1999 2001 2003 2005
The GDP Gap12,000
11,000
10,000
9,000
8,000
7,000
6,000
5,000GD
P (
bil
lio
ns
of
19
96
do
lla
rs)
0
2
4
6
8
10
1985 1987 1989 1991 1993 1995 1997 1999 2001 2003 20051985 1987 1989 1991 1993 1995 1997 1999 2001 2003 2005
The Unemployment Rate10
8
6
4
2
0
Un
em
plo
ym
en
t(p
erc
en
t o
f c
ivil
ian
La
bo
r fo
rce
)
Source: Congressional Budget Office & Bureau of Economic Analysis
GDP gap(positive)
GDP gap(negative)
Potential GDP
Actual GDP
Copyright 2008 The McGraw-Hill Companies7-11
Economic
Growth
The Business
Cycle
Unemployment
Labor Force
Composition
Types of
Unemployment
Unequal
Burdens
Inflation
Consumer Price
Index (CPI)
Types of
Inflation
Inflation
Premium
Last Word
Key Terms
End Show
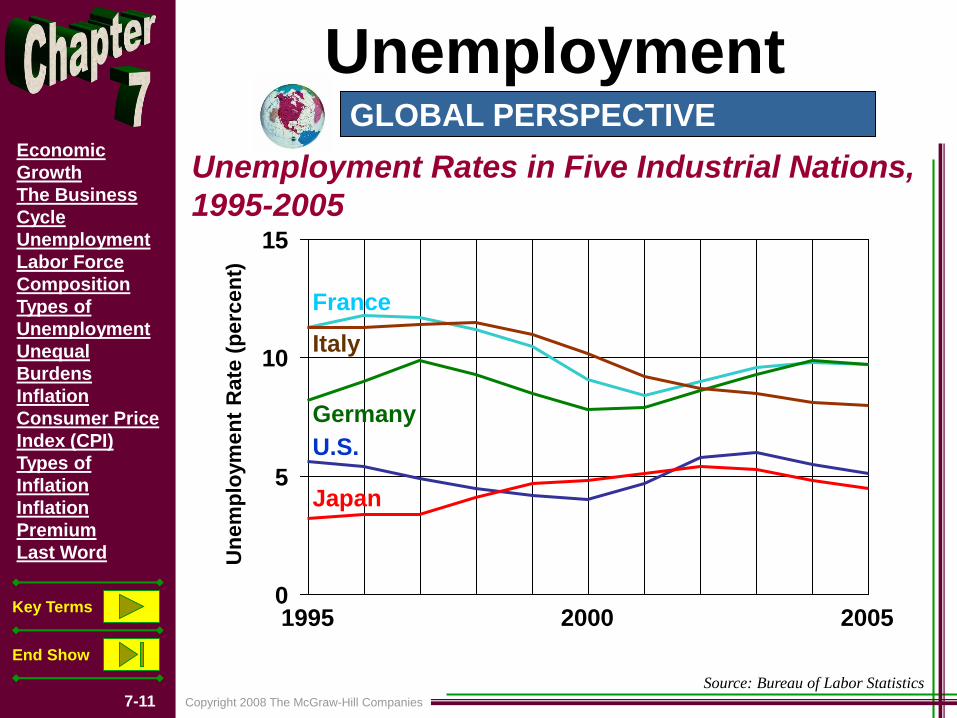
Unemployment
Source: Bureau of Labor Statistics
0
5
10
15
U.S.
Germany
Italy
Japan
France
1995 2000 2005
Un
em
plo
ym
en
t R
ate
(p
erc
en
t)
Unemployment Rates in Five Industrial Nations,
1995-2005
GLOBAL PERSPECTIVE
Copyright 2008 The McGraw-Hill Companies7-12
Economic
Growth
The Business
Cycle
Unemployment
Labor Force
Composition
Types of
Unemployment
Unequal
Burdens
Inflation
Consumer Price
Index (CPI)
Types of
Inflation
Inflation
Premium
Last Word
Key Terms
End Show
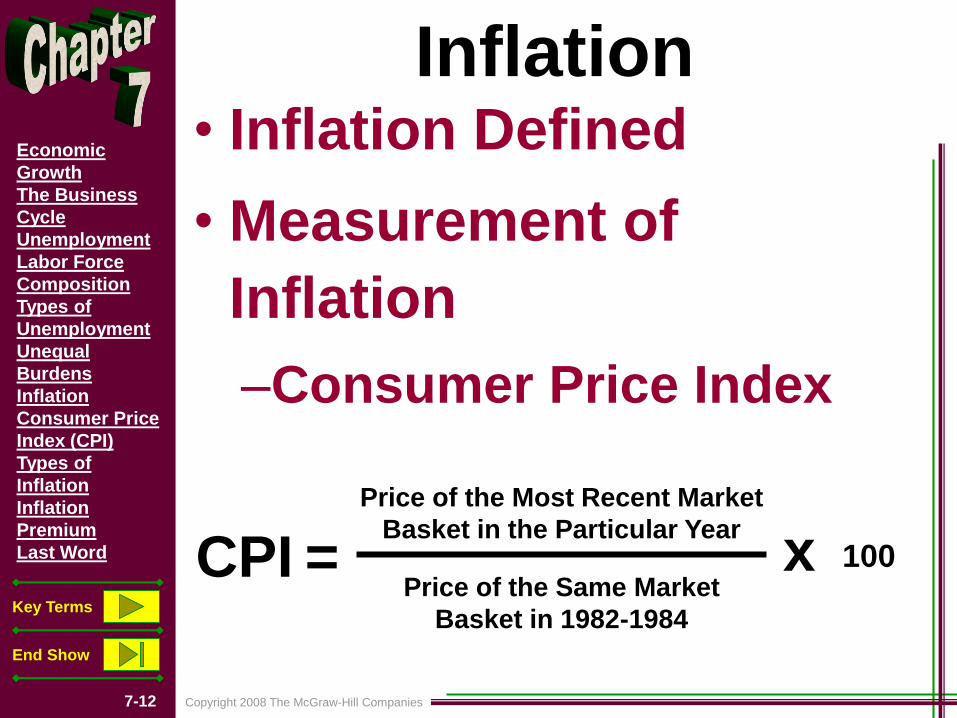
Inflation• Inflation Defined
• Measurement of
Inflation
–Consumer Price Index
CPI
Price of the Most Recent Market
Basket in the Particular Year
Price of the Same Market
Basket in 1982-1984
= x 100
Copyright 2008 The McGraw-Hill Companies7-13
Economic
Growth
The Business
Cycle
Unemployment
Labor Force
Composition
Types of
Unemployment
Unequal
Burdens
Inflation
Consumer Price
Index (CPI)
Types of
Inflation
Inflation
Premium
Last Word
Key Terms
End Show
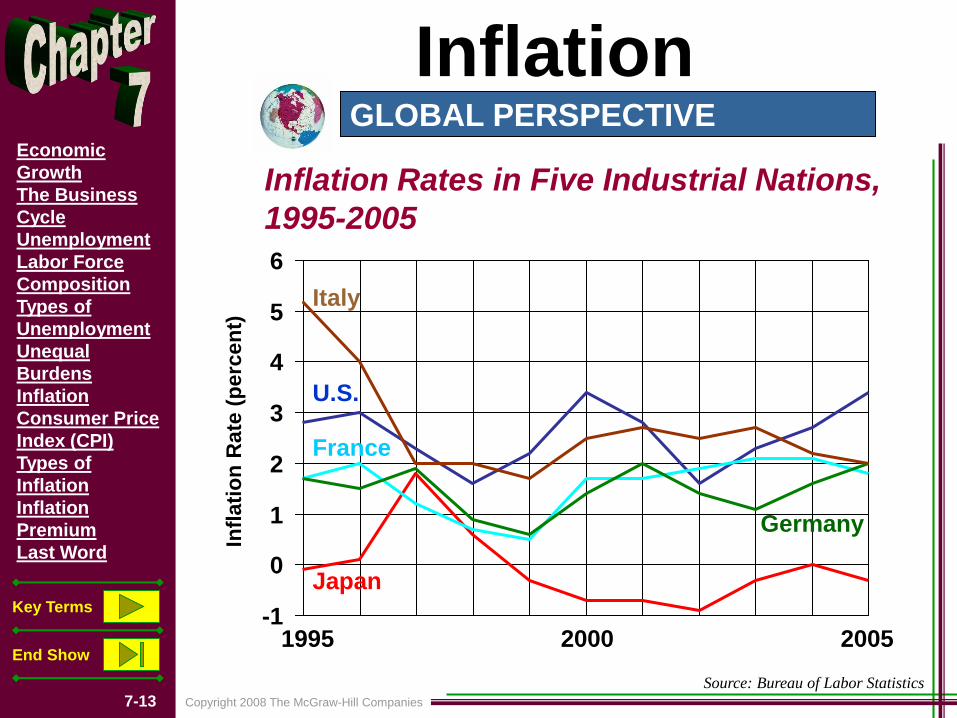
Inflation
Source: Bureau of Labor Statistics
-1
0
1
2
3
4
5
6
U.S.
Germany
Italy
Japan
France
1995 2000 2005
Infl
ati
on
Rate
(p
erc
en
t)
Inflation Rates in Five Industrial Nations,
1995-2005
GLOBAL PERSPECTIVE
Copyright 2008 The McGraw-Hill Companies7-14
Economic
Growth
The Business
Cycle
Unemployment
Labor Force
Composition
Types of
Unemployment
Unequal
Burdens
Inflation
Consumer Price
Index (CPI)
Types of
Inflation
Inflation
Premium
Last Word
Key Terms
End Show
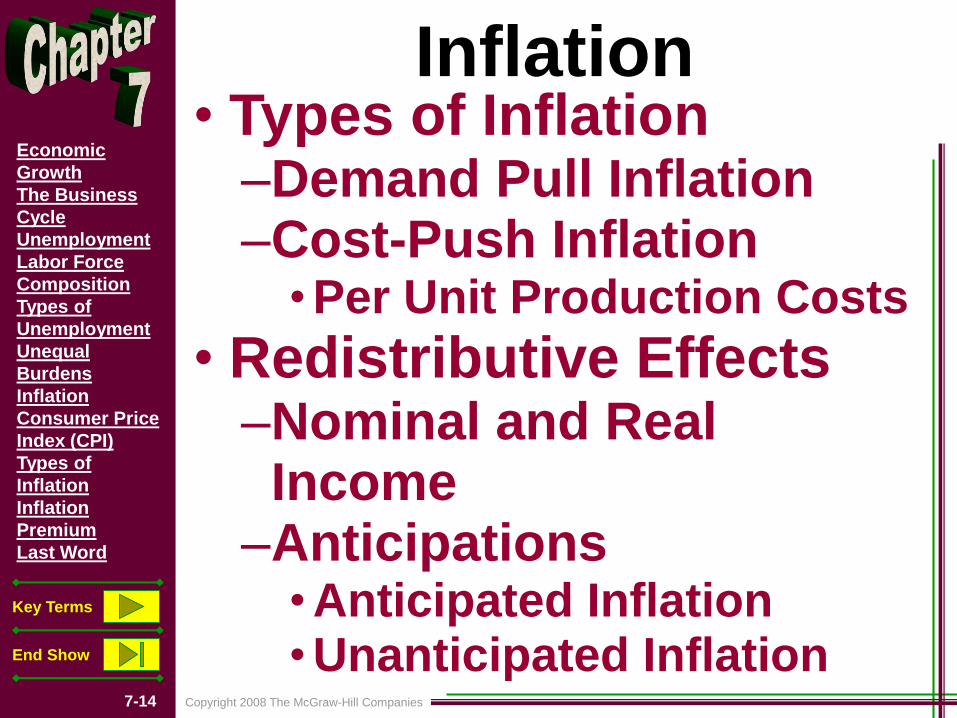
Inflation• Types of Inflation–Demand Pull Inflation–Cost-Push Inflation•Per Unit Production Costs
• Redistributive Effects–Nominal and Real
Income–Anticipations•Anticipated Inflation•Unanticipated Inflation
Copyright 2008 The McGraw-Hill Companies7-15
Economic
Growth
The Business
Cycle
Unemployment
Labor Force
Composition
Types of
Unemployment
Unequal
Burdens
Inflation
Consumer Price
Index (CPI)
Types of
Inflation
Inflation
Premium
Last Word
Key Terms
End Show
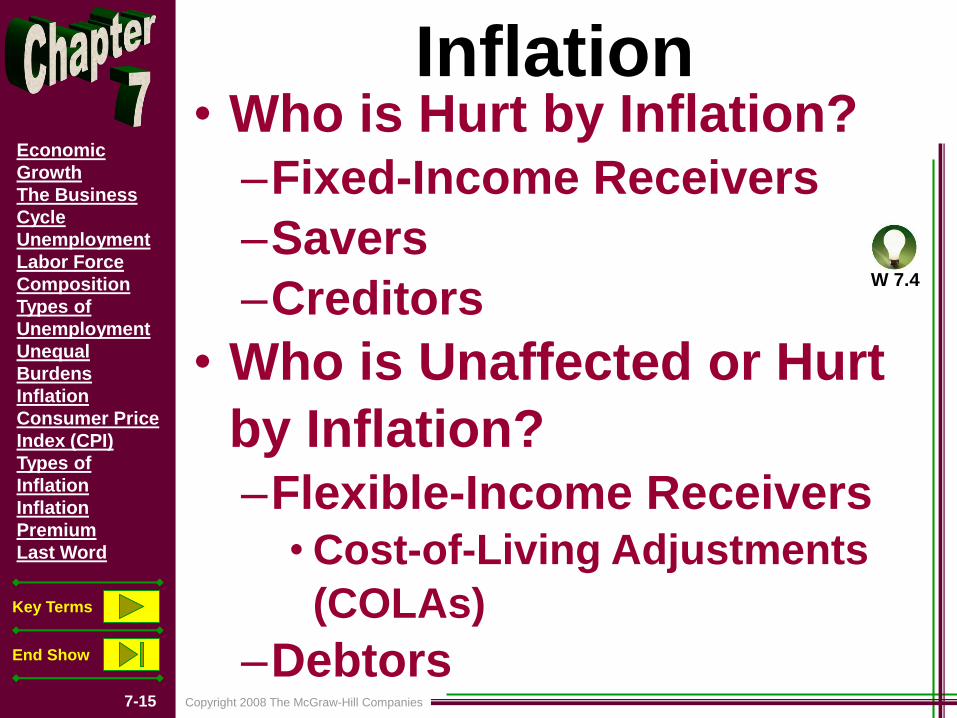
Inflation• Who is Hurt by Inflation?–Fixed-Income Receivers
–Savers
–Creditors
• Who is Unaffected or Hurt
by Inflation?–Flexible-Income Receivers
• Cost-of-Living Adjustments
(COLAs)
–Debtors
W 7.4
Copyright 2008 The McGraw-Hill Companies7-16
Economic
Growth
The Business
Cycle
Unemployment
Labor Force
Composition
Types of
Unemployment
Unequal
Burdens
Inflation
Consumer Price
Index (CPI)
Types of
Inflation
Inflation
Premium
Last Word
Key Terms
End Show
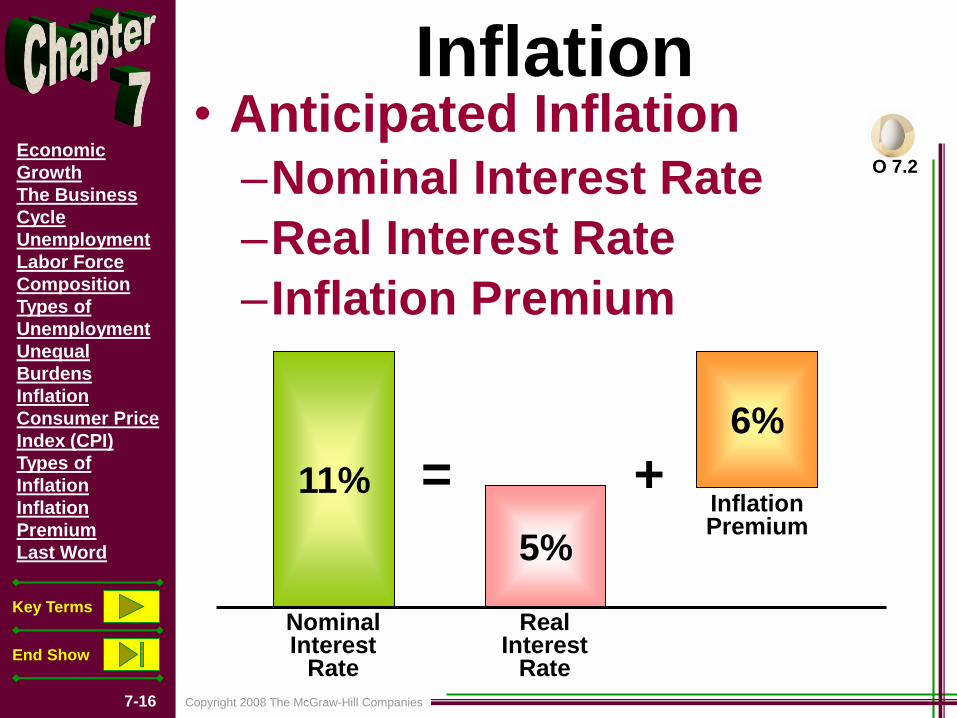
Inflation• Anticipated Inflation–Nominal Interest Rate
–Real Interest Rate
–Inflation Premium
NominalInterest
Rate
RealInterest
Rate
InflationPremium
11%
5%
6%
= +
O 7.2

Copyright 2008 The McGraw-Hill Companies7-17
Economic
Growth
The Business
Cycle
Unemployment
Labor Force
Composition
Types of
Unemployment
Unequal
Burdens
Inflation
Consumer Price
Index (CPI)
Types of
Inflation
Inflation
Premium
Last Word
Key Terms
End Show
Key Terms• economic growth
• real GDP per capita
• rule of 70
• productivity
• business cycle
• peak
• recession
• trough
• expansion
• labor force
• unemployment rate
• discouraged workers
• frictional unemployment
• structural unemployment
• cyclical unemployment
• full-employment rate of unemployment
• natural rate of unemployment (NRU)
• potential output
• GDP gap
• Okun’s law
• inflation
• Consumer Price Index (CPI)
• demand-pull inflation
• cost-push inflation
• per-unit production costs
• nominal income
• real income
• anticipated inflation
• unanticipated inflation
• cost-of-living adjustments (COLAs)
• real interest rate
• nominal interest rate
• deflation
• hyperinflation
Copyright 2008 The McGraw-Hill Companies7-18
Economic
Growth
The Business
Cycle
Unemployment
Labor Force
Composition
Types of
Unemployment
Unequal
Burdens
Inflation
Consumer Price
Index (CPI)
Types of
Inflation
Inflation
Premium
Last Word
Key Terms
End Show
Next Chapter Preview…
BasicMacroeconomicRelationships

Copyright 2008 The McGraw-Hill Companies11-1
Fiscal Policy
and the AD-
AS Model
Built-In
Stability
Evaluating
Fiscal Policy
Recent U.S.
Fiscal Policy
The Public
Debt
Debt and
GDP
Last Word
Key Terms
End Show
11Fiscal Policy,
Deficits, and
DebtO 11.1

Copyright 2008 The McGraw-Hill Companies11-2
Fiscal Policy
and the AD-
AS Model
Built-In
Stability
Evaluating
Fiscal Policy
Recent U.S.
Fiscal Policy
The Public
Debt
Debt and
GDP
Last Word
Key Terms
End Show
Chapter Objectives• Purposes, Tools, and
Limitations of Fiscal Policy
• Role of Built-In Stabilizers in Moderating Business Cycles
• How the Standardized Budget Reveals the Status of U.S. Fiscal Policy
• The Size, Composition, and Consequences of the U.S. Public Debt

Copyright 2008 The McGraw-Hill Companies11-3
Fiscal Policy
and the AD-
AS Model
Built-In
Stability
Evaluating
Fiscal Policy
Recent U.S.
Fiscal Policy
The Public
Debt
Debt and
GDP
Last Word
Key Terms
End Show
Fiscal Policy and theAD-AS Model
• Fiscal Policy
• Council of Economic Advisers (CEA)
• Discretionary Fiscal Policy
• Nondiscretionary Fiscal Policy
–Passive or Automatic
Copyright 2008 The McGraw-Hill Companies11-4
Fiscal Policy
and the AD-
AS Model
Built-In
Stability
Evaluating
Fiscal Policy
Recent U.S.
Fiscal Policy
The Public
Debt
Debt and
GDP
Last Word
Key Terms
End Show
Fiscal Policy and theAD-AS Model
• Expansionary Fiscal Policy
–Increased Government Spending
–Tax Reductions
–Some Combination of the Two
• Budget Deficit
Copyright 2008 The McGraw-Hill Companies11-5
Fiscal Policy
and the AD-
AS Model
Built-In
Stability
Evaluating
Fiscal Policy
Recent U.S.
Fiscal Policy
The Public
Debt
Debt and
GDP
Last Word
Key Terms
End Show
Fiscal Policy and theAD-AS Model
• Contractionary Fiscal Policy
–Decreased Government Spending
–Increased Taxes
–Some Combination of the Two
• Budget Surplus
• Policy Options: G or T?
G 11.1
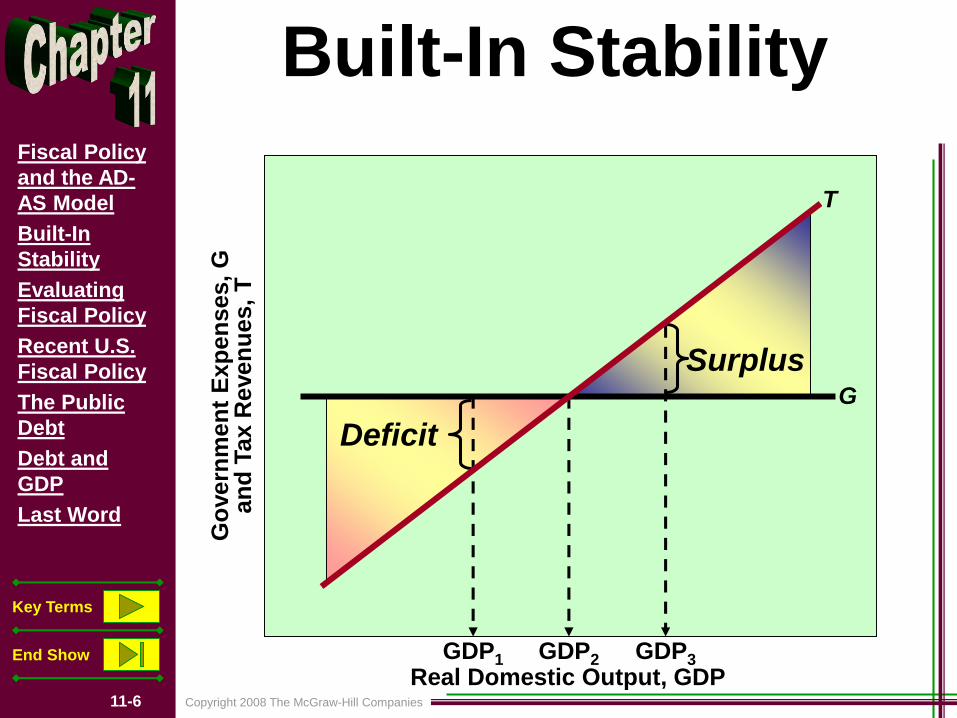
Copyright 2008 The McGraw-Hill Companies11-6
Fiscal Policy
and the AD-
AS Model
Built-In
Stability
Evaluating
Fiscal Policy
Recent U.S.
Fiscal Policy
The Public
Debt
Debt and
GDP
Last Word
Key Terms
End Show
Built-In Stability
G
T
Deficit
Surplus
GDP1 GDP2 GDP3
Real Domestic Output, GDP
Go
vern
men
t E
xp
en
ses, G
an
d T
ax R
even
ues,
T
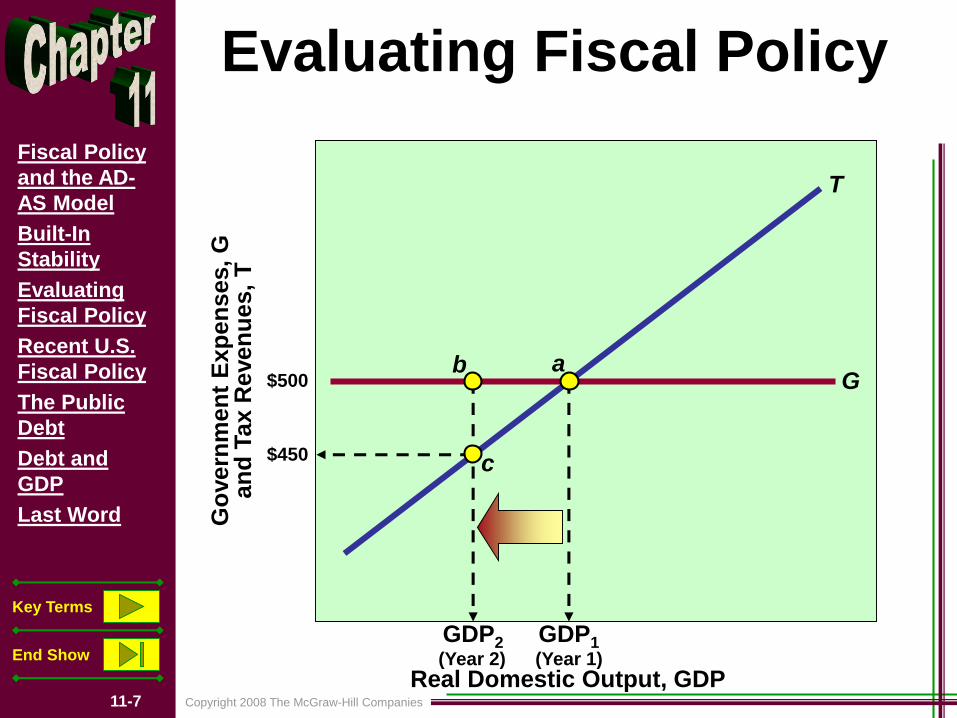
Copyright 2008 The McGraw-Hill Companies11-7
Fiscal Policy
and the AD-
AS Model
Built-In
Stability
Evaluating
Fiscal Policy
Recent U.S.
Fiscal Policy
The Public
Debt
Debt and
GDP
Last Word
Key Terms
End Show
Evaluating Fiscal Policy
G
T
GDP2 GDP1
Real Domestic Output, GDP
Go
vern
men
t E
xp
en
ses, G
an
d T
ax R
even
ues,
T
(Year 2) (Year 1)
$500
$450
ab
c

Copyright 2008 The McGraw-Hill Companies11-8
Fiscal Policy
and the AD-
AS Model
Built-In
Stability
Evaluating
Fiscal Policy
Recent U.S.
Fiscal Policy
The Public
Debt
Debt and
GDP
Last Word
Key Terms
End Show
Evaluating Fiscal Policy
G
T1
GDP4 GDP3
Real Domestic Output, GDP
Go
vern
men
t E
xp
en
ses, G
an
d T
ax R
even
ues,
T
(Year 4) (Year 3)
$500
$450
de
f
$475
$425 g
T2
h

Copyright 2008 The McGraw-Hill Companies11-9
Fiscal Policy
and the AD-
AS Model
Built-In
Stability
Evaluating
Fiscal Policy
Recent U.S.
Fiscal Policy
The Public
Debt
Debt and
GDP
Last Word
Key Terms
End Show
• Problems of Timing– Recognition Lag– Administrative Lag– Operational Lag
• Political Considerations– Political Business Cycle
• Future Policy Reversals• Offsetting State and Local
Finance• Crowding-Out Effect• Current Thinking on Fiscal
Policy
Recent U.S. Fiscal PolicyProblems, Criticisms, and Complications
O 11.2

Copyright 2008 The McGraw-Hill Companies11-10
Fiscal Policy
and the AD-
AS Model
Built-In
Stability
Evaluating
Fiscal Policy
Recent U.S.
Fiscal Policy
The Public
Debt
Debt and
GDP
Last Word
Key Terms
End Show
Key Terms• fiscal policy
• Council of Economic Advisers (CEA)
• expansionary fiscal policy
• budget deficit
• contractionary fiscal policy
• budget surplus
• built-in stabilizer
• progressive tax system
• proportional tax system
• regressive tax system
• standardized budget
• cyclical deficit
• political business cycle
• crowding-out effect
• public debt
• U.S. Securities
• external public debt
• public investments

Copyright 2008 The McGraw-Hill Companies11-11
Fiscal Policy
and the AD-
AS Model
Built-In
Stability
Evaluating
Fiscal Policy
Recent U.S.
Fiscal Policy
The Public
Debt
Debt and
GDP
Last Word
Key Terms
End Show
Next Chapter Preview…
Money andBanking
Copyright 2008 The McGraw-Hill Companies12-1
Money
Defined
Money
Supply
Federal
Reserve
System
Financial
Institutions
Last Word
Key Terms
End Show
12Money and
Banking
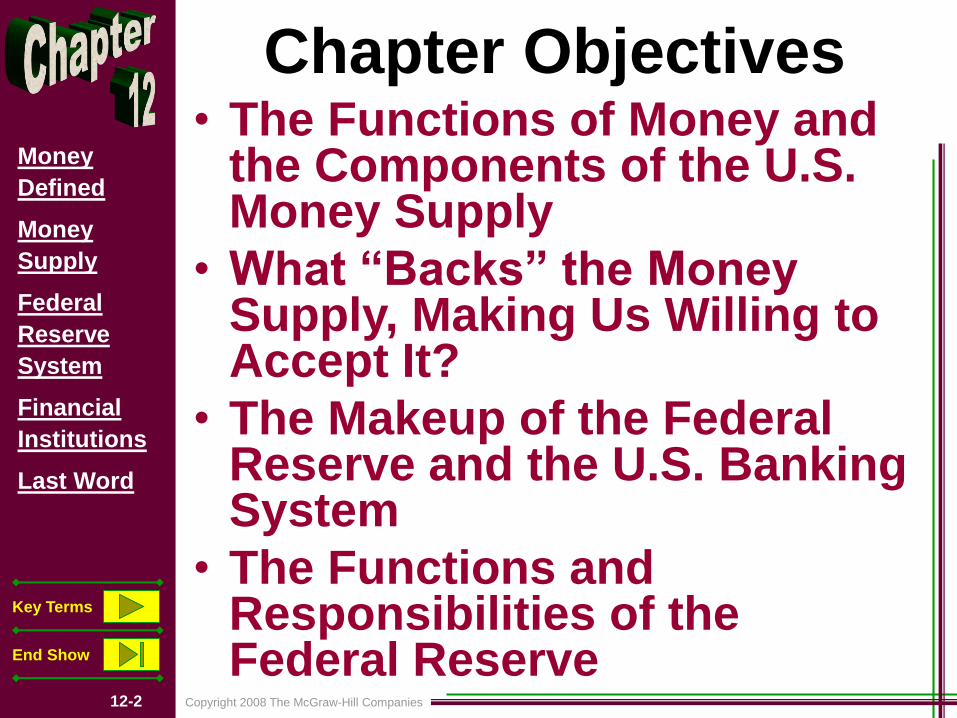
Copyright 2008 The McGraw-Hill Companies12-2
Money
Defined
Money
Supply
Federal
Reserve
System
Financial
Institutions
Last Word
Key Terms
End Show
Chapter Objectives• The Functions of Money and
the Components of the U.S. Money Supply
• What “Backs” the Money Supply, Making Us Willing to Accept It?
• The Makeup of the Federal Reserve and the U.S. Banking System
• The Functions and Responsibilities of the Federal Reserve
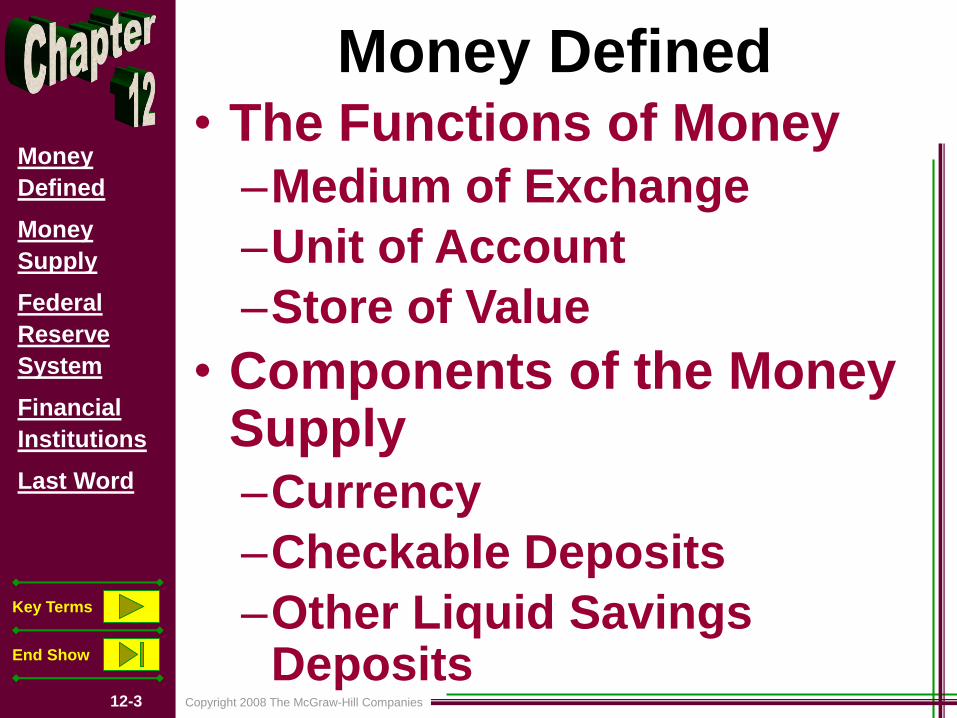
Copyright 2008 The McGraw-Hill Companies12-3
Money
Defined
Money
Supply
Federal
Reserve
System
Financial
Institutions
Last Word
Key Terms
End Show
Money Defined• The Functions of Money–Medium of Exchange
–Unit of Account
–Store of Value
• Components of the Money Supply–Currency
–Checkable Deposits
–Other Liquid Savings Deposits

Copyright 2008 The McGraw-Hill Companies12-4
Money
Defined
Money
Supply
Federal
Reserve
System
Financial
Institutions
Last Word
Key Terms
End Show
Money Defined• Currency–Coins and Paper Money–Token Money–Federal Reserve Notes
• Checkable Deposits–Commercial Banks–Thrift Institutions
• A Qualification–Government, Federal
Reserve, and Banks Excluded from M1
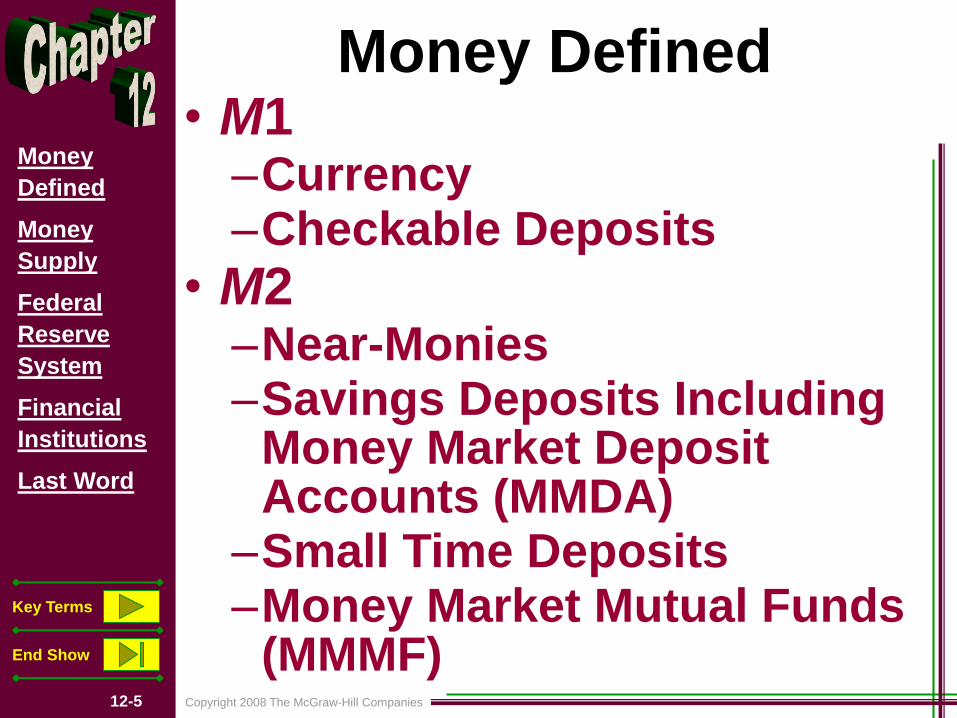
Copyright 2008 The McGraw-Hill Companies12-5
Money
Defined
Money
Supply
Federal
Reserve
System
Financial
Institutions
Last Word
Key Terms
End Show
Money Defined• M1–Currency–Checkable Deposits
• M2–Near-Monies–Savings Deposits Including
Money Market Deposit Accounts (MMDA)
–Small Time Deposits–Money Market Mutual Funds
(MMMF)
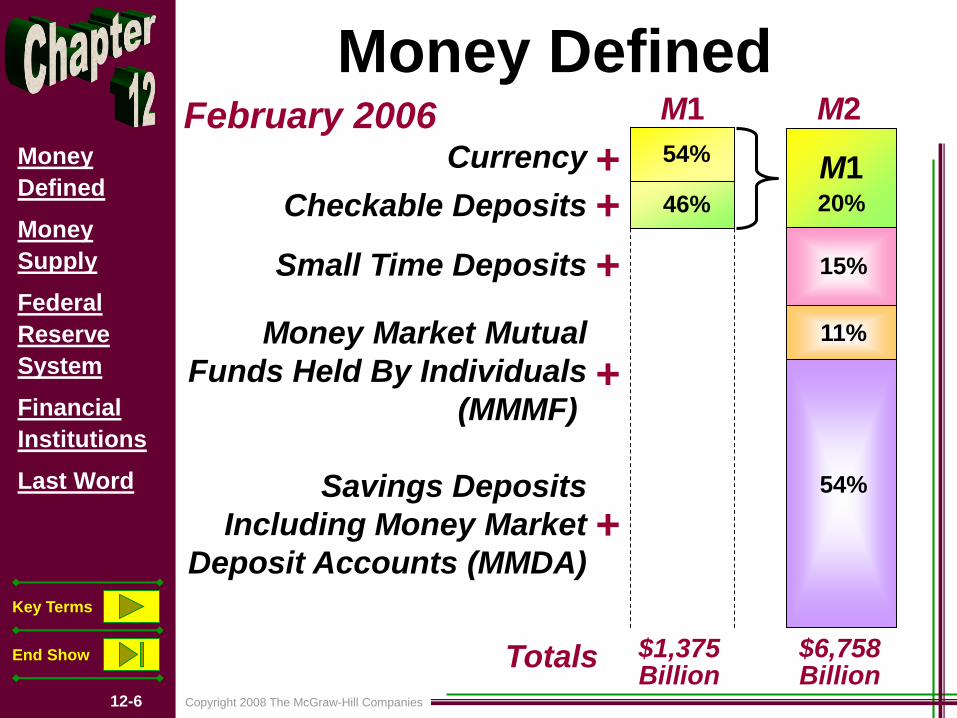
Copyright 2008 The McGraw-Hill Companies12-6
Money
Defined
Money
Supply
Federal
Reserve
System
Financial
Institutions
Last Word
Key Terms
End Show
Money DefinedM1 M2
54%
46%
M120%
Savings Deposits
Including Money Market
Deposit Accounts (MMDA)
Small Time Deposits
Money Market Mutual
Funds Held By Individuals
(MMMF)
Currency
Checkable Deposits
15%
11%
54%
$1,375Billion
$6,758Billion
February 2006
Totals
++
+
+
+
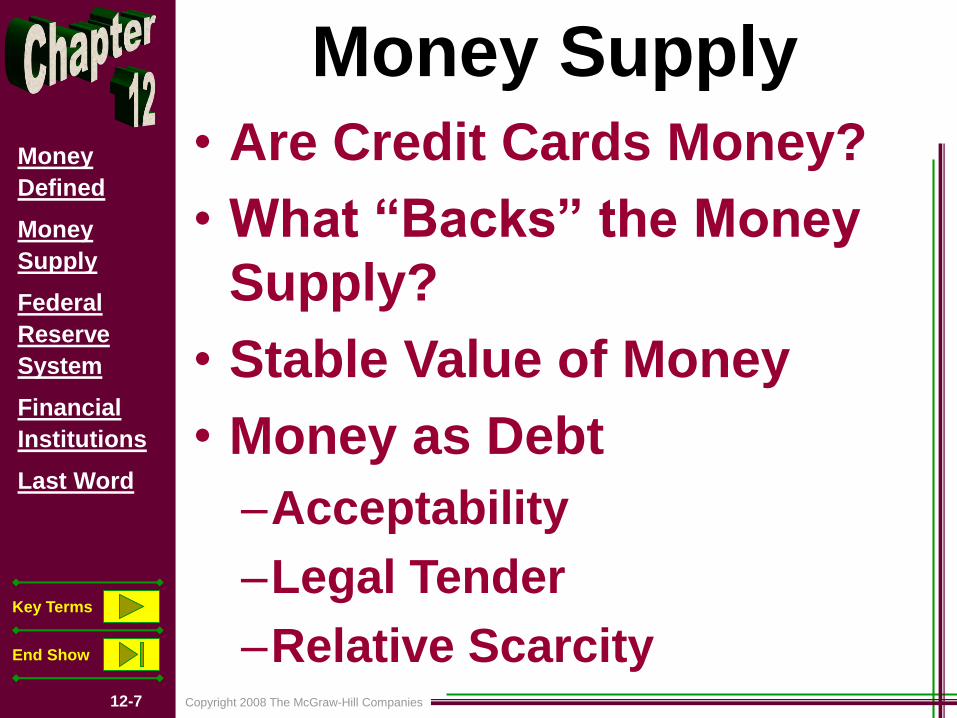
Copyright 2008 The McGraw-Hill Companies12-7
Money
Defined
Money
Supply
Federal
Reserve
System
Financial
Institutions
Last Word
Key Terms
End Show
Money Supply• Are Credit Cards Money?
• What “Backs” the Money
Supply?
• Stable Value of Money
• Money as Debt
–Acceptability
–Legal Tender
–Relative Scarcity

Copyright 2008 The McGraw-Hill Companies12-8
Money
Defined
Money
Supply
Federal
Reserve
System
Financial
Institutions
Last Word
Key Terms
End Show
Federal Reserve SystemFed Functions and the Money Supply• Issuing Currency
• Setting Reserve Requirements
and Holding Reserves
• Lending Money to Banks and
Thrifts
–Discount Rate
• Check Collection
• Fiscal Agent for U.S.
• Supervising Banks
• Controlling the Money Supply
Copyright 2008 The McGraw-Hill Companies12-9
Money
Defined
Money
Supply
Federal
Reserve
System
Financial
Institutions
Last Word
Key Terms
End Show
Key Terms• medium of exchange
• unit of account
• store of value
• M1
• token money
• Federal Reserve Notes
• checkable deposits
• commercial banks
• thrift institutions
• near-monies
• M2
• savings account
• money market deposit account (MMDA)
• time deposits
• money market mutual fund (MMMF)
• MZM
• legal tender
• Federal Reserve System
• Board of Governors
• Federal Reserve Banks
• Federal Open Market Committee (FOMC)
• financial services industry
• electronic payments

Copyright 2008 The McGraw-Hill Companies12-10
Money
Defined
Money
Supply
Federal
Reserve
System
Financial
Institutions
Last Word
Key Terms
End Show
Next Chapter Preview…
Money Creation
Copyright 2008 The McGraw-Hill Companies13-1
The
Fractional
Reserve
System
Creating a
Bank
Money
Creation
The Banking
System
Monetary
Multiplier
Last Word
Key Terms
End Show
13
Money
Creation
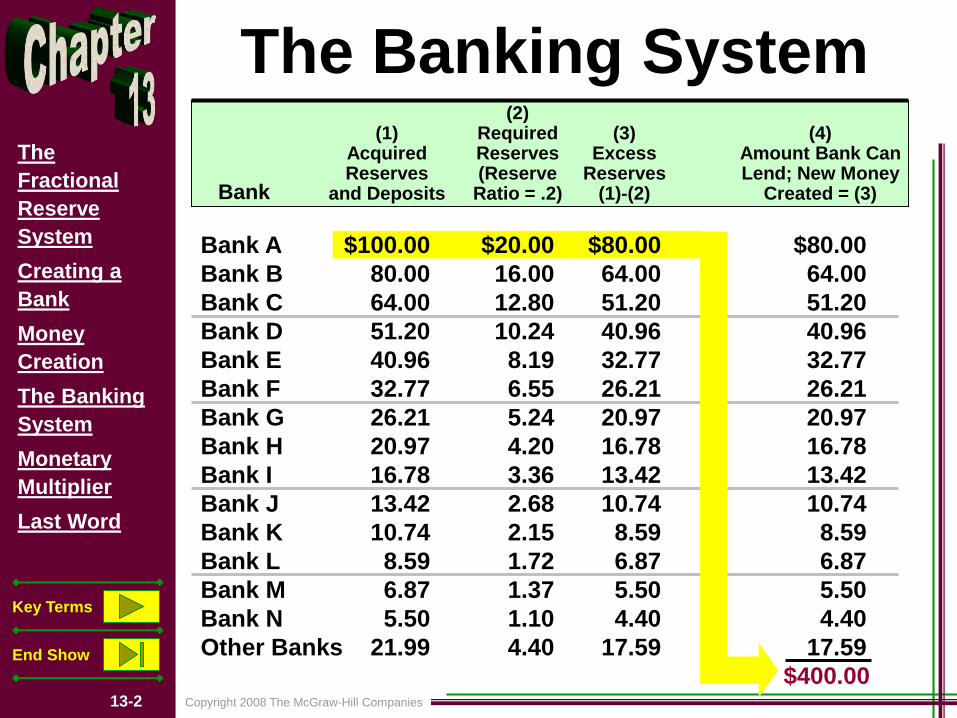
Copyright 2008 The McGraw-Hill Companies13-2
The
Fractional
Reserve
System
Creating a
Bank
Money
Creation
The Banking
System
Monetary
Multiplier
Last Word
Key Terms
End Show
The Banking System
Bank A
Bank B
Bank C
Bank D
Bank E
Bank F
Bank G
Bank H
Bank I
Bank J
Bank K
Bank L
Bank M
Bank N
Other Banks
Bank
(1)AcquiredReserves
and Deposits
(2)RequiredReserves(Reserve
Ratio = .2)
(3)Excess
Reserves(1)-(2)
(4)Amount Bank CanLend; New Money
Created = (3)
$100.00
80.00
64.00
51.20
40.96
32.77
26.21
20.97
16.78
13.42
10.74
8.59
6.87
5.50
21.99
$20.00
16.00
12.80
10.24
8.19
6.55
5.24
4.20
3.36
2.68
2.15
1.72
1.37
1.10
4.40
$80.00
64.00
51.20
40.96
32.77
26.21
20.97
16.78
13.42
10.74
8.59
6.87
5.50
4.40
17.59
$80.00
64.00
51.20
40.96
32.77
26.21
20.97
16.78
13.42
10.74
8.59
6.87
5.50
4.40
17.59
$400.00
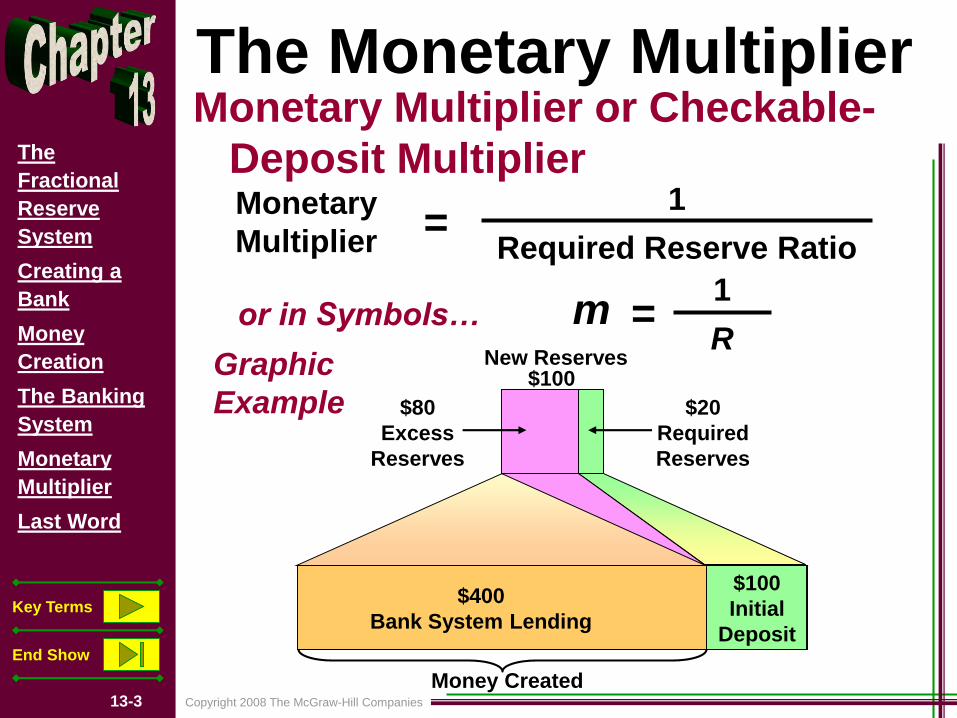
Copyright 2008 The McGraw-Hill Companies13-3
The
Fractional
Reserve
System
Creating a
Bank
Money
Creation
The Banking
System
Monetary
Multiplier
Last Word
Key Terms
End Show
The Monetary MultiplierMonetary Multiplier or Checkable-
Deposit MultiplierMonetary
Multiplier=
1
Required Reserve Ratio
or in Symbols… m =1
RNew Reserves
$100
$20
Required
Reserves
$80
Excess
Reserves
$100
Initial
Deposit
$400
Bank System Lending
Money Created
Graphic
Example

Copyright 2008 The McGraw-Hill Companies13-4
The
Fractional
Reserve
System
Creating a
Bank
Money
Creation
The Banking
System
Monetary
Multiplier
Last Word
Key Terms
End Show
Key Terms
• fractional reserve banking
system
• balance sheet
• vault cash
• required reserves
• reserve ratio
• excess reserves
• actual reserves
• Federal funds rate
• monetary multiplier
Copyright 2008 The McGraw-Hill Companies13-5
The
Fractional
Reserve
System
Creating a
Bank
Money
Creation
The Banking
System
Monetary
Multiplier
Last Word
Key Terms
End Show
Next Chapter Preview…
Interest Ratesand MonetaryPolicy
Copyright 2008 The McGraw-Hill Companies14-1
Interest Rates
Consolidated
Balance Sheet
of the Federal
Reserve Banks
Tools of
Monetary
Policy
Targeting the
Federal Funds
Rate
Monetary
Policy
The Big
Picture
Last Word
Key Terms
End Show
14
Interest Rates and
Monetary Policy
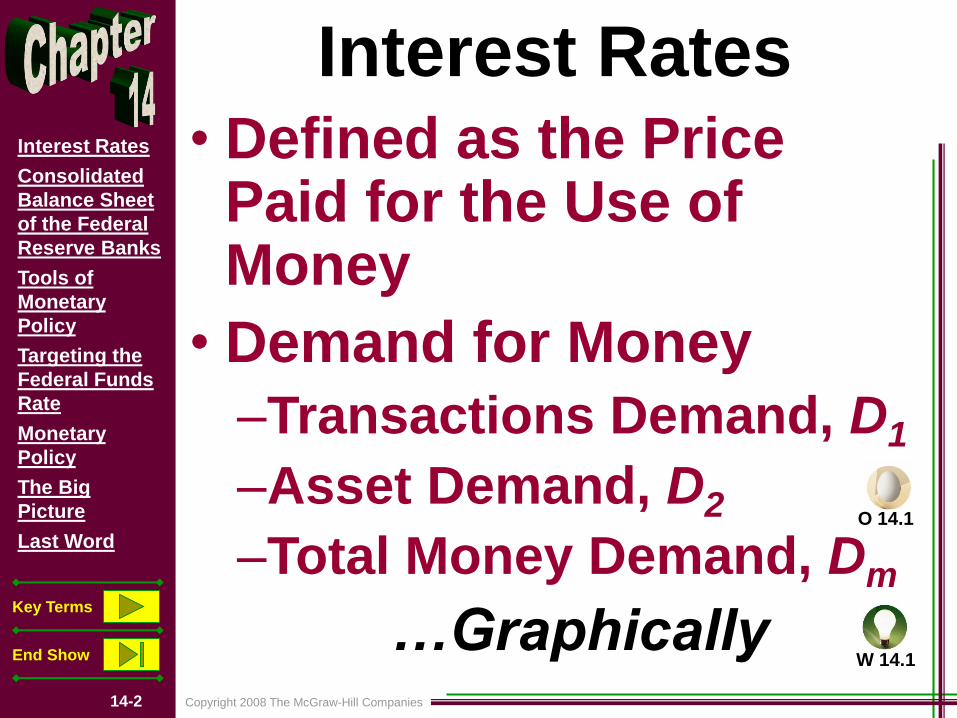
Copyright 2008 The McGraw-Hill Companies14-2
Interest Rates
Consolidated
Balance Sheet
of the Federal
Reserve Banks
Tools of
Monetary
Policy
Targeting the
Federal Funds
Rate
Monetary
Policy
The Big
Picture
Last Word
Key Terms
End Show
Interest Rates• Defined as the Price
Paid for the Use of Money
• Demand for Money
–Transactions Demand, D1
–Asset Demand, D2
–Total Money Demand, Dm
…Graphically
O 14.1
W 14.1

Copyright 2008 The McGraw-Hill Companies14-3
Interest Rates
Consolidated
Balance Sheet
of the Federal
Reserve Banks
Tools of
Monetary
Policy
Targeting the
Federal Funds
Rate
Monetary
Policy
The Big
Picture
Last Word
Key Terms
End Show
Interest RatesDemand for Money and the Money Market
Rate
of
Inte
res
t, I
pe
rce
nt
10
7.5
5
2.5
050 100 150 200 50 100 150 200 50 100 150 200 250 300
Amount of Money
Demanded
(Billions of Dollars)
Amount of Money
Demanded
(Billions of Dollars)
Amount of Money
Demanded and Supplied
(Billions of Dollars)
=+
(a)TransactionsDemand forMoney, Dt
(b)Asset
Demand forMoney, Da
(c)Total
Demand forMoney, Dm
And Supply
Dt Da Dm
Sm
5

Copyright 2008 The McGraw-Hill Companies14-4
Interest Rates
Consolidated
Balance Sheet
of the Federal
Reserve Banks
Tools of
Monetary
Policy
Targeting the
Federal Funds
Rate
Monetary
Policy
The Big
Picture
Last Word
Key Terms
End Show
Tools of Monetary Policy• Open Market Operations–Buying Securities
• From Commercial Banks
• From the Public
–Selling Securities• To Commercial Banks
• To the Public
• When the Fed Sells Securities, Commercial Bank Reserves are Reduced
O 14.2
W 14.3

Copyright 2008 The McGraw-Hill Companies14-5
Interest Rates
Consolidated
Balance Sheet
of the Federal
Reserve Banks
Tools of
Monetary
Policy
Targeting the
Federal Funds
Rate
Monetary
Policy
The Big
Picture
Last Word
Key Terms
End Show
Tools of Monetary Policy
New Reserves$1000
$5000
Bank System Lending
Total Increase in the Money Supply, ($5,000)
Fed Buys $1,000 Bond from
a Commercial Bank
$1000
Excess
Reserves
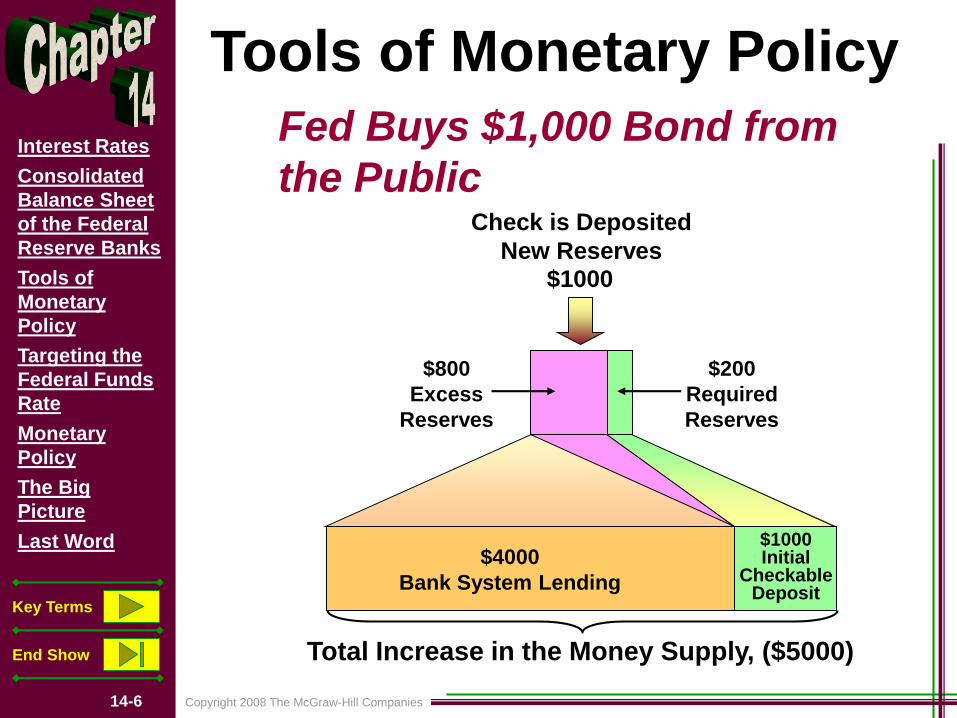
Copyright 2008 The McGraw-Hill Companies14-6
Interest Rates
Consolidated
Balance Sheet
of the Federal
Reserve Banks
Tools of
Monetary
Policy
Targeting the
Federal Funds
Rate
Monetary
Policy
The Big
Picture
Last Word
Key Terms
End Show
Tools of Monetary Policy
Check is Deposited
New Reserves
$1000
Total Increase in the Money Supply, ($5000)
Fed Buys $1,000 Bond from
the Public
$200
Required
Reserves
$800
Excess
Reserves
$1000Initial
CheckableDeposit
$4000
Bank System Lending
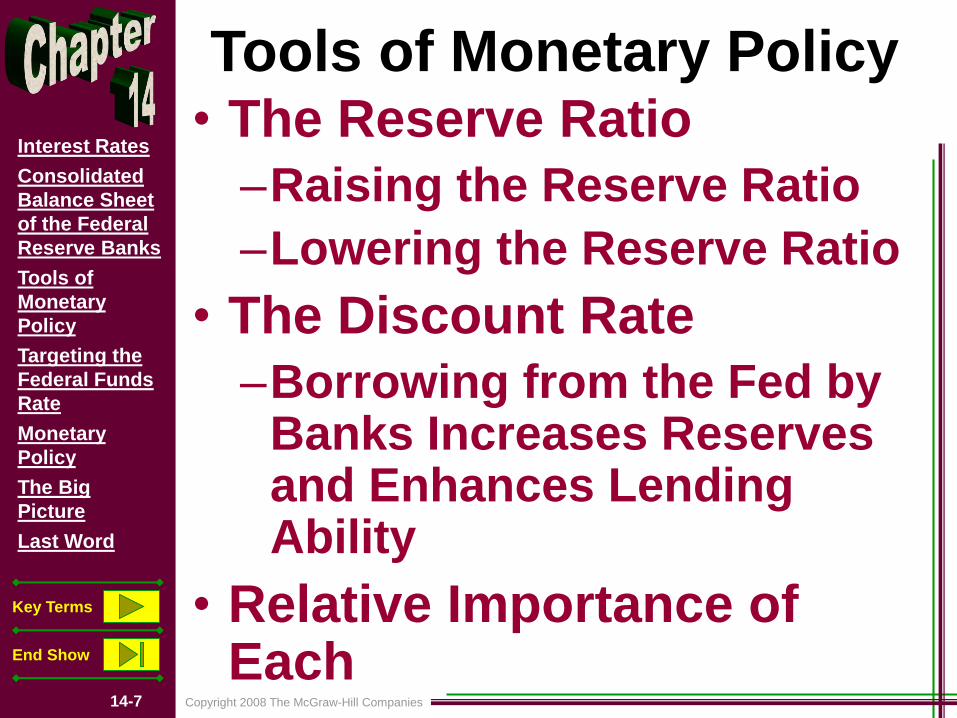
Copyright 2008 The McGraw-Hill Companies14-7
Interest Rates
Consolidated
Balance Sheet
of the Federal
Reserve Banks
Tools of
Monetary
Policy
Targeting the
Federal Funds
Rate
Monetary
Policy
The Big
Picture
Last Word
Key Terms
End Show
Tools of Monetary Policy• The Reserve Ratio
–Raising the Reserve Ratio
–Lowering the Reserve Ratio
• The Discount Rate
–Borrowing from the Fed by Banks Increases Reserves and Enhances Lending Ability
• Relative Importance of Each
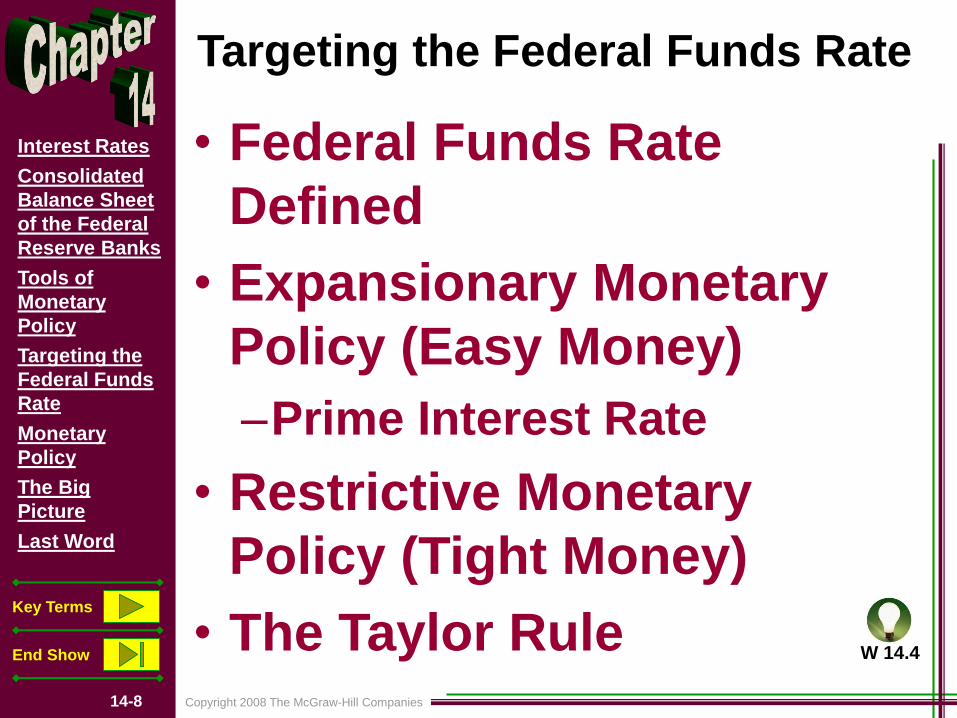
Copyright 2008 The McGraw-Hill Companies14-8
Interest Rates
Consolidated
Balance Sheet
of the Federal
Reserve Banks
Tools of
Monetary
Policy
Targeting the
Federal Funds
Rate
Monetary
Policy
The Big
Picture
Last Word
Key Terms
End Show
Targeting the Federal Funds Rate
• Federal Funds Rate
Defined
• Expansionary Monetary
Policy (Easy Money)
–Prime Interest Rate
• Restrictive Monetary
Policy (Tight Money)
• The Taylor Rule W 14.4

Copyright 2008 The McGraw-Hill Companies14-9
Interest Rates
Consolidated
Balance Sheet
of the Federal
Reserve Banks
Tools of
Monetary
Policy
Targeting the
Federal Funds
Rate
Monetary
Policy
The Big
Picture
Last Word
Key Terms
End Show
Monetary Policy• Cause-Effect Chain
• Market for Money
• Investment
• Equilibrium GDP
• Effects of an Expansionary
Monetary Policy
• Effects of a Restrictive
Monetary Policy
G 14.2
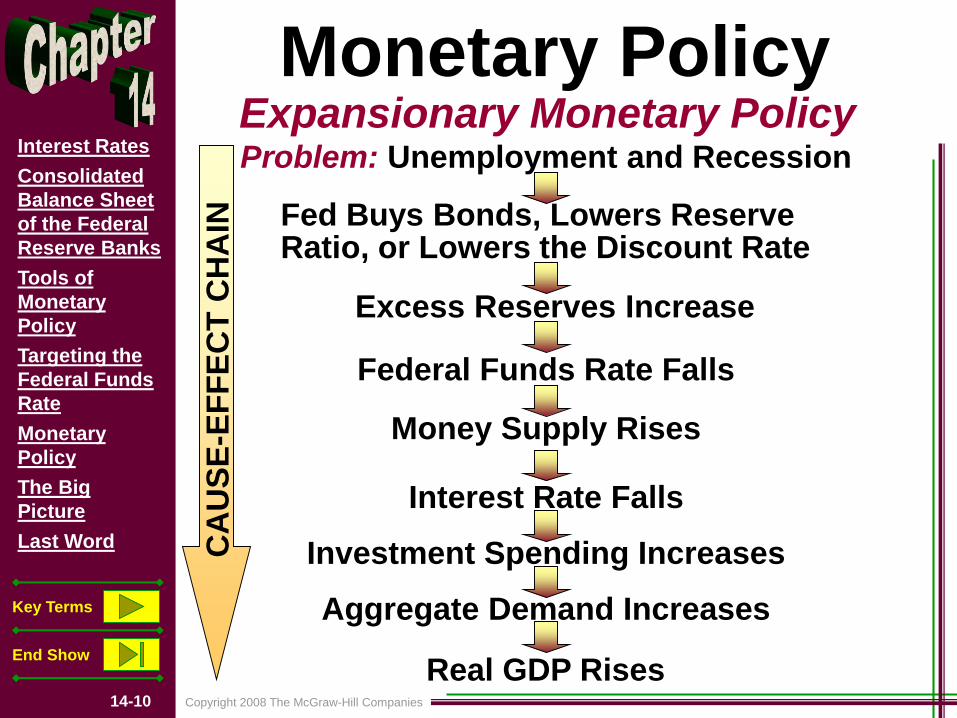
Copyright 2008 The McGraw-Hill Companies14-10
Interest Rates
Consolidated
Balance Sheet
of the Federal
Reserve Banks
Tools of
Monetary
Policy
Targeting the
Federal Funds
Rate
Monetary
Policy
The Big
Picture
Last Word
Key Terms
End Show
Monetary PolicyExpansionary Monetary PolicyProblem: Unemployment and Recession
Fed Buys Bonds, Lowers ReserveRatio, or Lowers the Discount Rate
Excess Reserves Increase
Federal Funds Rate Falls
Money Supply Rises
Interest Rate Falls
Investment Spending Increases
Aggregate Demand Increases
Real GDP Rises
CA
US
E-E
FF
EC
T C
HA
IN

Copyright 2008 The McGraw-Hill Companies14-11
Interest Rates
Consolidated
Balance Sheet
of the Federal
Reserve Banks
Tools of
Monetary
Policy
Targeting the
Federal Funds
Rate
Monetary
Policy
The Big
Picture
Last Word
Key Terms
End Show
Monetary PolicyRestrictive Monetary PolicyProblem: Inflation
Fed Sells Bonds, Increases ReserveRatio, or Increases the Discount Rate
Excess Reserves Decrease
Federal Funds Rate Rises
Money Supply Falls
Interest Rate Rises
Investment Spending Decreases
Aggregate Demand Decreases
Inflation Declines
CA
US
E-E
FF
EC
T C
HA
IN

Copyright 2008 The McGraw-Hill Companies14-12
Interest Rates
Consolidated
Balance Sheet
of the Federal
Reserve Banks
Tools of
Monetary
Policy
Targeting the
Federal Funds
Rate
Monetary
Policy
The Big
Picture
Last Word
Key Terms
End Show
AD-AS Theory of Price Level - Real Output and Stabilization Policy
Levels of
Output,
Employment,
Income, and
Prices
Aggregate
Demand
Aggregate
Supply
Input
Resources
With Prices
Productivity
Sources
Legal-
Institutional
Environment
Consumption
(Cd)
Investment
(Ig)
Net Export
Spending
(Xn)
Government
Spending
(G)

Copyright 2008 The McGraw-Hill Companies14-13
Interest Rates
Consolidated
Balance Sheet
of the Federal
Reserve Banks
Tools of
Monetary
Policy
Targeting the
Federal Funds
Rate
Monetary
Policy
The Big
Picture
Last Word
Key Terms
End Show
Key Terms
• monetary policy
• transaction demand
• asset demand
• total demand for money
• reserve ratio
• discount rate
• Federal funds rate
• expansionary monetary policy
• Taylor rule
• cyclical asymmetry
• inflation targeting