CHAPTER 1 Literature review The delivery of Primary Health ...
100
1 CHAPTER 1 Literature review The delivery of Primary Health Care to children 1.1 Introduction While the concept of primary health care (PHC) as the preferred strategy to deliver health care to communities, including children, was already being practiced in many settings, including districts in South Africa by the 1930s, it was the Alma Ata meeting in 1978 that first offered the approach a global prominence.(1) The South African government embraced this approach, and it formed the backbone of the first democratically elected government’s health policy in 1994.(1;2) Since then, various additions have been incorporated, including offering primary health care at no cost, not only for children, but the entire populace. This chapter defines the concept of primary health care; summarises the successes and failures of paediatric primary care delivery in low and middle-income countries, including the Integrated Management of Childhood Illness (IMCI) strategy; reviews the South African literature on paediatric primary care; and concludes by describing key elements of quality assurance, as it relates to primary health care. 1.2 What is primary health care? Primary health care was described in the 1978 Declaration of Alma-Ata as: “essential health care based on practical, scientifically sound and socially acceptable methods and technology made universally accessible to individuals and families in the community through their full participation and at a cost that the community and country can afford to maintain at every stage of their development in the spirit of self-reliance and self
Transcript of CHAPTER 1 Literature review The delivery of Primary Health ...

1
CHAPTER 1
Literature review
The delivery of Primary Health Care to children
1.1 Introduction
While the concept of primary health care (PHC) as the preferred strategy to deliver
health care to communities, including children, was already being practiced in many
settings, including districts in South Africa by the 1930s, it was the Alma Ata meeting
in 1978 that first offered the approach a global prominence.(1) The South African
government embraced this approach, and it formed the backbone of the first
democratically elected government’s health policy in 1994.(1;2) Since then, various
additions have been incorporated, including offering primary health care at no cost, not
only for children, but the entire populace.
This chapter defines the concept of primary health care; summarises the successes and
failures of paediatric primary care delivery in low and middle-income countries,
including the Integrated Management of Childhood Illness (IMCI) strategy; reviews the
South African literature on paediatric primary care; and concludes by describing key
elements of quality assurance, as it relates to primary health care.
1.2 What is primary health care?
Primary health care was described in the 1978 Declaration of Alma-Ata as: “essential
health care based on practical, scientifically sound and socially acceptable methods and
technology made universally accessible to individuals and families in the community
through their full participation and at a cost that the community and country can afford
to maintain at every stage of their development in the spirit of self-reliance and self

2
determination. It forms an integral part both of the country’s health system, of which it
is the central function and main focus, and of the overall social and economic
development of the community. It is the first level of contact of individuals, the family
and community with the national health system bringing health care as close as possible
to where people live and work, and constitutes the first element of a continuing health
care process.”(3)
Primary health care is the first point of contact with the health system and involves the
provision of integrated, accessible health care services by a variety of providers in the
health sector. It includes care given on first contact and in ambulatory settings. Primary
care services encompass preventative, promotive, curative, supportive and rehabilitation
services. These services, provided by professionals from different disciplines, attempt to
enhance the individual’s physical, mental, emotional and spiritual well-being, and
address factors that influence their health. The services are usually designed to deliver
services in conjunction with community service providers.
Primary health care services encompass the general health of a population. Most poor
and middle income nations’ disease burdens are managed by primary health care
services.(4) Primary health care constitutes the foundation of the health care delivery
system in these countries and is accepted as the best model for delivering basic health
care to their populations. (5;6)
1.3 Assessing PHC performance
Many factors undermine the quality and efficiency of primary health care services in
developing countries. If patients find public primary care clinics poorly staffed, lacking
medicines, and poorly organised, they may under utilise primary health care clinics and
go ‘up the chain’ to a higher level, often to more costly public hospitals, or to the
private sector.(4)
There are several indicators of poor quality of health care. These include overall
management weaknesses, technical incompetence, lack of drugs owing to

3
mismanagement of drug supply, drug leakage or illegal drug selling, poor attitudes and
behavior of health staff, low staff motivation and morale, and insufficient supervision.
The major challenge is thus how to approach and improve such a detrimental state of
affairs. High morbidity and mortality rates in patients attending PHC can sometimes be
ascribed to poor health worker skills and inappropriate diagnosis and treatment.(7)
Medical technology may be incorrectly utilised and funds inappropriately focussed onto
high-tech equipment to deal with basic health problems. Health care facilities may lack
essential drugs on an ongoing basis which proves detrimental to patients’ well-being.
The performance of primary health care systems have traditionally been assessed in
terms of coverage of services with little attention to the quality of the services
provided.(5) The ability to assess the quality of care provided is an essential component
of quality assurance and improving quality. Ehiri, et al. argue that inadequacy in the
quality of health service delivery at the primary health care level is a product of failures
in a range of quality measures - structural problems, process failings and a lack of a
protocol for systematic supervision of health workers.(5)
The conceptual framework for assessing quality of care developed by Donabedian in
1988 is still a major reference point.(8) Donabedian’s conceptual framework consists of
three main perspectives:
1. Structure- this involves assessing the adequacy of facilities and equipment,
administrative process, quality and quantity of health personnel in terms of their
medical training.
2. Process – this includes adherence to good medical care: clinical history, physical
examination, diagnostic tests, justifications of diagnosis and therapy, technical
competence, evidence of preventative management, co-ordination and continuity
of care, acceptability of care to the recipient. At community level, this includes the
quality of performance of health personnel with regards to managing acute
problems such as acute respiratory infections and diarrhoea in children.
3. Outcome- considers whether a change in a person’s current and future health
status can be attributed to health care received. Measuring of infant mortality and
maternal mortality or quality of health are other means of reflecting the impact of
the health system on community health.(9;10)

4
In 1995, the World Bank attempted to operationalise Donabedian’s concept in
developing countries.(8) Indicators that have been frequently used to assess the quality
of primary health care in developing countries are structural aspects of the health care
infrastructure and improved availability and access to drugs.(8) Technical quality is
assessed by evaluating the health workers performance skills and ability to correctly
diagnose and treat illnesses.(8)
Donabedian argues that the interpersonal process is a vehicle by which technical care is
implemented and on which its success depends and therefore, interpersonal quality of
service provision is an essential part of the process of health care provision.(8) Almost
no attention has been focussed on the importance of attitudes and behaviour of health
professionals in the provision of health care in developing countries.
There is a recognisable inability of consumers to assess the technical quality of services
and their acceptance of quality of care is based on service availability, waiting times,
provider’s attitudes and costs of care rather than medical competence.(10-12)
1.4 Quality of paediatric PHC in developing countries
Recent findings suggest that despite the availability of effective and affordable
guidelines for the management of children in primary health care facilities, the quality
and coverage of these services remain low.(13) Good quality of paediatric care in both
outpatient and inpatient services of health facilities at first referral, is essential for a
credible and efficient primary health care system.(7) Most studies emphasise that there
is poor child health care delivery in many developing countries and key findings of
these studies are described in table 1.1. Consistent areas of concern are incorrect
diagnosis and assessments, misuse and inappropriate prescription of drugs and long
waiting hours. The need to focus on improving primary health care delivery is
mandatory in all developing countries.

5
Table 1.1: Key findings of previous studies on primary health care facilities in
developing countries
Author,
year, country
Study Key finding(s) Ref
Arifeen SE, et al., 2005, Bangladesh
Quality of care for under-fives in first-level health facilities in one district of Bangladesh.
• The quality of care offered to sick children in these facilities was very poor even without the IMCI strategy being utilised.
• Antibiotics were both overused and underused.
(14)
Boonstra E, et al., 2005, Botswana
Adherence to management guidelines in acute respiratory infections and diarrhoea in children under 5 years old in primary health care in Botswana.
• Health care provider’s adherence to guidelines on history taking was suboptimal in acute respiratory infection and diarrhoea, and poor on examination in both conditions.
• A high level of inappropriate antibiotic prescriptions was present in both conditions.
(15)
Rowe AK,
et al., 2005, Benin
Management of childhood illness at health facilities in Benin: problems and their causes.
• Incomplete assessment of children’s signs and symptoms
• Incorrect diagnosis and treatment of potentially life threatening illnesses
• Inappropriate prescription of dangerous sedatives
• Missed opportunities to vaccinate
• Failure to refer severely ill children for hospitalisation
(16)
Lewis M, et al., 2004,
El Salvador
Primary health care in practice: is it effective?
• Long waiting hours with an average of 3 hours
• Inaccessibility of health services and their limited hours of operation.
• Lack of staff and resources, especially medication
• Poor infrastructure and limited road access to clinics
(6)

6
Ehiri JE, et al., 2005, Nigeria
Quality of child health services in primary health care facilities in south-east Nigeria.
• Long waiting time
• Lack of essential drugs
• Poor attitude of health workers
• Facilities for emergency care was lacking
• Facilities were adequately equipped to provide immunisation services and to manage diarrhoea but not for other aspects of care.
(5)
1.5 The impact of IMCI on quality of paediatric care in developing
countries
The introduction of the IMCI strategy by WHO and UNICEF aims to improve skills of
health workers, the health system itself; and also the knowledge and practices of
families in relation to their young children.(17) Each year approximately 10 million
children less than 5 years of age in developing countries die from one of the following 5
conditions: pneumonia, diarrhoea, malaria, measles and malnutrition. Other causes of
under five mortality include neonatal causes and HIV/AIDS.(18) To reduce child
mortality, the IMCI strategy was developed and targeted these five diseases. Besides
these major childhood illnesses, mortality and unnecessary morbidity of children is due
to poor quality of health care provided to children. Surveys performed prior to the IMCI
intervention reveal that many sick children were not properly assessed and treated by
health care providers, and that their parents were poorly advised.(7)
In Benin, Rowe et al. surveyed all health facilities in Que’me’. They concluded that
assessment of children’s clinical signs and symptoms were incomplete, diagnosis and
treatment of potentially life-threatening illnesses were incorrect, opportunities to
vaccinate were missed, and severely ill children were not referred for hospitalisation.
Even when health workers prescribed the correct medicine, caregivers rarely left health
facilities with both the medicine in hand and the knowledge of how to give it.(16)

7
IMCI emphasizes the comprehensive care of children. Critical elements of IMCI include
clinic access, availability of essential supplies and health worker performance including
their behaviour and rapport toward patients.(19) IMCI’s first implementation step is an
inventory of the level of quality of services currently delivered in a setting.
Measurements of immunisation rates, compliance with the chart-booklets, treatment and
counselling protocols, and numbers of children weighed during their primary care visits
are important in assessing the standard of achievements with the IMCI process. By
measuring and reporting how facilities function and by using that information to
identify both successful and unsuccessful innovations in care; participating developing
countries have in fact put in place an essential first component of a strategy to monitor
and improve the overall quality of their health system for children by utilising
IMCI.(19)
The benefits of training health workers in IMCI appear to include more rational drug
use, increased attendances, improved health care provider morale, and improved
perceptions of quality of care by mothers.(17) An evaluation in Uganda showed that
health workers trained through the programme shared their knowledge and skills with
other staff, immunisation services improved, weighing of children increased from below
50% to 85% after training, and that despite problems with drug supply, the use of first
line drugs increased. Health workers felt more confident because their skills and
classification of disease had improved.(17) In Zambia, health workers correctly
managed less than 5% of cases of diarrhoeal disease before IMCI training. After
training they appropriately managed 82% of cases at three month follow-up, although
this had decreased to 60% after 1 year.(17)
The Multi-country Evaluation of IMCI Effectiveness, Cost and Impact progress report
described substantial improvements in health worker performance in Tanzania, Uganda
and Brazil after IMCI implementation.(20) These observation-based surveys proved that
IMCI training is an effective intervention to improve the rational use of antibiotics for
sick children visiting primary health care facilities in developing countries.(8;20)
A study performed by Chopra et al. across four districts in Cape Town, South Africa
concluded that IMCI is associated with improvements in some important aspects of care
and under normal operating conditions and in context of good facility infrastructure and
8
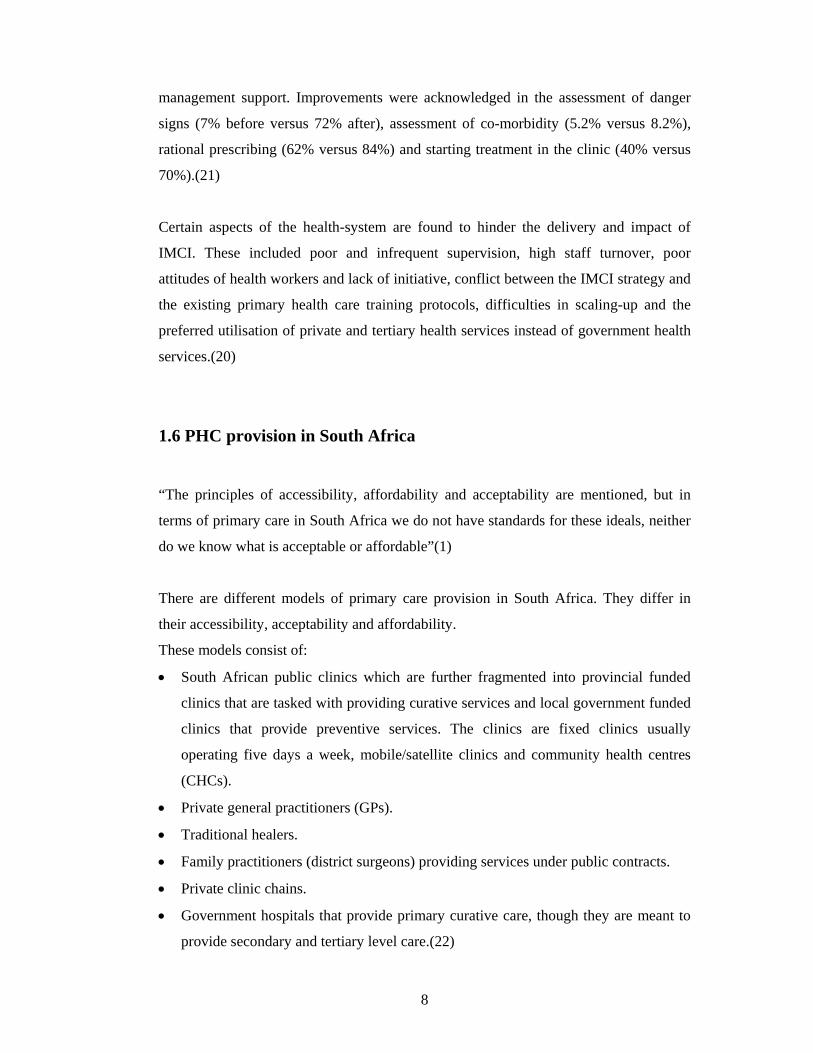
management support. Improvements were acknowledged in the assessment of danger
signs (7% before versus 72% after), assessment of co-morbidity (5.2% versus 8.2%),
rational prescribing (62% versus 84%) and starting treatment in the clinic (40% versus
70%).(21)
Certain aspects of the health-system are found to hinder the delivery and impact of
IMCI. These included poor and infrequent supervision, high staff turnover, poor
attitudes of health workers and lack of initiative, conflict between the IMCI strategy and
the existing primary health care training protocols, difficulties in scaling-up and the
preferred utilisation of private and tertiary health services instead of government health
services.(20)
1.6 PHC provision in South Africa
“The principles of accessibility, affordability and acceptability are mentioned, but in
terms of primary care in South Africa we do not have standards for these ideals, neither
do we know what is acceptable or affordable”(1)
There are different models of primary care provision in South Africa. They differ in
their accessibility, acceptability and affordability.
These models consist of:
• South African public clinics which are further fragmented into provincial funded
clinics that are tasked with providing curative services and local government funded
clinics that provide preventive services. The clinics are fixed clinics usually
operating five days a week, mobile/satellite clinics and community health centres
(CHCs).
• Private general practitioners (GPs).
• Traditional healers.
• Family practitioners (district surgeons) providing services under public contracts.
• Private clinic chains.
• Government hospitals that provide primary curative care, though they are meant to
provide secondary and tertiary level care.(22)

9
The community health centres were developed in the early 1930’s by the local authority
but is currently run by the provincial authority predominantly. After 1976, primary
health care sisters were trained and introduced into clinics. These nursing sisters now
primarily manage the primary health care clinics whilst the doctors are consulted for
problematic cases.(1)
During 1988 to 1990, there was a decline in the number of people attending clinics.(1)
The postulated reasons were:
• An increase in the number of private general practitioners
• The increase in the number of people on medical aid
• The increase in clinic fees
• Preference for general practitioners over primary health care workers
However, in 1994 user fees for children aged under 6 years and pregnant women were
removed; and thereafter, in 1997, all user fees at primary health care clinics were
abolished. These policies were implemented to provide health services that were
accessible to the entire South African nation including the very poor.(2;23)
1.7 What are the problems with health services in South Africa?
The introduction of free health care for all at clinics led to congestion in clinics and a
reduction in consultation time.(2;23) Clinic health workers felt pressurised into
shortening the consultation time and as a result found their jobs frustrating and tiring.(2)
Wilkinson, et al. investigated the impact of user fees policy changes on clinic
attendance patterns in Hlabisa health district in rural South Africa. Attendance at
curative services increased but declined for preventative services. This was worrisome
because “if vaccine coverage is low due to poor attendance, outbreaks of vaccine-
preventable diseases may occur.”(23)
The major issues of local primary health care facilities are accessibility and the patients’
perceptions of the quality of these services. In a study on the utilisation of primary
curative services in Diepkloof, Soweto; comparison of opinions on service attributes

10
between clinic users and general practitioner users were described and ranked. Both
groups of users, ranked services in exactly the same order as follows: attitudes of health
workers, the kind of treatment, the waiting time, continuity of treatment by the same
person and distance to the service.(1) Mills study on the performance of different
models of primary care provision in Southern Africa is supported by the evidence
provided by Bachmann(24), Goldstein(1) and Netshandama(2). Her work confirmed
that services provided by the state lead to longer waiting times, shorter consultation
times and thus poor acceptability of care to users.(22)
An initial study on the assessment of the quality of care of primary health care services
in six study sites, both urban and rural, in South Africa was performed between 1992
and 1993 and results were published in 1996.(25) Based on the recommendations of this
study, a project was undertaken to improve quality of care in public clinics in North-
west province from August 1996 to March 1998. The main achievements of this study
were improvements in drug supplies; better integration of service delivery; better
technical performance and improved attitudes towards patients and the community. This
study concluded that there is a need for constant quality assessments. However, a major
concern at the end of the study was how to sustain the improvements achieved.(8)
1.8 Research on child PHC services in South Africa
Research has been conducted in South Africa concentrating on different aspects of child
health services offered at primary health care clinics. Bachmann conducted studies at
the community health centre in Khayelitsha, Cape Town and focussed on the analysis of
waiting times and queues at the clinic(24); reasons for missed opportunities at the
clinic(26) and paediatric utilization of a teaching hospital over the community health
centre(27). The median waiting times at the clinic in both the curative and preventive
services were long (4.1 hours and 2.6 hours respectively). The major problem
encountered was the separation of preventive and curative services. Improvements made
were staggering of staff tea and lunch breaks so as to maintain patient flow and
designated child health sessions were extended from 2.5 to 4 days per week. Thirteen
11
months later, patient flows and work processes were analysed and the changes proved to
decrease waiting times for the preventative services only.(24)
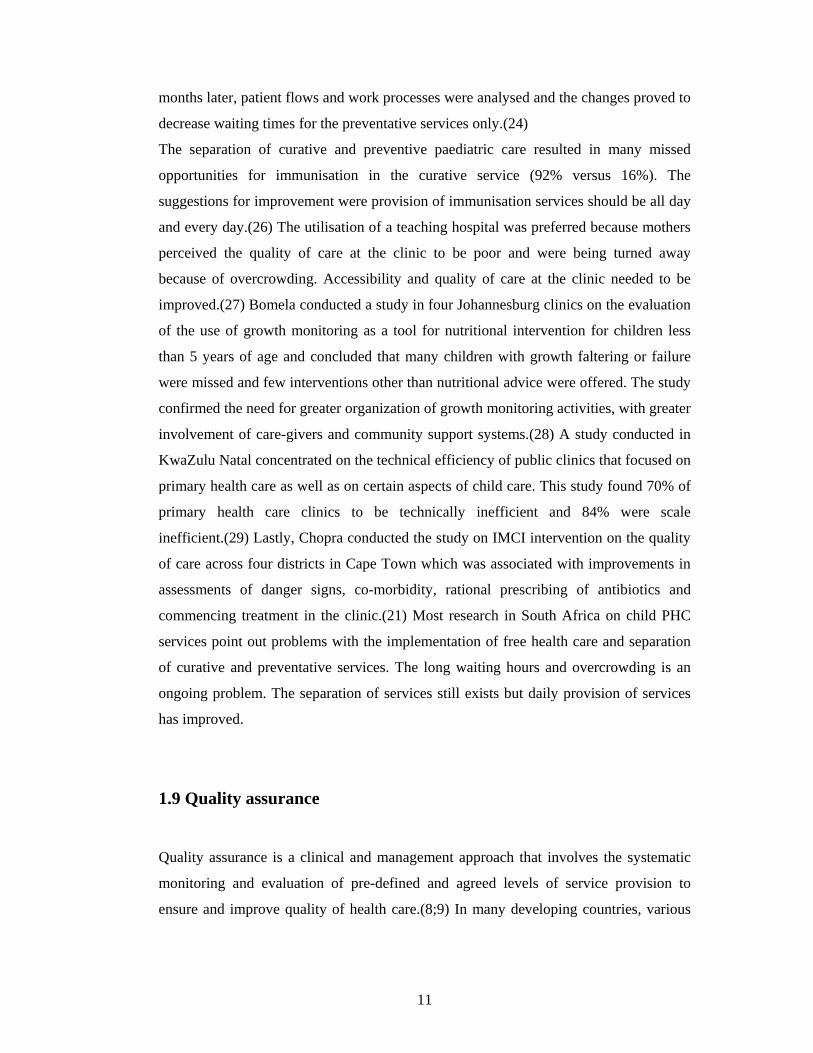
The separation of curative and preventive paediatric care resulted in many missed
opportunities for immunisation in the curative service (92% versus 16%). The
suggestions for improvement were provision of immunisation services should be all day
and every day.(26) The utilisation of a teaching hospital was preferred because mothers
perceived the quality of care at the clinic to be poor and were being turned away
because of overcrowding. Accessibility and quality of care at the clinic needed to be
improved.(27) Bomela conducted a study in four Johannesburg clinics on the evaluation
of the use of growth monitoring as a tool for nutritional intervention for children less
than 5 years of age and concluded that many children with growth faltering or failure
were missed and few interventions other than nutritional advice were offered. The study
confirmed the need for greater organization of growth monitoring activities, with greater
involvement of care-givers and community support systems.(28) A study conducted in
KwaZulu Natal concentrated on the technical efficiency of public clinics that focused on
primary health care as well as on certain aspects of child care. This study found 70% of
primary health care clinics to be technically inefficient and 84% were scale
inefficient.(29) Lastly, Chopra conducted the study on IMCI intervention on the quality
of care across four districts in Cape Town which was associated with improvements in
assessments of danger signs, co-morbidity, rational prescribing of antibiotics and
commencing treatment in the clinic.(21) Most research in South Africa on child PHC
services point out problems with the implementation of free health care and separation
of curative and preventative services. The long waiting hours and overcrowding is an
ongoing problem. The separation of services still exists but daily provision of services
has improved.
1.9 Quality assurance
Quality assurance is a clinical and management approach that involves the systematic
monitoring and evaluation of pre-defined and agreed levels of service provision to
ensure and improve quality of health care.(8;9) In many developing countries, various

12
actions have been taken to look into quality of primary health care, through either
research and development or full blown quality assurance.(30)
Two frequently utilised patterns of assessing quality of care are the observed and
perceived methods. The observed quality of care concentrates on structural and process
measures and focuses on standards of care and refers to whether health care services
adhere to these standards. Perceived quality of care concentrates on the views of
patients which seem to be of more importance in determining quality of care and has a
strong influence on utilisation patterns. Hence, studying patients’ perceptions of quality
of care may be the key to influence the respective authorities to improve quality of care
and increase the frequency of utilisation of services offered.(30)
The implementation of the elements of quality assurance is one of the methods of
improving quality of care. The two elements are quality assessment and total quality
management or continuous quality improvement. Quality assessment entails
measurement of actual performance and comparison with expected and normative
performance standards. Quality management means implementing changes to health
services to improve the quality of care delivered.(8)
Quality assurance targets the different levels of the health service delivery system.
It improves the execution of the health care procedures at the level of primary health
care and hospital care provision. District health systems’ behaviour is improved by
quality assurance through better interaction between hospital and ambulatory services. It
aims at increasing co-ordination of care for individuals and for public health
interventions. Quality assurance encompasses strategic services planning, organisation,
evaluation, appropriateness of services in relation to morbidity and mortality, public-
private mix, regulatory activities and accreditation to improve national health
services.(6)
Quality management can help an organisation to achieve better outcomes with fewer
resources, thus, leading to an increase in effectiveness and appropriateness of quality
care coupled with greater efficiency and cost containment.(9) Essential components of a
quality improvement strategy are standards, assessment tools and driving forces.(7)

13
There are a variety of tools for quality assurance. These consist of certification,
licensing and accreditation to regulate activities; protocols and guidelines to set
standards; training, continuous education, supervision, incentives, peer-review,
complaints’ procedure to improve skills and behaviour of health workers; and health
provider surveys, user and community surveys, record and death review, utilisation
review and technology assessment for quality assessment.(8) Assessing outcomes has
merit both as an indicator of the effectiveness of different interventions and as part of a
monitoring system directed to improving quality of care as well as detecting its
deterioration. Quality assessment studies usually measure one of the three types of
outcomes: medical outcomes, costs, and client satisfaction. For the last mentioned,
patients are asked to assess not their own health status after receiving care but their
satisfaction with the services delivered.(31)
Any quality assurance system must be based on standards and indicators and on the
monitoring of adherence to these standards. Minimum standards should be achievable
and affordable, and must be determined for each of the three components of quality of
care as defined by Donabedian. The main objective of an evaluation is to influence
decisions.(32)
1.10 Conclusion
There are major obstacles toward providing quality health care to children in South
Africa and other low and middle-income countries. These include overall management
weaknesses, technical incompetence, lack of drugs due to mismanagement of drug
supply, drug leakage or illegal drug selling, poor attitudes and behavior of health staff,
low staff motivation and morale, poor and infrequent supervision, staff turnover,
conflict between the IMCI strategy and the existing primary health care training
protocols, difficulties in scaling-up and the preferred utilisation of private and tertiary
health services instead of government health services. Primary health care services
could be targeted for improvement, using the three main perspectives of Donabedian’s
conceptual framework, to ensure a holistic approach to improving the child health care

14
services provided at clinics. Quality assessments and continuous quality improvement
must be implemented to achieve and maintain a high standard of care for children.
15
CHAPTER 2
AIM
The aim of the study was to assess the overall quality of child health services provided
at primary health care facilities in the Johannesburg metropolitan area.
OBJECTIVES
Primary Objective
To evaluate the quality of clinical care provided by health care workers caring for
children; including an assessment of the treatment of common childhood illnesses,
counselling and health promotion.
Secondary Objectives
1. To assess the quality of well baby services such as immunisation, growth promotion
and developmental monitoring.
2. To assess the availability of drug supplies and equipment.
3. To assess the quality of record keeping.
4. To describe the infrastructure available at health facilities and the availability of
services provided to children, including appropriate referral services.
STUDY METHODS
Study design This was a cross-sectional, observational study. It was conducted over a period of seven
weeks from the 10 October 2005 until the 30 November 2005.
Study population The study population consisted of all clinics within the Johannesburg metropolitan area
that offered child health services as part of their primary health care programme. The
Gauteng provincial health department and the local health authority (Johannesburg

16
Metropolitan health department) provide similar services to the same target population
but their responsibility and accountability mechanisms are separate. Child primary care
services offered in the city are therefore fragmented.
The Johannesburg metropolitan area is divided into 11 regions. The regions are served
by 109 fixed clinics; 75 of which belong to the local authority and 23 belong to the
provincial authority. There are eleven community health centres of which nine are
shared by the provincial and local authority and two (Alexander Health Centre and
Witkoppen Health Centre) are run by non-governmental organisations (NGOs).
The community health centres in Johannesburg serve approximately 300 000
people.(33) The services provided by these centres include curative and chronic care,
maternal and child health care; including maternity care, immunisations, health
promotion activities, community outreach, mental health, rehabilitation services and
minor surgical procedures. Some of these services are available for 24 hours a day.
The primary health care clinics in Johannesburg serve approximately 100 000
people.(33) The services provided by these clinics include curative care, maternal and
child health, immunisations, health promotion and community outreach services. These
services are meant to be provided on a daily basis for between 8 to 10 hours. Clinics are
closed on weekends.
Study sample
The study sample consisted of 16 primary health care clinics selected from the 11
regions in the Johannesburg metropolitan area. Four community health centres (CHCs)
and 12 “ordinary” clinics were included in the study. “Ordinary” clinics were fixed
primary health care facilities that provided curative and preventative services and that
were open 5 days a week for at least 8 hours per day and excluded satellite and mobile
clinics. CHCs were randomly selected (clinics coded and numbers pulled from a box).
There are 98 “ordinary” PHCs in Johannesburg. Only 88 “ordinary” primary health
clinics that managed 40 or more patients per day qualified for the study. Clinics that

17
assessed 40 or more patients per day were included in the study as a pragmatic measure,
to reduce the number of visits needed to clinics and maximise the number of
consultations observed. Clinics were first stratified into local and provincial authority
clinics. Thereafter, 12 primary health care clinics were randomly selected (pulled from a
box); nine from the local authority and three from the provincial authority. The sample,
therefore, included 16% (16/99) of the study population. The study population
represented 91% (99/109) of all PHC facilities in Johannesburg.
At each clinic, clinical encounters between health professionals and a child/caregiver
were assessed. Only children under the age of 13 years were included in the study as
children over the age of 13 years are seen and treated as adults at clinics. Encounters
were selected on a convenience basis. The researcher joined the health professional in
the consultation room and selected the session for inclusion in the study as the
child/caregiver entered the consultation room.
Owing to the fragmentation in the services provided by the two different authorities,
certain clinics only provided curative services and others well baby services. However,
both the services are usually provided in close proximity to each other or within the
same vicinity (i.e. a few kilometres apart).
Study measurements
The study had four components. A researcher-developed tool was devised for each of
these components. (see Appendix A-E). The tool consisted of structured checklists.
Grading of certain aspects of the consultations and clinic facilities was implemented
into the checklists. The grading system was based on the following training courses,
national guidelines and protocols:
• Primary health care training course
• Integrated management of childhood illness (IMCI)
• Standard Treatment Guidelines and Essential Drugs List(34)
• Growth monitoring and promotion policy of City of Johannesburg

18
(Appendix I)
• Guidelines for the management of HIV-infected children(35)
• Workshop on screening for developmental disabilities in the pre-school
population: Discussion document(36)
• Expanded programme on immunization (EPI-SA)
• Road to Health Card (RTHC) (Appendix F)
• “Blue” card (Appendix G)
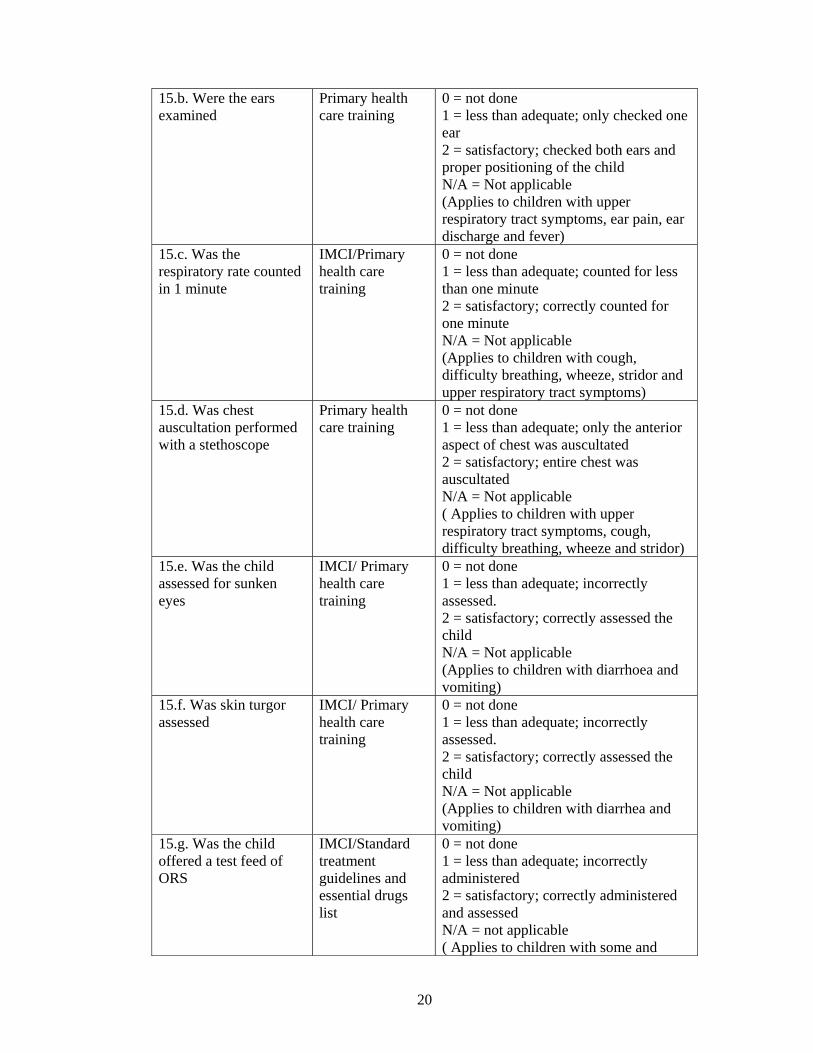
The standard setting for the grading system of the structured checklists is discussed in
table 2.1.
Table 2.1: Standard setting for the grading system of certain aspects of the structured
checklists
TEST/ASSESSMENT
REFERENCE STANDARD
DETAIL/ EXPECTATION
9. Does the health worker greet the caregiver?
IMCI Y = Yes N = No (All caregivers should be greeted)
12.a. Was an adequate history taken?
Primary health care training
0 = poor; only asked why came to clinic 1 = less than adequate; Asked why came to clinic and about the duration of symptoms 2 = satisfactory; asked about the duration, frequency and nature of symptoms, if any medication was taken and if the clinic or general practitioner was visited
12.b. Did the health worker probe about related symptoms?
Primary health care training
0 = poor; did not ask about any related symptoms 1 = less than adequate; Vaguely asked about related symptoms 2 = satisfactory; asked about key information related to the main complaint such as blood in stool or loss of weight and night sweats and fever
12.c. Asked about other symptoms/problems?
Primary health care training
0 = poor; did not ask 1 = less than adequate; asked but did not acknowledge complaint 2 = satisfactory; asked about other symptoms and problems and attempted to address or further enquire about the problem
12.d. Asked about past Primary health 0 = poor; did not ask

19
medical history or illnesses
care training 1 = less than adequate; asked about past medical history but did not get details 2 = satisfactory; relevant and detailed past medical history obtained
13.a. Not able to drink or breastfeed
IMCI Y = Yes N = No ( All children should be assessed or caregivers asked)
13.b. Vomits everything IMCI Y = Yes N = No (All children should be assessed or caregivers asked)
13.c. Convulsions this illness
IMCI Y = Yes N = No (All children should be assessed or caregivers asked)
13.d. Lethargic or unconscious
IMCI Y = Yes N = No N/A ( Not applicable) ( This sign is visibly seen and therefore if children are obviously active or responsive then it was not applicable to check)
14.a. Appropriately undressed
Primary health care training
0 = no clothing removed 1 = less than adequate; trunk exposed only 2 = satisfactory; child was completely exposed except for removal of napkin or underwear ( applies to all children)
14.b. Temperature checked
IMCI/Primary health care training
0 = not done 1 = less than adequate; temperature checked but thermometer not placed for 3 minutes 2 = satisfactory; temperature taken correctly ( applies to all children)
14.c. Was the child examined for pallor
IMCI 0 = not done 1 = Less than adequate; checked but incorrect diagnosis 2 = satisfactory; correctly checked (palms and mucosa) and diagnosed correctly ( Applies to all children)
15.a. Was the throat examined
Standard treatment guidelines and essential drugs list
0 = not done 1 = less than adequate; did not correctly visualize and use the laryngoscope and spatula 2 = satisfactory; correctly checked and visualized the throat N/A = Not applicable ( Applied to children with upper respiratory tract symptoms, sore throat, pain on swallowing and fever)
20
15.b. Were the ears examined
Primary health care training
0 = not done 1 = less than adequate; only checked one ear 2 = satisfactory; checked both ears and proper positioning of the child N/A = Not applicable (Applies to children with upper respiratory tract symptoms, ear pain, ear discharge and fever)
15.c. Was the respiratory rate counted in 1 minute
IMCI/Primary health care training
0 = not done 1 = less than adequate; counted for less than one minute 2 = satisfactory; correctly counted for one minute N/A = Not applicable (Applies to children with cough, difficulty breathing, wheeze, stridor and upper respiratory tract symptoms)
15.d. Was chest auscultation performed with a stethoscope
Primary health care training
0 = not done 1 = less than adequate; only the anterior aspect of chest was auscultated 2 = satisfactory; entire chest was auscultated N/A = Not applicable ( Applies to children with upper respiratory tract symptoms, cough, difficulty breathing, wheeze and stridor)
15.e. Was the child assessed for sunken eyes
IMCI/ Primary health care training
0 = not done 1 = less than adequate; incorrectly assessed. 2 = satisfactory; correctly assessed the child N/A = Not applicable (Applies to children with diarrhoea and vomiting)
15.f. Was skin turgor assessed
IMCI/ Primary health care training
0 = not done 1 = less than adequate; incorrectly assessed. 2 = satisfactory; correctly assessed the child N/A = Not applicable (Applies to children with diarrhea and vomiting)
15.g. Was the child offered a test feed of ORS
IMCI/Standard treatment guidelines and essential drugs list
0 = not done 1 = less than adequate; incorrectly administered 2 = satisfactory; correctly administered and assessed N/A = not applicable ( Applies to children with some and

21
severe dehydration) 15.h. Was the child’s abdomen examined
Primary health care training
0 = not done 1 = less than adequate; incorrectly examined by not lying the child on the bed 2 = satisfactory; correctly positioned and palpated the abdomen N/A = Not applicable (Applies to children complaining of abdominal symptoms)
15.i. Was the perineum examined
Primary health care training
0 = not done 1 = less than adequate; incorrectly examined 2 = satisfactory; correctly examined and exposed; inclusive of palpating the genitals in males N/A = Not applicable (Applies to children complaining of buttock rashes and genital problems)
15.j. Was a urine dipstix done
Primary health care training/ Standard treatment guidelines and essential drug list
0 = not done 1 = less than adequate; incorrectly interpreted 2 = satisfactory; correctly interpreted N/A = Not applicable (Applies to children with lower abdominal complaints, urinary symptoms and fever of unknown origin in infants)
15.k. Was the level of consciousness assessed
IMCI 0 = not done 1 = less than adequate; incorrectly assessed 2 = satisfactory; correctly assessed N/A = not applicable (Applies to children with convulsions and lethargy or unconsciousness)
15.l. If child less than 18 months of age was the child examined for (i) bulging fontanelle (ii) neck stiffness
IMCI 0 = not done 1 = less than adequate; incorrectly assessed 2 = satisfactory; correctly assessed N/A = Not applicable (Applies to children with fever, irritability, confusion and fever, < 18 months of age)
15.m. If child greater than 18 months of age was child examined for neck stiffness
IMCI 0 = not done 1 = less than adequate; incorrectly assessed 2 = satisfactory; correctly assessed N/A = Not applicable (Applies to children with fever, irritability, confusion and fever, > 18

22
months of age) 16.a. Was the child examined for enlarged lymph glands
IMCI/Guidelines for the management of HIV-infected children
0 = not done 1 = less than adequate; all sites were not examined 2 = satisfactory; all sites were examined (Applies to all children)
16.b. Was the child examined for oral thrush
IMCI/Guidelines for the management of HIV-infected children
0 = not done 1 = less than adequate; did not correctly visualize and use the laryngoscope and spatula 2 = satisfactory; correctly checked and visualized the mouth (Applies to all children)
16.c. Was the child examined for hepatosplenomegaly
Guidelines for the management of HIV-infected children/WHO clinical staging
0 = not done 1 = less than adequate; incorrectly examined by not lying the child on the bed 2 = satisfactory; correctly positioned and palpated the abdomen (Applies to all children)
16.d. Was the child examined for parotid enlargement
IMCI/Guidelines for the management of HIV-infected children
0 = not done 1 = less than adequate; incorrectly examined and diagnosed 2 = satisfactory; correctly examined and diagnosed (Applies to all children)
16.e. Was the child examined for ear discharge
IMCI/Guidelines for the management of HIV-infected children
0 = not done 1 = less than adequate; only checked one ear 2 = satisfactory; checked both ears and proper positioning of the child (Applies to all children)
17. Is the child’s assessment correct?
IMCI/ Standard treatment guidelines and essential drug list
0 = incorrect 1 = Partial assessment/diagnosis 2 = Correct assessment/diagnosis
19. Was it necessary to prescribe antibiotics?
IMCI/Standard treatment guidelines and essential drug list
Y = Yes N = No
20. Did the health worker correctly explain: - dose - duration - frequency
IMCI/ Standard treatment guidelines and essential drug list
Y = Yes N = No
21. If any other medication is prescribed, did the health worker correctly
IMCI/ Standard treatment guidelines and essential drug list
Y = Yes N = No N/A = Not applicable

23
explain: - dose - duration - frequency 22. Was the medication provided appropriate?
IMCI /Standard treatment guidelines and essential drug list
Y = Yes N = No N/A = Not applicable (Not all children should be given medication, home remedies are recommended by IMCI)
23. If requiring a drip, was an intravenous line inserted?
IMCI/Standard treatment guidelines and essential drug list
Y = Yes N = No N/A = Not applicable (Applies to children with severe dehydration if hospital > 30 minutes away and children with hypoglycaemia)
24. If requiring oxygen, was the child administered oxygen?
IMCI/Standard treatment guidelines and essential drug list
Y = Yes N = No N/A = Not applicable (Applies to children with severe pneumonia, wheeze, convulsions and hypoglycaemia and unconsciousness)
26. If requiring nebulisation, was it administered
Standard treatment guidelines and essential drugs list
Y = Yes N = No N/A = Not applicable (Applies to children with wheezing and stridor)
27. Was the child appropriately referred (if needed)
IMCI/Standard treatment guidelines and essentials drug list
Y = Yes N = No N/A = Not applicable
28. Was the caregiver counselled about: a. the current condition
IMCI/Standard treatment guidelines and essentials drug list
0 = poor; not counseled 1 = less than adequate, told what the current problem was 2 = satisfactory; told what the current problem was and how it occurred N/A = not applicable (Applies to all children)
28. Was the caregiver counselled about: b. prevention
IMCI/Standard treatment guidelines and essentials drug list
0 = poor; not counseled 1 = less than adequate; told that it can be prevented but not properly discussed 2 = satisfactory; told properly how to prevent the current problem N/A = not applicable (Applies to most children unless it is not a preventable condition such as a ‘Flu’)
28. Was the caregiver counselled about: c. home management
IMCI/Standard treatment guidelines and essentials drug list
0 = poor; no home management discussed 1 = less than adequate; told that the child can be treated at home but not how 2 = satisfactory; told that the child can be treated safely at home and how to do so
24
for the underlying problem N/A = not applicable (Applies to most children except for conditions where there is no home management)
28. Was the caregiver counselled about: d. follow-up
IMCI/Standard treatment guidelines and essentials drug list
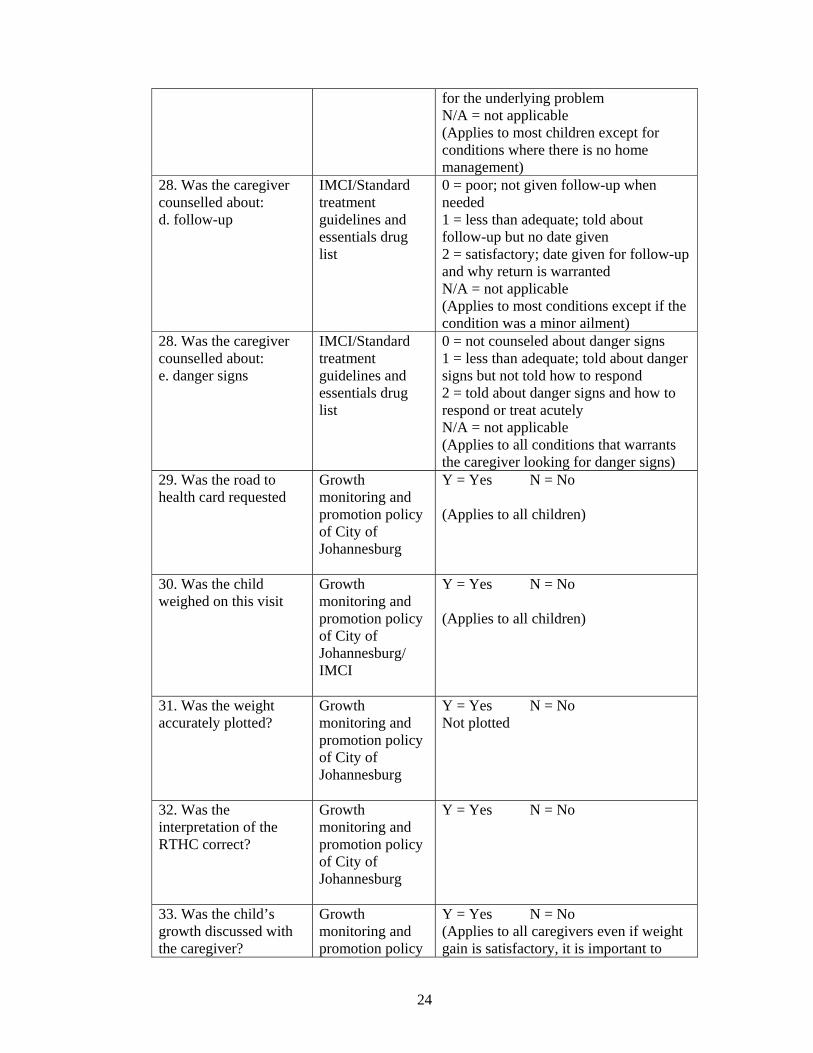
0 = poor; not given follow-up when needed 1 = less than adequate; told about follow-up but no date given 2 = satisfactory; date given for follow-up and why return is warranted N/A = not applicable (Applies to most conditions except if the condition was a minor ailment)
28. Was the caregiver counselled about: e. danger signs
IMCI/Standard treatment guidelines and essentials drug list
0 = not counseled about danger signs 1 = less than adequate; told about danger signs but not told how to respond 2 = told about danger signs and how to respond or treat acutely N/A = not applicable (Applies to all conditions that warrants the caregiver looking for danger signs)
29. Was the road to health card requested
Growth monitoring and promotion policy of City of Johannesburg
Y = Yes N = No (Applies to all children)
30. Was the child weighed on this visit
Growth monitoring and promotion policy of City of Johannesburg/ IMCI
Y = Yes N = No (Applies to all children)
31. Was the weight accurately plotted?
Growth monitoring and promotion policy of City of Johannesburg
Y = Yes N = No Not plotted
32. Was the interpretation of the RTHC correct?
Growth monitoring and promotion policy of City of Johannesburg
Y = Yes N = No
33. Was the child’s growth discussed with the caregiver?
Growth monitoring and promotion policy
Y = Yes N = No (Applies to all caregivers even if weight gain is satisfactory, it is important to

25
of City of Johannesburg/ IMCI
commend the caregiver)
34. IF CHILD NOT GROWING WELL: a. Was a nutritional history taken?
Growth monitoring and promotion policy of City of Johannesburg/ IMCI
0 = poor; asked about what feeds and meals child is being fed but no details as to how the feeds where prepared and when and how the feeds were given; or not asked at all. 1 = Less than adequate; asked about all feeds (breastfeeds, bottle feeds and complimentary feeds), including the preparing and constituents 2 = satisfactory; asked about all feeds as above; encouraged breastfeed and cup and spoon feeding and encouraged the mother N/A = not applicable (Applies to children that are not growing well)
b. Was choice of milk feed discussed?
Growth monitoring and promotion policy of City of Johannesburg/ IMCI
0 = poor; Only asked what milk feed the baby was on; or not asked at all. 1 = less than adequate; Asked what milk feed child was on and how often fed 2 = satisfactory; asked about the type of milk feed, frequency of feeds and how the feeds are prepared and given N/A = not applicable (Applies to children that are not growing well and < 2 years)
c. Was complementary feeding discussed?
Growth monitoring and promotion policy of City of Johannesburg/ IMCI
0 = poor; Was only told when to wean the diet; or not discussed at all 1= less than adequate; told when and what type of complementary feeds to prepare. 2 = satisfactory; told when, what type of feeds and how to prepare and give feeds, encouraged mom to prepare home cooked meals N/A = not applicable (Applies to children that are not growing well and excluded those that did not need complementary feeding to be discussed >6 months)
d. Was nutritional advice offered?
Growth monitoring and promotion policy of City of Johannesburg/
0 = poor; only said the child needs to be fed better but no discussion as to how; or not discussed at all 1 = less than adequate; minimal advice offered

26
IMCI
2 = satisfactory; detailed advice offered on type of feeds, frequency and proper preparation and feeding techniques and utensils N/A = not applicable (Applies to children that are not growing well)
e. Was nutritional advice appropriate?
Growth monitoring and promotion policy of City of Johannesburg/ IMCI
0 = poor; inappropriate advice for the age, underlying retroviral status and socioeconomic status of the patient 1 = less than adequate; discussed one of the above issues and omitted the rest 2 = satisfactory; appropriate discussion for all aspects of feeding practices. N/A = not applicable (Applies to children that are not growing well)
f. Was food supplementation offered?
Growth monitoring and promotion policy of City of Johannesburg
0 = not offered 1 = less than adequate; incorrect food supplementation or improper instructions on use and preparation of food supplementations given. 2 = satisfactory; correct supplementation offered to those patients in need of it N/A = not applicable (Applies to children that are not growing well)
g. Was the parent referred to social welfare services, to enable access to social support grant?
Growth monitoring and promotion policy of City of Johannesburg
0 = poor; not asked about social support grant 1 = less than adequate; Asked but no action taken 2 = satisfactory; asked and referred for social support grant N/A = not applicable (Applies to children that are not growing well and includes the child care, care dependency and foster care grants)
h. Was the child appropriately referred (if needed)
Growth monitoring and promotion policy of City of Johannesburg/ IMCI
0 = poor; not referred 1 = less than adequate; assessed as needing referral but not referred 2 = satisfactory; assessed and efficiently referred N/A = not applicable (Applies to children that are not growing well)
35. PROMOTION OF OPTIMAL GROWTH OF ALL CHILDREN a. choice of milk feed discussed (particularly exclusive breastfeeding for the 1st 6 months)
Growth monitoring and promotion policy of City of
0 = poor; Only asked what milk feed the baby was on; or not asked at all. 1 = less than adequate; Asked what milk feed child was on and

27
Johannesburg/ IMCI
how often fed 2 = satisfactory; asked about the type of milk feed, frequency of feeds and how the feeds are prepared and given N/A = not applicable (Applies to children that are less than 2 years of age)
b. complementary feeding and discouragement of complementary feeding of infants under 4 months.
Growth monitoring and promotion policy of City of Johannesburg/ IMCI
0 = poor; Was only told when to wean the diet; or not discussed at all 1= less than adequate; told when and what type of complementary feeds to prepare. 2 = satisfactory; told when, what type of feeds and how to prepare and give feeds, encouraged mom to prepare home cooked meals (Applies to children < 6 months of age)
c. micronutrient (vit A) and iron supplementation
Growth monitoring and promotion policy of City of Johannesburg/ IMCI
0 = not checked and given micronutrients and iron supplementation. 1 = less than adequate, assessed as needing micronutrients or iron but not given 2 = given micronutrients and iron if in need of them N/A = not applicable (Applies to all children < 5 years and in need of the iron if pale and vitamin A if not already given a dose within the past month)
d. Was regular deworming discussed?
Growth monitoring and promotion policy of City of Johannesburg/ IMCI
0 = poor; not checked or discussed with the caregiver 1 = less than adequate; Checked but not given 2 = satisfactory; checked and given (Applies to all children < 5 years and if not already given a dose within the last 6 months)
36. Were other problems addressed appropriately?
IMCI 0 = not done 1 = less than adequate; incorrect assessment 2 = satisfactory; correctly assessed and treated N/A = Not applicable (Other problems such as skin rash or infection, scabies, mouth ulcers, eye infection that can be missed with the routine IMCI consult)
37. Were immunisations checked on the road to health
IMCI/Expanded programme on immunisations(E
Y = Yes N = No (Applies to all children)

28
card PI-SA)/ Standard treatment guidelines and essential drugs list
38. Was vitamin A checked and given if necessary
RTHC/Expanded programme on immunisations(EPI-SA)/ Standard treatment guidelines and essential drugs list
Y = Yes N = No (The health worker had to ask or check the RTHC for previous doses and had to decide if the child was eligible to receive vitamin A and the correct dose. If the child had received vitamin A in the last month or the mother that is breastfeeding received vitamin A at time of delivery then do not give a dose)
39. Was the caregiver asked about age appropriate milestones?
“Blue card”/Workshop on screening for developmental disabilities in the pre-school population: Discussion document
Y = Yes N = No (Assessment included performing or watching the child for age appropriate developmental milestones .e.g. making the child sit, weight-bear/walk, handle objects etc.)
40. Were maternal health issues discussed and addressed
IMCI Y = Yes N = No (If mom present)
41. a. Is the HIV status of the baby/mom known?
IMCI/Guidelines for the management of HIV-infected children
Y = Yes N = No
41. b. If yes, where is the information recorded
IMCI/Guidelines for the management of HIV-infected children
Can be directly recorded or coded in the RTHC or “Blue card”
41. c. If no, was the mother’s/child’s status asked about?
IMCI/Guidelines for the management of HIV-infected children
Y = Yes N = No (Applies to all mother’s whose status is not known)
42. If HIV unknown was pre-test counselling offered
IMCI/Guidelines for the management of HIV-infected children
Y = Yes N = No (All should be offered counseling if status unknown)
43. Was cotrimoxazole prescribed for HIV exposed or positive
IMCI/Guidelines for the management of
Y = Yes N = No (All exposed or HIV positive children should be given cotrimoxazole from 4-6
29
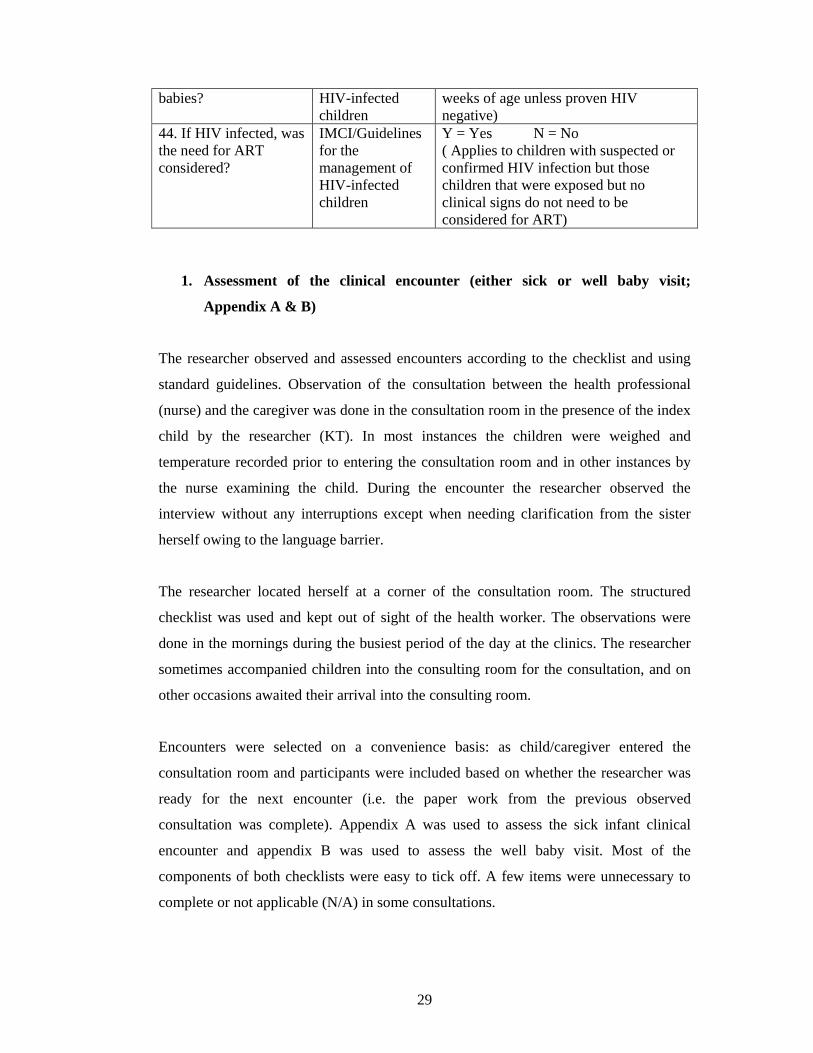
babies? HIV-infected children
weeks of age unless proven HIV negative)
44. If HIV infected, was the need for ART considered?
IMCI/Guidelines for the management of HIV-infected children
Y = Yes N = No ( Applies to children with suspected or confirmed HIV infection but those children that were exposed but no clinical signs do not need to be considered for ART)
1. Assessment of the clinical encounter (either sick or well baby visit;
Appendix A & B)
The researcher observed and assessed encounters according to the checklist and using
standard guidelines. Observation of the consultation between the health professional
(nurse) and the caregiver was done in the consultation room in the presence of the index
child by the researcher (KT). In most instances the children were weighed and
temperature recorded prior to entering the consultation room and in other instances by
the nurse examining the child. During the encounter the researcher observed the
interview without any interruptions except when needing clarification from the sister
herself owing to the language barrier.
The researcher located herself at a corner of the consultation room. The structured
checklist was used and kept out of sight of the health worker. The observations were
done in the mornings during the busiest period of the day at the clinics. The researcher
sometimes accompanied children into the consulting room for the consultation, and on
other occasions awaited their arrival into the consulting room.
Encounters were selected on a convenience basis: as child/caregiver entered the
consultation room and participants were included based on whether the researcher was
ready for the next encounter (i.e. the paper work from the previous observed
consultation was complete). Appendix A was used to assess the sick infant clinical
encounter and appendix B was used to assess the well baby visit. Most of the
components of both checklists were easy to tick off. A few items were unnecessary to
complete or not applicable (N/A) in some consultations.

30
The Road to Health card (RTHC) [see appendix F] is a home-based record card for the
use and benefit of the mothers and children, as well as for all who provide their health
care. The following information is recorded on the card:
• Mother’s antenatal history
• Details of delivery
• Neonatal period
• Family planning
• Immunisations
• Milestones
• Feeding practices
• Space for notes on intercurrent illnesses and their management
• Weight for age graph
The following tests in the RTHC are for vision and hearing screening and forms part of
well baby visits (see appendix B):
1. The pencil test in a child greater than 6 weeks of age
2. The Snellen chart used to assess vision in a child greater than 5 years of age
3. The health worker asks the caregiver if the child listens to voices and songs in a
child of 3 months of age
4. The health worker asks the caregiver if the child of 6 months turns to loud noises
5. The voice test is done in a child of greater than 12 months
The pencil test is a difficult test to perform in children younger than 3 years of age. The
test is in fact the Two Pencil Test of Lang and determines if a child has strabismus or no
stereopsis. With both eyes open the patient uses both eyes to produce stereopsis and can
put his pencil accurately on the examiner’s pencil if stereopsis is present and if the same
person with one eye closed or with manifest strabismus or no stereopsis will miss the
examiner’s pencil initially and place it correctly only after the second or third try.(37)
The ‘voice test’ is a potential non-technological alternative method of assessing hearing
in developing countries with limited or no access to standard audiometric methods.(38)
The tester, standing behind the child at about an arm’s length away, delivers the test
words, first in a whisper followed by gradation to conversational or loud voice if
necessary. The child should gently occlude one of their auditory canals at a time with a
finger while rubbing the tragus in a circular motion. The voice level at which the subject

31
correctly identified more than 50% of the test words is noted and recorded. If there is
hearing loss then the child should be referred for pure tone audiometry testing. The
limitation of this test is that it is difficult to perform in a child of less than 3 years of
age.
Some health workers assessed development as guided by the child development chart in
the City of Johannesburg child health services “Blue card” (see appendix G). The “Blue
card” is similar to the RTHC and is a means of record keeping for clinics as the card
remains in the clinic. The components of this card include baby, family, obstetric and
pregnancy history sections; and sections for recording immunisations, nursing care
plans, child development and growth plotting.
The child development chart section guides the health worker to assess the milestones
(included social behaviour and play, vision and fine movement, hearing and speech and
gross motor) that is appropriate for the age of the child and the health worker marks off
whether this milestone was observed or reported by the mother.
2. Assessment of clinic facilities, infrastructure, supplies and equipment
(Appendix C-E)
After the clinical observations were completed or during periods when there were no
patients available for observation, the researcher inspected the clinic with regards to
infrastructure and checked if equipment was available and functioning. The researcher,
with the aid of a health worker, inspected the store room for medical supplies and
specific drugs that were listed on the structured checklist. The refrigerator was also
inspected with regards to its functioning and for vaccine storage and expiry.
3. Review of personnel, in-service activities and training, services provided by
clinics (Appendix C-E)
The researcher interviewed the facility manager or deputy manager (usually in the
afternoons whilst it was quiet) for information regarding personnel numbers, job
descriptions, in-service activities, training material or guidelines, functioning and
services of the clinic, transport and the efficiency of the referral system.
32
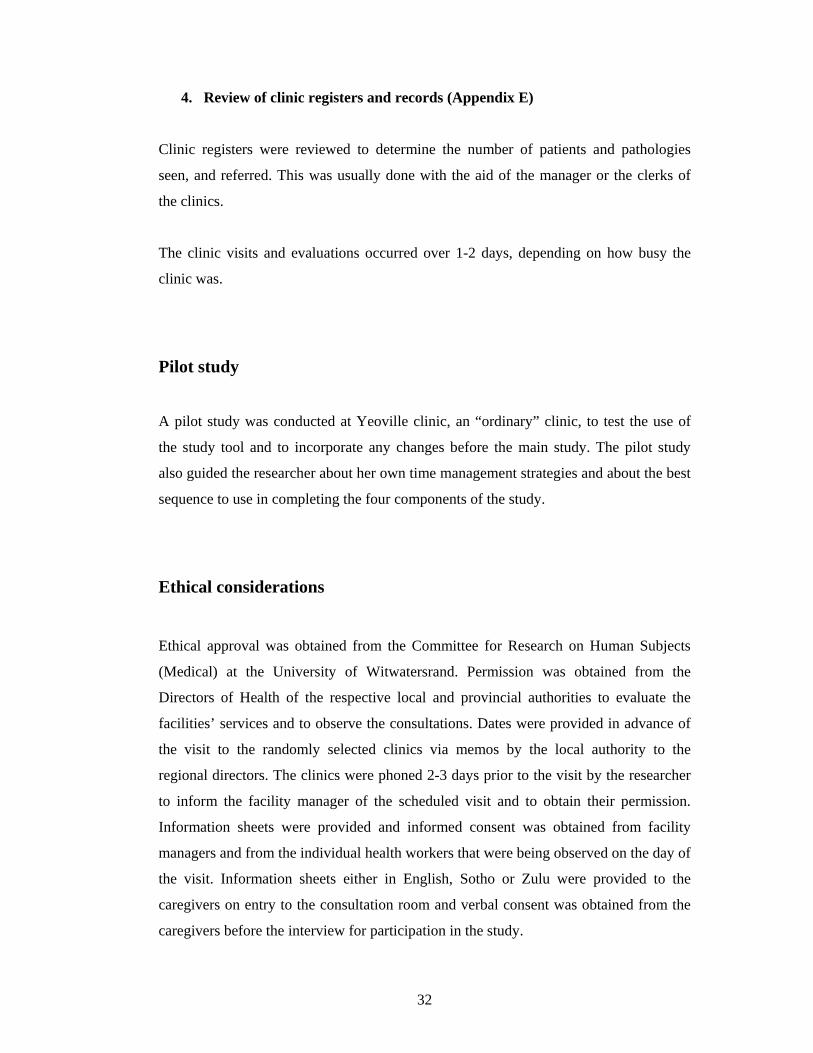
4. Review of clinic registers and records (Appendix E)
Clinic registers were reviewed to determine the number of patients and pathologies
seen, and referred. This was usually done with the aid of the manager or the clerks of
the clinics.
The clinic visits and evaluations occurred over 1-2 days, depending on how busy the
clinic was.
Pilot study
A pilot study was conducted at Yeoville clinic, an “ordinary” clinic, to test the use of
the study tool and to incorporate any changes before the main study. The pilot study
also guided the researcher about her own time management strategies and about the best
sequence to use in completing the four components of the study.
Ethical considerations
Ethical approval was obtained from the Committee for Research on Human Subjects
(Medical) at the University of Witwatersrand. Permission was obtained from the
Directors of Health of the respective local and provincial authorities to evaluate the
facilities’ services and to observe the consultations. Dates were provided in advance of
the visit to the randomly selected clinics via memos by the local authority to the
regional directors. The clinics were phoned 2-3 days prior to the visit by the researcher
to inform the facility manager of the scheduled visit and to obtain their permission.
Information sheets were provided and informed consent was obtained from facility
managers and from the individual health workers that were being observed on the day of
the visit. Information sheets either in English, Sotho or Zulu were provided to the
caregivers on entry to the consultation room and verbal consent was obtained from the
caregivers before the interview for participation in the study.

33
In the event where the mother was thought to have received incorrect or inappropriate
advice from the health worker, the researcher, at the end of the consultation, informed
the health worker about her disagreement with the advice offered, once the caregiver
had left.
Financial considerations
A grant was received from the University of Witwatersrand Medical Research funding
committee for stationery, printing, telephone and transport expenses.
Statistical analysis
Data was entered onto three Microsoft Excel spreadsheets, and then imported into
Statistica statistical software version 6.0 (StatSoft, USA). Most results are descriptive,
but standard statistical measures (such as chi-square and t-tests) were used when
appropriate. Parametric, continuous variables were described using means and standard
deviations. Medians were used for non-parametric data. Categorical variables were
described using percentages and frequencies. a. A p value of <0.05 was considered to be
statistically significant.

34
CHAPTER 3
RESULTS
A total of 16 clinics were evaluated. Of these, 12 (75%) were “ordinary” primary health
care (PHC) clinics and four (25%) were community health centres (CHCs).
The number of health workers assessed at each clinic varied. The minimum number of
health workers that were assessed at the clinics was two and the maximum was five.
The results of the different components of the study are presented as follows:
3.1. The sick baby clinical encounter
3.2 The well baby clinical encounter
3.3 Assessment of infrastructure, clinic facilities, equipment and supplies
3.4 Review of personnel, in-service activities and training, services provided by clinics
3.5 Review of clinic registers and record
3.1. The sick baby clinical encounter
Fourteen clinics participated in the observation of sick baby clinical encounters
component of the study since two local health authority clinics only provided well baby
services.
A total of 141 sick encounters were observed. There was 23 nursing staff involved. The
minimum number of patients seen by one nurse was one and the maximum number was
16. The youngest baby seen was 1 month old and the oldest child was 144 months (12
years old). The patient’s mean age was 39.9±36 months (mean ±standard deviation).
There were 33(23%) infants and 26(18%) children were older than 5 years of age. The
majority of patients (82%) were within the cut-off age for IMCI consults. (1 week to 5
years)

35
3.1.1 Years of experience of health workers and attendance at courses
A total of 23 health workers were assessed, all of whom were professional nurses. The
average number of years of experience since qualification was 17.5±10.1 years with a
median of 15 years. The majority (83%) of health workers were primary health care
trained and 57% had completed the IMCI course as shown in table 3.1.
Table 3.1: Attendance at courses by nurses observed during consultations
Course name Number
(n=23)
Percent
(%)
Primary health care training 19 83
Family planning 17 74
Pharmacy issuing 17 74
Voluntary counselling and
testing
13 57
Integrated management of
childhood illness (IMCI)
13 57
HIV/AIDS 13 57
Sexually transmitted infections 9 39
Tuberculosis 8 35
Termination of pregnancy 1 4
Infection control 1 4
Other
13 57
The other courses attended included
• Prevention of mother to child transmission of HIV (2)
• Diploma in Paediatrics (2)
• Community health nursing (2)
• HIV and TB collaboration (2)
• Diploma in Nursing (1).
• B.Cur in nursing (1)
• Nursing education (1)

36
• Customer care (1)
• HIV in paediatrics (1)
• Neonatal intensive care course (1)
• Perinatal education programme (1)
• Comprehensive nursing course (1)
• Trauma and crisis counselling (1)
• Midwifery (1)
• Psychiatry (1)
• Diabetes management (1)
• Primary health care service management (1)
• Child abuse (1)
3.1.2 Escorts or caregivers of patients
The majority (108/142 [76%]) of caregivers that brought the children to clinics were
mothers. Fifteen percent of caregivers were grandmothers, aunts, nannies and fathers.
Five percent were uncles, neighbours, siblings and grandfathers. A few (4%) children
came unaccompanied.
3.1.3 Waiting time of patients
Caregivers waited to be seen for between 6 to 383 minutes, with a mean of 135±71.5
minutes (two and one-quarter hours) and median waiting time of 124 minutes. At one
clinic, caregivers waited nearly the whole day only to be turned away at 16h00 without
being seen by any health worker.
3.1.4 Health workers time management and methods used for consultation
The mean duration of a consultation was 11.2±6.1 minutes and the median was 9
minutes; with a minimum duration of two minutes and a maximum of 38 minutes.

37
There were three basic consultation methods used by nurses:
1. Primary health care technique
2. Primary health care technique combined with IMCI
3. IMCI technique
At one of the 12 PHC clinics, a single nurse practiced a combination of IMCI and PHC
methods. In one CHC a single nurse practiced IMCI and in another CHC, two practiced
IMCI. The rest of the consultations were performed using a traditional primary health
care technique. The mean duration of the consultations of the nurse that practiced a
combination of IMCI and PHC methods was 26.5±6.97 minutes. This was the least busy
clinic with 8 sick baby visits and 2 well baby visits in a 48 hour period. The mean
duration of the 22 IMCI consultations of the three nurses in the CHCs was 10.8±5.8
minutes. The mean duration of a PHC consultation was 10.1±4.5 minutes. The duration
and number of consultations and standard deviation values of the three basic
consultations methods are tabulated in table 3.2. There was no statistical difference in
the duration of a consultation between the PHC and IMCI method groups (p = 0.55).
There was a statistical difference when comparing the combination PHC and IMCI
consults with the PHC only or IMCI only groups (for both, p < 0.0001).
Table 3.2: Comparison of the duration and number of the three basic consultation
methods.
Method Number Duration
(mins)
SD
Primary Health Care (PHC) technique 111 10.1 4.5
Primary Health Care (PHC) and
Integrated management of childhood illness (IMCI)
technique
8 26.5 7.0
Integrated management of childhood illness (IMCI)
technique
22 10.8 5.8
All techniques 141 11.2 6.1

38
3.1.5 Staff and patient interaction
In the majority (117/141[83%]) of encounters the health worker greeted the caregiver.
Less than three-quarter (102/141[72%]) of staff confirmed the caregiver’s relationship
with the child. In five (4%) instances the child came unaccompanied.
3.1.6 Health workers performance in the following clinical aspects:
3.1.6.1 History taking
The adequacy of history taking was classified as “satisfactory”, “less than adequate”,
“poor” or “not asked” by the researcher based on the questions that the health workers
asked about the main complaint, related symptoms, other symptoms and problems and
past medical history (Figure 3.1). The grading system used is described in table 2.1
(Chapter 2). For the majority (120/141[85%]) of consultations, history taking was
gauged to be satisfactory, whilst at 21 (15%) consultations less than an adequate history
was taken. None were of poor quality. Forty four percent of health workers did not ask
about key information related to the main complaint and 25% of health workers
inadequately requested key information related to the main complaint. Similarly 74% of
health workers did not request information unrelated to the main complaint. Few
(9/141[6%]) health workers requested a relevant and ‘satisfactory’ past medical history;
with one encounter being “less than adequate” and the rest (93%) were not asked at all.
Figure 3.1: Comparison of the different aspects of history taking
62
105
131
2135
6 1
120
4430
9
0
20
40
60
80
100
120
140
History RelatedSymtoms
OtherSymptoms
Past MedicalHistory
History Taking
Num
ber
Of O
bser
vatio
ns
Not askedLess than adequateSatisfactory

39
3.1.6.2 Danger signs
The health workers performances were assessed with regards to assessing the child or
questioning of caregivers about “danger signs” as classified by the IMCI strategy. These
are: 1. Not able to drink or breastfeed
2. Vomits everything 3. Convulsions during this illness
4. Lethargic or unconscious
This data is summarised in table 3.3. Danger signs were asked or assessed in very few
encounters even in consultations using the IMCI approach. “Convulsions during this
illness” was the worst assessed danger sign and was asked in only one non-IMCI
consult. Lethargy as a sign was not relevant in all cases, as all the children were visibly
active and alert. There was no statistical difference between the assessments for danger
signs in the IMCI and non-IMCI consults (p value > 0.05).
Table 3.3: Summary of “danger signs”
Sign Asked
(n=141)
IMCI consults
(n=22)
Non-IMCI
consults (n=119)
p value
Not able to drink or
breastfeed – no. (%)
40 (28) 9 (41) 31 (26) 0.34
Vomits everything–
no. (%)
23 (16) 3 (14) 20 (17) 0.46
Convulsions during
this illness– no. (%)
1 (0.5) 0 (0) 1 (1) 0.52
3.1.6.3 General and systems examination
Adequate exposure of the child is important. “Satisfactorily undressed” was defined as a
completely exposed child except for removal of napkin or underwear depending on the
40
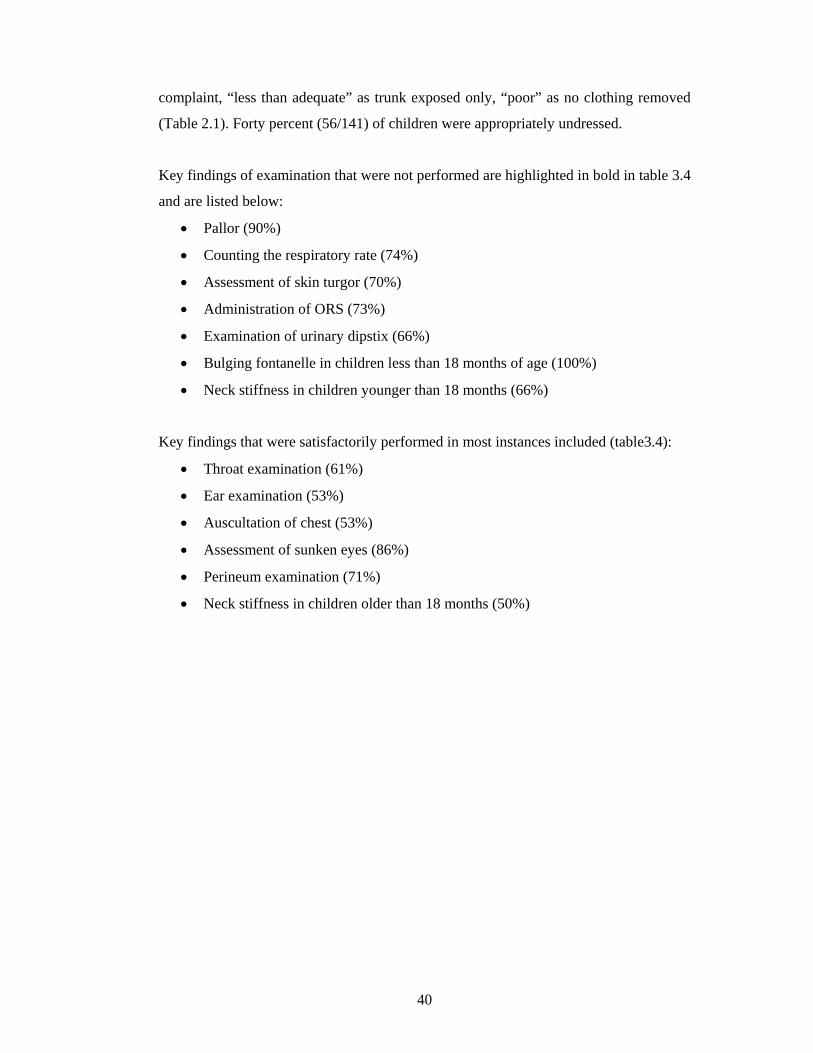
complaint, “less than adequate” as trunk exposed only, “poor” as no clothing removed
(Table 2.1). Forty percent (56/141) of children were appropriately undressed.
Key findings of examination that were not performed are highlighted in bold in table 3.4
and are listed below:
• Pallor (90%)
• Counting the respiratory rate (74%)
• Assessment of skin turgor (70%)
• Administration of ORS (73%)
• Examination of urinary dipstix (66%)
• Bulging fontanelle in children less than 18 months of age (100%)
• Neck stiffness in children younger than 18 months (66%)
Key findings that were satisfactorily performed in most instances included (table3.4):
• Throat examination (61%)
• Ear examination (53%)
• Auscultation of chest (53%)
• Assessment of sunken eyes (86%)
• Perineum examination (71%)
• Neck stiffness in children older than 18 months (50%)

41
Table 3.4: Adequacy of examination of signs applicable to the complaints
Sign Necessary
to check
(N =141)
No. (%)
Not
done
No. (%).
Less than
adequate
No. (%)
Satisfactory
No. (%).
Temperature 141 (100) 21 (15) 2 (2) 118 (84)
Pallor 141 (100) 127 (90) 1 (1) 13 (9)
Throat 122 (87) 25 (21) 22 (18) 75 (61)
Ears 113 (80) 51 (45) 2 (2) 60 (53)
Respiratory rate 107 (76) 79 (74) 20 (19) 8 (7)
Auscultation of
chest
105 (75) 33 (31) 16 (15) 56 (53)
Sunken eyes 28 (20) 4 (14) 0 (0) 24 (86)
Skin turgor 27 (19) 19 (70) 0 (0) 8 (30)
ORS 22 (16) 16 (73) 1 (4) 5 (23)
Abdominal
examination
9 (6) 3 (33) 4 (44) 2 (22)
Perineum
examination
7 (5) 2 (29) 0 (0) 5 (71)
Examination of
urine dipstix
3 (2) 2 (66) 0 (0) 1 (33)
Bulging fontanelle 6 (4) 6 (100) 0 (0) 0 (0)
Neck stiffness
<18/12
6 (4) 4 (66) 0 (0) 2 (33)
Neck stiffness
>18/12
2 (2) 1 (50) 0 (0) 1 (50)
3.1.6.4 Examination of a child for HIV
On examination of the child for HIV, the health workers were assessed on whether they
assessed the following signs in all children:
• enlarged lymph glands

42
• oral thrush
• hepatosplenomegaly
• parotid enlargement
• ear discharge
As shown in table 3.5, most of the signs of HIV were not assessed at all. Only oral
thrush was satisfactorily assessed in (86/141[61%]) of encounters. Examination for
hepatosplenomegaly faired the worst, for the majority (135/141[97%]) of encounters,
this part of the examination was not performed. According to IMCI criteria, all of the
above signs (except for hepatosplenomegaly) should be checked in all children to detect
symptomatic HIV. However, hepatosplenomegaly is part of primary health care
training, the WHO clinical staging of HIV and is a sign that can be examined for
according to the guidelines for management of HIV-infected children.
Table 3.5: Clinical signs of HIV (N = 141)
Signs Not Done
No. (%)
Less than
Adequate
No. (%)
Satisfactory
No. (%)
Enlarged lymph glands 105 (75) 17 (12) 19 (13)
Oral thrush 49 (35) 6 (4) 86 (61)
Hepatosplenomegaly 137 (97) 0 4 (3)
Parotid enlargement 132 (94) 0 9 (6)
Ear discharge 79 (56) 1 (1) 61 (43)
3.1.6.5 Assessment
In three-quarter (108/141[77%]) of all encounters, health workers made a satisfactory
final diagnosis, whilst in 23/141(16%) of encounters they made a less than adequate
diagnosis and in ten (7%) instances delivered a poor or incorrect diagnosis.

43
3.1.6.6 Prescribing of antibiotics and medication:
Antibiotics were prescribed in 46% of encounters. In the 65 instances where antibiotics
were prescribed, they were deemed necessary by the researcher in only two thirds
(43/65[66%]) of encounters. Examples of incorrect indications was the prescribing of
metronidazole and cotrimoxazole for an eleven month old child diagnosed with
gastroenteritis and penicillin VK tablets for an eight year old child with a blocked nose
and cough. While both the dosage and frequency of antibiotic administration was
adequately explained in the vast majority of consultation (97% and 98%, respectively),
in less than half (48%) of encounters was the duration of antibiotic use indicated to the
caregiver. Similarly, for non-antibiotic medications the dosage and frequency were
explained in 88% (124/141) of encounters whilst the duration was explained in 35%
(50/141) of encounters. For most (103/127[81%]) encounters where other medication
was prescribed, its use was deemed appropriate by the researcher. No medication was
prescribed in only 10% (14/141) of encounters.
3.1.6.7 Appropriate treatment and referrals
Three encounters required insertion of an intravenous line in the child; however, this
procedure was not performed in any of the three instances. Two children required
oxygen, one of whom received it. Nine (6%) children received intramuscular
medication or stat doses of medication. Only one of four children (25%) requiring a
nebulisation received it. Referral was regarded as being necessary by the researcher in
13 encounters (9%); 12 children (92%) were referred.
3.1.6.8 Counselling
Counselling about the child’s condition was assessed in terms of how the health worker
gave advice to caregivers for the following aspects of the child’s health and
management: explanation of the current condition, prevention, home management,
follow-up plans and danger signs about when to return. The grading system is discussed
in table 2.1. Table 3.6 summarises the data.

44
Counselling on the current condition was done satisfactorily in only a third
(44/141[31%]) of encounters. Counselling on prevention, home management, follow-up
and danger signs were not routinely discussed for the most part.
Table 3.6: Comparison of the different aspects of counselling
Aspects of
counselling:
Necessary to
counsel
N = 141
No. (%)
Not discussed
No. (%)
Less than
adequate
No. (%)
Satisfactory
No. (%)
Current condition 141 (100) 55 (39) 42 (30) 44 (31)
Prevention 140 (99) 94 (67) 18 (13) 28 (20)
Home management 140 (99) 86 (61) 14 (10) 40 (28)
Follow-up plans 139 (98) 105 (75) 3 (2) 31 (22)
Danger signs to
return
113 (80) 109 (97) 1 (1) 3 (2)
3.1.7. Evaluation of the Road to Health Card (RTHC), nutrition and promotion of
growth
Only 80% (113/141) of children were weighed. The Road to Health Card (RTHC) was
requested in just two-thirds (95/141[67%]) of patient encounters. Of those weighed,
only a quarter (32/113 [28%]) were plotted on a RTHC card (all but one was correctly
done). Most plotted weights (30/32[94%]) were correctly interpreted. In nearly a fifth of
encounters (27/141[19%]), the caregivers did not bring road to health cards. There were
no growth charts for children greater than 5 years; therefore in 3/141(2%) instances
where the health workers mentioned that they would like to plot the child’s weight, the
weights were not plotted. The growth of the child was discussed with the caretaker in
very few (17/141[12%]) encounters.
In the majority of encounters, the children were growing well and therefore the different
aspects of nutrition did not need to be discussed in detail with the caregiver.
Furthermore, milk feeds and complementary feeding did not always need to be

45
discussed as these children may have been in the age group that did not require milk
feeds or complementary feeding. In ten encounters, children were not growing well and
results are shown in table 3.7. All aspects of the nutritional assessment and advice in
children that were not growing well were dealt with poorly.
Table 3.7: Assessment of the different aspects of nutrition
Aspects of nutrition Necessary to
discuss
N = 141
No. (%)
Satisfactory
No. (%)
Less than
adequate
No. (%)
Poorly discussed
No. (%)
Nutritional history 10 (7) 3 (30) 1 (10) 6 (60)
Milk feeds 5 (4) 0 (0) 3 (60) 2 (40)
Complementary
feeding
2 (2) 0 0 2 (100)
Nutritional advice 10 (7) 3 (30) 0 7 (70)
Appropriate advice 10 (6) 3 (30) 0 7 (70)
Of the 4 children requiring food supplementation, only one received it. From the four
children that required supplementation, 3 required social support grant and none
received advice or referral. Two children required referral of which one was referred.
The quality of the different aspects of growth promotion is tabulated in table 3.8 below.
The majority (80% and 93%) of encounters did not require milk feeds and
complementary feeding to be discussed as most of the children were out of the age
group that required milk feeds or complementary feeding. When discussion was
appropriate, in the majority of these encounters the milk feeds and complementary
feeding was poorly discussed, 71% and 80% respectively.
In 72% (101/141) of encounters it was necessary to check the vitamin A status. The
required dose of vitamin A was given satisfactorily in 36% (36/101) of encounters. In
65/101 (64%) of encounters it was neither checked nor given. Forty (28%) of children
did not require vitamin A to be checked and/or given as they were either older than 5
years or had already received appropriate doses of vitamin A according to the schedule

46
in the past month. It was necessary to check 15/141(11%) of children for pallor and to
administer iron supplementation but none were checked or received supplementation.
In only 3 children (3%) was deworming performed satisfactorily, less than adequately in
4 (4%) as it was checked but not administered, and done poorly in most instances
(92/99[93%]). Thirty percent of children (42/141) did not require deworming as they
had already received a dose within the past 6 months or were older than 5 years of age.
Other identified problems, such as relatives being the caregivers and no foster care grant
being received or problems such as scabies and squints that the caregivers failed to
complain about, were addressed satisfactorily in 8/14(57%) of encounters and poorly in
6/14(43%). In the rest (127/141[90%]) of the encounters it was not relevant to discuss
as there were no identifiable problems.
Table 3.8: Comparison of different aspects of growth promotion
Aspects of growth
promotion:
Necessary to
discuss or
check
N = 141
No. (%)
Satisfactory
No. (%)
Less than
adequate
No. (%)
Poorly
performed or
not checked
No. (%)
Milk feeds 28 (20) 3 (11) 5 (18) 20 (71)
Complementary
feeding
10 (7) 1 (10) 1 (10) 8 (80)
Vitamin A 101 (72) 36 (36) 0 (0) 65 (64)
Iron supplementation 15 (11) 0 (0) 0 (0) 15 (100)
Deworming 99 (70) 3 (3) 4 (4) 92 (93)
Other problems 14 (10) 8 (57) 0 6 (43)

47
3.1.8 Health promotion and maternal health
Immunisation status was checked in less than half (65/141[46%]) of patients; 21%
(29/141) did not bring their road to health cards and therefore immunisations were not
checked or asked about. Vitamin A status was checked and given to 36/101(36%) of
patients in whom it was deemed necessary to check. In 65/101(64%) vitamin A status
was not checked in those whom it was deemed necessary to check and in 40/141(28%)
it was not necessary to be checked as it was already given or the child was greater than
5 years of age. Age appropriate milestones were not asked in 137/141(97%) of
encounters. It was unnecessary to ask this in 2/141(2%) instances. Maternal health
issues were discussed and addressed in 14/141(10%) of patients, in 101/141(72%)
instances they were not discussed, and did not apply in 26/141(18%) of consultations as
the caregiver who brought the child to the clinic was not the mother or the child came
alone.
3.1.9 HIV status and testing:
Patients with known HIV status and recording of HIV status:
The HIV status of the baby or the mother was known in only 4/141(3%) of patients and
in 137/141(97%) patients HIV results were unavailable. In all four encounters where the
HIV status was known, the results were recorded in the Road to Health Card (RTHC)
except for one child where Pelargon feeds (usually provided to HIV positive or exposed
infants) was recorded on the RTHC and the mother disclosed her status after the health
worker enquired as to why the child was on Pelargon.
Asking about mother’s /child’s HIV status and offering pre-test counselling:
In the majority (125/141[89%]) of encounters, patients were not asked about their HIV
status. The nine percent (13/141) that were asked about their status included the mother
whose baby was on Pelargon as mentioned above. Pre-test counselling was offered to
1/141(1%) and not offered to 117/141(83%) of patients, whilst in 23/141(16%) it was
not appropriate to offer HIV counselling as the status was known, the caregivers were
not the parents or the child came unaccompanied.

48
Prescribing of cotrimoxazole and consideration of the need for ARTs:
In 134/141(95%) encounters the prescribing of cotrimoxazole was not considered as the
HIV status of the mother was not established. After checking the Road to Health Card
and asking the mothers about their HIV status, 7 children who were HIV positive or
exposed were in need of cotrimoxazole prophylaxis and 5 were prescribed
cotrimoxazole.
Two out of the 7 children that were HIV exposed or positive with clinical signs may
have been candidates for antiretroviral therapy (ART). None were considered for ART
by the health workers.
3.2 The well baby clinical encounter
Fourteen clinics were included in the observation of well baby clinical encounters
component of the study as two provincial health authority clinics only provided sick
baby services.
A total of 149 well baby encounters were observed. The youngest baby seen was 1
month old and the oldest child was aged 60 months (5 years old). There was a skewed
distribution with the median age of children being 7 months.
3.2.1 Years of experience of health workers and attendances at courses
A total of 16 health professionals were assessed, all of whom were professional nurses.
The average number of years of experience since qualification was 16.9±9.1 years with
a median of 16 years and ranging from 1 to 33 years. Health workers attending to well
baby visits do not have to be primary health care trained and thus only a quarter had
primary health care training as shown in table 3.9 below.

49
Table 3.9: Attendances at courses by nurses observed during consultations
Course name Number
(n = 16)
Percent
(%)
Family planning 13 81
Pharmacy issuing 13 81
HIV/AIDS 8 50
Voluntary counselling and testing 7 44
Integrated management of
childhood illnesses
7 44
Sexually transmitted infections 6 38
Primary health care training 4 25
Tuberculosis 4 25
Termination of pregnancy 3 19
Infection control 0 0
Other 8 50
The other courses attended included:
• Prevention of mother to child transmission of HIV (3)
• Anti-retroviral therapy (3)
• Customer care (2)
• Epidemiology and infection control (1)
• Diploma in Paediatrics (1)
• Primary health care skills (1)
• Community health nursing (1)
• Integrated wellness course (1)
3.2.2 Escorts or caregivers of patients
Although there were 149 consults in total, in four encounters both parents (mother and
father) had brought the child for check up, therefore 153 caregivers attended. The
majority (135/153[88%]) of caregivers accompanying children were their mothers. Four
percent (6/153) of caregivers were fathers and 3% (5/153) were grandmothers. The
remaining 5% (7/153) of caregivers were aunts, nannies, neighbours and siblings.

50
3.2.3 Waiting time of patients
Caregivers waited for between 5 to 363 minutes before being seen, with a mean waiting
time of 117.5±81.0 (almost two hours) and a median of 102 minutes.
3.2.4 Health workers time management
The mean duration of a consultation was 8.2±4.7 minutes: with a minimum duration of
two minutes and a maximum of 30 minutes and the median was 7 minutes.
3.2.5 Staff and patient interaction
In the majority (119/149[80%]) of encounters the health workers greeted the caregiver.
In only 58% of encounters (87/149) were the caregiver’s relationships with the child
confirmed. In three-quarter (111/149) of encounters the health workers did not ask
caregivers about other problems such as feeding difficulties, developmental delay or
vision and hearing problems or on other minor ailments such as rashes.
3.2.6 The Road to Health Card (RTHC)
In all instances, the Road to Health card was requested by nurses. Ninety nine percent
(147/149) of children were weighed; 130/147 (88%) of children’s weights were
correctly plotted; 9/147(6%) were incorrectly plotted and in 8 instances (6%) the weight
was not plotted. Of the 130 weights correctly plotted, 122 (94%) were correctly
interpreted; 8 (6%) were incorrectly or not interpreted. In most (106/149[71%])
encounters, the growth of the child was not discussed with the caregiver.
3.2.7 Management of a child not growing well
In the majority of encounters, children were growing well and therefore the different
aspects of nutrition did not need to be discussed in detail with the caregiver. As shown
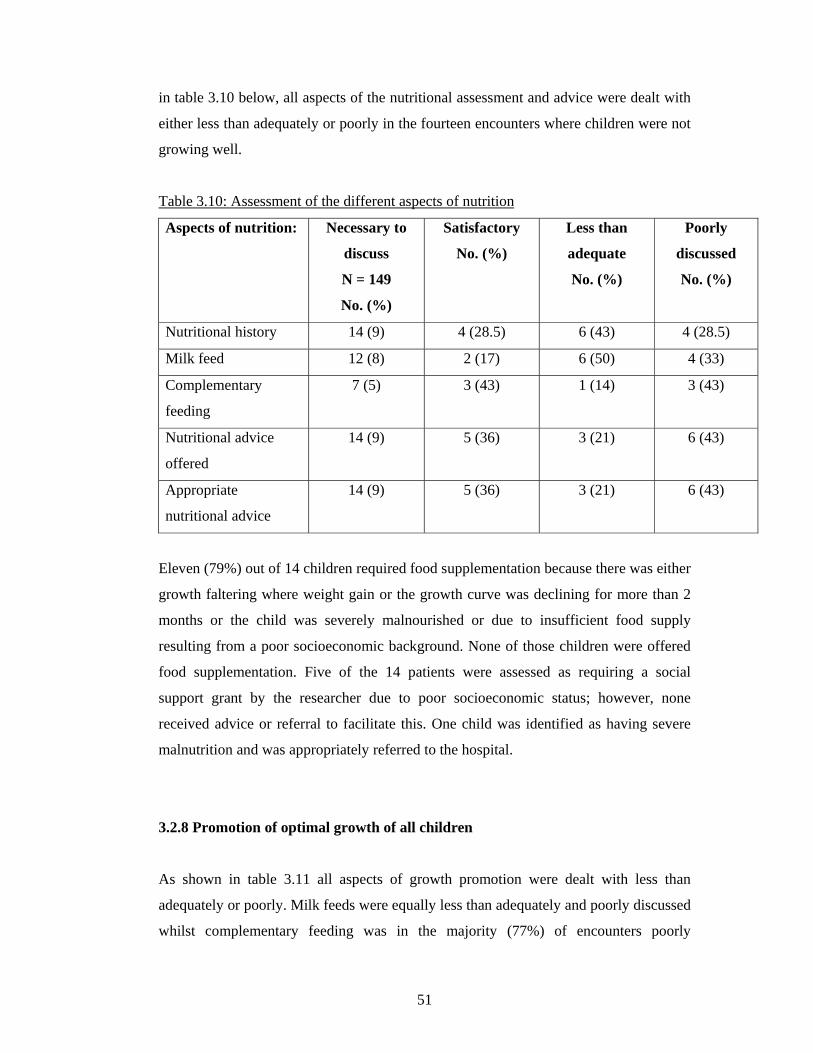
51
in table 3.10 below, all aspects of the nutritional assessment and advice were dealt with
either less than adequately or poorly in the fourteen encounters where children were not
growing well.
Table 3.10: Assessment of the different aspects of nutrition
Aspects of nutrition: Necessary to
discuss
N = 149
No. (%)
Satisfactory
No. (%)
Less than
adequate
No. (%)
Poorly
discussed
No. (%)
Nutritional history 14 (9) 4 (28.5) 6 (43) 4 (28.5)
Milk feed 12 (8) 2 (17) 6 (50) 4 (33)
Complementary
feeding
7 (5) 3 (43) 1 (14) 3 (43)
Nutritional advice
offered
14 (9) 5 (36) 3 (21) 6 (43)
Appropriate
nutritional advice
14 (9) 5 (36) 3 (21) 6 (43)
Eleven (79%) out of 14 children required food supplementation because there was either
growth faltering where weight gain or the growth curve was declining for more than 2
months or the child was severely malnourished or due to insufficient food supply
resulting from a poor socioeconomic background. None of those children were offered
food supplementation. Five of the 14 patients were assessed as requiring a social
support grant by the researcher due to poor socioeconomic status; however, none
received advice or referral to facilitate this. One child was identified as having severe
malnutrition and was appropriately referred to the hospital.
3.2.8 Promotion of optimal growth of all children
As shown in table 3.11 all aspects of growth promotion were dealt with less than
adequately or poorly. Milk feeds were equally less than adequately and poorly discussed
whilst complementary feeding was in the majority (77%) of encounters poorly

52
discussed. Iron supplementation was not checked and given in almost all (88%) cases
that warranted iron. In the majority (96%) of encounters where deworming should have
been checked and given, it was not.
Table 3.11: Comparisons of different aspects of growth promotion
Aspects of growth
promotion:
Necessary to
discuss or check
N = 149
No. (%)
Satisfactory
No. (%)
Less than
adequate
No. (%)
Poorly
performed or
not checked
No. (%)
Milk feed 105 (70) 14 (13) 46 (44) 45 (43)
Complementary
feeding
73 (47) 9 (13) 7 (10) 54 (77)
Iron supplementation 8 (5) 0 (0) 1 (13) 7 (88)
Vitamin A 149 (100) 96 (64) 53 (36)
Deworming 54 (36) 2 (4) 52 (96)
3.2.9 Immunisations and vitamin A
In almost all (143/149[96%]) of encounters the RTHCs were signed, whilst in 2/149
(1%) it was not signed and in the remaining 4/149 (3%) encounters, there was no need
for immunisations or vitamin A doses to be signed as these children came for weight
gain checks.
A follow up date was given in the majority (130/149[87%]) of encounters; in 3/149
(2%) no follow up date was given and in 16/149 (11%) it was not applicable as these
children were 5 years old and did not require any further immunisations.
In only a minority (16/116[14%]) of encounters were adverse effects of immunisations
discussed.

53
Vitamin A was checked in 96/149(64%) of children and given to those that were in need
of a dose (as some children may have already received a dose within the last 6 months).
3.2.10 Development and milestones
Asking about milestones:
Age appropriate milestones were asked for in 38/149 (26%) of encounters. In the 38
children whose milestones were asked about by the health worker, 71% asked questions
as guided by the “blue card” available at clinics. The frequency with which individual
milestones were reviewed is shown in Figure 3.2.
Figure 3.2: Frequency of milestones asked (n = 38)
0
5
10
15
20
25
30
Crawling Rolling Walking Running Headcontrol
Blue card
MILESTONES
Num
ber o
f Obs
erva
tions
Observations
Examining for development:
Development was not assessed in the majority (128/149[86%]) of encounters.
In the 21/149(14%) of patients where developmental assessment was performed, only
3/21(14%) were offered reassurance, advice or counselling regarding development.

54
3.2.11 Vision and hearing screening
The pencil test is a difficult test to perform in younger children and this test was not
performed in any child of greater than 6 weeks of age. The Snellen chart was not
utilised in any child of 5 years or older to screen for vision impairment.
The song and voice test was not performed in 32/37 (86%) of children needing a
hearing test. In the remaining 112/149 (75%) it was unnecessary to perform the test, as
these children were less than 3 months of age or 6 months of age and older.
Only in two encounters (2/28[7%]) were the caregivers asked whether the child reacted
to loud noises and in the remaining 121/149 (81%) it was unnecessary to ask as these
children were less than 6 months of age or 12 months and older.
The voice test was not performed in any child older than 12 months of age.
3.2.12 HIV status and testing
Patients with known HIV status and recording of HIV status:
The HIV status of the baby or the mother was known in only 15/149(10%) of patients
and in 134/149 (90%) patients HIV results were unavailable. In the 12/15(80%) patients
where the HIV status was known, the result had been recorded in the Road to Health
Card and for the remaining 3/15(20%) it was recorded in the “blue” card.
Asking about mother’s /child’s HIV status and offering pre-test counselling:
In only 9/149(6%) encounters, where the mother’s or baby’s HIV status was not known,
were they asked about their HIV status. None of the parents were offered pre-test
counselling. Pre-test counselling should have been offered at 123/149(83%) of
encounters whilst in 26/149(17%) it was not appropriate to offer HIV counselling, as the
status was known or the caregivers were not the parents or the child was
unaccompanied.
Prescribing of cotrimoxazole and consideration of the need for ARTs:
In 140/149 (94%) encounters the prescribing of cotrimoxazole was not considered as the
HIV status of the mother was not established. Of the remaining 9 children who were
HIV positive or exposed, 6 (67%) received cotrimoxazole.

55
Four out of the nine children that were HIV positive or exposed with clinical signs may
have been candidates for ART. None were considered for ART by the health workers.
3.2.13 Responding to risk factors
There were obvious risk factors such as teenage or twin pregnancies, low birth weight
infants and childhood obesity in 35/149 (23%) of encounters. Only in 3/35 (9%) of
encounters did the health worker respond to these risk factors by offering the mother
family planning or counselling and advice.
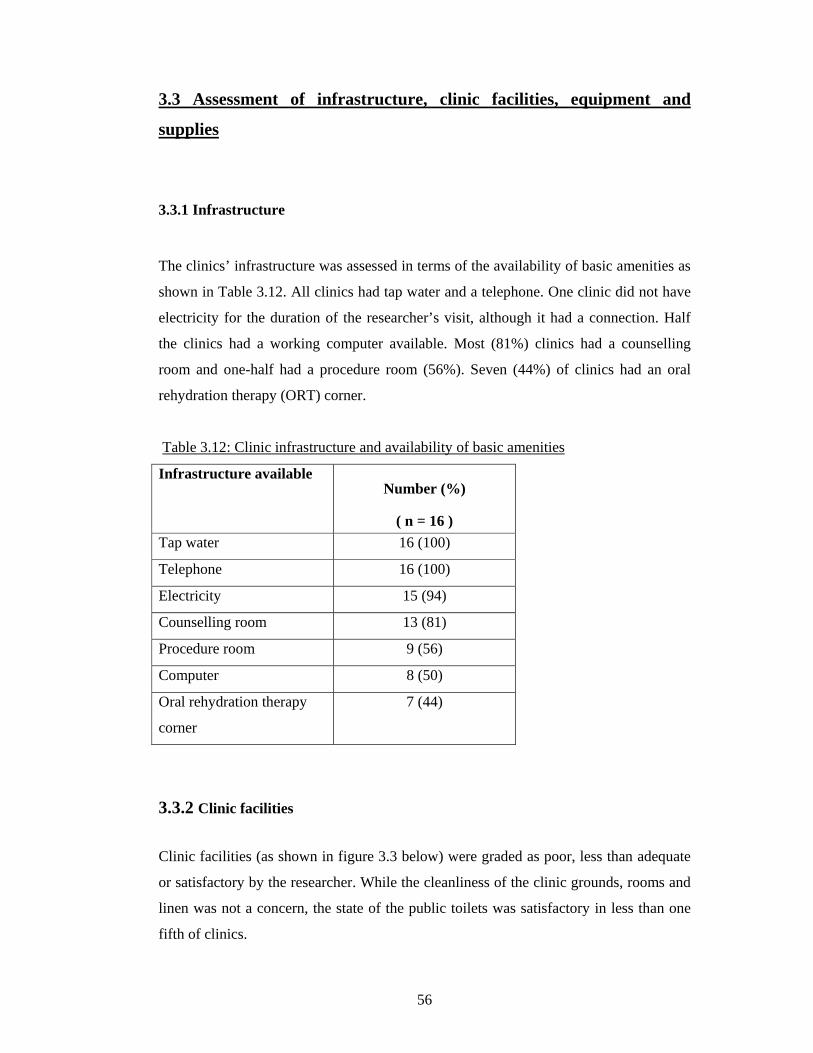
56
3.3 Assessment of infrastructure, clinic facilities, equipment and
supplies
3.3.1 Infrastructure
The clinics’ infrastructure was assessed in terms of the availability of basic amenities as
shown in Table 3.12. All clinics had tap water and a telephone. One clinic did not have
electricity for the duration of the researcher’s visit, although it had a connection. Half
the clinics had a working computer available. Most (81%) clinics had a counselling
room and one-half had a procedure room (56%). Seven (44%) of clinics had an oral
rehydration therapy (ORT) corner.
Table 3.12: Clinic infrastructure and availability of basic amenities
Infrastructure available Number (%)
( n = 16 ) Tap water 16 (100)
Telephone 16 (100)
Electricity 15 (94)
Counselling room 13 (81)
Procedure room 9 (56)
Computer 8 (50)
Oral rehydration therapy
corner
7 (44)
3.3.2 Clinic facilities Clinic facilities (as shown in figure 3.3 below) were graded as poor, less than adequate
or satisfactory by the researcher. While the cleanliness of the clinic grounds, rooms and
linen was not a concern, the state of the public toilets was satisfactory in less than one
fifth of clinics.

57
Figure 3.3: Grading of clinic facilities
0 20 40 60 80 100 120
Clean grounds
Clean staff toilets
Clean public toilets
Seating
Clean rooms
Clean linen
Poor % Less than adequate % Satisfactory %
3.3.3. Equipment The availability of equipment that was deemed to be essential by the researcher is
shown in Table 3.13. Scales, stethoscopes, otoscopes, thermometers and oxygen were
available in all clinics. Equipment availability was satisfactory except for phototherapy
units (3/16[19%]) and clocks in the consulting rooms (1/16[6%]). Essential equipment
such as dextrostix, nebulisers, paediatric resuscitation masks and Laerdel resuscitation
bags should be present at all clinics but were available in 81%, 88%, 81% and 69% of
clinics respectively. Peak flow meters were available in less than two-thirds of clinics.
All equipment appeared to be in working order except for a dysfunctional phototherapy
unit at one clinic.

58
Table 3.13: Equipment available at clinics
Equipment Available No (%) (N = 16)
Adult scale 16 (100)
Baby scale 16 (100)
Oxygen 16 (100)
Clinic stethoscope 16 (100)
Otoscope 16 (100)
Thermometer 16(100)
Heater 15 (94)
Nebulisation 14 (88)
Paediatric resuscitation
mask
13 (81)
Dextrostix 13 (81)
Laerdel resuscitation bag 11 (69)
Height chart 11 (69)
Peak flow meter 10 (63)
Measuring tape 10 (63)
Measuring board 9 (56)
Phototherapy unit 3 (19)
Clock in consulting room 1 (6)
The availability of standard minor stock is shown in table 3.14. The majority of clinics
had syringes, needles and intravenous catheters. Only one clinic had a size 6F and 8F
nasogastric tube. Ten (63%) of the clinics had both a litre container and cups available
for mixing oral rehydration solution (ORS) and thirteen (81%) of clinics had ORS
sachets.

59
Table 3.14: Standard minor stock availability at clinics
Stock Available
Number (%)
(N = 16)
2cc syringe 16 (100)
5cc syringe 16 (100)
Road to Health Card
(RHTC)
13 (81)
10cc syringe 9 (56)
20cc syringe 4 (25)
20G needle 13 (81)
22G needle 10 (63)
23G needle 15 (94)
BCG/25G needle 13 (81)
20G IV catheter 11 (69)
22G IV catheter 10 (63)
24G IV catheter 11 (69)
1 litre container 10 (63)
Cups 10 (63)
Teaspoon/tablespoon 6 (38)
Oral rehydration solution
sachets
13 (81)
6F Nasogastric tube 1 (6)
8F Nasogastric tube 1 (6)
10F Nasogastric tube 0
12F Nasogastric tube 0

60
3.3.4 The refrigerator
The adequacy of the use of the refrigerator was assessed by reviewing the vaccines
stored there, the working of the thermometers and the recording of temperatures, as
shown in table 3.15. Fourteen fridges were assessed as two clinics provided curative
services only and did not need a refrigerator for vaccine storage.
The majority (93%) of clinics had working refrigerators. Vaccines were stored correctly
in eleven (79%) clinics. In the three clinics where the vaccines were stored incorrectly,
the measles vaccine was stored on the incorrect shelf in two clinics and in another clinic
there was no vaccine storage refrigerator and all the vaccines were stored in the bottom
shelf of the staff’s refrigerator, together with food items. Eighty six percent of the
refrigerators had a working thermometer.
The shake test was positive in one clinic for DTP (this indicated that the vial was
damaged and should not be used). There were no expired vaccines stored in any of the
fridges.
Table 3.15: Functioning of the refrigerator and storage of vaccines at clinics
Refrigerator functioning Number (%)
(n = 14)
Working refrigerator 13 (93)
Vaccines stored correctly 11 (79)
Working thermometer 12 (86)
Temperatures recorded daily 13 (93)
Positive shake test 1 (7)
3.3.5 Essential drugs
The availability and stocks of essential drugs are shown in table 3.16.
• Most of the drugs in the table are on the Essential Drug List except for the tine test,
purified protein derivative, sterile water and intravenous fluids.

61
• All clinics had amoxicillin, erythromycin, cotrimoxazole, paracetomol, sterile water
and intravenous fluids.
• All clinics that provided immunisation had measles vaccine available.
• Cloxacillin, nalidixic acid, vitamin A 50 000 IU and intravenous phenobarbitone
were not available at any clinic.
• Ceftriaxone and purified protein derivative (PPD) were available in 44% and 25% of
clinics respectively.
• Most clinics failed to keep records of the drugs that were out of stock.
• Penicillin, amoxicillin, vitamin A 100 000IU and benzyl benzoate were the drugs
that were recorded as being out of stock in the last month preceding the study visit.
Table 3.16: Availability and stocks of essential drugs at clinics
Out of stock in the last month
(N = 16)
Essential drugs Available todayNumber (%)
(N = 16) Yes No NR
Amoxicillin 16 (100) 2 7 7 Penicillin VK 14 (88) 3 5 6 Erythromycin 16 (100) 6 10 Cloxacillin (flucloxacillin) 0 (0) Cotrimoxazole (Bactrim) 16 (100) 6 10 Paracetamol 16 (100) 7 9 Nalidixic acid 0 (0) Oral rehydration solution 15 (94) 7 9 Deworming medication (albendazole/mebendazole)
15 (94) 6 10
Vitamin A 50 000IU 0 (0) Vitamin A 100 000IU 15 (94) 1 8 6 Vitamin A 200 000IU 15 (94) 8 7 Iron Supplements (ferrous gluconate syrup)
10 (63) 3 7
Beta2-agonist (salbutomol 0.5% solution)
14 (88) 14
Prednisone 11 (69) 3 8 Adrenaline 15 (94) 3 12 Diazepam 9 (56) 2 7 Phenobarbitone ( intravenous) 0 (0) Ceftriaxone 7 (44) 6 1 Chloramphenicol 15 (94) 8 8 Tine test 9 (56) + 2 (13)
expired 4 7
Purified protein derivative 4 (25) 2 2

62
Benzyl benzoate 14 (88) 1 5 10 Monosulfiram 13 (81) 6 9 Nystatin 15 (94) 5 10 Sterile water 16 (100) 3 13 Intravenous fluids 16 (100) 1 15 Measles vaccine 14 (88) 10 4 NR = Not recorded
3.4 Review of personnel, in-service activities and training, services
provided by clinics
3.4.1 Clinic Personnel
Doctors:
Half of the clinics (8[50%]) had doctors working in the facility. One “ordinary” clinic
had a full-time doctor and another a sessional doctor and two “ordinary” clinics had
doctors that came once a week. One CHC had a full-time and a sessional doctor, another
had two permanent and two sessional doctors and a third CHC had four doctors but did
not verify as to whether they were full or part time. The clinic with the most number of
doctors was the biggest CHC and had twelve full-time and 4 sessional doctors.
General and Nursing staff:
The numbers of staff at clinics are tabulated in table 3.17. The mean number of
professional nurses in the ordinary PHCs was 4.2, and the mean was 44.5 in the CHCs.
There was a skewed distribution of clerks and general workers in the CHCs as indicated
by the mean and median values because the biggest CHC in Johannesburg had far more
clerks and general workers compared to the other 3 CHCs.

63
Table 3.17: Number of staff at clinics
Min Max Mean Median ‘Ordinary’ PHCs Professional nurses 2 8 4.2 4 Staff nurses 0 2 0.4 0 Enrolled nursing assistants 0 3 0.8 0.5 Community health workers 0 3 0.9 0.5 Clerks 1 2 1.3 1 Voluntary counselors 0 2 0.5 0 General workers 1 4 1.7 1 CHCs Professional nurses 39 48 44.5 45.5 Staff nurses 5 19 11.5 11 ENAS 13 28 19 17.5 Community health workers 0 3 1.5 1.5 Clerks 7 44 17.3 9 Voluntary counsellors (No data = 2 ) 0 6 3 3 General workers 7 60 29.8 26 PHCs = Primary health care clinics
CHCs = Community health centres
The numbers of health workers attending to adults and children are shown in table 3.18.
The mean number of health workers attending to children only in PHCs was 0.7 and 1.5
in CHCs. Half of the clinics did not have a dedicated health worker attending to children
only. A quarter of clinics had a single health worker attending to children only and the
other quarter had two to three health workers attending to children only.
Table 3.18: Health workers attending to adults and children
Min Max Mean Median‘Ordinary’ PHCs Health workers attending to both adults and children
2 8 3.8 3
Health workers attending to adults only 0 1 0.3 0 Health workers attending to children only 0 3 0.7 0 CHCs Health workers attending to both adults and children
10 16 12.3 11.5
Health workers attending to adults only 0 36 22.8 27.5 Health workers attending to children only 0 3 1.5 1.5

64
3.4.2 Training and Support
The mean number of primary health care trained staff was 2.2 in PHCs and 11.8 in
CHCs. Half of the professional nurses were primary health care trained in the PHCs and
a quarter were primary health care trained in the CHCs. The mean number of
professional nurses that were IMCI trained was 1.5 in PHCs and 4 in CHCs, although
IMCI was not practised at all clinics as reflected in table 3.19. Thirteen percent of all
nurses were IMCI trained. Seventy five percent of clinics had IMCI trained nurses.
None of the doctors were IMCI trained.
Table 3.19: Comparison of the level of training and status of staff
Min Max Mean Median
‘Ordinary’ PHCs Staff that were primary health care trained ( No data = 1)
0 5 2.2 2
Professional nurses that were IMCI trained
0 2 1.2 1.5
New staff members that joined in 2004
0 6 1.8 1.5
Staff members that resigned in 2004 0 1 0.4 0 CHCs Staff that were primary health care trained
8 16 11.8 11.5
Professional nurses that were IMCI trained
2 5 3.8 4
New staff members that joined in 2004
0 4 2.3 2.5
Staff members that resigned in 2004 0 5 1.8 1
Guidelines were variably available as shown in table 3.20. Policy guidelines for growth
monitoring and promotion were only available in 13% of clinics.

65
Table 3.20: Availability and accessibility of paediatric protocols and guidelines at
clinics
Guideline Available at clinic
No. (%)
Accessible in consulting rooms
No. (%) National tuberculosis control programme guidelines
15 (94) 15 (94)
SB – Primary clinical care manual 13 (81)
13 (81)
Standard treatment guidelines and EDL lists
13 (81)
13 (81)
Handouts for Vitamin A training and protocol
11 (69)
11 (69)
IMCI chart booklets 10 (63)
10 (63)
Management of HIV infection in children: guidelines for clinics and hospitals
9 (56)
8 (50)
National antiretroviral HIV guidelines 2 (13)
2 (13)
Policy guidelines for growth monitoring and promotion
2 (13)
0 (0)
3.4.3 Posters, videos and flyers and in-service activities
Posters for health professionals were available in 15/16 (94%) of clinics and for the
public in all clinics. Posters for the health professionals included some on vitamin A,
milestones, skin rashes, cotrimoxazole dosages, vaccines and immunisation, IMCI
guidelines and danger signs, meningitis, polio eradication and acute flaccid paralysis.
Posters for the public included those on immunisation, ARVs, HIV/AIDS, meningitis,
child safety, milestones, BCG adverse events, breastfeeding, TB and Patient’s Rights.
Videos were available for health professionals in 4/16(25%) of clinics and for the public
in 6/16(37.5%) of clinics. The videos consisted of topics on TB (2/16) and Lovelife
(1/16) and those videos developed by Mindset were based on HIV/AIDS and TB (3/16).
Flyers were available in 15/16(93.75%) of clinics and were directed to the public. Flyers
consisted of topics on immunisations, oral rehydration solutions, tuberculosis, child
safety, HIV/AIDS, Lovelife, vitamin A and ARTs. Other activities included talks to the
public on immunisation and TB. In-service activities at clinics included campaigns on
RTHCs, immunisations, health awareness, breastfeeding talks and baby-friendly

66
workshops and competitions. Activities elsewhere in the district included immunisations
campaigns and a child safety awareness programme at Gold Reef City.
3.4.4 Services provided
The majority (12/16[75%]) of the clinics were open for 5 days a week. Three clinics
(19%) were open 6 days a week and one clinic (6%) was open twice a week. The
average time that a clinic remained open from Monday to Friday was 525±16 minutes
(8 and 3/4 hours) with a median of 525 minutes. One PHC and two CHCs were open on
Saturdays for 360 minutes (6 hours). Three CHCs provided a 24-hour maternity service.
One CHC provided a 24-hour casualty service and one a casualty service until 22h00
every night. Fourteen clinics (88%) did not have a triage system.
The services provided by clinics varied and are listed in table 3.21. The majority
(14/16[88%]) of clinics provided curative care and immunisation services. Chronic care
services were only provided at one clinic. All clinics provided HIV counselling. The
majority of clinics provided TB DOTS, family planning and community support groups
(94%, 81% and 81% respectively). Antenatal care was provided by one PHC and three
CHCs and midwife obstetric unit services were provided by the three community health
centres except for one CHC that had their midwife obstetric unit located separately in
the Johannesburg Hospital.
Table 3.21: Maternal and child services offered at clinics
DOTS= Directly observed therapy - short course
Service provided Number (%)
HIV counselling 16 (100) TB DOTS 15 (94) Curative care 14 (88) Immunisation 14 (88) Community support groups 13 (81) Family planning 13 (81) Post-natal care 7 (44) AIDS home-based care 6 (38) Rehabilitation 5 (31) Antenatal care 4 (25) Midwife obstetric unit 3 (19) Chronic care (asthma) 1 (6) Mental health 1 (6)

67
Table 3.22 categorises the clinics services by the number of days services were offered
per week. Most clinics provided curative, preventative, TB DOTS, family planning and
HIV counselling services from Monday to Friday; however there was one clinic that did
not provide curative services, two that did not provide family planning and three that
did not provide preventative, TB DOTS and HIV counselling on a daily basis.
Chronic care for asthma was only provided by one clinic from Monday to Friday.
Antenatal and postnatal care was provided Monday to Friday by all four CHCs.
Midwife obstetric unit services were provided daily by three CHCs and the fourth CHC
had their maternity unit at the Johannesburg Hospital. A few clinics provided AIDS
home-based care and community support group services were not provided by two
clinics but the others provided a variable service and certain clinics focused on
diabetics, psychiatry and antiretroviral therapy.
Table 3.22: Clinic services categorised by number of days services offered per week (N
= 16)
No. of days Services provided
0 1 2 4 5 6 7 Weekly /Monthly
Curative care 2 - 1 - 9 2 2 - Immunisations 2 3 - 11 - - - Chronic care (asthma) 15 - - - 1 - - - Mental health 15 1 - - - - - - Rehabilitation 11 1 - - 4 - - - HIV Counselling - 2 1 - 12 1 - - TB DOTS 1 1 1 1 12 - - - Antenatal care 12 - - - 4 - - - Midwife obstetric unit 13 - - - - - 3 - Post-natal care 9 - - - 5 1 1 - Family planning 3 - 2 - 10 1 - - AIDS home-based care 10 - 1 - 4 - 1 - Community support groups 3 3 2 2 6 DOTS = Directly observed therapy – short course

68
3.4.5 Transport
Half of the clinics (8[50%]) organised transport for extremely sick children to the next
referral level by ambulance. A fifth of clinics (3[19%]) transported children either by
ambulance or clinic car or bus and one clinic (6%) used a clinic car or bus. One clinic
used an ambulance in emergency situations. Parents were responsible for organising
their own transport in that clinic if their children were sick and needed to be referred
non-urgently. One clinic used ambulance and other means of transport. Two clinics had
no transport mechanism as they provided well baby services only.
The ambulance was based a minimum of 0 kilometres and a maximum of 20 kilometres
away from the clinic, with a mean of 9.5±6.5 kilometres and a median of 8.0 kilometres.
The minimum distance of 0 kilometres applied to one clinic that kept ambulances on
site. The minimum time for the ambulance to respond to a call to transport a sick child
was estimated by the health workers and clinic managers to range between 10 to 45
minutes with a mean of 24±11 minutes and a median waiting time of 30 minutes. The
maximum time for the ambulance to respond to a call to transport a sick child ranged
between 10 to 180 minutes, with a mean of 59±48 minutes and a median waiting time of
42.5 minutes. The distance to the referral centre ranged between 5 to 25 kilometres,
with a mean of 12±5.6 kilometres and a median of 10 kilometres.
In ‘ordinary’ PHCs, the minimum number of sick children transferred per month was 0
and the maximum number was 103, with a mean of 21.6±38 and median of 7.5. In
CHCs, the minimum number of sick children transferred per month was 10 and the
maximum number was 101, with a mean of 47±47.8 and median of 30. In the majority
(13[81%]) of clinics there was transport available for routine referrals to referral
centres. The transport provided was usually the clinic cars or condors that are based at
the regional head offices. The vast majority of clinics (15[94%]) communicated with
referral centres with a transfer or referral note and only one clinic used the telephone
and a referral note.

69
3.5 Review of clinic registers and record
Records of headcounts and cases of dehydration, pneumonia and malnutrition as well as
vitamin A administration and home visits are listed in table 3.23. Some of the clinics
had zero incidences of some illnesses and malnutrition. It was unclear whether this was
a true reflection of the lack of children presenting with these complaints or merely due
to poor record-keeping.
Table 3.23: Record of patient head counts, new cases of dehydration and pneumonia,
malnutrition, vitamin A and home visits.
Min Max Mean Std Dev Median ‘Ordinary’ PHCs Under five year headcount for last month 113 1694 792 519 835 Over five year headcount for last month 366 4658 2122 1452 1938 New cases of < 5 years old with dehydration seen last month
0 10 1.8 3 0.5
New cases of < 5 years old with no dehydration seen last month
0 24 6 8.5 4
New cases of pneumonia of < 5 years old seen last month
0 37 3 11 0
Children < 5 years old underweight for age last month
0 20 5 7 0
Children < 5 years old not gaining weight last month
0 22 3 7 0
Children < 5 years old severely malnourished
0 24 2 7 0
Infants between 6-11 months of age received vitamin A last month
0 271 63 73 36
Infants between 12-60 months of age received vitamin A last month
0 770 206 235 82.5
How many home visits were done last year
0 31 7 12 0
CHCs Under five year headcount for last month 752 3276 1526 1178 1039 Over five year headcount for last month 9418 16377 12904 2849 12910 New cases of < 5 years old with dehydration seen last month
0 14 5 6 3.5
New cases of < 5 years old with no dehydration seen last month in CHCs
0 30 9 14 2.5
New cases of pneumonia of < 5 years old seen last month in PHCs
0 37 3 11 0
New cases of pneumonia of < 5 years old seen last month
0 22 9 9 7
Children < 5 years old underweight for age last month
0 30 8.5 14 2

70
Children < 5 years old not gaining weight last month
0 4 2 2 1.5
Children < 5 years old severely malnourished
0 3 1 1.5 0
Infants between 6-11 months of age received vitamin A last month
0 106 42 47 31
Infants between 12-60 months of age received vitamin A last month
0 113 57 51 57.5
How many home visits were done last year
0 435 205 180 193

71
CHAPTER 4
DISCUSSION
4.1 Summary of key findings
The quality of child heath services for sick children offered at clinics in Johannesburg
was disappointingly poor. The main areas of concern were the long waiting hours;
poorly skilled staff (e.g. unfocussed consultations; poor history taking and examination
skills, limited identification of children with HIV; over-prescription of antibiotics);
absence of triage and emergency management facilities; and limited practice of child
health promotion activities.
There was inadequate attention to routine health promotion and prevention activities
such as adequate growth monitoring and promotion, immunisation, vitamin A
supplementation and developmental assessment. Food supplementation was mostly
unavailable for children who were failing to thrive.
Issues related to structure should not be entirely ignored as this is an important aspect of
quality of care. In this study basic amenities were available but emergency equipment
such as dextrostix, nebulizations, laerdal bags and resuscitation masks were not
available at all clinics. Not all clinics had ORT corners and EDL drugs were unavailable
at clinics. Essential drug lists and growth monitoring protocols were not available at all
clinics.
The separation of preventative and curative care services still continues.
4.2 Justification for the study
Primary health care has been a major strategy for pursuing health improvement in
developing countries over the past two decades. Assessment of the quality of primary

72
health care services is important because it serves as a litmus test of the effectiveness of
the entire health system.(5) In 2000, South Africa ranked 151 out of 191 WHO member
states on the basis of overall health system goal attainment.(39) This is a sad indictment
of the quality of health care services offered to South Africans considering the country’s
relative wealth and resource availability.
Evaluating the quality of basic health care services available at the community level is a
key concern for any government in developing an equitable, affordable and accessible
health care system.(10) Measuring performance is the first step on the road to improving
it.(40)
The determinants of the quality of care offered by PHC centres include qualifications of
the health workers, in-service training attended, the level of clinical skills of health
workers in the management of childhood illnesses, the quality of scheduled supervision
of health workers, availability of drugs and vaccines, availability of equipment and
utensils for selected childhood services and regularity of services offered.(5;15;39)
Lewis, et al. suggest that staff numbers have little if anything to do with service quality
and drug availability appears to be a determining factor for choosing a facility.(6)
Assessment tools have been developed for both hospitals and clinics in several
countries. These tools include assessments of the infrastructure, drugs, equipment,
human resources, records and observed quality of clinical care for key common
diseases. A useful assessment tool or systematic screening checklist should be simple to
conduct, provide rapid feedback for clinicians, be presented in a form which is usable
by busy clinical staff, prompt innovative suggestions for change and have a component
of evaluation and reassessment.(7) These checklists should be able to identify and
address missed opportunities or unmet child health needs.(41)
The Gauteng Health Department developed a clinic supervisor’s manual in November
2003 to provide a set of flexible, adaptable tools and guidelines to facilitate quality
clinic supervision.(42) The supervisor’s manual was devised to ensure:
a) that resources are in place to ensure technically correct care
b) quality services from the client’s perspective.
The tools assess both qualitative and quantitative aspects of care.

73
The supervisor’s manual evaluation process is, however, quite extensive and laborious
to complete. It does not assess in detail certain essential aspects of the clinical encounter
such as counselling and health promotion. The clinic supervisor’s manual checklist is
also based on Integrated Management of Childhood Illness (IMCI) based assessments.
However, this may be an inappropriate assessment tool as most Johannesburg’s health
workers are not IMCI trained and do not practice IMCI when providing clinical care to
children.
No studies have been conducted in Johannesburg to assess how primary health care
services for children are implemented on the ground. The Data Envelopment Analysis
(DEA) method has been used to assess efficiencies of health facilities and programmes,
mainly in KwaZulu-Natal.(29;39) In 1996, 70% of primary health care clinics in
KwaZulu-Natal province in South Africa were found to be technically inefficient and
84% scale inefficient.(29)
This study attempted to evaluate the structure and process quality perspectives of
Donabedian’s assessment concept of primary health care systems. The study tool
developed for this study is useful because it efficiently evaluates the structure of the
primary health care clinics and the quality of child health services provided by health
workers. It is a quick and user-friendly tool. The tool enables the supervisors or
evaluators to complete a single clinic’s evaluation within a morning visit and covers
various aspects of quality care including structure, equipment, drugs, facilities and
services as well as quality of care provided by health workers.
4.3 Strengths in the delivery of child health services offered
In general, there was little cause for celebration based on the performance of staff and
the service in this study. Certain aspects of the well baby clinical encounter component
were well performed and assessments by health workers were satisfactory. The major
positive finding was health professionals requesting the RTHC during all well baby
encounters. A study performed at a local authority clinic in Khayelitsha, in the Cape
Peninsula in 1993 showed that 95% of preventative clinic patients reported being asked

74
for their RTHC.(26) Ninety nine percent of children at well baby clinics were weighed –
another positive development, although plotting of weights and interpretation was less
satisfactory. Signing of the RTHC and providing follow-up dates was also well done.
4.4 Weaknesses in the clinical components of child health services
There were numerous weaknesses identified in the delivery of child PHC services and
these are discussed below under the following themes:
- Waiting times
- Sick child clinical encounter
- Well baby clinical encounter
- HIV care
- Infrastructure and equipment
- Personnel and training
- Organisation of clinic services
4.4.1 Waiting times
For both the sick baby as well as the well baby clinical encounter component, the
waiting hours were long – an average of around two hours. This is consistent with the
total time for GP (general practitioner) and public models which are around two
hours.(22) A 1993 study in the Khayelitsha CHC, an informal settlement on the
periphery in Cape Town, found median waiting times in both curative and preventative
services were long; 4.1 and 2.6 hours respectively. Patients who arrived earlier tended to
wait longer than those who arrived later. During the afternoons the health centre was
relatively empty and many staff were not working with patients.(24) Long waiting times
is a worldwide problem and issues leading to this need to be addressed in order to
improve quality of care offered. In El Salvador, for example, waiting times varied on
average between 2 and 5 hours for public facilities and one to two hours for NGO
services.(6)

75
An average waiting period of two hours for a well-baby visit is simply unacceptable.
Waiting causes indirect costs to health services, by deterring patients from early use of
inexpensive preventative and curative primary care, leading patients to bypass clinics in
favour of more distant and costly hospitals and requiring building space to house
queues. Queues may seem as inevitable result of scarce resources, but inefficient
organization often contributes. For instance, the paediatric outpatient department at
Chris Hani Baragwanath Hospital in Soweto operates as a level 1, 2 and 3 facility due to
inadequacy of the primary health care facilities in the region. The services offered at
Chris Hani Baragwanath Hospital is inadequate and the patients are dissatisfied due to
long waiting hours, unavailable drugs, unavailable 24-hour level 1 facilities,
inappropriate referrals to Baragwanath and lack of staff at clinics. This is overwhelming
the hospital service.
4.4.2 Sick child clinical encounters:
The sick encounters observed were short. The mean duration for all consultations in this
study was 11.2±6.1 minutes. As confirmed by other studies, paediatric consultations are
generally brief, ranging from 4-11.5 minutes.(15;16;24)
Mills et al., found that in southern African, state-financed services had waiting times
that were higher compared to GPs practising privately and clinic chains that are run by
commercial companies, consultation times that were shorter, and with a poor attitude of
health workers dominating, the standard of treatment offered to patients suffered
correspondingly. Because of no user fees and thus excess demand for services; these
two closely related features had adverse implications for the care offered.(22)
Danger signs (as defined by the IMCI approach) were assessed in a minority of cases in
both the IMCI and non-IMCI consultations in this study. This is not dissimilar to
findings in other settings. No children were checked for the following danger signs
(unable to drink or breastfeed, vomiting all feeds, or convulsions) in Bangladesh prior to
implementing the IMCI strategy.(14) Even though the IMCI strategy was being
implemented in Benin, health workers checked if the child had convulsions in 8% of
encounters. They checked for lethargy or unconsciousness in 98%; for “unable to drink
or breastfeed” in 5% and “vomiting everything” in 4%.(16) In a local study examining
76
the effect of IMCI intervention on the quality of care across the four districts in Cape
Town, the assessment of danger signs was not done well before IMCI. There was a
statistically significant improvement from 7% to 72% (p<0.001) after IMCI
implementation. The most commonly assessed danger sign was ability to drink or
breastfeed and the least commonly asked was the presence of convulsions.(21) Danger
signs are poorly assessed in most developing countries even if staff were IMCI trained.
However; with proper training and a re-emphasis on adopting the IMCI strategy, studies
such as the Cape Town study have confirmed that there can be improvements post-
training.
Certain aspects of examination were poorly or not performed in this study. It is clearly
negligent for staff not to check the respiratory rate in children with respiratory
symptoms, to ignore assessment of skin turgor in 70% of children with diarrhoea or
vomiting, or to fail to assess for a bulging fontanelle or neck stiffness in a child with
suspected meningitis. Other routine activities such as checking for pallor was not done
in 90% of all encounters, administration of ORS ignored in 73% of children requiring
rehydration, and a urinary dipstix not done in 67% of instances where it was warranted.
Whether this situation is the result of a lack of knowledge or training, or if this simply
reflects a “can’t be bothered” attitude was outside the scope of this study. Some solace
can be found, if the study results are compared to health services in other poor
countries. In Benin, health workers never measured a 60 second respiratory rate;
checked for palmar pallor in 4%, skin turgor in 14%, neck stiffness in 12% of child
consultations and never offered a child fluid to assess his/her thirst level. Rating of
clinical skills observed was poor.(5)
Over prescription and abuse of antibiotics in the treatment of acute childhood illnesses
is a worldwide problem, leading to widespread antibiotic resistance.(15) Antibiotics
were prescribed in 46% of encounters and were deemed necessary in two-thirds of
encounters in this study. At primary health centres in Botswana; antibiotics were
inappropriately prescribed in 79% of non-pneumonia cases, while all antibiotics
prescribed in diarrhoea cases were inappropriate.(15) In a district in Bangladesh, over
half of the prescriptions for antibiotics were assessed as being unnecessary in their first
level health facilities.(14) Health workers at facilities in Benin often treated children
unnecessarily and sometimes with dangerous drugs. A large number of medicines were
77
prescribed for some children and health workers did not always explain effectively how
to administer medication.(16)
Emergency management such as insertion of intravenous lines, administration of
oxygen and nebulisation was not performed in all encounters that necessitated these
procedures. The insertion of an intravenous line is a life-saving procedure in a child
with severe dehydration and should be at least attempted in all children in need of this
procedure. According to IMCI guidelines this would be the first option of treatment if
the health worker has these skills and could be followed by nasogastric tube insertion if
intravenous line insertion failed. Oxygen was administered in only 50% of encounters
where it was needed. Oxygen is the most easily and readily available treatment that can
be given in any emergency situation and there should be no reason as to why it was not
administered unless there was no oxygen in the clinic. A quarter of children received
nebulisation. Oxygen, masks and salbutomol or adrenaline are available at clinics and
nebulisations should be administered in all encounters in need of this as airway
obstruction can be easily reversed.
Counselling on the current condition was done satisfactorily in less than a third of
encounters. Counselling on prevention, home management, follow-up and danger signs
were all performed poorly. In Cape Town, counselling given to caregivers remained
poor after IMCI. Only one third of caregivers were informed of at least three signs that
would necessitate immediate return to the clinic. There was some improvement in the
counselling about the sick child’s need for extra fluids and food after IMCI.(21) In
Bangladesh, health providers made little effort to explain the necessary home treatment
or to counsel the caregiver. Only one of 274 caregivers was advised by the health
provider about danger signs indicating the need for immediate return to the health
facility.(14) Health workers in Benin rarely performed counselling tasks recommended
by IMCI. They explained the child’s diagnosis to caregivers in 11% of consultations,
verified comprehension of instructions in 6% of the consultations, and asked caregivers
if they had questions in only 1% of the consultations.(16) Counselling is a poorly
performed aspect of health care worldwide. Counselling needs to be improved as it is a
means of empowering the caregiver, family and community and thus improving child
and maternal well-being.
78
The RTHC was requested in two-thirds (67%) of encounters. This finding is in direct
contrast to that of Bachmann and Barron’s finding at a community health centre in
Khayelitsha, South Africa where 67% of curative service patients reported not having
been asked for a RTHC by a doctor or nurse.(26) Children were weighed in 80% of
encounters and growth of the child was discussed in few (12%) encounters. Comparing
these study results to Benin health facilities, it was noted that 39% of children were
weighed which was worse than the Johannesburg clinics.(16) Arifeen et.al found that in
first-level health facilities in one district of Bangladesh none of the children under-five
had their weight checked against a growth chart. Almost none of the children who were
identified as having very low weight on subsequent re-examination by the surveyors
were assessed for feeding practices by the facility providers.(14)
In this study, clinics failed to offer food supplementation and discuss diet and milk
feeds for optimal growth promotion. Families qualifying for social support grant or
referral were missed. All these aspects of child management have to be discussed and
approached in order to improve the quality of child health services offered.
Other areas of optimal growth promotion such as prescribing of deworming medication
and vitamin A supplementation where necessitated, were neglected. Immunizations
were checked in less than half (46%) of sick child encounters. A WHO-EPI review in
1993 of missed opportunity studies showed that leading causes include separation of
curative and preventative services; health workers ‘not offering, thinking about or
screening for immunizations ’, and clinics scheduling immunization sessions for limited
periods only.(43) In Benin health facilities, health workers often missed opportunities to
vaccinate.(16) The lowest prevalence of missed opportunities of immunisations
internationally have been reported from South Africa’s poorer neighbours, Zimbabwe
(0%) and Mozambique (2-4%); suggesting that a concerted effort, rather than additional
resources, are needed to improve South African services.(26) Immunizations were
missed in 16% and 12% of preventative care visits in 1993 and 1994 at a community
health centre in Khayelitsha, South Africa and in 92% and 91% of curative care visits in
the same clinic in 1993 and 1994.(26) A decade later there has been improvement but
still not adequate to ensure proper health care.

79
Age appropriate milestones were checked in 3% of encounters. Milestones and
development are an important part of a child’s well-being and growth. These areas of
child health and growth should not be neglected in order to ensure a healthy and
growing population. Early detection of poor development and delayed milestones
ensures earlier intervention and prevention of progression of disease and disorders.
Maternal health issues were discussed and addressed in ten percent of encounters. Child
health and maternal well-being are linked and the mother’s health should not be ignored
as their well-being forms an integral part of a family. Mothers form the foundation of
their family’s structure and growth.
4.4.3 Well baby clinical encounters:
Similar aspects of child health were neglected in both sick and well baby encounters.
Areas that need focusing are optimal growth promotion, food supplementation and
referral for child social support grants.
In South Africa, the nutrition transition which includes the co-existence of under-and
over-nutrition, is evident between and within populations and across all ages.(44;45) It
has been recognized that as a result of the prevalence of under-nutrition, micronutrient
deficiencies and emergent over-nutrition, both primary and secondary interventions are
essential.(45;46) In 1999, the National Food Consumption survey (NFCS) on children
aged between 1 and 9 years showed a national prevalence for underweight of 10.3%,
stunting 21.6% and wasting 3.7%.(45;47) The main constraints to the management of
under-nutrition include lack of staff training, inadequate coverage and targeting of
undernourished children, incorrect or no distribution of nutrition supplements and
ineffective counselling of mothers and caregivers. This is evidenced by the findings of
this study wherein the majority (71%) of encounters, the growth of the child was not
discussed with the caregiver and food supplementation was not offered to those children
in need of supplementation.
The Draft Policy Guidelines for Health Facility Based Nutrition Interventions (2001)
states that all children who fail to grow adequately, especially those below the age of
two years should be included on the Nutrition Supplementation Programme (NSP). The

80
NSP distributes food supplements through primary level clinics and has been operation
since the early 1960’s. The Department of Health guidelines state that where nutritional
supplements are available and affordable, they should be given to all HIV positive
children.(48) In 2001, over 90% of the clinics in South Africa did not provide HIV
positive children with nutritional supplements citing unavailability of the porridge or
formula as the main reason for not giving it. It can therefore be assumed that these
clinics were not providing any children both HIV-infected or not with supplements
through the NSP. Irregular supplies of porridge and formula were also a problem for
those clinics that did administer the NSP.(48)
Guidelines and training materials have been developed on growth monitoring and
promotion (GMP) nationally.(45) Growth monitoring and promotion (GMP) includes
the regular measurement and recording of weight, and action needed to improve growth.
Provision of the Road to Health card and training of health workers are essential in
ensuring effective GMP. (45) Studies conducted by Bomela (28) and Schoeman SE et.
al (49) found that PHC nurses missed children in need of nutrition intervention because
of failure to plot weights on the RTHC. Growth monitoring practices need to be
improved and other criteria may be needed to identify children nutritionally at risk.
The results of this study and others have shown that access to social assistance grants is
appalling at primary health care clinics. Social grants are associated with a number of
positive spin-offs for poor households such as greater share of household expenditure on
food and less hunger and more resources to finance education for children.(45) In 2001,
in 79 public sector clinics (21%) in South Africa, clinic staff assisted clients in
accessing a grant and 253 clinics (68%) reported that they referred clients to social
workers for grant applications without providing any form of assistance.(48) These
figures deal with HIV positive children and do not meet standard requirements. The
clinic environment provides an ideal opportunity for sharing information on social
security and clinic staff should be informed of what is available and kept up-to-date on
the latest developments with respect to accessing grants. Grant application forms could
be made available at clinics, as well as information on how to apply for a grant and how
to obtain the necessary documents. Collaborations between the Departments of Health,
Social Development and Home Affairs could go a long way towards improving the take
up of the much needed child support grant.(48)
81
Vitamin A is a micronutrient deficiency of public health significance. High-dose
vitamin A supplementation is being implemented nationally in children aged 6-60
months and in post-partum mothers within 6-8 weeks of delivery. Supplementation
could constitute a cost-effective intervention to decrease the burden of growth
retardation in settings where infectious diseases are highly prevalent.(50) The targets for
vitamin A coverage are 95% for infants and post-partum mothers and 80% for children
aged 1-5 years. The target is to reduce vitamin A deficiency from 33% to 19%. For
children aged 6 to 11 months and 12 to 59 months, vitamin A supplementation coverage
rates nationally were 72.8% and 13.9% respectively.(45) A study conducted in the West
Coast Winelands and Cape Metropole Regions of the Western Cape between April 2003
and October 2004 showed that only 34% of the children that were eligible for vitamin A
supplementation received it, despite the fact that 80% of staff had received training.(45)
Nationally, 35% of the clinics reported that they routinely administer vitamin A to HIV
positive children.(48) The results of this study are not much different to national results
and other studies as vitamin A was checked in 64% of encounters and given to those in
need of a dose. The large percent of patients that were not given vitamin A was
attributable to the fact that none of the clinics had 50,000IU of vitamin A and therefore
children < 6 months did not get their dose of vitamin A.
Monitoring children’s development is of importance but how and when such monitoring
should be performed is not standardized. Developmental screening is the favoured
method for developmental monitoring in many developed countries, including South
Africa.(51;52) Developmental screening is best performed during well baby or
immunization visits to detect disability in apparently healthy children. The tests include
checking for developmental milestones such as sitting, standing, crawling, walking,
talking and handling objects. The child’s vision and hearing ability is also checked.(51)
Developmental screening is not viewed as a priority child health service in South Africa
and supporting guidelines and training materials are lacking. Barriers to implementing
developmental screening include: nurses’ heavy workloads, lack of facilities and human
resources for the management of children with developmental disability, particularly at
primary health care level.(53) The existence of such barriers for developmental
screening is reflected in this study where age appropriate milestones were asked in a
quarter (26%) of encounters and development was not assessed in the majority (86%) of

82
encounters. Few (14%) parents were given advice or counselling on development.
Vision and hearing screening as recommended in the RTHC was not performed in most
instances where required. Development is another area that is poorly assessed by health
workers in both sick and well baby encounters as discussed earlier, and needs much
improvement to ensure good overall quality of care services offered. However,
developmental screening may be viewed as a “luxury” because in provinces in South
Africa where immunization coverage is not adequate, developmental screening may
seem futile and not a priority compared to preventing communicable infectious diseases
and decreasing the rates of co-morbidities. Despite other areas of child health not being
of adequate standard, community and parent awareness of the benefits of developmental
screening, and early identification and intervention is necessary. The benefits of
developmental screening in the country need to be defined. On-going research about the
ability of health professionals to successfully perform this task and identify deficiencies,
referral mechanisms, follow-up and long-term outcomes of children identified with
developmental disability are necessary. (51)
The health workers response to identified risk factors such as teenage pregnancies,
childhood obesity, twin pregnancies and low birth weights were minimal and poor.
A holistic approach to child health care is lacking as demonstrated by the results of this
study.
4.4.4 HIV Care:
Paediatric HIV care has lagged behind that for adults in South Africa. It is estimated
that almost 300 000 children are HIV-infected in the country.(54) South Africa faces
many challenges in implementing the Comprehensive HIV and AIDS, Care,
Management and Treatment Plan. The contributing challenges include lack of
sufficiently trained staff, laboratory capacity, drug procurement and distribution
problems as well as integration of services. In both well and sick child encounters, the
majority of patients (84% and 89% respectively) in the study were not asked about their
HIV status and pre-test counselling was not offered to more than eighty percent of
patients. Health workers need assistance to easily identify exposed children by the
recording of the maternal HIV status on the child’s Road to Health card or the mother’s
antenatal clinic card which should be presented at well baby visits.
83
The South African IMCI guidelines have been adapted to include the diagnosis and
management of HIV infection. Despite the relatively low sensitivity (67%), the current
HIV algorithm is relatively specific (82%), and should provide opportunities for early
identification of children with HIV at PHC level.(51)
Cotrimoxazole prophylaxis for the prevention of Pneumocysitis Jirovecii pneumonia
(PCP) and other commonly acquired infections reduces mortality in HIV-infected
children by as much as 43%.(55) South Africa follows WHO guidelines in advising
cotrimoxazole prophylaxis from 4-6 weeks of age for all HIV-exposed infants,
continuing in those with a definitive diagnosis of HIV until such time as demonstrated
CD4 response has occurred on ART.(35) In 2001, only a third of clinics in South Africa
reported routine administration of cotrimoxazole to HIV-exposed children and the
majority of those providing cotrimoxazole were administering inappropriate doses.(48)
In 2005, 85% of HIV-exposed infants at community health centres in the Cape Town
metropole received cotrimoxazole. There are a few data elsewhere, but anecdotal
reports indicate that this coverage is inadequate with occasional stock-outs of
cotrimoxazole occurring at CHC facilities in Soweto.(54) Cotrimoxazole was not
prescribed in almost a third of both well and sick child encounters which is a persistent
problem and is emphasized in the previous surveys and studies done. Cotrimoxazole
prophylaxis is a cheap and simple method of preventing PCP infection worldwide. HIV-
infected mothers should be educated about the benefits of cotrimoxazole prophylaxis
via the media and during clinic visits and they have the right to demand for this service.
Pharmacy control systems need to be in place to ensure that stock-outs of this essential
drug do not occur and that it is widely available at primary health care levels.
An estimate of at least 40% (110 000 children) of all HIV-infected children in South
Africa require ART. From 2005 till 2006, the number of children receiving
antiretroviral therapy has increased from roughly 3000 to more than 14000.(54) The
need for ARTs (antiretroviral therapy) was not considered in all encounters in this
study. There are many problems associated with paediatric antiretroviral therapy which
include lack of sufficiently trained health care personnel, inadequate facilities,
complexity of treatment recommendations as well as drug regimens and formulations.
Almost half of all children on treatment in Gauteng are receiving ART from tertiary

84
hospitals and only 6% at community health centres. Many facilities lack doctors and
primary health care nurses have not been trained to manage HIV-infected patients on
ART.(54) In primary health care settings, services are generally delivered independently
of each other. HIV-related services are independent from the immunisation, IMCI and
tuberculosis programmes, resulting in missed opportunities. There needs to be
nationally standardised training programmes in paediatric ART and guidelines for the
management of HIV-infected children should be readily available.
Although all clinics provide HIV voluntary counselling and testing, the majority of
patients are not offered these services. This is appalling especially with the current HIV
epidemic in Africa. AIDS home-based care was a service that was provided by four
clinics from Monday to Friday and by one clinic twice a week. Furthermore only half
(56%) the clinics had guidelines for the management of HIV infection in children and
two percent had national antiretroviral HIV guidelines in their clinics. In 2001, eighty
percent of the clinic managers in South Africa who were interviewed had no knowledge
of the Department of Health guidelines and about 10% of clinics sampled reported using
the Department of Health guidelines.(48) This clearly indicates that this is an on-going
problem. Not only are areas in the management of the HIV illness being neglected but
the services offered need to be more efficient and accessible to prevent and control the
spread of this deadly disease. The normalization of HIV, particularly HIV testing,
within the health sector is appropriate and necessary, especially since ART has become
available.(56) Emphasis should shift away from a doctor-based to a nurse-based service
with clinically trained primary health care nurses becoming the key personnel to
prescribe treatment to stable patients on ART.(54) HIV prevention and care for all
children must be addressed appropriately and measures should be put in place in both
primary and secondary settings to track outcomes.
4.4.5 Infrastructure and equipment:
The low utilisation of government health facilities has been attributed to the lack of
proper facilities, which in turn limits the utilisation of the resources available, such as
the staff.(57) Availability of physical infrastructure is crucial for the staff to perform
better. In terms of infrastructure; tap water, telephone and electricity were available in
94-100% of the clinics evaluated. These findings were consistent with the Health

85
Systems Trust evaluation of the quality of service provision at primary level between
provinces in South Africa; where Gauteng and Western Cape’s means of emergency
communication via telephone was always working and almost all (98%) urban clinics
visited had taps within the clinic premises which were always functioning.(58) Despite
the availability of telephonic communication, primary health care facilities uniformly
failed to utilise this facility (and therefore missed an opportunity to minimise
unnecessary referrals to tertiary centres such as Baragwanath Hospital). Only one clinic
in this study used the telephone together with a referral note to transfer patients.
Johannesburg primary health care clinics had superior facilities to Benin health centres
where only 60% of clinics had running water, 45% had electricity and 44% had a scale
for weighing infants and a scale for older children.(16)
The majority of clinics in our study were adequately equipped and well stocked with
drugs. Almost all (15/16) clinics had working refrigerators and vaccines were stored
correctly in most (79%) clinics. Essential emergency equipment such as dextrostix,
nebulisation, paediatrics’ resuscitation masks and laerdal bags were not present at all
clinics. Only one clinic had nasogastric tubes and not all clinics had ORT corners and
facilities for mixing rehydration solution. Emergencies are poorly managed at clinics
and patients are sent in a critical condition to tertiary hospitals which could have been
avoided by proper emergency primary care treatment. All facilities should have an oral
rehydration therapy (ORT) corner and nasogastric tubes (NGTs) to rehydrate orally as
diarrhoea is a leading cause of infant mortality in developing countries and is
preventable.
In a survey conducted by the Health Systems Trust in 1997; 96% of urban clinics in
South Africa had antibiotics; 98% of urban clinics had vaccines and 65% of urban
clinics had oxygen. All of Gauteng’s urban clinics had all of these supplies
available.(58) Almost all (99%) clinics visited had baby weighing scales which were in
good working order and in Gauteng 100% of clinics had functional refrigerators.(58)
There are variations in the availability of supplies of equipment and drugs and
functioning of refrigerators between developing countries. All the community health
centres in rural Vietnam had 100% supplies of newborn scales, stethoscopes,
thermometers, adult scale, otorhinolaryngological sets, telephones and disposable
plastic syringes.(10) Primary health care facilities in South-east Nigeria, had fairly

86
adequate supplies of equipment and drugs and 60% of clinics had functioning
freezers/fridges.(5) Facilities in one district of Bangladesh were not well equipped and
supported.(14) In Kyrgyzstan, all 19 health facilities except for one with a broken
refrigerator, had well-maintained and well-organised refrigerators with current
temperature logs.(59) In Benin, all IMCI recommended drugs except vitamin A were in
stock at most facilities but only 60% of clinics had vaccines in stock.(16) The Health
Systems Trust survey and the results of this study prove that South Africa does have
better supplies and facilities compared to other developing countries. but more drastic
improvements need to be implemented with regard to quality of care rather than
focusing on structure and quantity of care.(21)
Primary clinical care manuals, essential drug lists, IMCI chart booklets, HIV guidelines,
vitamin A protocols and tuberculosis guidelines were available in half of the clinics
evaluated. In this study, only two health workers referred to the IMCI chart booklet
during consultations. There was no copy of standing orders in the consulting room of
any of the 10 health facilities assessed in South-east Nigeria and no health worker made
reference to the national case management algorithm.(5)
In this study, posters for health professionals were available in the majority (94%) of
clinics and for the public in all clinics. Flyers that were directed toward the public’s
health and well-being were available in the majority (94%) of clinics.
The majority (75%) of clinics that were evaluated in this study were open for 5 days a
week and most provided curative and immunization services, TB DOTS, family
planning and community support groups. All clinics provided HIV counselling services.
Similarly, in south-east Nigeria, seventy five percent of clinic services were available
regularly.(5) The Health Systems Trust survey showed that only 48% of all the clinics
visited offer immunizations services on a daily basis.(58) In this study, eighty one
percent of clinics provided immunization services 5 days per week. This lack of daily
immunization services still occurs despite the move towards integration of services,
particularly at clinic level. The separation of curative and preventative services still
persists as two clinics provided only curative services and two only provided
preventative services.

87
4.4.6 Personnel and training:
Half of the clinics did not have doctors working in the facility and none of the doctors
were IMCI trained. However in the sick baby encounters, fifty seven percent of
professional nurses were IMCI trained and in the well encounters forty four percent
were IMCI trained. Despite professional nurses having IMCI training, only two clinics
and three sisters in the study practiced IMCI. The majority (83%) of health workers
attending to sick babies had undergone primary health care training and this was the
preferred method of consultation. The IMCI strategy cannot be ignored, even by
primary health care trained nurses, as it provides a holistic approach to child care and
treatment.
4.4.7 Organisation of clinic services:
Triage:
The majority (88%) of clinics did not have a triage system. A triage policy needs to be
in place at all health facilities to identify children requiring high priority treatment.(7)
Morbidity and mortality can be prevented by continuous monitoring of high risk
patients entering clinics and health centres.
Transport:
Half of the clinics (50%) organized to transport extremely sick children by ambulance.
Seventy four percent of urban clinics in the Health Systems Trust survey had an
ambulance at their doorstep within an hour of an emergency call.(58) In this study, the
reported time taken for an ambulance to respond was between 10 to 180 minutes and the
mean time was 59±48mins with a median of 42.5 minutes. No studies have been done to
determine the time taken for ambulances to respond to emergency calls from clinics.
The time taken for an ambulance to respond would not be truly reflected as most of the
house calls are inappropriately lodged by the community who are poverty stricken and
have no means of transport to clinics or hospitals and therefore abuse the services
provided and are unnecessarily taken to a tertiary setting rather than to the clinics.
88
4.5 Limitations of the study
The study had a number of limitations that are outlined below.
Study design:
1. Due to restricted resources and time constraints, the sample size had to be limited. A
larger study sample would have been preferable to improve generalisability.
2. Clinics that assessed 40 or more patients per day were included in the study and
smaller clinics were thus excluded. This was a pragmatic measure, to reduce the
number of visits needed to clinics and maximise the number of consultations
observed.
3. The study design focussed on structure and process rather than on outcome
measures.
4. Staff morale and attitudes, which are key determinants of the quality of child health
services, were not assessed in this study.
Positive bias:
5. Clinics were informed, prior to the visit, about the evaluations and may have
updated record keeping and improved stocks and supplies and ensured that
equipment was repaired or working.
6. Observed performance may not be “routine” performance as health workers may
have modified their behaviour while being observed. During consultation there was
only minimal interference by the researcher. Only in cases where clinical
management posed a serious threat to the health of the child, was information given
to the consulting health worker before the child left the health facility. This, together
with observer bias, may have resulted in overestimation of adherence to
management guidelines.
Negative bias:
7. As most consultations were conducted in a local language (not English), the
interpretation by the researcher of the quality of counselling and advice may have
been suboptimal.

89
8. The researcher, being a specialist paediatrician, may have been biased in terms of
evaluating the assessment and treatment. However, this was minimised by using
standard guidelines as the standard for evaluation.
9. In the sick baby clinical encounters, the clinical illnesses that the children were
assessed as having by the health workers were not recorded and included in the
checklist (i.e. appendix A).
10. In the well baby clinical encounters, the checklist did not make provision for
whether immunisations were given when indicated or whether there were missed
opportunities for immunisations (appendix B).

90
CHAPTER 5
CONCLUSION
South Africa’s health care system is still facing numerous threats despite advances made
in the post-apartheid era with implementation of a National Health Plan in 1994.
The adoption of the elements of the Alma-Atta conference in 1978 and the Batho Pele
principles has not adequately served to improve the quality of primary health care
services offered in South Africa.
This study emphasizes that the quality of child heath services offered at clinics in
Johannesburg needs revising and the standard of care offered needs improvement with
more focus on issues relating to process rather than structure.
Emphasis needs to be placed on health worker training and appropriate use of standard
case management guidelines. The researcher-structured tool or checklist utilized in this
study can be reconstructed and implemented into a scoring system for systematic
supervision and evaluation of child health services offered at clinics.
General recommendations
A focused attention to establishing norms and standards for the delivery of child
health care services in the City is required. The impression obtained by this study
is of a range of activities occurring at clinics that are dependent on the
idiosyncrasies of individual clinics (e.g. staffing, enthusiasm, management style)
rather than on a well-structured health service. Each child health worker needs to
have clear expectations of what is required at any individual clinical consultation
This will also enable greater accountability for the (lack of) delivery of adequate
services to children.
A consensus on the structure and mechanisms whereby child care will be
provided by the City needs to be established to address issues such as:
• Should children have separate queues from adults?

91
• Should a dedicated staff member (with basic paediatric skills) care for children
whenever possible (at least in larger clinics and CHCs)?
• What are the basic paediatric skills required by health professionals caring for
children at the PHC level?
• Is the IMCI approach the preferred strategy for clinical consultations?
• Should promotive and sick care services be combined?
• Standardised recording of clinical information (use of RTHC, standardised
consultation sheets [e.g. IMCI sheet], out-patient cards, etc)
• Standardised referral mechanisms (communication, forms, transport
mechanisms)
• Standard equipment needed at every child health service (including emergency
equipment)
• Better supervision and routine, regular evaluation of child health services is
needed. We would favour the awarding of a “child friendly service” score to
every clinic on a 6-monthly basis, based on an easy-to-perform scoring system
(which could be developed by the researchers). Clinics scoring poorly would be
offered incentives, while those scoring highly would be offered rewards.
92
Detailed Recommendations for the clinics
1. Dedicated nursing assistant to weigh all children and to take a temperature prior
to being seen by the health worker.
2. Public health promoters to focus on health care promotion and education
through “health talks” mostly on hygiene and health education which can be
done whilst patients wait in queues to be seen.
3. A screening or triage system must be adopted whilst patients are waiting in
queues, for early detection of critically ill children.
4. Designated child health sessions such as immunisations must be extended from
2-3 days to 5 days per week and this will contribute to a decrease in waiting
time. One clinic provided curative care services twice a week and the rest
provided this service for more than 5 days per week. Preventative services were
provided for two days at three clinics and the rest provided this service for five
days a week.
5. Single queue for paediatric patients and to combine both curative and
preventative baby services
6. Services could be staggered during the day. Curative services throughout the day
and preventative services in the afternoons when clinics are quiet.
7. Children should be attended by a dedicated health worker who is ideally
specifically skilled in paediatrics. Less rotation of staff would help.
8. Staff tea and lunch breaks must be staggered so as to maintain patient flow.
9. Advice and difficulties in assessment and management should be discussed
telephonically with hospitals centres prior to referral. Only one clinic
communicated via the telephone.
10. Introduction and improvement of the IMCI strategy. Strict adherence to the chart
booklet is recommended so that aspects of the clinical examination as well as
danger signs, and preventative measures such as immunizations, vitamin A,
deworming and HIV are not missed.
After IMCI is implemented, health workers thereafter need continuous support
even after training. Health workers also need to focus on communities by
improving the caregivers understanding and acceptance of IMCI goals so that
there is optimism about public health improvements with the use of IMCI.

93
11. Some aspects of treatment and management need greater focus or attention such
as HIV diagnosis and management, food supplementation, counselling and
developmental assessments. VCT must be offered to all patients, food
supplementation and growth promotion needs further focus and training.
Reassurance and encouragement to mothers is required both in the well and sick
children.
12. More active role needs to be played in emergency situations. Attempting of
intravenous line insertion, where appropriate, should be encouraged.
13. Ensure that there is emergency equipment such as dextrostix, nebulisation,
paediatric resuscitation masks, laerdal bags and nasogastric tubes present at all
clinics.
14. Mandatory to establish ORT corners for oral rehydration.
15. Drugs such as cloxacillin, nalidixic acid, phenobarbitone and vitamin A should
be stocked at clinics.
16. Vaccines must be stored correctly and refrigerators must always be working.
17. EDLS, IMCI chart booklets, primary clinical care manuals and growth
monitoring guidelines together with food supplementation should be available
for reference and dispensing at all clinics.
18. Clinic toilets should be kept clean at all times and adequate seating must be
provided for patients.

94
Specific Recommendations for health authorities
1. Integration of curative and preventative child health services could reduce
inefficiencies in child health care whilst increasing appropriateness of care and
provide more accessible holistic care.
2. Conducting regular assessments: quality of care needs to be assessed repeatedly
over time in a comprehensive manner using the same assessment tool at regular
intervals. These assessments should include appraisal of infrastructure and
equipment; assessments of staffing levels; structured interviews with staff and
patients to elicit their opinions and knowledge; observation of consultations
assessing technical as well as interpersonal skills of health workers and record
reviews on tracer conditions.
3. Improving structural aspects in terms of the physical condition of buildings and
availability of equipment, drugs and proper sanitation.
4. Improving organizational aspects such as number of staff and qualifications as
well as improving managerial and administrative procedures.
5. Improving technical level and qualifications of health workers by:
a) Regular refresher courses or in-service training
Frequent training is the single biggest productivity booster and incentive among
promoters. Promoters state that “training empowers us to perform better and to
follow our commitment to the community.” (6)
b) Frequent quality supervision
Facilitative supervision is defined as ensuring that providers in peripheral
primary health facilities follow appropriate guidelines, continuously seek to
improve their performance, overcome operational barriers and maintain their
motivation. (33).
Supervisors must be provided the resources and support they need to supervise
effectively such as access to official vehicles, travel allowances, essential
supplies and guidelines.
Many supervisors act as inspectors rather than as facilitators, educators and
problem solvers. There must be a good relationship between supervisor and
providers for effective supervision. More time is generally spent on facility level

95
issues rather than on service quality and patient care issues. This needs to be
changed to ensure quality assurance and patient satisfaction.
The researcher-developed checklist utilized in this study can be implemented as
a tool for systematic supervision of child health services offered at clinics.
Incentives to motivate good performance by promotion and career
development will assist
Greater accountability to supervisors is warranted
6. Programme planners and health policy makers can utilize the researcher-
developed structured checklist from this study as well as the recommendations
mentioned above to undertake a major review of the quality of child health care
offered at primary health care clinics in Johannesburg and South Africa.
7. Emphasis needs to be placed on health worker training and appropriate use of
standard case management guidelines.
96
CHAPTER 6
Reference List
(1) Goldstein S, Price M. Utilisation of primary curative services in Diepkloof, Soweto. S Afr Med J 1995 Jun;85(6):505-8.
(2) Netshandama VO, Nemathaga L, Shai-Mahoko SN. Experiences of primary health care nurses regarding the provision of free health care services in the northern region of the Limpopo Province. Curationis 2005 Feb;28(1):59-68.
(3) World Health Organisation. Alma-Ata 1978: Primary Health Care. Geneva: World Health Organisaton; 1978.
(4) Health Systems Development: Primary Care. Available from: URL: http://www.worldbank.org/hsd
(5) Ehiri JE, Oyo-Ita AE, Anyanwu EC, Meremikwu MM, Ikpeme MB. Quality of child health services in primary health care facilities in south-east Nigeria. Child Care Health Dev 2005 Mar;31(2):181-91.
(6) Lewis M, Eskeland G, Traa-Valerezo X. Primary health care in practice: is it effective? Health Policy 2004 Dec;70(3):303-25.
(7) Duke T, Bailey R, Weber MW. Improving the quality of care for children. Indian Pediatr 2002 Jun;39(6):523-8.
(8) Schopper D. Quality of care in resource-constrained settings. Swiss Centre for International Health: Swiss Agency for Development and Co-operation(SDC). Document No. t.751-14 SKM/REM; 2002 May.
(9) Catacutan AR. The health service coverage of quality-certified primary health care units in Metro-Manila, the Philippines. Health Policy Plan 2006 Jan 1;21(1):65-74.
(10) Tuan T, Dung VT, Neu I, Dibley MJ. Comparative quality of private and public health services in rural Vietnam. Health Policy Plan 2005 Sep;20(5):319-27.
(11) Brugha R, Zwi A. Improving the quality of private sector delivery of public health services: challenges and strategies. Health Policy Plan 1998 Jun;13(2):107-20.
(12) Mills A, Brugha R, Hanson K, McPake B. What can be done about the private health sector in low-income countries? Bull World Health Organ 2002;80(4):325-30.
(13) Gouws E, Bryce J, Pariyo G, Armstrong SJ, Amaral J, Habicht JP. Measuring the quality of child health care at first-level facilities. Soc Sci Med 2005 Aug;61(3):613-25.

97
(14) Arifeen SE, Bryce J, Gouws E, Baqui AH, Black RE, Hoque DM, et al. Quality of care for under-fives in first-level health facilities in one district of Bangladesh. Bull World Health Organ 2005 Apr;83(4):260-7.
(15) Boonstra E, Lindbaek M, Ngome E. Adherence to management guidelines in acute respiratory infections and diarrhoea in children under 5 years old in primary health care in Botswana. Int J Qual Health Care 2005 Jun 1;17(3):221-7.
(16) Rowe AK, Onikpo F, Lama M, Cokou F, Deming MS. Management of childhood illness at health facilities in Benin: problems and their causes. Am J Public Health 2001 Oct;91(10):1625-35.
(17) Oluwole D, Mason E, Costello A. Management of childhood illness in Africa. Early evaluations show promising results. BMJ 2000 Mar 4;320(7235):594-5.
(18) Black RE, Morris SS, Bryce J. Where and why are 10 million children dying every year? Lancet 2003 Jun 28;361(9376):2226-34.
(19) Smits HL, Leatherman S, Berwick DM. Quality improvement in the developing world. Int J Qual Health Care 2002 Dec;14(6):439-40.
(20) World Health Organisation. The Multi-country Evaluation of IMCI Effectiveness, Cost and Impact (MCE): Progress report, May 2002-April 2003. Geneva: World Health Organisation; 2003.
(21) Chopra M, Patel S, Cloete K, Sanders D, Peterson S. Effect of an IMCI intervention on quality of care across four districts in Cape Town, South Africa. Arch Dis Child 2005 Apr;90(4):397-401.
(22) Mills A, Palmer N, Gilson L, McIntyre D, Schneider H, Sinanovic E, et al. The performance of different models of primary care provision in Southern Africa. Soc Sci Med 2004 Sep;59(5):931-43.
(23) Wilkinson D, Gouws E, Sach M, Karim SS. Effect of removing user fees on attendance for curative and preventive primary health care services in rural South Africa. Bull World Health Organ 2001;79(7):665-71.
(24) Bachmann MO, Barron P. Why wait so long for child care? An analysis of waits, queues and work in a South African urban health centre. Trop Doct 1997 Jan;27(1):34-8.
(25) Rispel L, Price M, Cabral J. Confronting need and affordability: guidelines for primary health care services in South Africa. Johannesburg: CHP, Department of Community Health, University of Witwatersrand; 1996.
(26) Bachmann MO, Barron P. Missed opportunities for immunisation in curative and preventive services in a community health centre. A follow-up survey. S Afr Med J 1996 Aug;86(8):947-9.

98
(27) London L, Bachmann OM. Paediatric utilisation of a teaching hospital and a community health centre. Predictors of level of care used by children from Khayelitsha, Cape Town. S Afr Med J 1997 Jan;87(1):31-6.
(28) Bomela HN. Evaluation of the use of growth monitoring as a tool for nutritional intervention for children less than 5 years of age: MMed dissertation 2003.
(29) Kirigia JM, Sambo LG, Scheel H. Technical efficiency of public clinics in Kwazulu-Natal Province of South Africa. East Afr Med J 2001 Mar;78(3 Suppl):S1-13.
(30) Baltussen RM, Ye Y, Haddad S, Sauerborn RS. Perceived quality of care of primary health care services in Burkina Faso. Health Policy Plan 2002 Mar;17(1):42-8.
(31) Mendoza AJ, Piechulek H, al-Sabir A. Client satisfaction and quality of health care in rural Bangladesh. Bull World Health Organ 2001;79(6):512-7.
(32) Habicht JP, Victora CG, Vaughan JP. Evaluation designs for adequacy, plausibility and probability of public health programme performance and impact. Int J Epidemiol 1999 Feb;28(1):10-8.
(33) Health. Available from:URL: http://www.joburg.org.za/services/health1.stm
(34) Standard Treatment Guidelines and Essential Drugs List. Pretoria, South Africa: The National Department of Health; 2003.
(35) Department of Health. Guidelines for the management of HIV-infected children. Pretoria: Department of Health; 2005.
(36) Child Health Policy Institute. Workshop on screening for development disabilities in the pre-school population: Discussion document. Cape Town: Child Health Unit; 1996.
(37) Volume 1 - Why Two eyes? Available from: URL: http://telemedicine.orbis org/bins/volume_page.asp?cid=1-3-4-15
(38) Prescott CAJ, Omoding SS, Fermor J, Ogilvy D. An evaluation of the `voice test' as a method for assessing hearing in children with particular reference to the situation in developing countries. International Journal of Pediatric Otorhinolaryngology 1999 Dec 15;51(3):165-70.
(39) Renner A, Kirigia JM, Zere EA, Barry SP, Kirigia DG, Kamara C, et al. Technical efficiency of peripheral health units in Pujehun district of Sierra Leone: a DEA application. BMC Health Serv Res 2005 Dec 14;5:77.
(40) Tavrow P, Kim YM, Malianga L. Measuring the quality of supervisor-provider interactions in health care facilities in Zimbabwe. Int J Qual Health Care 2002 Dec;14 Suppl 1:57-66.
(41) Khatan J, Roy N, Azim T. Unmet reproductive and child-health needs and use of essential services package in urban NGO clinics of Bangladesh. ICDDR,B:

99
Centre for Health and Population Research; 2003. Report No.: ICDDR,B Working Paper No. 156.
(42) Gauteng Health Department. Clinic supervisors manual. Gauteng Health Department; 2003.
(43) Hutchins SS, Jansen HA, Robertson SE, Evans P, Kim-Farley RJ. Studies of missed opportunities for immunization in developing and industrialized countries. Bull World Health Organ 1993;71(5):549-60.
(44) Bourne LT, Langenhoven ML, Steyn K, Jooste PL, Laubscher JA, Bourne DE. Nutritional status of 3-6 year-old African children in the Cape Peninsula. East Afr Med J 1994 Nov;71(11):695-702.
(45) Hendricks M, Eley B, Bourne L. Child Nutrition. South African Health Review 2006. Health Systems Trust; 2006.
(46) Labadarios D, Steyn NP, Mgijima C, Daldla N. Review of the South African nutrition policy 1994-2002 and targets for 2007: achievements and challenges. Nutrition 2005 Jan;21(1):100-8.
(47) Labadarios D, Steyn NP, Maunder E, MacIntryre U, Gericke G, Swart R, et al. The National Food Consumption Survey (NFCS): South Africa, 1999. Public Health Nutr 2005 Aug;8(5):533-43.
(48) Giese S, Hussey G. Rapid appraisal of primary health care services for HIV-positive children at public sector clinics in South Africa. University of Cape Town: Children's Institute and Child Health Unit; 2002.
(49) Schoeman SE, Hendricks MK, Hattingh SP, Benade AJ, Laubscher JA, Dhansay MA. The targeting of nutritionally at-risk children attending a primary health care facility in the Western Cape Province of South Africa. Public Health Nutr 2006 Dec;9(8):1007-12.
(50) Villamor E, Mbise R, Spiegelman D, Hertzmark E, Fataki M, Peterson KE, et al. Vitamin A supplements ameliorate the adverse effect of HIV-1, malaria, and diarrheal infections on child growth. Pediatrics 2002 Jan;109(1):E6.
(51) Saloojee H, Bamford L. Key childhood health promotion and disease prevention programmes. South African Health Review 2006. Health Systems Trust; 2006.
(52) Children's Institute UCT. Evaluation of the Western Cape Province Screening Programme for Developmental Disabilities in pre-school children: Full research report. Cape Town: Children's Institute, University of Cape Town; 2003.
(53) Bartlett SN. The problem of children's injuries in low-income countries: a review. Health Policy Plan 2002 Mar 1;17(1):1-13.
(54) Meyers T, Moultrie H, Sherman G, Cotton M, Eley B. Management of HIV-infected children. South African Health Review 2006. Health Systems Trust; 2006.

100
(55) Chintu C, Bhat GJ, Walker AS, Mulenga V, Sinyinza F, Lishimpi K, et al. Co-trimoxazole as prophylaxis against opportunistic infections in HIV-infected Zambian children (CHAP): a double-blind randomised placebo-controlled trial. Lancet 2004 Nov;364(9448):1865-71.
(56) Cameron E. Normalising Testing- Normalising AIDS. 2006.
(57) Varatharajan D, Thankappan R, Jayapalan S. Assessing the performance of primary health centres under decentralized government in Kerala, India. Health Policy Plan 2004 Jan;19(1):41-51.
(58) Buthelezi G, Barron P, Makhanya N, Edwards-Miller J. Measuring the move towards equity from the site of delivery- Results from the Nine Provinces. Health Systems Trust; 1997 Nov.
(59) Weeks RM, Svetlana F, Noorgoul S, Valentina G. Improving the monitoring of immunization services in Kyrgyzstan. Health Policy Plan 2000 Sep;15(3):279-86.